Article

UV-Driven Harmonic Generation for Time-Resolved Photoelectron Spectroscopy of Polyatomic Molecules

Department of Chemistry, Graduate School of Science, Kyoto University, Kitashirakawa Oiwakecho, Sakyo-ku, Kyoto 606-8502, Japan
*
Author to whom correspondence should be addressed.
Appl. Sci. 2018, 8(10), 1784; https://doi.org/10.3390/app8101784
Submission received: 12 September 2018 / Revised: 28 September 2018 / Accepted: 28 September 2018 / Published: 1 October 2018

Abstract

:
A single-order harmonic pulse in the vacuum-ultraviolet (VUV) is highly desirable for time-resolved photoelectron spectroscopy (TRPES) of polyatomic molecules. A high-power 9th harmonic of a Ti:sapphire laser (hv = 14 eV) is obtained using a UV driving laser at 270 nm (the 3rd harmonic). We describe our recent efforts to develop VUV TRPES combined with UV-driven harmonic generation, and present a few representative results from our recent TRPES studies.

1. Introduction

Time-resolved photoelectron spectroscopy (TRPES) has become a powerful tool for studying the photo-induced reaction dynamics of polyatomic molecules [1]. In TRPES, a pump pulse excites a molecule, triggering a photochemical/photophysical process, and a delayed probe pulse interrogates the dynamics of that process through photoionization. To follow the ultrafast dynamics to the final end product, a high probe photon energy exceeding the electron binding energies (eBEs) of these products is required. Most organic molecules have an eBE of about 10 eV, so detection of internal conversion to the ground electronic state requires vacuum-UV (VUV) pulses. High-harmonic generation (HHG) using an intense 800-nm Ti:sapphire driving laser is a well-established technique to generate VUV pulses [2] and has been employed for photoionization [3]. However, the HHG spectrum consists of numerous harmonic orders that are separated by only 3.1 eV, which causes overlap of photoelectron spectra originating from photoionization by different harmonic orders. To solve this problem, a time-compensated monochromator [4] is typically used to isolate a single-order harmonic from the comb-like HHG spectrum. As an alternative, we have proposed a simple scheme to obtain a high-power single-order harmonic at 90 nm (the 9th harmonic of a Ti:sapphire laser, hv = 14 eV) using a UV driving laser at 270 nm (the 3rd harmonic) [5]. A short-wavelength driving laser yields a much higher conversion efficiency in the VUV region [6], and a single-order harmonic can be isolated from other (i.e., higher-order) harmonics easily, because of the greater free spectral range (>9 eV) of the resulting harmonic comb [5].
Figure 1 shows a schematic energy diagram of TRPES, which measures photoelectron kinetic energy (PKE) as a function of the pump-probe delay time. Here, eBE is the energy required to remove an electron from a molecule, and is given by the difference between the probe photon energy and the measured PKE. The wave packet prepared in the Franck–Condon (FC) region of the excited state starts moving in the direction of descending potential energy (Arrow A in Figure 1), which generally increases the eBE (see Figure 1) [7,8,9]. (Rigorously speaking, eBE is given by the difference between the lower (i.e., neutral) and upper (i.e., cationic) state potential energies, and it varies with the transient molecular structure in a complex manner.) When the wave packet reaches the conical intersection (CI) region, it transitions to the ground state of the product (Arrow B in Figure 1) or the reactant (Arrow B’), and eBE further increases (typically to around 10 eV) in either case. In the past two decades, probe pulses in the deep-UV (DUV, hv ≲ 6 eV) have been commonly employed for TRPES. Though DUV TRPES studies have succeeded in elucidating a variety of photo-induced dynamics [10], CIs and products with eBE higher than 6 eV have been outside of the observation window when using DUV probe pulses (Figure 1).
We have developed VUV TRPES combined with UV-driven harmonic generation, and have reported a number of TRPES results recently [11,12,13,14,15,16,17]. Our paper is organized as follows: In Section 2, we describe the experimental details of the UV driving laser, the generation and isolation of the 9th harmonic, and the TRPES apparatus. Next, we present a few representative results taken from our recent TRPES studies in Section 3. Finally, we draw conclusions in Section 4.

2. Experimental Setup

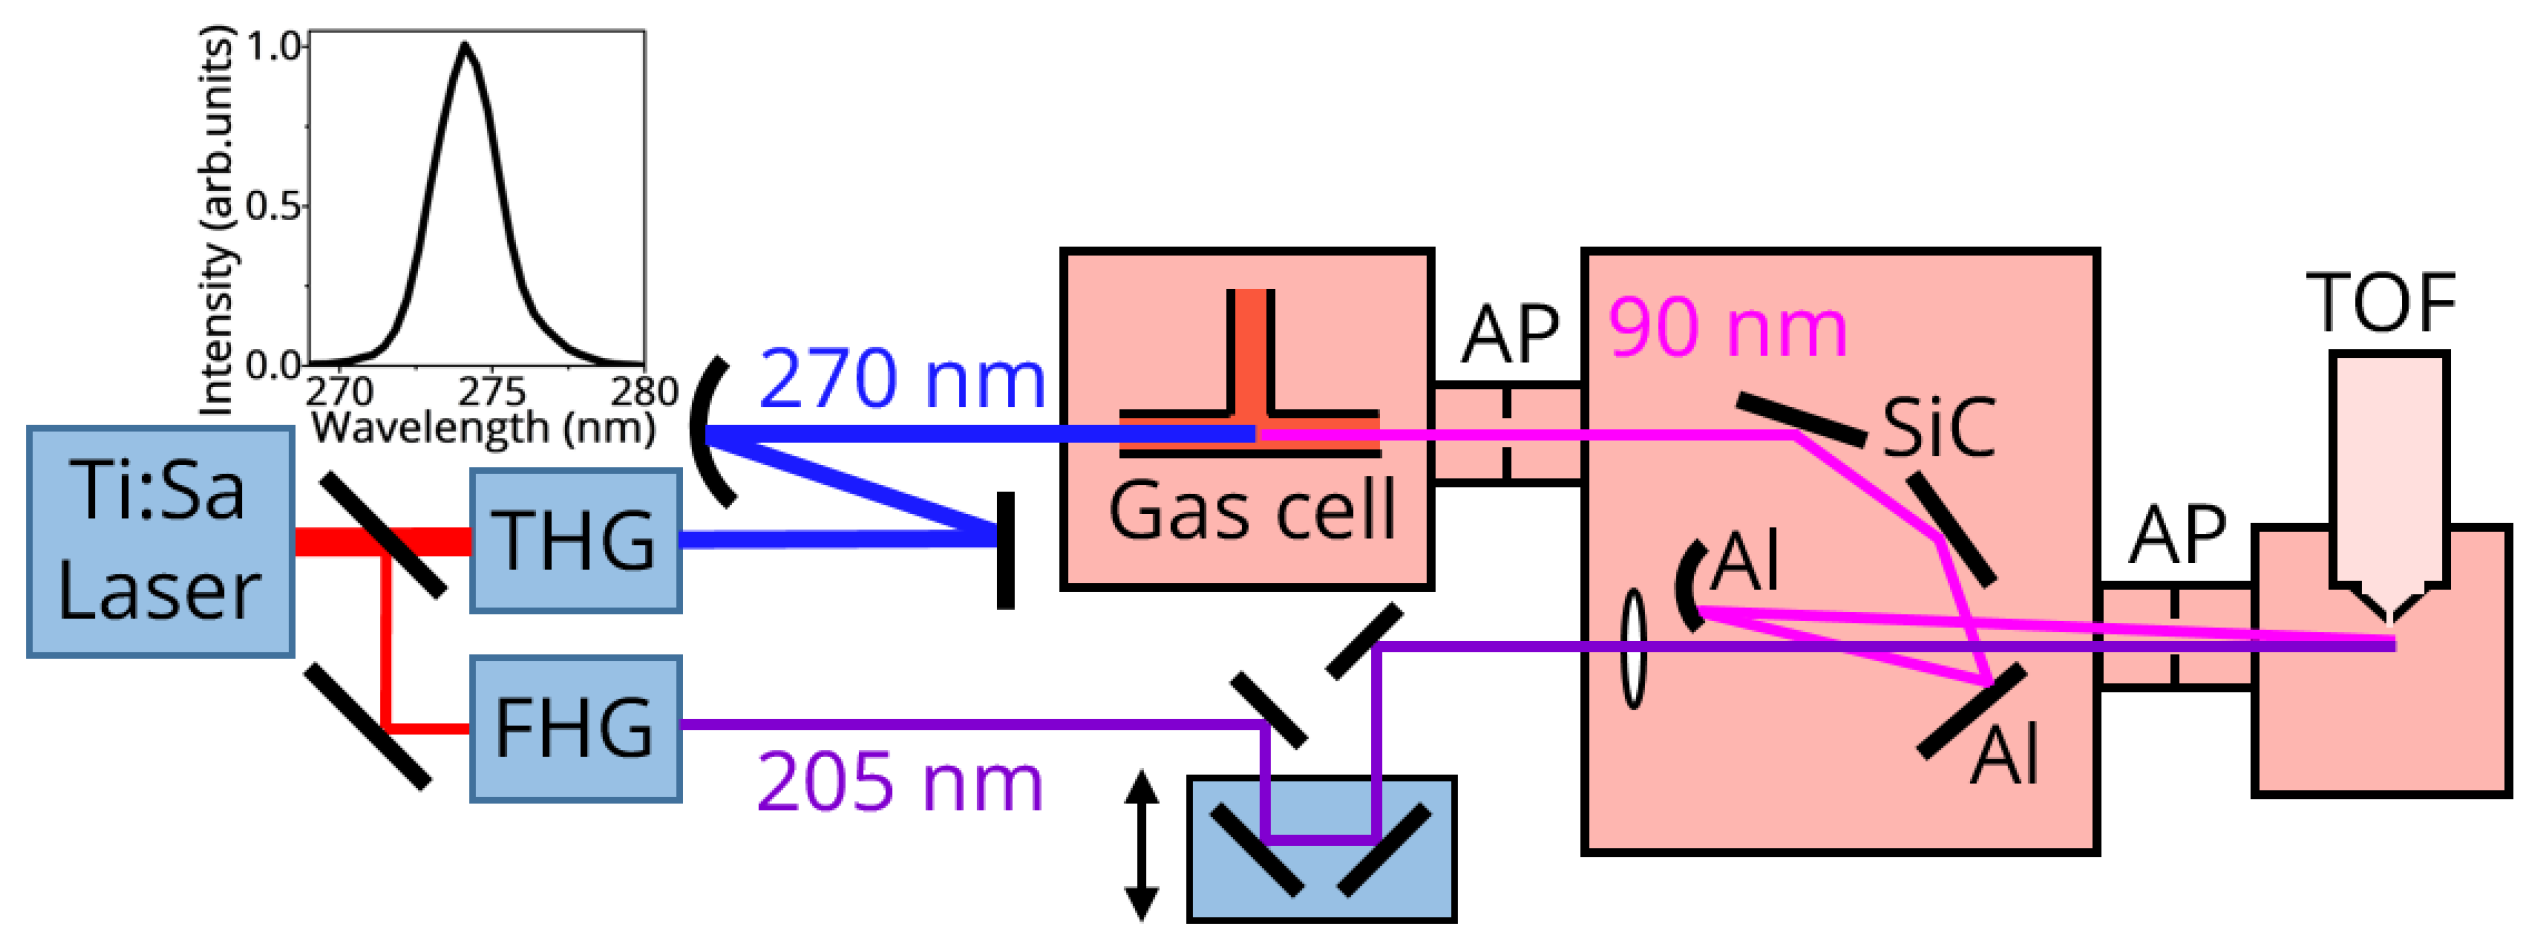
2.1. UV Driving Laser

Figure 2 shows a schematic illustration of the experimental setup for VUV TRPES using 205-nm pump and 90-nm probe pulses. The fundamental output from a home-built Ti:sapphire amplifier (810 nm, 12 mJ/pulse, 35 fs at 1 kHz) was split by an uncoated fused silica plate, with the minor (a few percent) Fresnel reflection sent for fourth-harmonic generation (FHG, 205 nm) using nonlinear crystals. The main portion (>90%) was sent to a single-pass third-harmonic generation (THG, 270 nm) stage that consisted of a β-BaB2O4 (BBO) crystal for second-harmonic generation, an α-BBO delay-compensation plate, a quartz retardation plate for polarization control, and a β-BBO crystal for type-I THG [5]. These optical components have a fairly large aperture size (⌀12 mm), and a collimated fundamental beam of a large diameter (>5 mm full width at half maximum) was used to avoid two-photon absorption in the THG crystal. The highest pulse energy obtained at 270 nm was 1.5 mJ, corresponding to 13% energy conversion efficiency. However, intense DUV pulses induce nonlinear processes while propagating through air, and the shot-to-shot intensity fluctuation of the 90-nm pulse after the 9th harmonic generation was found to be far worse than that of the 270-nm driving pulse. Therefore, we operated the THG stage with a reduced conversion efficiency. The temporal duration of the 270-nm pulse was measured using a multiphoton ionization process of nitric oxide [18] to be 40–50 fs, which is consistent with the transform-limited (TL) pulse width (~40 fs) calculated from the THG spectrum (Figure 2 inset).

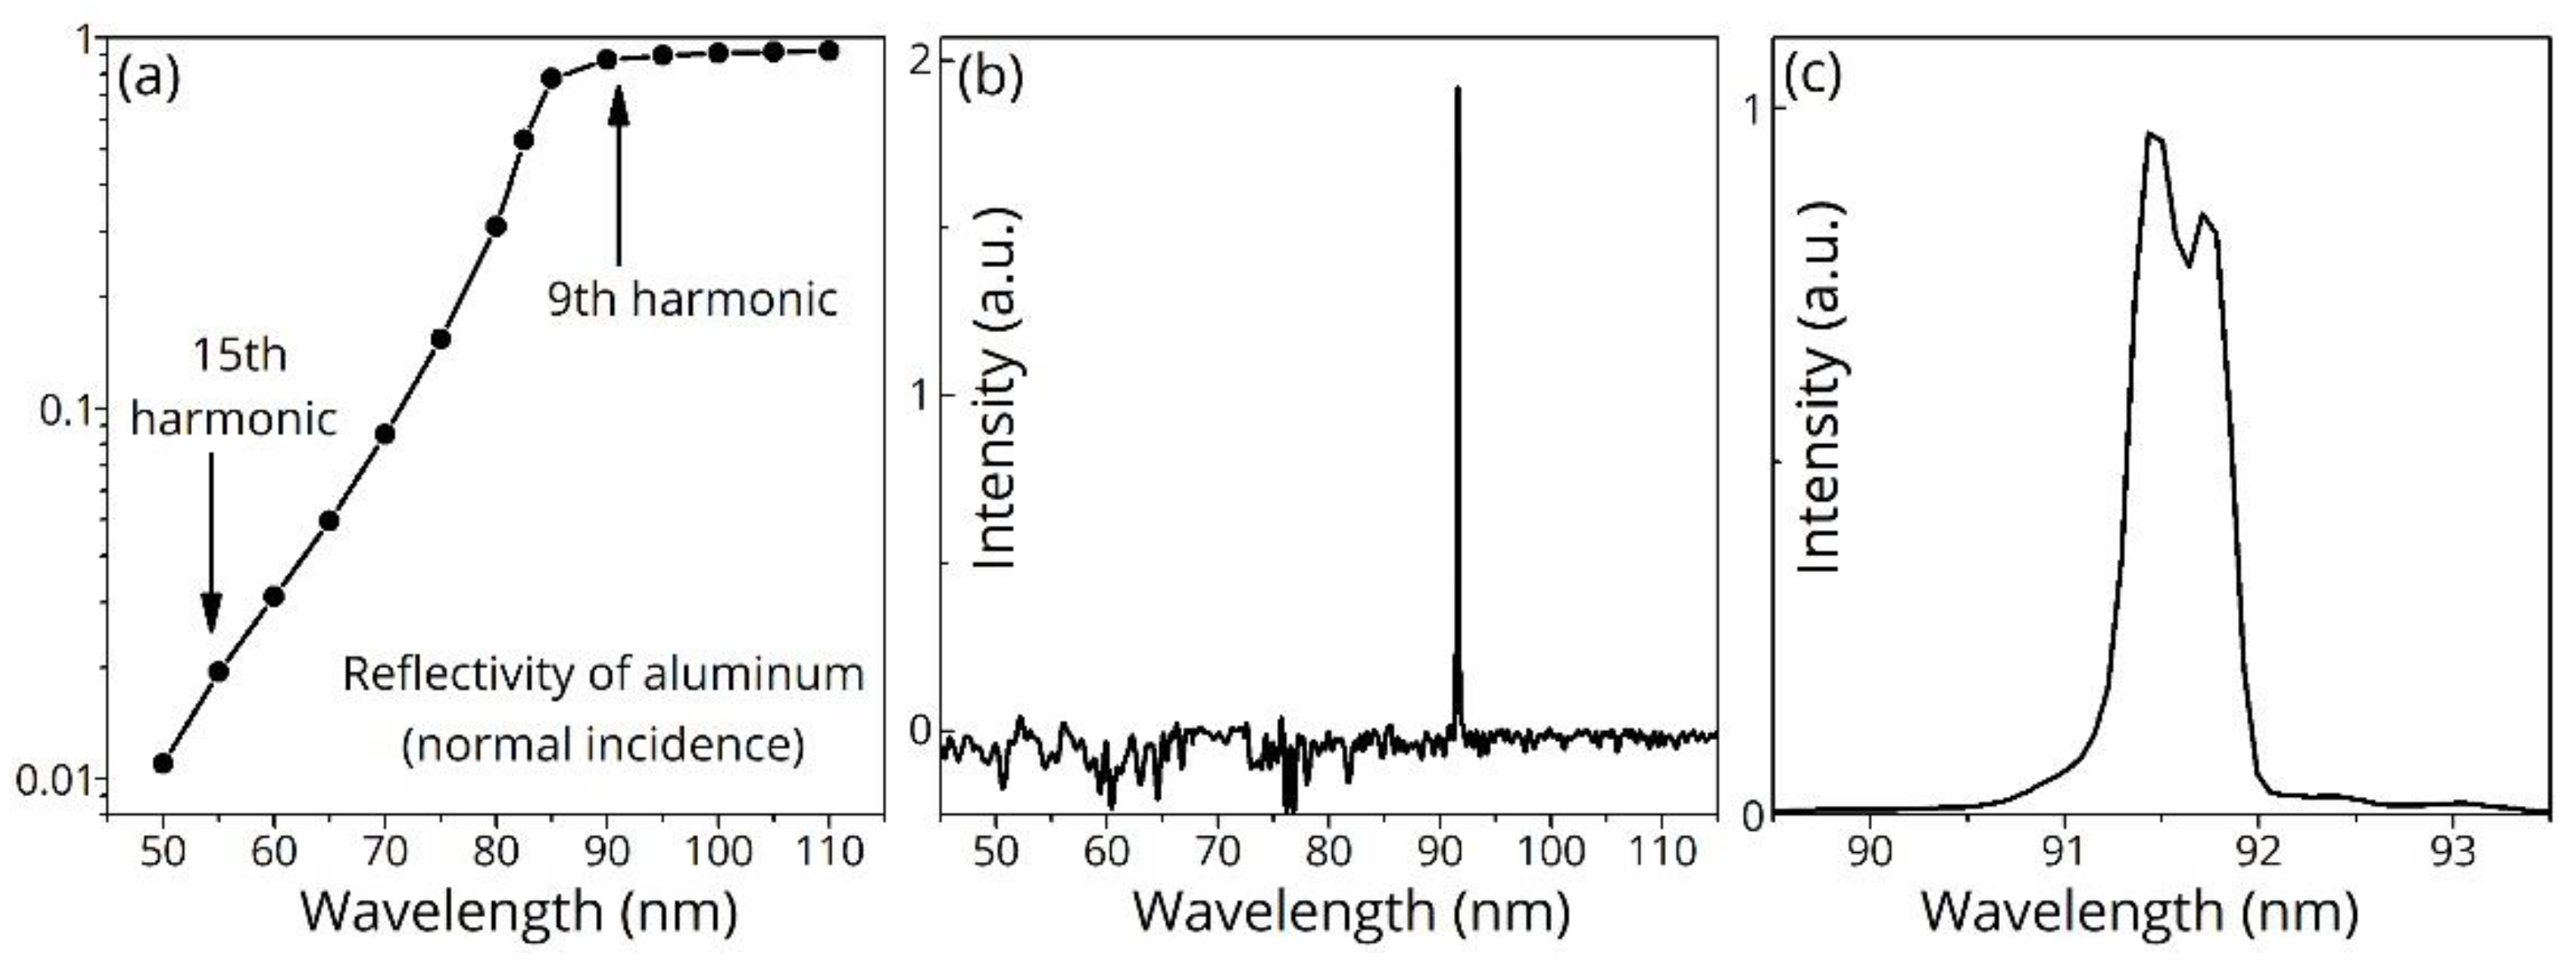
2.2. Generation and Isolation of the 9th Harmonic

The 270-nm pulse was loosely focused with an f = 2000-mm lens into a gas flow cell (10 cm long, ⌀1.3 mm holes on both sides) in a vacuum chamber. The beam waist size and focused intensity at the gas cell are estimated to be 140 μm and 2 × 10¹⁴ W/cm2, respectively. The entrance window to the chamber was a 1-mm-thick CaF2 plate, and the gas cell was filled with rare gas. Though the 9th harmonic (= 3rd × 3rd) is the lowest order obtained from the 270-nm driving pulse and thus is generated most efficiently, higher-order harmonics (15th (= 3rd × 5th, 54 nm), 21st (= 3rd × 7th, 39 nm), etc.) can also be generated in the gas cell. Since the 9th harmonic is well separated in energy (>9 eV) from the higher-order harmonics, it can be isolated quite easily using aluminium mirrors, as described below. Among several target rare gas species (Ar, Kr, and Xe), the highest conversion efficiency for the 9th harmonic generation was achieved in Kr [5].
The generated 9th harmonic was sent to the next chamber through an aperture (AP) with a diameter of ⌀2 mm for differential pumping. To separate the 9th harmonic from the 270-nm driving pulse, it was reflected twice by SiC Brewster-angle beam splitters [19]. The incident angle to the SiC beam splitters was set at 71.8°, at which the reflectivity at 270 nm is minimized. The calculated reflectivities at 270 and 90 nm per bounce are <0.1% and 40%, respectively. Since the epitaxially grown SiC wafer (Cree Inc., Durham, NC, USA) was sufficiently smooth, we used the wafer without further polishing. We found that the SiC beam splitters degrade due to VUV irradiation; after 20–30 h of operation, the reflectivity at 90 nm was reduced by a factor of two, whereas at 270 nm it increased. Since the reflectivities could be fully restored to their initial values by changing the irradiated position, it appears that a layer of contamination builds up on the SiC surface.
After a double bounce by bare aluminum mirrors (Al) and passing through another aperture (AP) for differential pumping, the 90-nm pulse was sent to the time-of-flight (TOF) chamber. As shown in Figure 3a, aluminum is highly reflective for the 9th harmonic (~90% for normal incidence), while its reflectivity for the 15th harmonic (and even higher harmonics) is two orders of magnitude smaller than that for the 9th harmonic. Figure 3b shows a spectrum of the 9th harmonic acquired with a VUV spectrometer (VM502, Roper Technologies, Lakewood Ranch, FL, USA) after a couple of bounces by bare aluminum mirrors. For the acquisition of this spectrum, the target gas medium was Kr and the back pressure was 15 Torr. It is clear that a single-order 9th harmonic pulse at 90 nm was obtained. In actuality, no evidence of the higher-order harmonics manifested itself in our TRPES spectra [11,12,13,14,15,16,17]. As shown in Figure 3c, the spectral width of the 9th harmonic was ~0.5 nm, and TL pulse width calculated from the spectrum was ~30 fs. Although we have not measured the pulse width of the 9th harmonic directly, its actual pulse width appears somewhat longer than the TL width; the cross-correlation time between the 90-nm and 205-nm pulses estimated using (1 + 1’) photoionization of nitric oxide [14] was 80–90 fs.

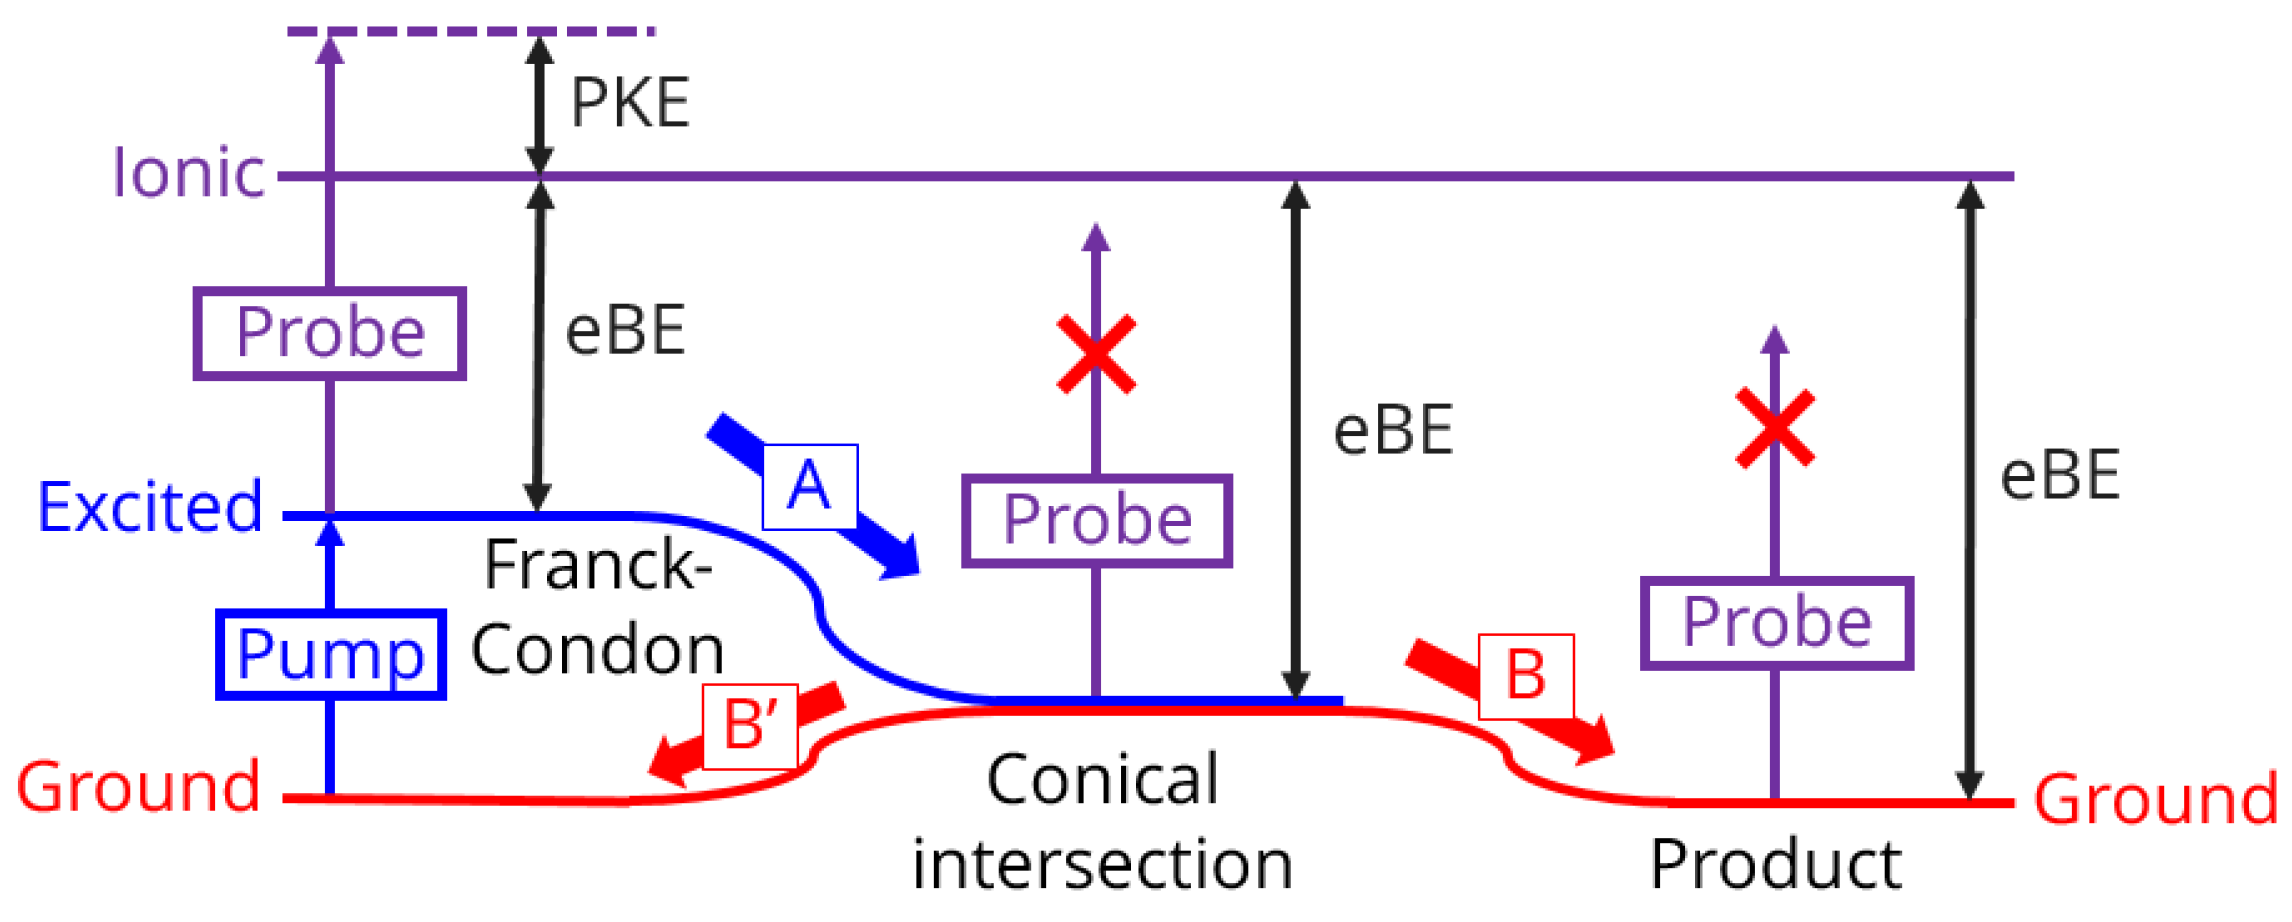
2.3. Time-Resolved Photoelectron Spectroscopy (TRPES) Apparatus
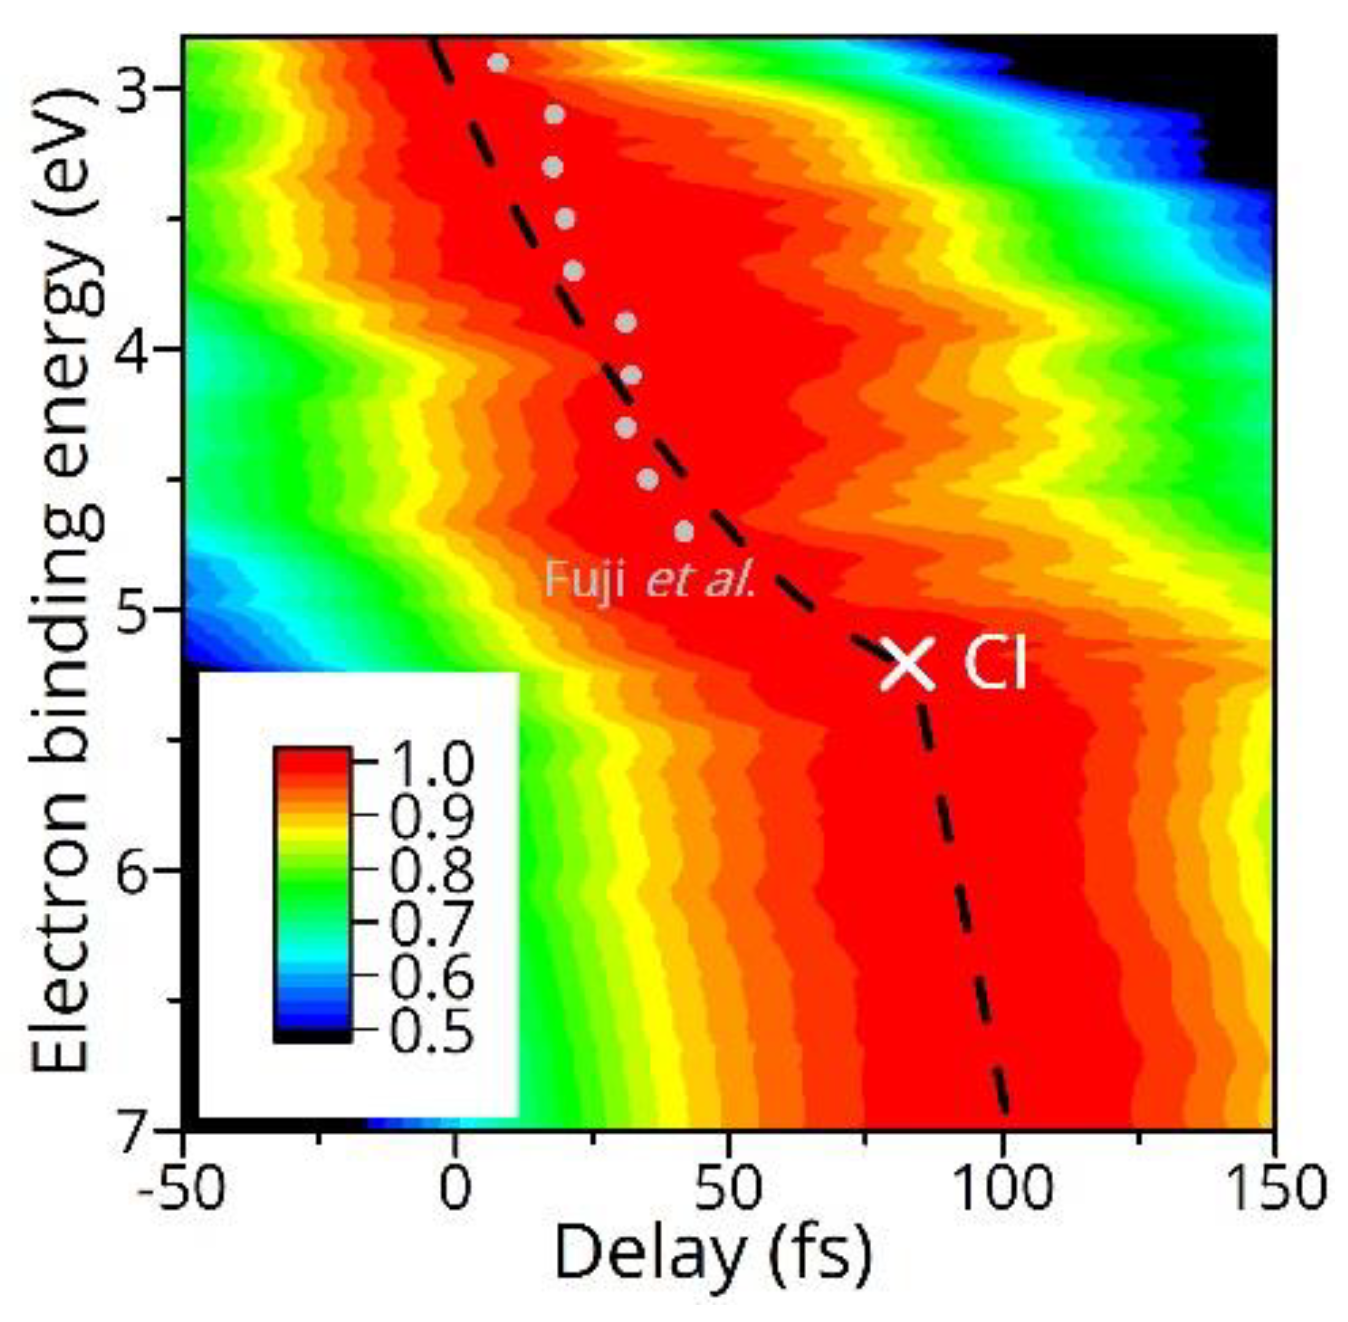
Both the 205-nm pump and 90-nm probe pulses were focused onto a continuous molecular beam formed from a nozzle inside a magnetic-bottle TOF photoelectron spectrometer. The probe pulse energy in the TOF chamber reaches sub-μJ levels; the maximum pulse energy of the 9th harmonic after a double reflection by the SiC plates was measured to be ~0.2 μJ with a power meter (12A-TEC, Ophir Optronics, Jerusalem, Israel). However, we performed TRPES experiments with reduced probe pulse energies [12,16,17] to suppress space-charge effects (distortions of TRPES spectra induced by mutual Coulomb repulsion between photoelectrons. See, e.g., ref. [20].). In addition, we kept the excitation probability sufficiently low (≲5%; the pump pulse energy was typically ~102 nJ.) to minimize undesired multiphoton processes. The generated photoelectrons were detected using a microchannel plate at the end of a 1-m long TOF tube, and the signal was averaged using a digitizer (U1084A, Agilent Technologies, Santa Clara, CA, USA). To improve the signal-to-noise ratio (SNR) and to reduce the acquisition time, we employed the rapid-scan data-acquisition method, in which the pump-probe delay is continuously scanned and the data are recorded on the fly and in real time [21]. In our apparatus, as a motorized translation stage (FS-1020PX, Sigma Tech, Saitama, Japan) scanned the pump-probe delay at a constant speed (300 fs/s), the digitizer acquired the photoelectron signals every 0.1 s (i.e., a delay step of 30 fs). In a single scan time of 10 s, there were 100 delay steps. To improve the SNR, the signals were arithmetically averaged over 200 scans, and thus the total acquisition time was 30–40 min (10 × 200 = 2000 s).

3. TRPES Results

Here we present a few representative results from our recent TRPES studies using 9th harmonic pulses [11,12,13,14,15,16,17]. Figure 4 shows TRPES spectra of furan (C4H4O), where the time profile measured at each eBE has been normalized to unity. This helps to reveal the changes in spectral shape. It is evident that the spectral peak (see dashed curve, which is a guide for the eye) gradually shifts toward higher eBE by several electronvolts within the first 150 fs, as was discussed in the Introduction. We attributed the kink of the spectral shift at τ ~ 90 fs (eBE ≈ 5 eV) to a CI mediating a nonadiabatic transition to the ground state. Also shown as the dotted line is the result we reported previously [9] using DUV probe pulses (hvprobe = 4.7 eV). Notably, the kink at eBE ≈ 5 eV was outside of the observation window using the DUV probe pulses, demonstrating the utility of the VUV probe pulses for TRPES studies.
Figure 5a shows a TRPES spectrum of nitromethane (CH3NO2) measured at a pump-probe delay of τ = 1000 fs. In the displayed eBE region, a strong one-color ionization signal of nitromethane from the ground electronic state is observed. We evaluated the one-color signal from the TRPES spectra averaged for negative delays and already subtracted in Figure 5a. A negative peak at 11–12 eV represents a “bleach” signal, which is negative signal intensity frequently observed in transient absorption spectroscopy due to depletion of the ground state population, of nitromethane. Meanwhile, positive peaks at 9.8 and 10–11 eV are assigned to nascent CH3 and NO2 fragments, respectively, created as a result of nitromethane photodissociation. The observed TRPES spectrum was well reproduced [Figure 5b] by a linear combination of four static photoelectron spectra [nitromethane, CH3, and NO2 in the electronic ground (X) and excited (A) states]. In Figure 5c, individual contributions from the four species are separately shown. Our results suggest that the populations of NO2(X) and NO2(A) are comparable. We successfully identified the electronic state of the NO2 product [16], which has been a central subject in experimental and theoretical studies on the photodissociation dynamics of nitromethane.

4. Conclusions

To follow ultrafast dynamics to the final end product in TRPES, the VUV probe pulse with a high photon energy exceeding the eBE of the product is required. We have shown that the single-order 9th harmonic pulse of a Ti:sapphire laser obtained by the UV-driven harmonic generation serves as an ideal probe for TRPES studies of polyatomic molecules. The high-average-power VUV source obtained here can compensate for low sample densities of biologically relevant molecules, which mostly have low vapor pressures, in future studies.

Author Contributions

S.A. built the experimental apparatus, carried out the measurements, and analyzed the data; T.S. contributed to the original research concept and overall supervision of the project. All of the authors discussed the results and contributed to the writing of the paper.

Funding

This research was funded by JSPS KAKENHI grant numbers JP16K17528 and 15H05753.

Conflicts of Interest

The authors declare no conflict of interest.

References

  1. Stolow, A.; Bragg, A.E.; Neumark, D.M. Femtosecond time-resolved photoelectron spectroscopy. Chem. Rev. 2004, 104, 1719–1757. [Google Scholar] [CrossRef] [PubMed]
  2. Corkum, P.B.; Krausz, F. Attosecond science. Nat. Phys. 2007, 3, 381–387. [Google Scholar] [CrossRef]
  3. Nugent-Glandorf, L.; Scheer, M.; Samuels, D.A.; Mulhisen, A.M.; Grant, E.R.; Yang, X.; Bierbaum, V.M.; Leone, S.R. Ultrafast time-resolved soft X-ray photoelectron spectroscopy of dissociating Br2. Phys. Rev. Lett. 2001, 87, 17–20. [Google Scholar] [CrossRef] [PubMed]
  4. Frassetto, F.; Cacho, C.; Froud, C.A.; Turcu, I.C.E.; Villoresi, P.; Bryan, W.A.; Springate, E.; Poletto, L. Single-grating monochromator for extreme-ultraviolet ultrashort pulses. Opt. Express 2011, 19, 19169–19181. [Google Scholar] [CrossRef] [PubMed]
  5. Adachi, S.; Horio, T.; Suzuki, T. Generation of intense single-order harmonic pulse in the vacuum ultraviolet region using a deep ultraviolet driving laser. Opt. Lett. 2012, 37, 2118–2120. [Google Scholar] [CrossRef] [PubMed]
  6. Marceau, C.; Hammond, T.J.; Naumov, A.Y.; Corkum, P.B.; Villeneuve, D.M. Wavelength scaling of high harmonic generation for 267 nm, 400 nm and 800 nm driving laser pulses. J. Phys. Commun. 2017, 1, 015009. [Google Scholar] [CrossRef] [Green Version]
  7. Boguslavskiy, A.E.; Schalk, O.; Gador, N.; Glover, W.J.; Mori, T.; Schultz, T.; Schuurman, M.S.; Martínez, T.J.; Stolow, A. Excited state non-adiabatic dynamics of the smallest polyene, trans 1,3-butadiene. I. Time-resolved photoelectron-photoion coincidence spectroscopy. J. Chem. Phys. 2018, 148, 164302. [Google Scholar] [CrossRef] [PubMed]
  8. Oesterling, S.; Schalk, O.; Geng, T.; Thomas, R.D.; Hansson, T.; de Vivie-Riedle, R. Substituent effects on the relaxation dynamics of furan, furfural and β-furfural: A combined theoretical and experimental approach. Phys. Chem. Chem. Phys. 2017, 19, 2025–2035. [Google Scholar] [CrossRef] [PubMed]
  9. Fuji, T.; Suzuki, Y.-I.; Horio, T.; Suzuki, T.; Mitrić, R.; Werner, U.; Bonačić-Koutecký, V. Ultrafast photodynamics of furan. J. Chem. Phys. 2010, 133, 234303. [Google Scholar] [CrossRef] [PubMed]
  10. Wu, G.; Hockett, P.; Stolow, A. Time-resolved photoelectron spectroscopy: From wavepackets to observables. Phys. Chem. Chem. Phys. 2011, 13, 18447–18467. [Google Scholar] [CrossRef] [PubMed]
  11. Adachi, S.; Sato, M.; Suzuki, T. Direct observation of ground-state product formation in a 1,3-cyclohexadiene ring-opening reaction. J. Phys. Chem. Lett. 2015, 6, 343–346. [Google Scholar] [CrossRef] [PubMed]
  12. Sato, M.; Adachi, S.; Suzuki, T. Photoisomerization of Vibrationally Hot Tetramethylethylene Produced by Ultrafast Internal Conversion from the Excited State. J. Phys. Chem. A 2016, 120, 5099–5102. [Google Scholar] [CrossRef] [PubMed]
  13. Yamamoto, Y.I.; Karashima, S.; Adachi, S.; Suzuki, T. Wavelength Dependence of UV Photoemission from Solvated Electrons in Bulk Water, Methanol, and Ethanol. J. Phys. Chem. A 2016, 120, 1153–1159. [Google Scholar] [CrossRef] [PubMed]
  14. Sato, M.; Suzuki, Y.; Suzuki, T.; Adachi, S. Pump–probe photoelectron spectroscopy by a high-power 90 nm vacuum-ultraviolet laser. Appl. Phys. Express 2016, 9, 022401. [Google Scholar] [CrossRef]
  15. Adachi, S.; Sato, M.; Suzuki, T.; Grebenshchikov, S.Y. Unexpectedly broad photoelectron spectrum as a signature of ultrafast electronic relaxation of Rydberg states of carbon dioxide. Phys. Rev. A 2017, 95. [Google Scholar] [CrossRef]
  16. Adachi, S.; Kohguchi, H.; Suzuki, T. Unravelling the Electronic State of NO2Product in Ultrafast Photodissociation of Nitromethane. J. Phys. Chem. Lett. 2018, 9, 270–273. [Google Scholar] [CrossRef] [PubMed]
  17. Adachi, S.; Schatteburg, T.; Humeniuk, A.; Mitrić, R.; Suzuki, T. Probing ultrafast dynamics during and after passing through conical intersections. Phys. Chem. Chem. Phys. 2018. [Google Scholar] [CrossRef] [PubMed]
  18. Adachi, S.; Suzuki, T. Self-compression of femtosecond deep-ultraviolet pulses by filamentation in krypton. Opt. Lett. 2017, 42, 1883–1886. [Google Scholar] [CrossRef] [PubMed]
  19. Takahashi, E.J.; Nabekawa, Y.; Mashiko, H.; Hasegawa, H.; Suda, A.; Midorikawa, K. Generation of Strong Optical Field in Soft X-Ray Region by Using High-Order Harmonics. IEEE J. Sel. Top. Quantum Electron. 2004, 10, 1315–1328. [Google Scholar] [CrossRef]
  20. Hellmann, S.; Rossnagel, K.; Marczynski-Bühlow, M.; Kipp, L. Vacuum space-charge effects in solid-state photoemission. Phys. Rev. B Condens. Matter Mater. Phys. 2009, 79. [Google Scholar] [CrossRef]
  21. Feldstein, M.J.; Vöhringer, P.; Scherer, N.F. Rapid-scan pump–probe spectroscopy with high time and wave-number resolution: Optical-Kerr-effect measurements of neat liquids. J. Opt. Soc. Am. B 1995, 12, 1500–1510. [Google Scholar] [CrossRef]
Figure 1. Schematic diagram of time-resolved photoelectron spectroscopy (TRPES). Conical intersections and products with eBE higher than 6 eV have been outside of the observation window when using deep-UV (DUV) probe pulses.
Applsci 08 01784 g001
Figure 2. Schematic illustration of the experimental setup for vacuum-ultraviolet time-resolved photoelectron spectroscopy (VUV TRPES) using 205-nm pump and 90-nm probe pulses. THG: Single-pass third-harmonic generation stage; FHG: Fourth-harmonic generation using nonlinear crystals; AP: Apertures for differential pumping; SiC: SiC Brewster-angle beam splitters; Al: Bare aluminum mirrors; TOF: Magnetic-bottle time-of-flight photoelectron spectrometer. The inset shows the THG spectrum.
Applsci 08 01784 g002
Figure 3. (a) Normal-incidence reflectivity of aluminum. (b) Spectrum of the 9th harmonic after a couple of bounces by bare aluminum mirrors. (c) Spectral shape of the 9th harmonic.
Applsci 08 01784 g003
Figure 4. Normalized time-resolved photoelectron spectroscopy (TRPES) spectra of furan.
Applsci 08 01784 g004
Figure 5. (a) TRPES spectrum of nitromethane at τ = 1000 fs. (b) Reproduced spectrum using a linear combination of four static photoelectron spectra [nitromethane, CH3, NO2(X), and NO2(A)]. (c) Individual contributions in (b).
Applsci 08 01784 g005

