Abstract
The commercially available nanoscale zerovalent zinc (nZVZ) was used as an adsorbent for the removal of malachite green (MG) from aqueous solutions. This material was characterized by X-ray diffraction and X-ray photoelectron spectroscopy. The advanced experimental design tools were adopted to study the effect of process parameters (viz. initial pH, temperature, contact time and initial concentration) and to reduce number of trials and cost. Response surface methodology and rapidly developing artificial intelligence technologies, i.e., artificial neural network coupled with particle swarm optimization (ANN-PSO) and artificial neural network coupled with genetic algorithm (ANN-GA) were employed for predicting the optimum process variables and obtaining the maximum removal efficiency of MG. The results showed that the removal efficiency predicted by ANN-GA (94.12%) was compatible with the experimental value (90.72%). Furthermore, the Langmuir isotherm was found to be the best model to describe the adsorption of MG onto nZVZ, while the maximum adsorption capacity was calculated to be 1000.00 mg/g. The kinetics for adsorption of MG onto nZVZ was found to follow the pseudo-second-order kinetic model. Thermodynamic parameters (ΔG0, ΔH0 and ΔS0) were calculated from the Van’t Hoff plot of lnKc vs. 1/T in order to discuss the removal mechanism of MG.
1. Introduction
The discharge of dyes and pigments from various industries has generated large quantities of colored wastewater, which pose a potential threat to the environment [1,2,3,4]. Malachite green (MG) (shown in Figure 1) is a cationic dye belonging to the triphenylmethane dye category, which is widely used for dyeing of textile, leather and paper, printing, and treating parasites, fungal and bacterial infections in fish and fish eggs [5]. However, this noxious dye can cause carcinogenic, mutagenic and teratogenic effects on humans and animals [6,7,8,9]. Thereby, the removal of MG from wastewater before being discharged into surface water bodies is indispensible and significant. A variety of decolorization methods have been used for the removal of MG, including physical (adsorption), chemical (coagulating) and biological (decolorizsation–fermentation processes) [10,11]. Since the chemical treatment method is unsuited for highly soluble dyes and longer time is required for biological method, adsorption is considered the efficient method due to its comparatively low cost and high removal efficiency [12,13].
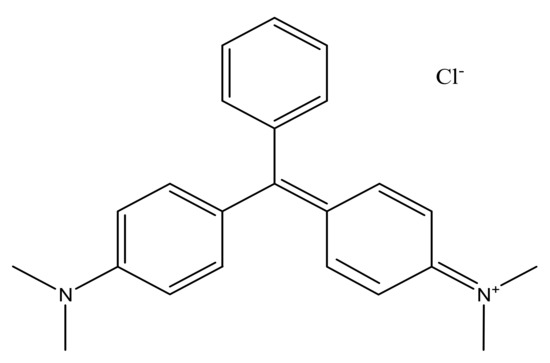
Figure 1.
Chemical structure of malachite green.
Nanomaterials have been used as promising materials for environmental remediation due to a series of unique properties, e.g., small size effect, surface effect and quantum size effect [14,15]. Nano-sized zinc oxide is a wide-gap semiconductor with a high photo-catalysis activity, which has been widely used in the photodegradation of organic pollutants in wastewater [16,17]. A wide range of studies have discussed the application of nanoscale zerovalent iron (nZVI) in the removal of heavy metals and organic pollutants [18,19]. Due to its high reactivity, zerovalent zinc exhibited a faster removal of organic compounds than zerovalent iron [20]. To our knowledge, hitherto there have been no reports available in the literature regarding MG removal by nanoscale zerovalent zinc (nZVZ).
Modeling and optimization are a vital stage in the contaminant removal process, which are beneficial for determining the optimum experimental condition and obtaining maximum removal efficiency [21]. Response surface methodology (RSM) as an experimental design tool was used to build models, evaluate the effects of factors and search for the optimum experimental conditions [22]. Artificial intelligence (AI) has recently emerged as a promising technology with tremendous development potential for actual applications, including intelligent search, autonomous driving, robots, big data, fingerprint identification and human-computer games [23,24]. Artificial neural networks (ANNs) are a key AI tool commonly used as a black box that works better than RSM in terms of modeling and prediction, but they cannot obtain the global optimal solutions [25,26,27]. Particle swarm optimization (PSO) is inspired by the behavior of bird flocks, which has a potential to find the optimal solutions via “particles” movement [28]. The genetic algorithms (GA) based on the natural mechanics and natural selection is utilized for finding optimum solutions [29]. PSO or GA coupled with ANNs is used to achieve the optimum removal efficiency because it does not easily get trapped in a local optimum [30].
The aim of the present study was to investigate the feasibility that the the commercially available nZVZ could be utilized as a potential adsorbent for the removal of MG from aqueous solutions with the aid of the RSM, ANN-PSO and ANN-GA models. First of all, the nZVZ was characterized via X-ray diffraction and X-ray photoelectron spectroscopy. Then, the experiments for the adsorption of MG onto nZVZ were performed based on RSM design using the selected parameters, viz. initial pH, temperature, contact time and initial concentration. The RSM, ANN-PSO and ANN-GA models were applied to find the optimum process variables and maximum removal efficiency of MG. Next, the performance of these models was evaluated and the relative importance of the variables were obtained by sensitivity analysis. Besides, the equilibrium data for uptake of MG by nZVZ was fitted to the Langmuir, Freundlich, Temkin isotherms. The pseudo-first-order kinetics and the pseudo-second-order kinetics were employed to examine the effect between the removal efficiency and contact time. Finally, thermodynamic parameters ΔG0, ΔH0 and ΔS0 were calculated from the Van’t Hoff plot of lnKc vs. 1/T to discuss the removal mechanism of MG.
2. Materials and Methods
2.1. Materials
In the present study, all chemicals and reagents (HCl, NaOH) used are of analytical grade and used without further purification. The commercially available nZVZ (the specific surface area: 33.01 m2/g, average particles diameter: 50.00 nm) was purchased from Shanghai Naiou Nanotechnology Co., Ltd. (Shanghai, China), and the target chemical MG was obtained from Tianjin Kemio Chemical Co., Tianjin, China. The MG stock solution (1000.00 mg/L) was prepared by dissolving in deionized water, which was further diluted for a desired concentration (600.00, 700.00 and 800.00 mg/L). The pH values of the solutions were measured with a digital pH meter (PHB-5, Hangzhou Qiwei Co., Ltd., Hangzhou, Zhejiang, China) using a standard buffer solution to calibrate the solid electrode, and pH values of the test solutions were adjusted by addition of 0.1 M HCl or 0.1 M NaOH. Absorbance of the MG solutions was determined by using UVmini-1240 spectrophotometer (SHIMADZU, Kyoto, Japan).
2.2. Characterization of the Commercially Available nZVZ
The crystalline structure of nZVZ was measured by X-ray diffraction (XRD) on a Philips Analytical X-ray (Lelyweg 1 7602, EA, Almelo, The Netherlands) with a Cu-Kα X-ray source (generator tension 40 kV, current 40 mA). The commercial nZVZ was placed in a glass holder and scanned from 5° to 90°. The X-ray photoelectron spectroscopy (XPS) data of nZVZ were collected using an ESCALAB 250Xi spectrometer (Thermo Electron Corporation, Waltham, MA, USA) with monochromatized Al Kα radiation (1486.6 eV) and the peak energies were corrected with the C1s peak as a reference.
2.3. Batch Adsorption Experiments
The adsorption experiments were performed using nZVZ as the adsorbent and MG as the adsorbate. The experiment was carried out using 100 mL conical flask with 50 mL solution of known initial pH and initial MG concentration by adding 30 mg of the adsorbent. Then, the conical flask was mounted on a temperature controlled water bath shaker and agitated at 200 rpm for the desired temperature (20, 25 or 30 °C) and contact time (60, 90 or 120 min). After the experiment, the suspension was centrifuged at 4500 rpm for 5 min, and the concentration of the supernatant was measured at the maximum absorbance wavelength (616 nm). The removal efficiency of MG and the amount of adsorption at equilibrium (qe, mg/g) was calculated by using the following equation:
where Y is the removal efficiency of MG, c0 is the initial concentration of MG (mg/L), and ct is the MG concentration at any time t (mg/L).
where qe is the amount of adsorption at equilibrium (mg/g), v and m represent the solution volume (L) and the mass of adsorbent used (g), respectively.
Responses surface methodology (RSM) is a collection of mathematical and statistical methods, which can help better understand the interactive effect of the process parameters and provide a smaller number of experimental runs [20]. In this study, the optimal conditions for maximum removal efficiency of MG by nZVZ were identified by the 3-level 4-factor Box–Behnken design (BBD) under RSM. The four important independent variables, viz. initial pH (A), temperature (B), contact time (C) and initial concentration (D), were selected to design experiments, whereas the removal efficiency (Y) was considered as the dependent variable. This design included 29 experiments with 5 central points. The levels of factors were coded as −1 (low), 0 (middle) and 1 (high) (Table 1) [31]. The relationship between the response and the independent variables can be represented by the following quadratic equation:
where Y is the predicted removal efficiency of MG, β0 is the intercept of quadratic model, β1–β14 are the estimated coefficients, and A, B, C and D are the independent variables.
Y = β0 + β1A + β2B + β3C + β4D + β5AB + β6AC + β7AD + β8BC + β9BD + β10CD + β11A2 + β12B2 + β13C2 + β14D2

Table 1.
Values of independent variables.
2.4. Back Propagation Artificial Neural Network (BP-ANN)
ANNs have captured the focus of much attention due to their wide range of applicability, which can deal with complicated problems [32]. The Neural Network Toolbox of MATLAB software (2010a) (the MathWorks, Inc., Natick, MA, USA) was chosen in this work to develop the ANN models using neural network toolbox. Commonly used ANNs include multilayer perception (MLP), self-organization mapping (SOM), radial basis function (RBF) and fuzzy network [33]. Back propagation (BP) with the multilayer perception architecture is the most popular and widely used ANN with a good generalization ability and high reliability, which is based on the supervised learning procedure. In the present study, a three layer (input layer, hidden layer and output layer) feed-forward artificial neural network was selected to develop the predictive model (Figure 2). The output in each layer of BP-ANN was produced by summing all the input weight through the activation function [34]. A tangent sigmoid transfer function (tansig) at input-hidden layer was adopted (Equation (7)), while a linear transfer function (purelin) was used in hidden-output layer (Equation (8)). The network was trained by traingdx algorithm and the number of training epochs was set as 2000 with the learning rate at 10−5 (Figure 3).

Figure 2.
Illustration of Back Propagation Artificial Neural Network (BP-ANN) architecture.

Figure 3.
Flow diagram of BP-ANN training.
It is an important step to determine the number of neurons in hidden layer for training the network. In the present research, the computations were performed in which the number of neurons was varied from 1 to 10. The inputs (independent variables) and output (dependent variable) was normalized in the range of −1–+1 to avoid numerical overflow due to excessively large or small weights. The normalization equation is described as follows:
where yi is the normalized value of x, and the xmin and xmax are the minimum and maximum values of x, respectively. The weight of a neuron in hidden layer is calculated as follows:
where xi is value of neuron i in input layer, wij is the corresponding connection weight between neuron (i) in input layer and neuron (j) in hidden layer, and the weight of a neuron in output layer is calculated as follows:
where xj is value of neuron j in hidden layer, wjl is the corresponding connection weight between neuron (j) in hidden layer and neuron (l) in output layer. The tangent sigmoid (tansig) was used as transfer function between input and hidden layers which is given by:
The following is linear transfer function (purelin) used between hidden and output layers:
f(x) = x
The output was produced by weight and bias of neuron through the activation function using Equation (9):
where y, f, w and b represent the output, activation function, weight and bias in hidden layer or output layer, respectively.
Y = f × (w + b)
The relative influence of the individual variable was calculated by the following Garson equation [35,36]:
where Iab is the relative importance of the jth input variable on the output variable, wx is the connection weight, a, g and b are the number of neurons in the input layer, hidden layer and output layer, respectively.
2.5. Particle Swarm Optimization (PSO)
Particle swarm optimization (PSO) was first introduced by Kennedy and Eberhart, which is an efficient optimization technique simulating the social behavior, e.g., bird flocking and fish training [37]. An initial population randomly generated was called particles (solutions). Each particle had a position and a velocity, which was scattered throughout the multi-dimensional search space. The fitness function was used for evaluating fitness values of the particles. In every iteration, the particles could update their position and velocity according to their own history (personal best) and the knowledge of the swarm (global best) in comparison with the particle’s fitness values [38,39]. The particles continued to move in the search space until the maximum iteration number or the desired value of the objective function was reached (Figure 4). The operation parameters were as follows: 20 for the swarm size, 50 for maximum iteration, 2 for personal learning coefficient (c1), 2 for global learning coefficient (c2), 0.3 for minimum inertia weight and 0.9 for maximum inertia weight.
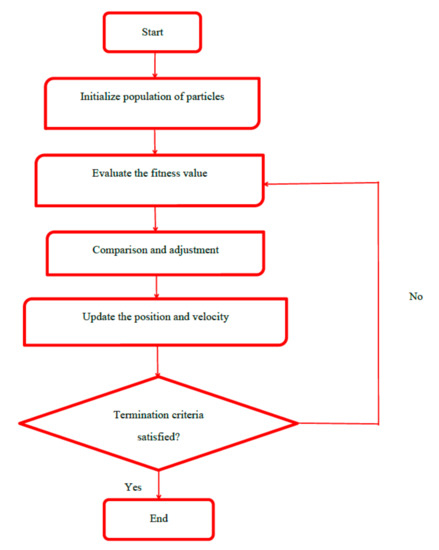
Figure 4.
Flow diagram of particle swarm optimization (PSO).
2.6. Genetic Algorithm (GA)
The genetic algorithm operation was started by the blind random population (a possible solution) that was represented by a set of chromosomes coded as a binary string [40]. Each of chromosomes included four different genes, i.e., initial pH, temperature, contact time and initial concentration. First of all, the initialization of populations was identified. The fitness function was applied for evaluating the merit of each chromosome. Then, selection operation was to choose some individuals from initial generation (parents) to breed a new generation (offspring) by utilizing the roulette wheel selection method [41]. Next, crossover operator was aimed to swap the information of parents that led to generating new individuals for the next generation. With the aid of crossover, the offspring had both the strength and weakness of its parents. The last operator was the mutation that was able to increase the randomness of individuals and prevent the GA from getting stuck in a local optimum (Figure 5) [42]. The optimum parameters used for GA optimization were size of population (20), number of generation (100), probability of crossover (0.8) and probability of mutation (0.01).
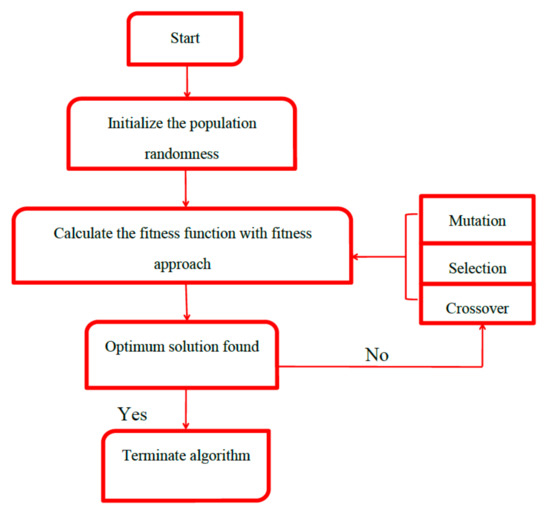
Figure 5.
Flowchart of Genetic Algorithm (GA) optimization.
3. Results and Discussion
3.1. Characterization of the Commercially Available nZVZ
In the present study, the XRD pattern obtained for the nZVZ shows the characteristic peak at the 2θ angles of 36.0, 39.5 and 44.5 corresponding to (002), (100) and (101) facets, respectively. These peaks are compatible with the standard XRD data for the hexagonal Zn lattice (JCPDS file 04-0831) (Figure 6) [43]. The characteristic peaks of ZnO at 32° and 34.7° are assigned to (100) and (002) facets [44,45]. The XPS spectrum of wide scan demonstrates that the binding energy of 284.5, 532.7 and 1023.6 are attributed to C1s, O1s and Zn 2p, respectively. In the spectrum of Zn 2p, the peaks for Zn 2p3/2 and Zn 2p1/2 are located at 1022.5 eV and 1047.6 eV, respectively (Figure 7a). The satellite peaks at around 1021.4 eV and 1023.6 eV are the feature peaks of Zn2+ and Zn0, respectively, which suggest that the surface of nZVZ was partially oxidized (Figure 7b) [45].

Figure 6.
The XRD pattern of the commercially available nanoscale zerovalent zinc (nZVZ).

Figure 7.
The X-ray photoelectron spectroscopy (XPS) spectra of nZVZ (a); The XPS spectra of the Zn-2p core level. Regions (b).
3.2. Modeling and Optimization by RSM
In the present study, the normal plot of studentized residuals vs. predicted probability values indicates that the model is suitable owing to the data distributed homogeneously on either side of the straight line following the Gaussian distribution (Figure 8) [46]. A satisfactory correlation (R2 = 0.9813) between the experimental and predicted removal efficiency suggests that the model is reliable (Figure 9). Three dimensional response surface plots are shown in Figure 10, which represent the changes in removal efficiency depending on every two factors when the other factors are set to the fixed values [47]. Initial pH as an important independent variable does not only affect the aqueous chemistry of molecules but also the surface binding sites of the adsorbents. The zero point of charge (pHzpc) indicates a net surface charge equal to zero [48]. MG (pKa = 10.3) becomes more protonated in acidic solutions and deprotonated in basic solutions [49]. The surface of nZVZ is positive when the solution pH is above the pHzpc, whereas the surface of nZVZ is negative when the solution pH is below the pHzpc [50]. From Figure 10a, it can be observed that an increase in pH and temperature enhances the removal efficiency of MG. Furthermore, the final pH of the solution was higher than the initial pH of the solution. The initial pH of the solution was acidic while the final pH of the solution was found to be alkaline (Figure 11). At higher pH, the number of negatively charged sites increase so that the adsorption was favored between the adsorbent and the cationic MG molecules due to a strong electrostatic attraction [30]. According to the RSM-BBD experimental design, the corresponding quadratic polynomial regression model is expressed by Equation (11). Notably, the positive values of coefficients for A (initial pH), B (temperature), especially C (contact time) illustrate the synergistic effect on the response.
Y = 63.12 + 10.44 A + 10.34 B + 12.71 C − 2.21 D − 4.50 AB − 8.53 AC + 6.22 AD + 2.38 BC + 2.63 BD + 1.10 CD + 6.21 A2 − 3.12 B2 − 3.32 C2 + 1.97 D2

Figure 8.
Normal plot of studentized residuals vs. normal % probability.

Figure 9.
The plot of correlation between experimental and predicted removal efficiency.
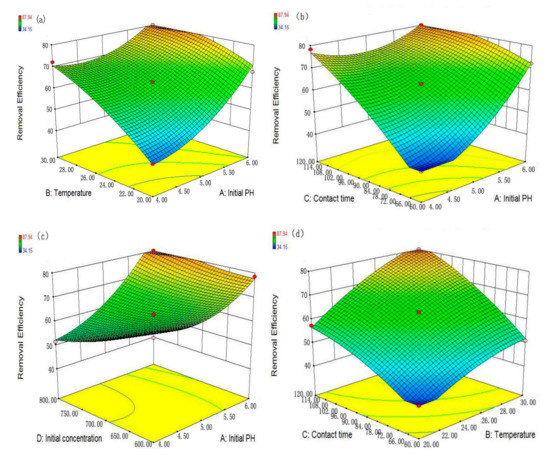
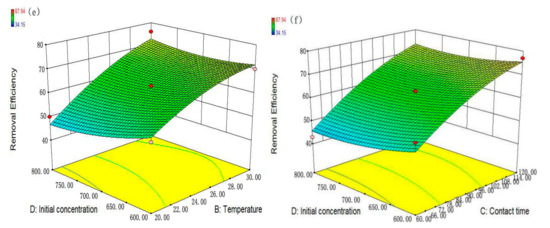
Figure 10.
Three dimensional response surface plots for the malachite green (MG) removal: (a) Initial pH—Temperature; (b) Initial pH—Contact time; (c) Initial pH—Initial concentration (d) Temperature—Contact time; (e) Temperature—Initial concentration; (f) Contact time—Initial concentration.
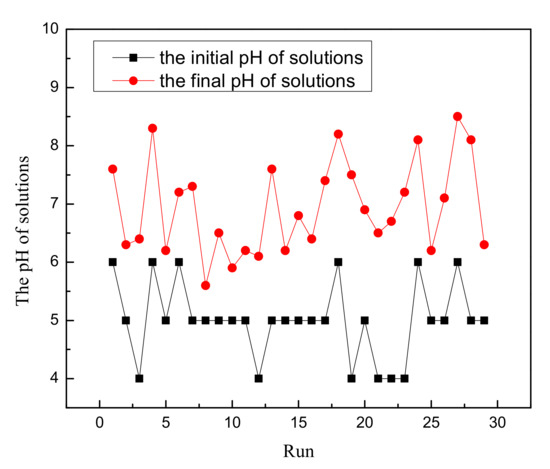
Figure 11.
The difference between the initial and final pH of the solutions.
The results for the analysis of variance (ANOVA) are summarized in Table 2, which can be used for identifying the significant factors. The F-value for the model is 52.57 implying that the model is significant. Since the p-values are less than 0.050, all first-order terms (initial pH (A), temperature (B), contact time (C) and initial concentration (D)) exhibit a high significance on the removal efficiency of MG. The combined effects of initial pH and temperature (AB), initial pH and contact time (AC), initial pH and initial concentration (AD) and the square of the initial pH (A2) also show a significance on the removal efficiency of MG at the 95% confidence level. Based on the F-values of independent variables, the order for these parameters influencing the removal efficiency of MG is: contact time > initial pH > temperature > initial concentration.
Table 2.
Analysis of variance (ANOVA) for the experimental results from the Box–Behnken design (BBD).
3.3. Modeling and Prediction by BP-ANN
BBD experimental sets were used as input data for developing a BP-ANN model. Four fifth of experimental data (1–24) were utilized for training, while the rest (25–29) was used as the test set (Table 3). The mean absolute error between the experimental and predicted removal efficiency of MG is 0.54% with a high correlation (R2 = 0.9999), which suggests that the BP-ANN model possesses a good prediction strength (Figure 12). The number of neurons in the hidden layer has a direct influence on the fitting performance of the network. Nevertheless, too many neurons in the hidden layer could lead to overfitting [40]. As shown in Figure 13, the optimum number of neurons in hidden layer was selected on the basis of mean square error (MSE), and one neuron was found to be the suitable structure in the hidden layer with the minimum MSE (0.0018). Thus, the final topological structure of the BP-ANN was 4-1-1 (four neurons in the input layer, one neuron in the hidden layer and one neuron in output layer).
Table 3.
Comparison of the removal efficiency between experimental and Back Propagation Artificial Neural Network (BP-ANN) model predicted.

Figure 12.
Regression plot of the actual and predicted results.

Figure 13.
Mean square error (MSE) of neurons in the BP-ANN model.
The relationship between the MSE and the number of epochs showed that the MSE reached a minimum (10−5) when the training was converged after 909 epochs (Figure 14). In Table 4, we present the values of weights and biases in input-hidden layer (wi and bi) and hidden-output layer (wj and bj) by the BP-ANN model used in this study. According to the results calculated with the Garson equation (Equation (10)), contact time appears to be the most influential variables followed by temperature and initial pH. Initial concentration has the least influence on the removal efficiency of MG among the independent variables. This finding is in accordance with the ANOVA results where contact time is deemed significant to the removal efficiency of MG (Table 5).

Figure 14.
The MSE of the number of epochs.
Table 4.
The weights and biases of BP-ANN in input-hidden layer (wi and bi) and hidden-output layer (wj and bj).
Table 5.
Relative significance of input variables.
3.4. Prediction of Optimal Conditions by ANN-PSO
As presented in Table 6, the maximum removal efficiency was 89.50% by using the RSM model corresponding to initial pH of 4.16, temperature of 29.16 °C, contact time of 114.54 min and initial concentration of 619.61 mg/L. The confirmatory experiment was carried out under the following conditions: 4.20 for initial pH, 29.20 °C for temperature, 115.00 min for contact time and 620.00 mg/L for initial concentration. As shown in Figure 15, the performance of ANN-PSO demonstrates that the maximum removal efficiency (92.55%) was achieved after 10 iterations. The optimum conditions obtained by the ANN-PSO model are 4.00 for initial pH, 30.00 °C for temperature, 120.00 min for contact time and 600.00 mg/L for concentration. Based on the process parameters, the confirmatory values of the RSM and ANN-PSO models are 77.37% and 84.87%, respectively. The absolute errors between the confirmatory and predicted results (12.13% and 7.68%) illustrate that the ANN-PSO model has a better predictive capacity than the RSM model.
Table 6.
Comparison of the confirmatory results with predicted results. RSM: Response Surface Methodology; ANN-PSO: Artificial neural network coupled with particle swarm optimization; ANN-GA: Artificial neural network coupled with genetic algorithm.

Figure 15.
The removal efficiency vs. iterations.
3.5. Prediction the Optimal Conditions by ANN-GA
The optimum fitness value was obtained when the iterations of GA stopped after 57 generations as shown in Figure 16. The predicted removal efficiency of MG under the ANN-GA optimized condition was 94.12% when initial pH, temperature, contact time and initial concentration were 5.70, 27.19 °C, 110.62 min and 607.03 mg/L, respectively, whereas the confirmatory removal efficiency (90.72%) was achieved under the conditions of 5.70 for initial pH, 27.20 °C for temperature, 111.00 min for contact time and 600.00 mg/L for initial concentration. A small absolute error (3.40%) between the confirmatory and predicted results reveals a good prediction by using the ANN-GA model.

Figure 16.
Evolvement of fitness with 100 generations.
3.6. Comparison of the Optimum Results with RSM, ANN-PSO and ANN-GA
The coefficient of determination (R2) is used as a criterion in relation to the confirmatory and predicted results, which gives a clear insight into the performance of the models. The value of R2 (0.9999) manifests that the BP-ANN model has a better capability for predicting the removal efficiency of MG than the RSM model (R2 = 0.9813). The predicted optimum conditions by using the RSM, ANN-PSO and ANN-GA models are clearly different. The predicted maximum removal efficiency of MG by using the ANN-GA model is higher than the RSM model by 4.62% and higher than the ANN-PSO model by 1.57%, while the confirmatory experiments show that the relatively higher removal efficiency of MG is obtained by using the ANN-GA model (Table 6). The absolute errors of removal efficiency between the confirmatory and predicted are 12.13% (RSM), 7.68% (ANN-PSO) and 3.40% (ANN-GA), which indicate that the ANN-GA model outperformed the other models presented in this study.
3.7. Equilibrium Isotherms
Adsorption isotherms provide critical information that describes the interaction between the adsorbate and the adsorbent [48]. In the present research, the characteristics of the adsorption were investigated by fitting the experimental data to the Langmuir, Freundlich and Temkin isotherms.
The Langmuir isotherm, as one of the commonly used isotherms, is valid for monolayer adsorption, which takes place onto a homogenous surface containing a finite number of adsorption sites [51]. The linear form of Langmuir isotherm is as follows:
where c0, ce and qe represent the initial concentration of MG (mg/L), the equilibrium concentration of the MG solution (mg/L) and the amount of adsorbate adsorbed per unit mass at equilibrium (mg/g), respectively, qm is the maximum adsorption capacity of the adsorbent (mg/g), KL is the Langmuir constant (L/mg), and RL is a dimensionless constant. The value of RL suggests the adsorption to be irreversible (RL = 0), favorable (0 < RL < 1), linear (RL = 1), or unfavorable (RL > 1) [52].
The Freundlich isotherm, as an empirical equation, assumes that the adsorption takes place on heterogeneous surfaces and the sorption is not restricted to the formation of the monolayer [53]. The linear form of Freundlich isotherm is expressed as follows:
where kf is the Freundlich constant and 1/n represents the heterogeneity factor. A close to zero value of 1/n manifests the rise of heterogeneity on the surface [54], and the value of 1/n between 0 and 1 shows a favorable adsorption process, while 1/n above 1 demonstrates bi-mechanism and cooperative adsorption [55].
The Temkin isotherm assumes that the adsorption energy would decrease linearly with the surface coverage due to the adsorbent-adsorbate interactions [56]. The linear form of Temkin isotherm is given as follows:
where B is the Temkin isotherm energy constant (L/mol) and A is the Temkin isotherm equilibrium binding constant (L/g).
qe = B lnA + B lnce
The values of parameters obtained from the three isotherm models are summarized in Table 7. For the adsorption isotherms, the fitting results manifest that the Langmuir isotherm with R2 of 0.9988 is suitable for describing the adsorption of MG onto nZVZ. Furthermore, its calculated adsorption capacity is in a satisfactory agreement with the experimental adsorption capacity, which further proves the suitability of the Langmuir isotherm model (Figure 17). According to this model, the maximum adsorption capacity was calculated to be 1000.00 mg/g, which was significantly higher than those of the other materials (Table 8). It can be noted that the RL value is between 0.008045 and 0.02375 indicating that the equilibrium adsorption is favorable under the studied conditions. On the basis of the Freundlich isotherm model, the value of 1/n is 0.1277 indicating that the adsorption process is favorable. For the Temkin isotherm model, A and B are 152.19 (L/g) and 92.29 (J/mol), respectively.
Table 7.
The isotherm parameters for adsorption of Malachite Green (MG) onto nanoscale zerovalent zinc (nZVZ).
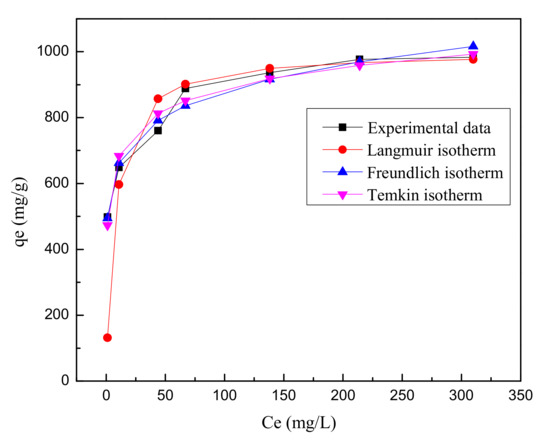
Figure 17.
The isotherms for adsorption of MG onto nZVZ (initial pH = 5, temperature = 25 °C and contact time = 120 min).
Table 8.
Adsorption capacity of MG for different adsorbents.
3.8. Adsorption Kinetics
The kinetics study depicts the uptake rate of an adsorbate, and obviously this rate controls the residence time of adsorption at the solid-solution interface in the whole adsorption process [59]. In the present study, the experimental data were fitted to the pseudo-first-order and pseudo-second-order kinetic models. The pseudo first-order equation can be expressed as follows [60,61]:
where qe and qt are the amount of MG adsorbed (mg/g) on the adsorbent at the equilibrium and at time t (min), respectively, and k1 is the rate constant of adsorption (L/min). The pseudo-second-order equation is given as [62]:
where k2 (g/mg·min) is the rate constant of pseudo-second-order adsorption.
The values of parameters obtained from these two models are presented in Table 9. From the values of R2, it can be concluded that the adsorption data is well fitted to the pseudo-second-order kinetic model. Nevertheless, its calculated removal efficiency has a slight deviation compared with the experimental removal efficiency. As shown in Figure 18, the full removal process reached an equilibrium within 120 min.
Table 9.
The kinetic parameters for the adsorption of MG onto nZVZ.

Figure 18.
The kinetics for adsorption of MG onto nZVZ (initial pH = 5, temperature = 25 °C, initial concentration = 700.00 mg/L).
3.9. Adsorption Thermodynamics
Thermodynamic parameters, i.e., standard free energy (ΔG0), enthalpy (ΔH0) and entropy (ΔS0) provide in-depth information of the heat change, feasibility and spontaneity in an adsorption process [63,64]. The effect of temperature at 293, 298, 303 and 308 K was investigated by the experiments with initial pH of 5, initial MG concentration of 700.00 mg/L and nZVZ dosage of 30 mg. The values of ΔH0, ΔS0 and ΔG0 were calculated from the following Van’t Hoff equation [65]:
where qe is the adsorption capacity at equilibrium (mg/g), ce is the equilibrium concentration (mg/g), Kc is the equilibrium constant, the universal gas constant value (R) is 8.314 J/mol/K and T (K) is the absolute solution temperature.
ΔG0 = −RTlnKc
The results of ΔG0 for the adsorption of MG onto nZVZ in this study were −1.2512, −2.8320, −4.1823 and −5.7419 kJ/mol at 293, 298, 303 and 308 K, respectively (Table 10). The negative values of ΔG0 illustrate that the spontaneous nature of this adsorption process was observed in the range of temperature studied (293 K–308 K). In addition, the values of ΔH0 and ΔS0 were calculated from the slope and intercept of the plot between lnKc and 1/T (Figure 19) [66]. The positive value of ΔH0 implies that the adsorption of MG onto nZVZ is an endothermic process. The value of ΔS0 is positive reflecting the degree randomness at the solid/liquid interface during the adsorption process. The positive values of ΔS0 and ΔH0 show that the interaction of nZVZ with MG is basically entropy driven [67].
Table 10.
The thermodynamic parameters for adsorption of MG onto nZVZ.

Figure 19.
Plot of lnKc vs. 1/T for initial pH of 5, contact time of 120 min and initial concentration of 700.00 mg/L.
4. Conclusions
In this study, the commercially available nZVZ was characterized by means of XRD and XPS. Comparison between the experimental and prediction values obtained by the RSM and the BP-ANN models showed that the BP-ANN model was more accurate based on the value of R2 (0.9999). The maximum removal efficiency of MG under the optimum conditions was obtained with the aid of the RSM, ANN-PSO and ANN-GA models. The mean absolute errors between confirmatory and predicted results for the RSM, ANN-PSO, and ANN-GA models are 12.13%, 7.68% and 3.40%, respectively, which demonstrate that the ANN-GA model manifest a better agreement in predicting the removal efficiency of MG than the other two models. Additionally, both the ANOVA and sensitivity analysis demonstrate that the important process parameter is contact time. The equilibrium data of MG uptake by nZVZ were fitted to Langmuir, Freundlich and Temkin isotherms. The Langmuir model was found to fit the adsorption data well with maximum adsorption capacity of 1000.00 mg/g. The experimental data were well described by the pseudo-second order model (R2 = 0.9463) with higher correlation coefficients than the pseudo-second order model (R2 = 0.9302). From the thermodynamic study, it is concluded that the adsorption of spontaneous nature occurred in the range of temperature studied (293 K–308 K) due to the negative value of ΔG0. The positive value of ΔH0 indicated the endothermic nature of the adsorption interaction. This is in agreement with the results where the MG dye adsorption increases with an increase in temperature. The positive value of ΔS0 reflects the affinity of the adsorbate for the adsorbent and the increased randomness at the solid-solution interface during the adsorption process. In conclusion, nZVZ can be a promising adsorbent for the removal of MG from aqueous solutions. Further studies should investigate the regeneration efficiency of the nZVZ for the removal of MG or other dyes (e.g., Methyl orange, Methylene Blue) as well as the removal efficiency of dyes via the permeable reactive barrier in the laboratory.
Acknowledgments
This work was supported by the National Natural Science Foundation of China under Grant No. 21367009, the National 111 Project of China under Grand No. D17016 and the Postgraduate Educational Innovation Project of Guizhou Province under project No. GZS [2016] 04.
Author Contributions
Jiwei Hu, Wenqian Ruan, Xuedan Shi and Xionghui Wei conceived and designed the experiments, performed the experiments and wrote the paper; Yu Hou, Mingyi Fan and Rensheng Cao analyzed the data.
Conflicts of Interest
The authors declare no conflict of interest.
References
- Crini, G.; Peindy, H.N.; Gimbert, F.; Robert, C. Removal of C.I. Basic Green 4 (Malachite Green) from aqueous solutions by adsorption using cyclodextrin-based adsorbent: Kinetic and equilibrium studies. Sep. Purif. Technol. 2007, 53, 97–110. [Google Scholar] [CrossRef]
- Hamdaouia, O.; Saoudi, F.; Chiha, M.; Naffrechoux, E. Sorption of malachite green by a novel sorbent, dead leaves of plane tree: Equilibrium and kinetic modeling. Chem. Eng. J. 2008, 143, 73–84. [Google Scholar] [CrossRef]
- Khan, T.A.; Ali, I.; Singh, V.V.; Sharma, S. Utilization of Fly ash as Low-Cost Adsorbent for the Removal of Methylene Blue, Malachite Green and Rhodamine B Dyes from Textile Wastewater. J. Environ. Prot. Sci. 2009, 3, 11–22. [Google Scholar]
- Carneiro, J.O.; Samantilleke, A.P.; Parpot, P.; Fernandes, F.; Pastor, M.; Correia, A.; Luís, E.A.; Chivanga Barros, A.A.; Teixeira, V. Visible light induced enhanced photocatalytic degradation of industrial effluents (Rhodamine B) in aqueous media using TiO2 nanoparticles. J. Nanomater. 2016, 51, 21. [Google Scholar] [CrossRef]
- Oualid, H.; Mahdi, C.; Emmanuel, N. Ultrasound-assisted removal of malachite green from aqueous solution by dead pine needles. Ultrason. Sonochem. 2008, 15, 799–807. [Google Scholar]
- Srivastava, S.; Sinha, R.; Roy, D. Toxicological effects of malachite green. Aquat. Toxicol. 2004, 66, 319–329. [Google Scholar] [CrossRef] [PubMed]
- Berberidou, C.; Poulios, I.; Xekoukoulotakis, N.P.; Mantzavinos, D. Sonolytic, photocatalytic and sonophotocatalytic degradation of malachite green in aqueous solutions. Appl. Catal. B 2007, 74, 63–72. [Google Scholar] [CrossRef]
- Panandiker, A.; Fernandes, C.; Rao, T.K.G.; Rao, K.V.K. Morphological transformation of Syrian-hamster embryo cells in primary culture by Malachite Green correlates well with the evidence for formation of reactive free radicals. Cancer Lett. 1993, 74, 31–36. [Google Scholar] [CrossRef]
- Frontistis, Z.; Hapeshi, E.; Kassinos, D.F.; Mantzavinos, D. Ultraviolet-activated persulfate oxidation of methyl orange: A comparison between artificial neural networks and factorial design for process modelling. Photochem. Photobiol. Sci. 2015, 14, 528–535. [Google Scholar] [CrossRef] [PubMed]
- Shi, B.Y.; Li, G.H.; Wang, D.S.; Feng, C.H.; Tang, H.X. Removal of direct dyes by coagulation: The performance of preformed polymeric aluminum species. J. Hazard. Mater. 2007, 143, 567–574. [Google Scholar] [CrossRef] [PubMed]
- Robinson, I.M.; McMullan, G.; Marchant, R.; Nigam, P. Remediation of dyes in textile effluent: A critical review on current treatment technologies. Bioresour. Technol. 2001, 77, 247–255. [Google Scholar] [CrossRef]
- Ahmad, M.A.; Alrozi, R. Removal of malachite green dye from aqueous solution using rambutan peel-based activated carbon: Equilibrium, kinetic and thermodynamic studies. Chem. Eng. J. 2011, 171, 510–516. [Google Scholar] [CrossRef]
- Ahmad, M.A.; Alrozi, R. Optimization of preparation conditions for mangosteen peel-based activated carbons for the removal of Remazol Brilliant Blue R using response surface methodology. Chem. Eng. J. 2010, 165, 883–890. [Google Scholar] [CrossRef]
- Li, L.Y.; Hu, J.W.; Shi, X.D.; Fan, M.Y.; Luo, J.; Wei, X.H. Nanoscale zero-valent metals: A review of synthesis, characterization, and applications to environmental remediation. Environ. Sci. Pollut. Res. 2016, 18, 17880–17900. [Google Scholar] [CrossRef] [PubMed]
- Naddeo, J.J.; Ratti, M.; O’Malley, S.M.; Griepenburg, J.C.; Bubb, D.M.; Klein, E.A. Antibacterial Properties of Nanoparticles: A comparative review of chemically synthesized and laser-generated particles. Adv. Sci. 2015, 7, 1044–1057. [Google Scholar] [CrossRef]
- Mir, N.; Salavati-Niasari, M.; Davar, F. Preparation of ZnO nano-flowers and Zn glycerolate nanoplates using inorganic precursors via a convenient rout and application in dye sensitized solar cells. Chem. Eng. J. 2012, 181–182, 779–789. [Google Scholar] [CrossRef]
- Zhu, L.P.; Wang, L.F.; Xue, F.; Chen, L.B.; Fu, J.Q.; Feng, X.L.; Li, T.F.; Wang, Z.L. Piezo-phototronic effect enhanced flexible solar cells based on n-ZnO/p-SnS core-shell nanowire array. Adv. Sci. 2017, 4, 1600185. [Google Scholar] [CrossRef] [PubMed]
- Khan, M.S.; Ahmad, A.; Bangash, F.U.K.; Shah, S.S.; Khan, P. Removal of basic dye from aqueous solutions using nano scale zero valent iron (NZVI) as adsorbent. J. Chem. Soc. Pak. 2013, 35, 744–748. [Google Scholar]
- Zhuang, Y.; Ahn, N.; Luthy, A. Debromination of polybrominated diphenyl ethers by nanoscale zerovalent iron: Pathways, kinetics, and reactivity. Environ. Sci. Technol. 2010, 44, 8236–8242. [Google Scholar] [CrossRef] [PubMed]
- Hernandez, R.; Zappi, M.; Kuo, C.H. Chloride Effect on TNT Degradation by Zerovalent Iron or Zinc during Water Treatment. Environ. Sci. Technol. 2004, 38, 5157–5163. [Google Scholar] [CrossRef] [PubMed]
- Shojaeimehr, T.; Rahimpour, F.; Khadivi, M.A.; Sadeghi, M.A. Modeling study by response surface methodology (RSM) and artificial neural network (ANN) on Cu2+ adsorption optimization using light expended clay aggregate (LECA). J. Ind. Eng. Chem. 2014, 20, 870–880. [Google Scholar] [CrossRef]
- Nourouzi, M.M.; Chuah, T.G.; Choong, T.S. Optimisation of reactive dye removal by sequential electrocoagulation–flocculation method: Comparing ANN and RSM prediction. Water Sci. Technol. 2011, 63, 984–994. [Google Scholar] [CrossRef] [PubMed]
- Zhang, Y.; Pan, B. Modeling batch and column phosphate removal by hydrated ferric oxide-based nanocomposite using response surface methodology and artificial neural network. Chem. Eng. J. 2014, 249, 111–120. [Google Scholar] [CrossRef]
- Peralta, D.; Triguero, I.; Sanchez-Reillo, R.; Herrera, F.; Benitez, J.M. Fast fingerprint identification for large data bases. Pattern Recogn. 2014, 47, 588–602. [Google Scholar] [CrossRef]
- Kwon, S.K.; Jung, H.S.; Baek, W.K.; Kim, D. Classification of forest vertical structure in south Korea from aerial orthophoto and lidar data using an artificial neural network. Appl. Sci. 2017, 7, 1046. [Google Scholar] [CrossRef]
- Shi, X.D.; Ruan, W.Q.; Hu, J.W.; Fan, M.Y.; Cao, R.S.; Wei, X.H. Optimizing the removal of rhodamine B in aqueous solutions by reduced graphene oxide-supported nanoscale zerovalent iron (nZVI/rGO) using an artificial neural network-genetic algorithm (ANN-GA). Nanomaterials 2017, 7, 134. [Google Scholar] [CrossRef] [PubMed]
- Rajendra, M.; Jena, P.C.; Raheman, H. Prediction of optimized pretreatment process parameters for biodiesel production using ANN and GA. Fuel 2009, 88, 868–875. [Google Scholar] [CrossRef]
- Pedram, G.; Member, S.; Benediktsson, J.A. Feature selection based on hybridization of genetic algorithm and particle swarm optimization. IEEE Geosci. Remote Sens. Lett. 2014, 12, 309–313. [Google Scholar]
- Ghaedi, A.M.; Ghaedi, M.; Pouranfard, A.R.; Ansari, A.; Avazzadeh, Z.; Vafaei, A.; Tyagi, I.; Agarwal, S.; Gupta, V.K. Adsorption of Triamterene on multi-walled and single-walled carbon nanotubes: Artificial neural network modeling and genetic algorithm optimization. J. Mol. Liq. 2016, 216, 654–665. [Google Scholar] [CrossRef]
- Ahmadi, M.A.; Zendehboudi, S.; Lohi, A.; Elkamel, A.; Chatzis, I. Reservoir permeability prediction by neural networks combined with hybrid genetic algorithm and particle swarm optimization. Geophys. Prospect. 2013, 61, 582–598. [Google Scholar] [CrossRef]
- Evans, M. Optimization of Manufacturing Processes: A Response Surface Approach; Taylor & Francis Group: Oxford, UK, 2003. [Google Scholar]
- Lek, S.; Guégan, J.F. Artificial neural networks as a tool in ecological modelling, an introduction. Ecol. Model. 1999, 120, 65–73. [Google Scholar] [CrossRef]
- Gupta, N. Artificial neural network. Netw. Complex Syst. 2013, 1522, 36–62. [Google Scholar]
- Lópeza, M.E.; Renea, E.R.; Bogerc, Z.; Veigaa, M.C.; Kennesa, C. Modelling the removal of volatile pollutants under transient conditions in a two-stage bioreactor using artificial neural networks. J. Hazard. Mater. 2017, 324, 100–109. [Google Scholar] [CrossRef] [PubMed]
- Montano, J.J.; Palmer, A. Numeric sensitivity analysis applied to feedforward neural networks. Neural Comput. Appl. 2003, 12, 119–125. [Google Scholar] [CrossRef]
- Aleboyeh, A.; Kasiri, M.B.; Olya, M.E.; Aleboyeh, H. Prediction of azo dye decolorization by UV/H2O2 using artificial neural networks. Dye. Pigment. 2008, 77, 288–294. [Google Scholar] [CrossRef]
- Das, G.; Pattnaik, P.K.; Padhy, S.K. Artificial neural network trained by particle swarm optimization for non-linear channel equalization. Expert Syst. Appl. 2014, 41, 3491–3496. [Google Scholar] [CrossRef]
- Assareh, E.; Behrang, M.A.; Assari, M.R.; Ghanbarzadeh, A. Application of PSO (particle swarm optimization) and GA (genetic algorithm) techniques on demand estimation of oil in Iran. Energy 2010, 35, 5223–5229. [Google Scholar] [CrossRef]
- Soesanti, I.; Syahputra, R. Batic production process optimization using particle swarm optimization method. J. Theor. Appl. Inf. Technol. 2016, 86, 272–278. [Google Scholar]
- Dil, E.A.; Ghaedi, M.; Asfaram, A.; Mehrabi, F.; Bazrafshana, A.A.; Ghaedi, A.M. Trace determination of safranin O dye using ultrasound assisted dispersive solid-phase micro extraction: Artificial neural network-genetic algorithm and response surface methodology. Ultrason. Sonochem. 2016, 33, 129–140. [Google Scholar] [CrossRef] [PubMed]
- Bagheria, M.; Mirbagheria, S.A.; Bagherib, Z.; Kamarkhanica, A.M. Modeling and optimization of activated sludgebulking for a real wastewater treatment plant using hybrid artificial neural networks-genetic algorithm approach. Process Saf. Environ. Prot. 2015, 95, 12–25. [Google Scholar] [CrossRef]
- Kundua, P.; Paul, V.; Kumara, V.; Mishra, I.M. Formulation development, modeling and optimization of emulsification process using evolving RSM coupled hybrid ANN-GA framework. Chem. Eng. Res. Des. 2015, 104, 773–790. [Google Scholar] [CrossRef]
- Morozov, I.G.; Belousova, O.V.; Ortega, D.; Mafina, M.K.; Kuznetcov, M.V. Structural, optical, XPS and magnetic properties of Zn particles capped by ZnO nanoparticles. J. Alloys Compd. 2015, 633, 237–245. [Google Scholar] [CrossRef]
- Qin, J.L.; Li, R.; Lu, C.Y.; Jiang, Y.; Tang, H.; Yang, X.F. Ag/ZnO/graphene oxide heterostructure for the removal of rhodamine by thesynergistic adsorption-degradation effects. Ceram. Int. 2015, 41, 4231–4237. [Google Scholar] [CrossRef]
- Biesinger, M.C.; Laua, L.W.M.; Gerson, A.R.; Smart, R.S.C. Resolving surface chemical states in XPS analysis of first row transition metals, oxides and hydroxides: Sc, Ti, V, Cu and Zn. Appl. Surf. Sci. 2010, 257, 887–898. [Google Scholar] [CrossRef]
- Fan, M.Y.; Li, T.J.; Hu, J.W.; Cao, R.S.; Wu, Q.; Wei, X.H.; Li, L.Y.; Shi, X.D.; Ruan, W.Q. Synthesis and characterization of reduced graphene oxide-supported nanoscale zero-valent iron (nZVI/rGO) composites used for Pb(II) removal. Materials 2016, 9, 687. [Google Scholar] [CrossRef] [PubMed]
- Chenna, M.; Messaoudi, K.; Drouiche, N.; Lounici, H. Study and modeling of the organophosphorus compound degradation by photolysis of hydrogen peroxide in aqueous media by using experimental response surface design. J. Ind. Eng. Chem. 2016, 33, 307–315. [Google Scholar] [CrossRef]
- Ofomaja, A. Equilibrium studies of copper ion adsorption onto palm kernel fibre. J. Environ. Manag. 2010, 91, 1491–1499. [Google Scholar] [CrossRef] [PubMed]
- Mittal, A. Adsorption kinetics of removal of a toxic dye, Malachite Green, from wastewater by using hen feathers. J. Hazard. Mater. 2006, 133, 196–202. [Google Scholar] [CrossRef] [PubMed]
- Dahri, M.K.; Kooh, M.R.R.; Lim, L.B.L. Water remediation using low cost adsorbent walnut shell for removal of malachite green: 1 equilibrium, kinetics, thermodynamic and regeneration studies. J. Environ. Chem. Eng. 2015, 2, 1434–1444. [Google Scholar] [CrossRef]
- Dastkhoon, M.; Ghaedi, M.; Asfaram, A.; Goudarzi, A.; Langroodi, S.M.; Tyagi, I.; Agarwal, S.; Gupta, V.K. Ultrasound assisted adsorption of malachite green dye onto ZnS: Cu-NPAC: Equilibrium isotherms and kinetic studies-Response surface optimization. Sep. Purif. Technol. 2015, 156, 780–788. [Google Scholar] [CrossRef]
- Dada, A.O.; Olalekan, A.P.; Olatunya, A.M.; Dada, O. Langmuir, Freundlich, Temkin and Dubinin-Radushkevich isotherms studies of equilibrium sorption of Zn2+ unto phosphoric acid modified rice husk. J. Appl. Chem. 2012, 3, 38–45. [Google Scholar]
- Mohammadi, M.; Hassani, A.J.; Mohamed, A.R.; Najafpour, G.D. Removal of Rhodamine B from aqueous solution using palm shell-based activated carbon: Adsorption and kinetic studies. J. Chem. Eng. Data 2010, 55, 5777–5785. [Google Scholar] [CrossRef]
- Dubey, R.; Bajpai, J.; Bajpai, A.K. Green synthesis of graphene sand composite (GSC) as novel adsorbent for efficient removal of Cr (VI) ions from aqueous solution. J. Water Process Eng. 2015, 5, 83–94. [Google Scholar] [CrossRef]
- Fytianos, K.; Voudrias, E.; Kokkalis, E. Sorption–desorption behavior of 2,4-dichloriphenol by marine sediments. Chemosphere 2000, 40, 3–6. [Google Scholar] [CrossRef]
- Agarwal, S.; Tyagi, I.; Gupta, V.K.; Ghasemi, N.; Shahivand, M.; Ghasemi, M. Kinetics, equilibrium studies and thermodynamics of methylene blue adsorption on Ephedra strobilacea saw dust and modified using phosphoric acid and zinc chloride. J. Mol. Liq. 2016, 218, 208–218. [Google Scholar] [CrossRef]
- Lee, Y.C.; Kim, E.J.; Yanga, J.W.; Shin, H.J. Removal of malachite green by adsorption and precipitation using aminopropyl functionalized magnesium phyllosilicate. J. Hazard. Mater. 2011, 192, 62–70. [Google Scholar] [CrossRef] [PubMed]
- Ngah, W.S.W.; Ariff, N.F.M.; Hashim, A.; Hanafiah, M.A.K.M. Malachite green adsorption onto chitosan coated bentonite beads: Isotherms, kinetics and mechanism. Clean Soil Air Water 2010, 38, 394–400. [Google Scholar] [CrossRef]
- Sun, X.F.; Wang, S.G.; Liu, X.W.; Gong, W.X.; Bao, N.; Gao, B.Y.; Zhang, H.Y. Biosorption of Malachite Green from aqueous solutions onto aerobic granules: Kinetic and equilibrium studies. Bioresour. Technol. 2008, 99, 3475–3483. [Google Scholar] [CrossRef] [PubMed]
- Lagergren, S. Zur Theorie Der Sogenannten Adsorption Gelöster Stoffe. Bihang till K Svenska Vet-Akad. Handlingar 1898, 24, 1–39. [Google Scholar]
- Ho, Y.S.; McKay, G. Sorption of dye from aqueous solution by peat. Chem. Eng. J. 1998, 70, 115–124. [Google Scholar] [CrossRef]
- Ho, Y.S.; McKay, G. Pseudo-second order model for sorption processes. Process Biochem. 1999, 4, 451–465. [Google Scholar] [CrossRef]
- Fan, M.Y.; Li, T.J.; Hu, J.W.; Cao, R.S.; Wei, X.H.; Shi, X.D.; Ruan, W.Q. Artificial neural network modeling and genetic algorithm optimization for cadmium removal from aqueous solutions by reduced graphene oxide-supported nanoscale zero-valent iron (nZVI/rGO) composites. Materials 2017, 10, 544. [Google Scholar] [CrossRef] [PubMed]
- Shenvi, S.S.; Isloor, A.M.; Ismail, A.F.; Shilton, S.J.; Ahmed, A.A. Humic Acid Based Biopolymeric Membrane for Effective Removal of Methylene Blue and Rhodamine B. Ind. Eng. Chem. Res. 2015, 4, 4965–4975. [Google Scholar] [CrossRef]
- Tan, I.; Ahmad, A.; Hameed, B. Adsorption isotherms, kinetics, thermodynamics and desorption studies of 2,4,6-trichlorophenol on oil palmempty fruit bunch-based activated carbon. J. Hazard. Mater. 2009, 164, 473–482. [Google Scholar] [CrossRef] [PubMed]
- Romero-Gonza’lez, J.; Peralta-Videa, J.R.; Rodrı’guez, E.; Ramirez, S.L.; Gardea-Torresdey, J.L. Determination of thermodynamic parameters of Cr(VI) adsorption from aqueous solution onto Agave lechuguilla biomass. J. Chem. Thermodyn. 2005, 37, 343–347. [Google Scholar] [CrossRef]
- Simone, M.S.; Klicia, A.S.; Roberta, C.; Roland, V.; Christian, S.; Wim, D.G.; Antonio, J.A.M. Adsorption of carotenes and phosphorus from palm oil onto acid activated bleaching earth: Equilibrium, kinetics and thermodynamics. J. Food Eng. 2013, 118, 341–349. [Google Scholar]
© 2018 by the authors. Licensee MDPI, Basel, Switzerland. This article is an open access article distributed under the terms and conditions of the Creative Commons Attribution (CC BY) license (http://creativecommons.org/licenses/by/4.0/).