Abstract
This paper presents a quantitative estimation of anti-icing asphalt mixture snow-melting performance and provides the application guidance for the mixture under study. The regression model of snowmelt quality evolution was established and experimentally verified for different values of snowfall intensity, temperature and blending content of anti-icing filler. The deicing performance of anti-icing asphalt mixtures was evaluated via the impact load tests. The results obtained indicate that the application temperatures of the anti-icing asphalt mixture should exceed −10 °C for moderate or light snow conditions and exceed 0 °C for heavy or blizzard snow conditions. A linear dependence between the snowmelt quality of anti-icing asphalt mixture and time is observed for all tested values of snowfall intensity and temperature. On the other hand, under the same snowfall intensity conditions, a two- to threefold increase of the melting rate with temperature is observed. The available records for the last 30 years in different regions under study concerning variation ranges of three meteorological factors (namely, the extremely minimum temperature, snowfall intensity and the coldest month’s average temperature), the most suitable temperature for application of anti-icing asphalt pavement was identified for each particular region.
1. Introduction
For the past years, the natural environment has experienced a severe deterioration worldwide, with frequent occurrence of extreme weather events, including snow appearance in unusual seasons and locations. Consequently, ice formed by melted and refrozen snow on roads deteriorates their skid resistance, i.e., the force developed when a tire that is prevented from rotating slides along the pavement surface, which makes the motion of vehicles very unsteady, especially during braking or maneuvering [1]. Given this, anti-icing asphalt mixtures have been applied in Switzerland, Austria, the United States, and some other countries for the construction of snow- and ice-melting roads, which are also referred to as self-ice-melting pavements [2,3,4,5,6]. The engineering experience in the United States, Japan, Germany, and some other countries has shown that the traffic accident rate related to pavement icing or snowing in winter can be reduced by 91.4% in the case of pavement mixing with the proposed anti-icing filler [7,8]. Thus, snow- and ice-induced traffic congestion can be effectively alleviated to ensure a safer and smoother ride of vehicles.
According to the “Evaluation Test Method Manual” sponsored by the US Strategic Highway Research Program, three methods were introduced for testing the deicing performance—ice melting test, ice penetration test and ice undercutting test [9,10,11]—and these tests have already been improved by some researchers [12,13,14]. Although the shear, disbandment, and scraping tests have been developed, and these tests have shown a realistic representation of field parameters, their results are not yet standardized [15,16,17,18]. Many researchers evaluate the ice-breaking effect of the self-ice-melting pavements by measuring the numerical value of swing, also referred to as British Pendulum Number (BPN), which is widely used for skid resistance assessment [5,19]. When exploring the salt dissolving-out progression in the anti-icing asphalt mixtures, the conductivity test is applied [20]. Japanese scholars developed an experimental vehicle with built-in drums, which can be used to evaluate the effect of tires with different textures and anti-freezing agent on snow- and ice-frozen roads [21]. The Pavement Research Center of Chang’an University, Xi’an, China, has developed a pavement ice-melting simulation tester, which can simulate the ice-melting performance of the snow-melting pavement [22]. Scholars from Harbin Institute of Technology, Harbin, China, developed an adhesion force measurement system, which allows measuring the adhesion between ice and asphalt pavement [23].
In general, some ice-melting tests fail to separate the entire melted portion from the remaining ice. In the studies of salt dissolution, certain problems with the variation range identification arose when the salt dissolving-out amount reached a certain high value. Some experimental tools being applicable only to particular areas, the respective results are reduced to indirect qualitative evaluation of the snow-melting ability. There are scarce data on the climatic zones of anti-icing asphalt mixture application. The respective evaluation techniques either involve the direct observation methods to evaluate the ice-breaking effect or evaluate the melting of self-ice-melting pavements visually and indirectly. The modified ice penetration test, which is used for measuring deicer performance based on the penetration capacity as a function of time, fails to measure the theoretical or extended time of ice penetration capability [24]. Furthermore, the modified ice undercutting test measures the deicer performance based on the undercut area but fails to measure the ice undercutting capability for the theoretical or extended time instants [25].
Given the above, the developed experimental instruments should be able to separate the melted portion from remaining snow and determine the melting quality more accurately, evaluating the relationship between melting quality and time. The anti-freezing performance of anti-icing asphalt mixture can be evaluated by measuring the loading times. Based on the analysis of qualitative changes of snow on the road invoked by the effects of road loads, snow intensity, filler dosage and temperature, this study advances a regression model of the melting quality evolution, verifies the regression model, evaluates the snowmelt performance, identifies the climate zones and provides recommendations on application of self-ice-melting pavements.
2. Materials and Experiment
2.1. Materials
2.1.1. Asphalt and Aggregate
Anti-icing asphalt mixtures are primarily used in low-temperature regions, which require a good stability at a low temperature. Hence, Styrene Butadiene Styrene Block Polymer (SBS) modified asphalt was used in this study, as the main parameters listed in Table 1.
Table 1.
Styrene Butadiene Styrene Block Polymer (SBS) modified asphalt technology index.
Chloride ions, the anti-icing filler, will accelerate the peeling of asphalt. To ensure the mixture’s adhesion and the pavement’s performance, the adhesion of asphalt and aggregate is up to level 5 and water absorption of aggregate is less than 1%. The coarse aggregates were the diorites from Shangzhou City in Shaanxi Province, China and the fine aggregates were limestones from Pucheng City in Shaanxi Province, China. The mineral powders were ground limestones provided by Jinghe Stone Factory in Beijing, China. Technical details are shown in Table 2, Table 3 and Table 4.
Table 2.
Coarse aggregate test results.
Table 3.
Fine aggregate test results.
Table 4.
Mineral powder test results.
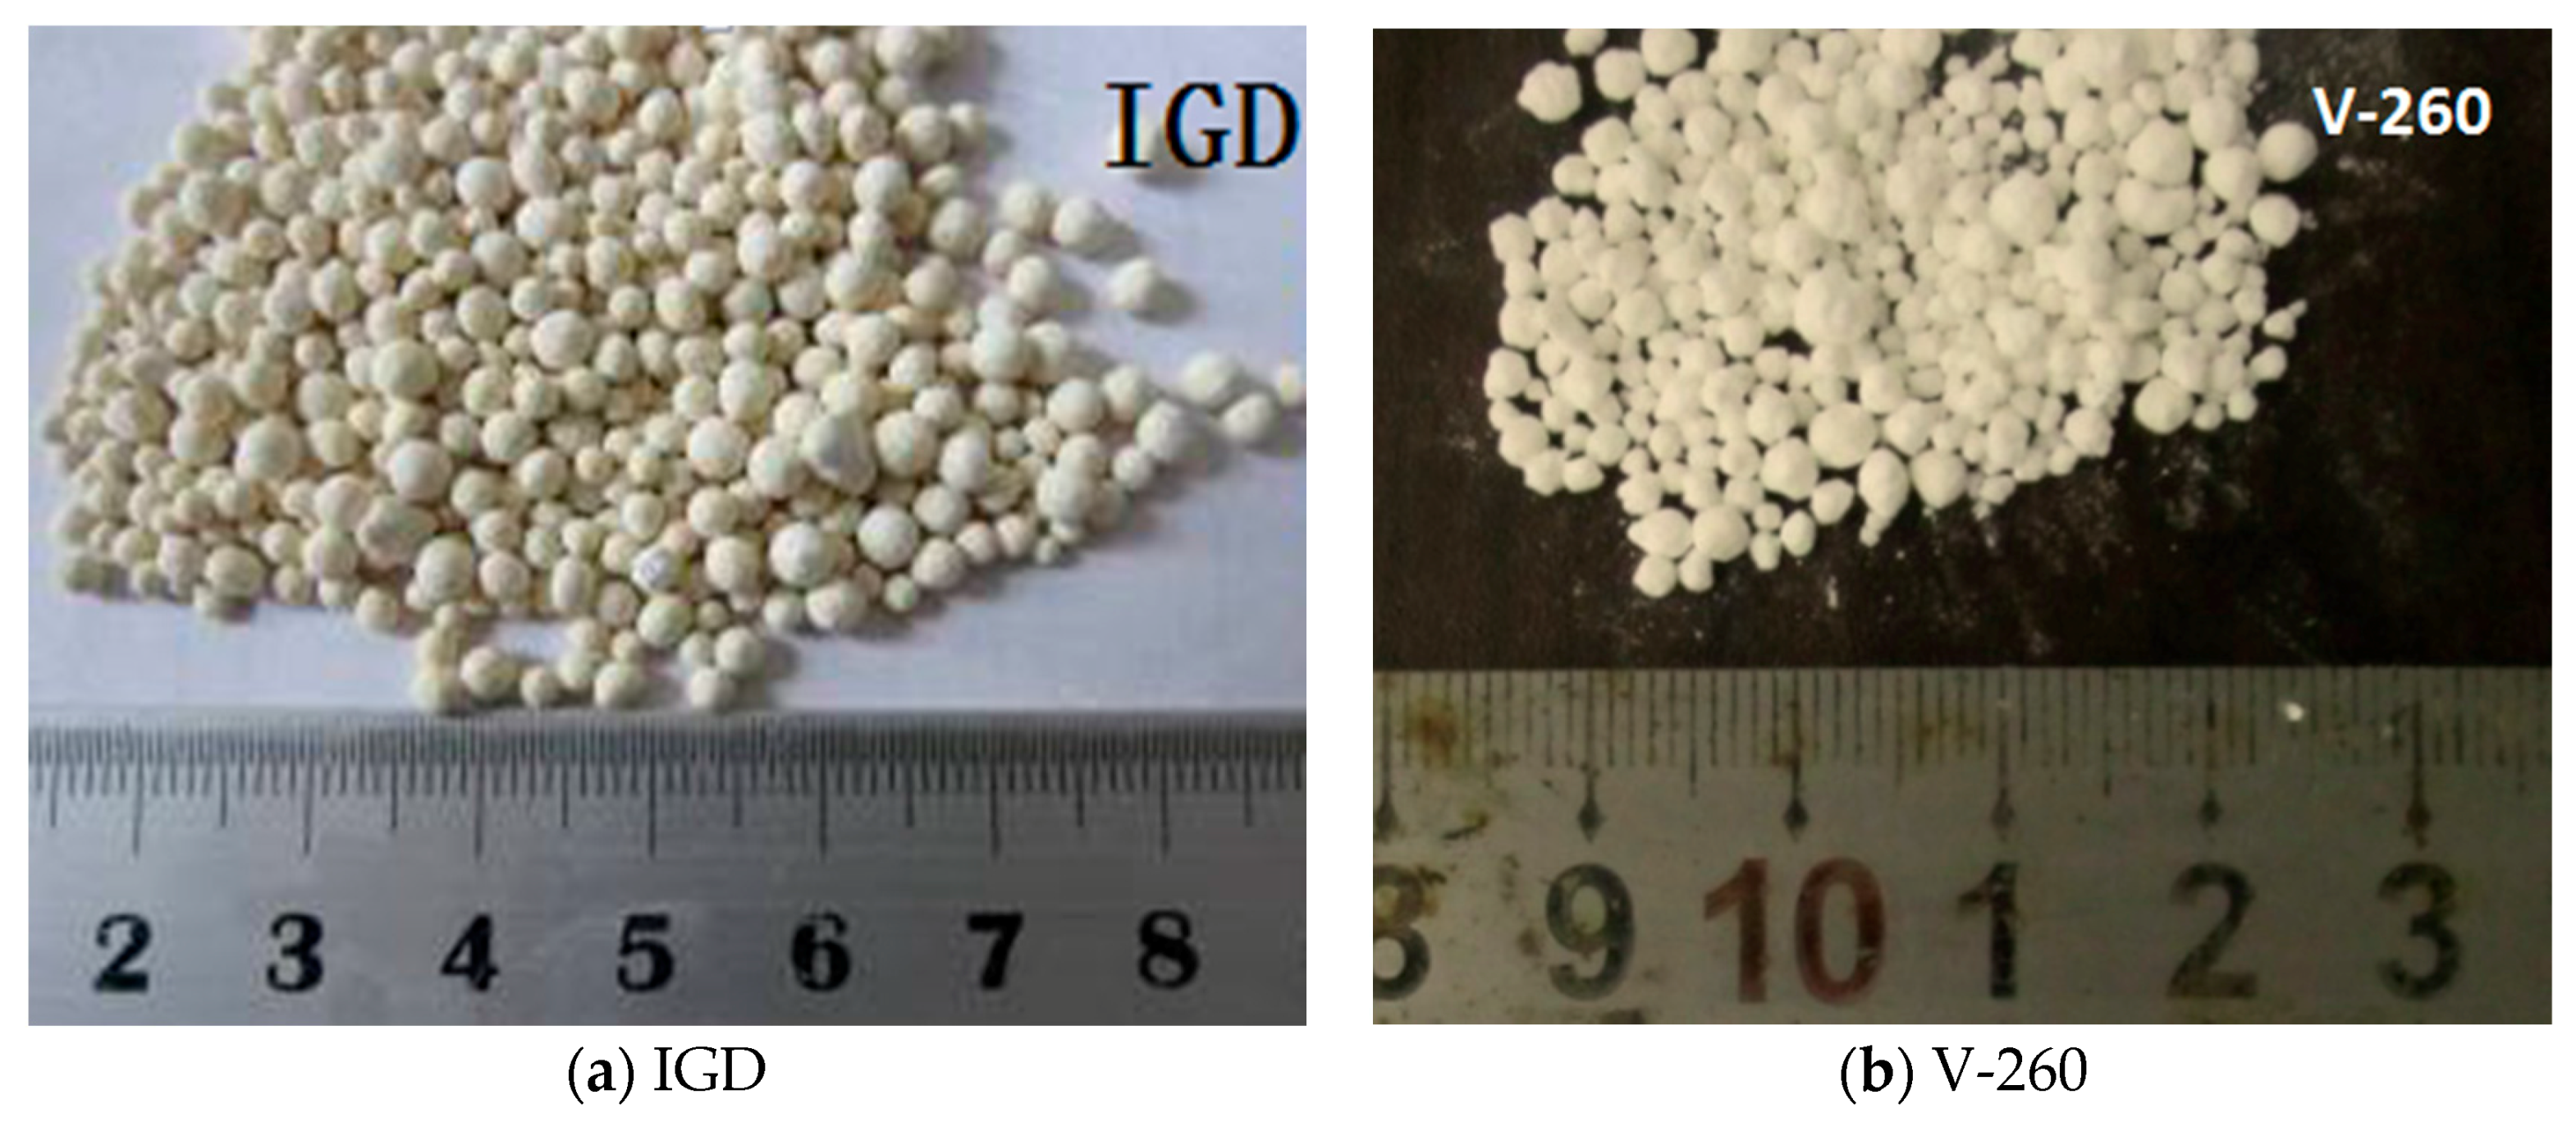
2.1.2. Anti-Icing Filler
V-260 is the product of Switzeand Verglimit Anti-Icing Road Surface Limited Company, Geneva, Switzerland and Iceguard (IGD) is anti-icing developed by Chang’an University of China. The melting points are both 260 °C the major constituent is CaCl2, the salinity contents of IGD and V-260 are 58.8% and 94.6% respectively, the cost of IGD is 60% as that of V-260, the appearances are both white granules, as shown in Figure 1. The specific physical performance indicators are shown in Table 5.
Figure 1.
The particle form of the anti-icing material.
Table 5.
Physical performance index.
2.2. Anti-Icing Asphalt Mixture
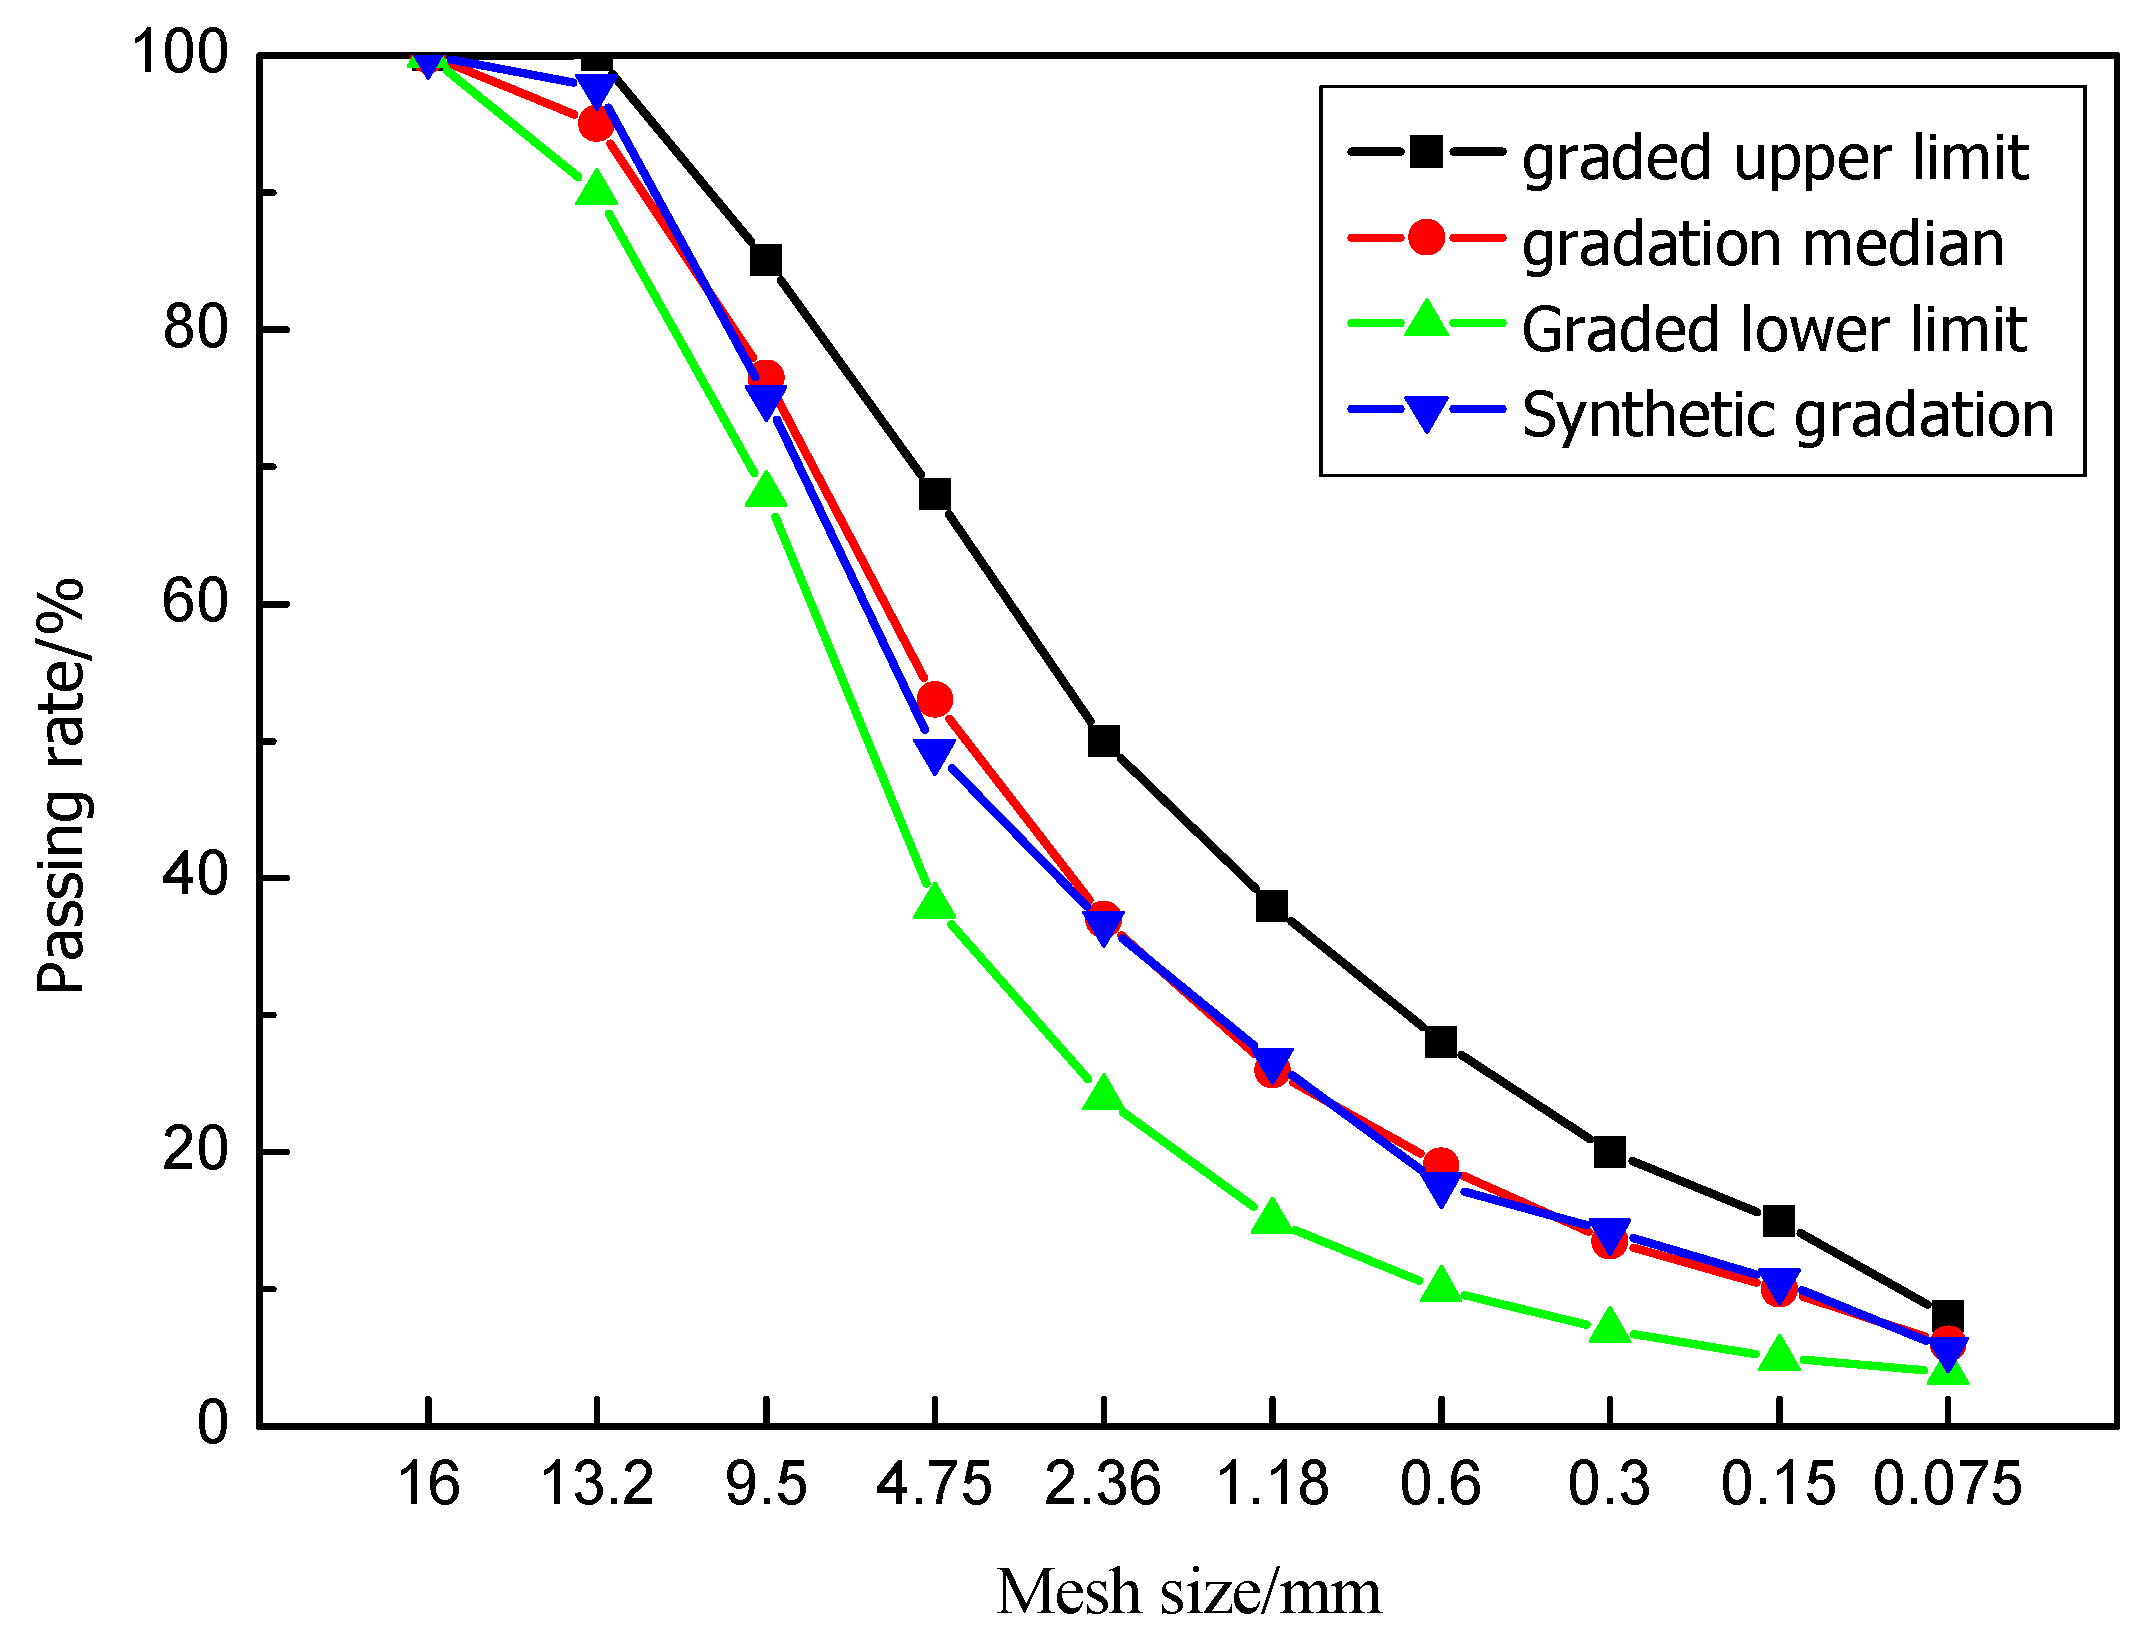
2.2.1. Design of Ingredient
Conventional asphalt mixture used AC-13, which is widely used as the wearing course in China, and satisfied the specifications set forth by Chinese Ministry of Transportation (MOT), as shown in Figure 2.
Figure 2.
Aggregate gradation figure.
With the method of Marshall design, the void volume was 3–6% and the physico-mechanical index was calculated. Through optimization, the asphalt–aggregate ratio was 4.8% and the amount of mineral powder was 5 wt %. V-260 and IGD were added as additive to conventional asphalt mixture to increase its density, accounting for 5 wt % of the asphalt mixture, and other parameters were the same as those of conventional asphalt mixture. The experimental results are depicted in Table 6 and the pavement performances are described in Table 7.
Table 6.
Marshall testing results of asphalt mixture added.
Table 7.
Test results of asphalt mixture performance.
Asphalt mixture type and asphalt-aggregate ratio are measured as test variables in this section. Many characteristic parameters were measured, such as void volume, aggregate voids filled with asphalt, voids in mineral aggregate, Marshall stability, flow value, residual stability, freeze-thaw splitting strength, dynamic stability, maximum flexural-tensile strain and so on. There are 81 specimens in total.
Table 7 compares with the water stability, high-temperature stability and low-temperature crack resistance between conventional asphalt mixture and the anti-icing asphalt mixture. It can be observed that the addition of anti-icing filter reduced the mixture’s residual stability and tensile strength ratio and simultaneously enhanced the maximum flexural-tensile strain. The residual stability and freeze-thaw splitting strength ratio of anti-icing asphalt mixture with IGD are slightly larger than anti-icing asphalt mixture with V-260. The reason is that the salt content of IGD is lower than that of V-260, and the salt is soaked in water, the change of void volume of anti-icing asphalt mixture with IGD is relatively small, and it is denser than anti-icing asphalt mixture with V-260.
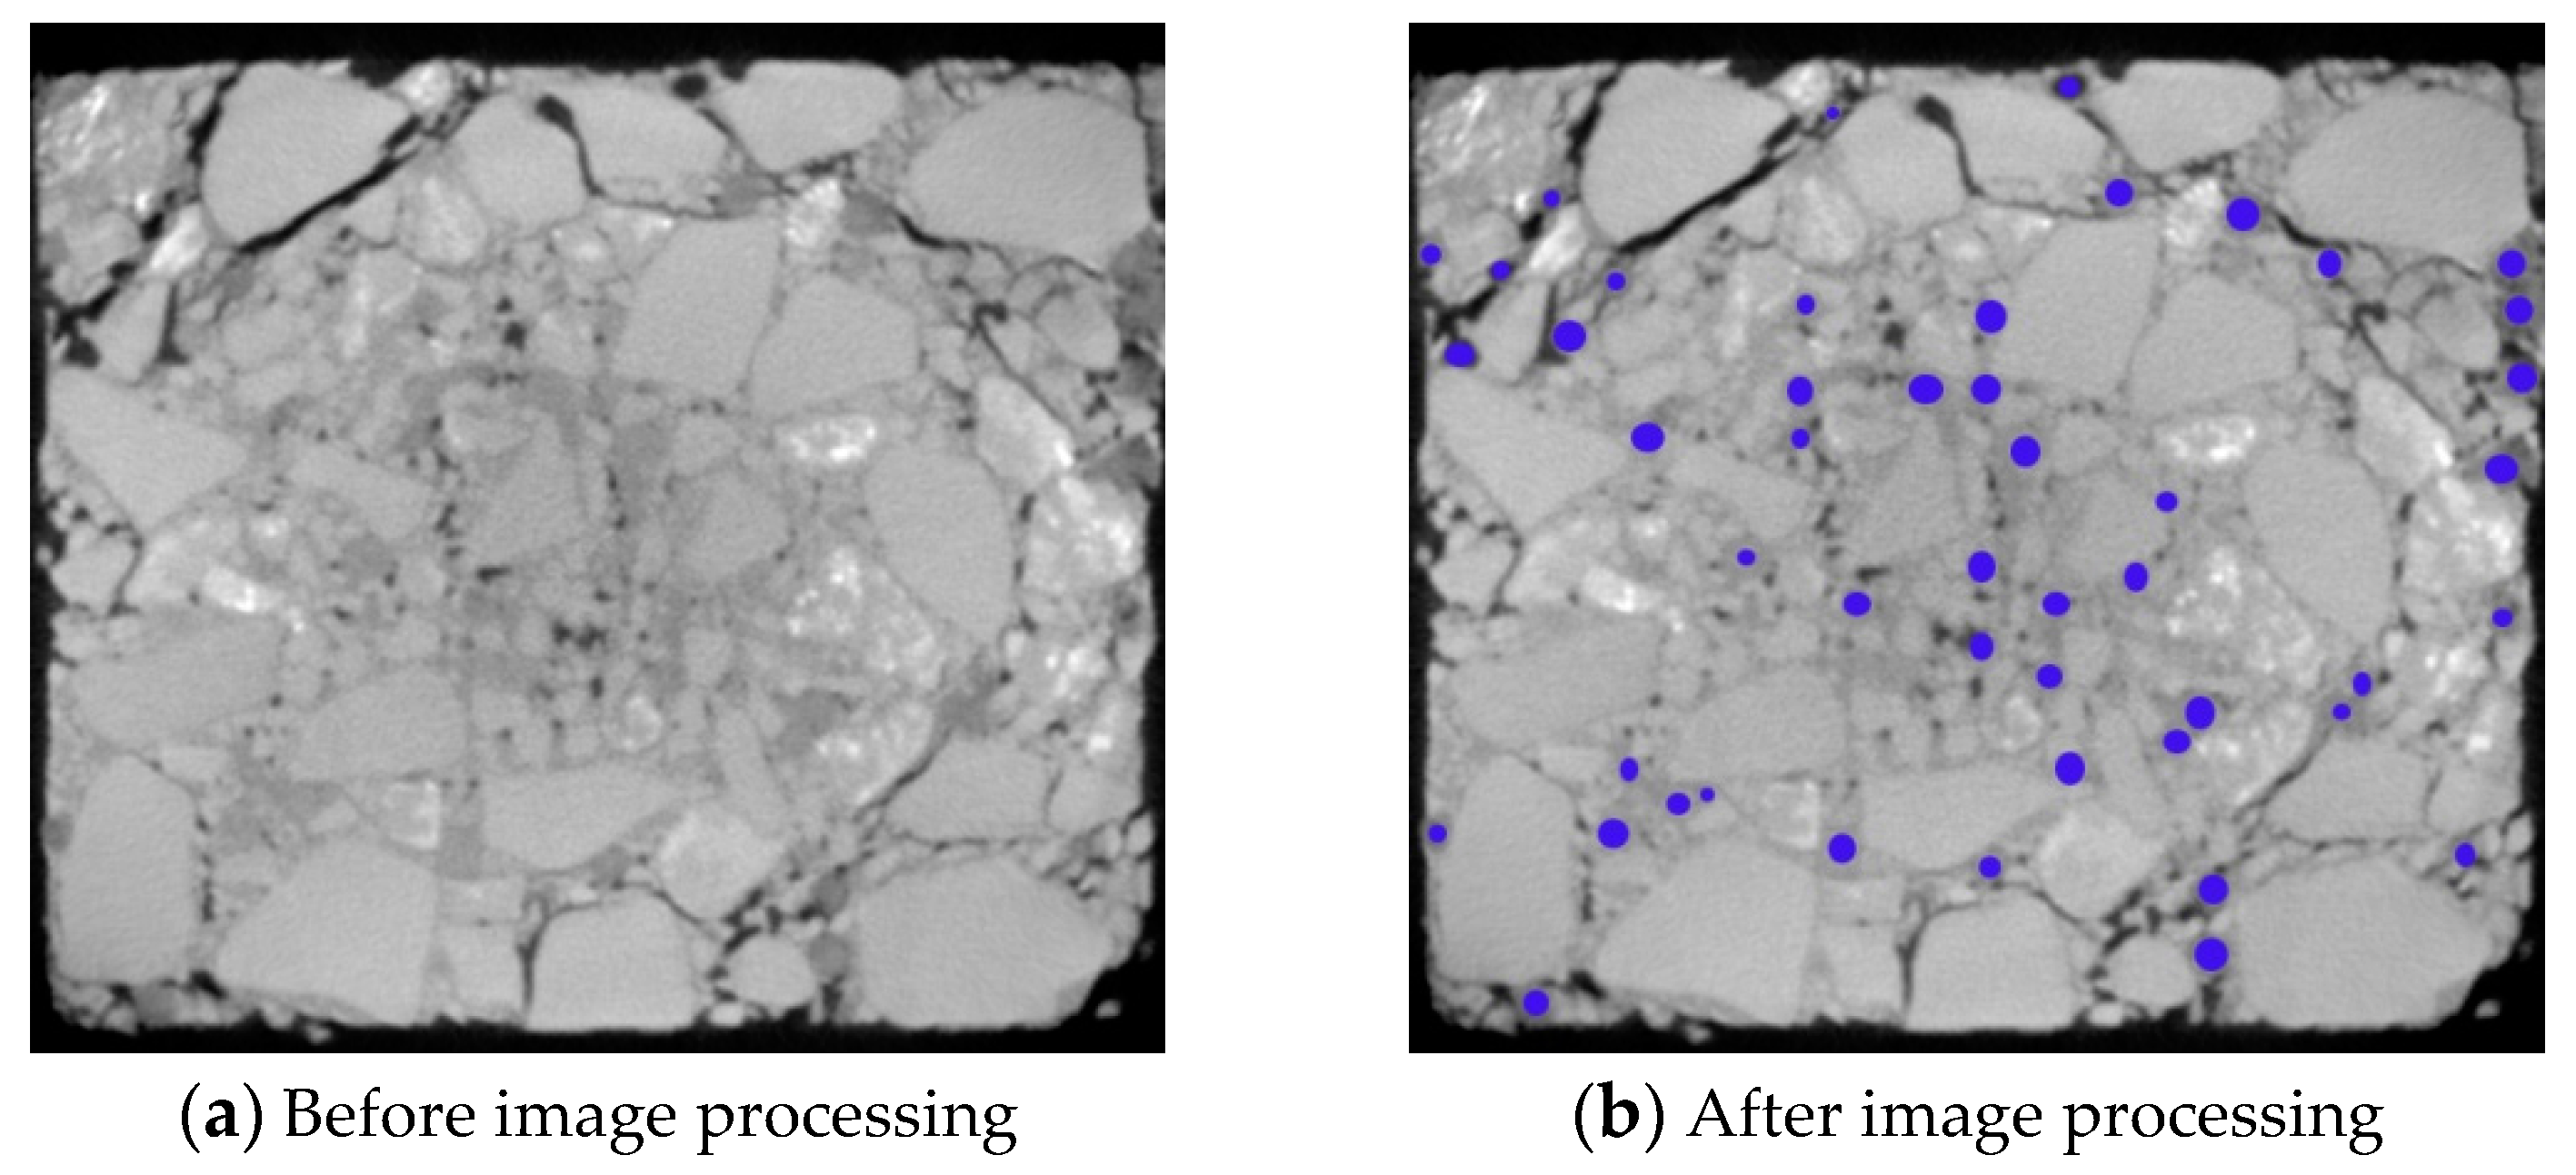
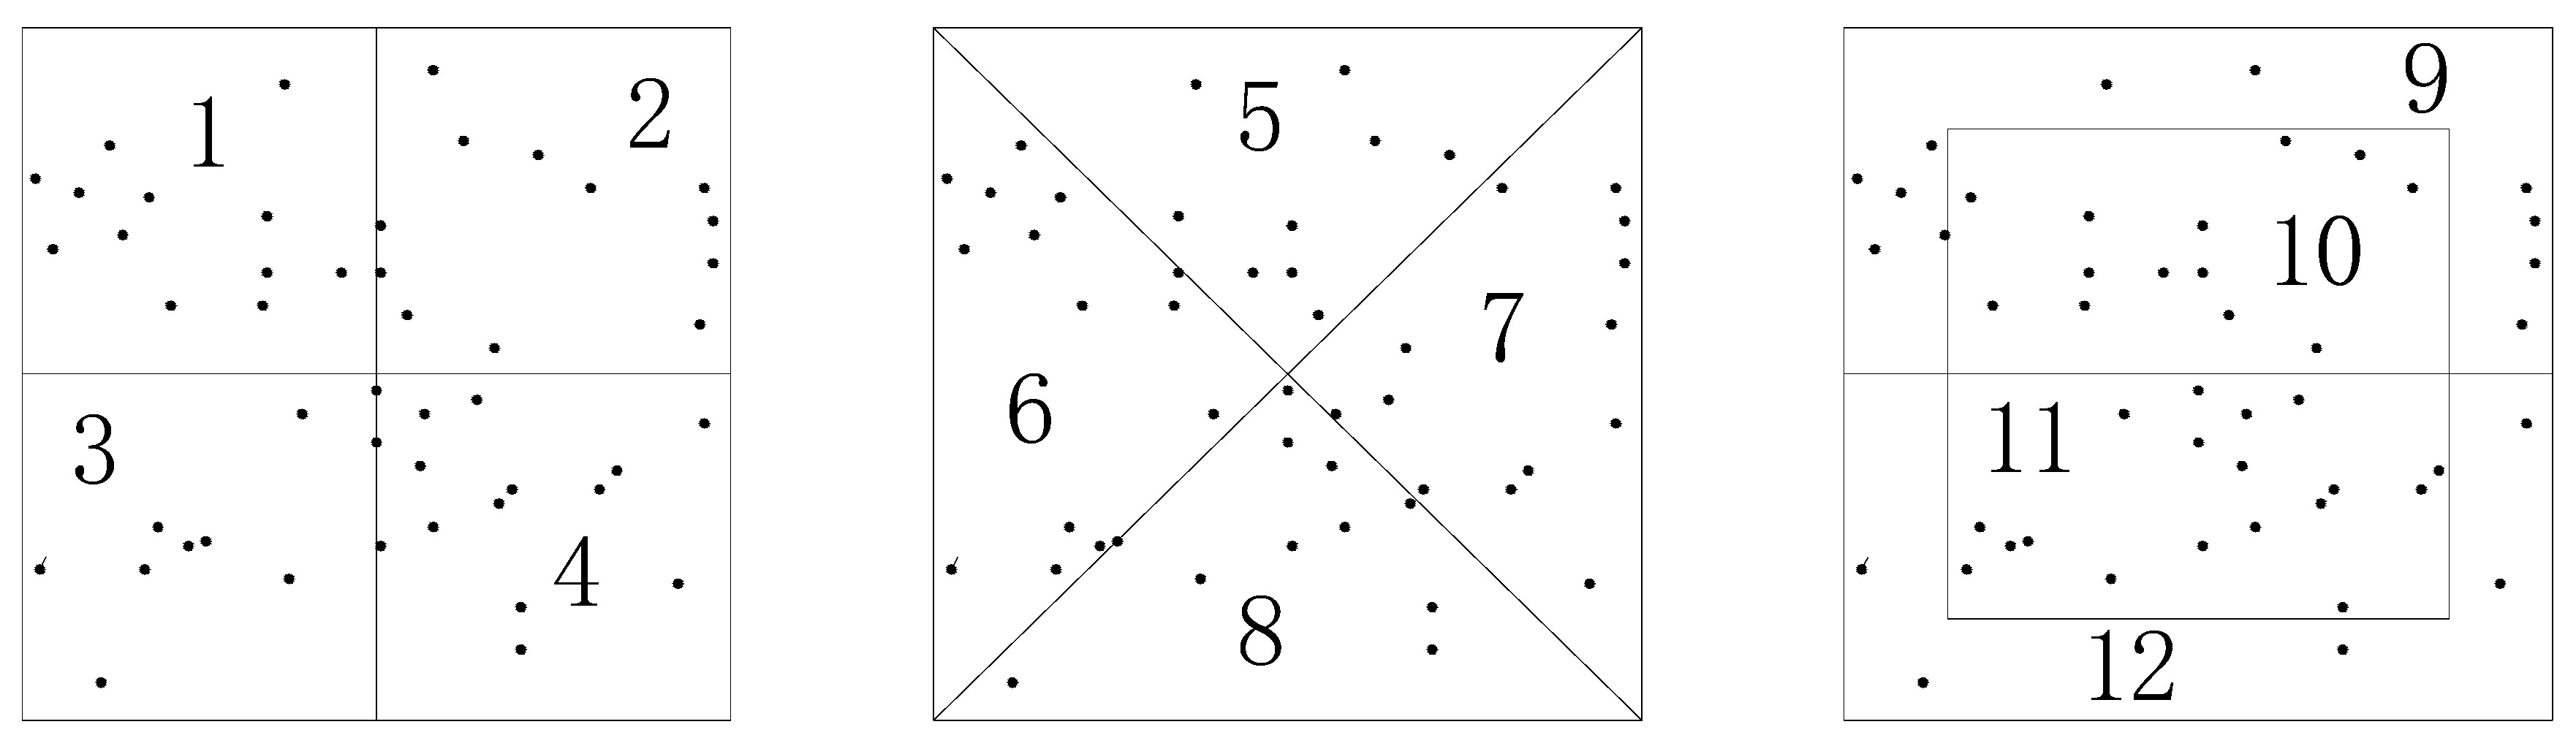
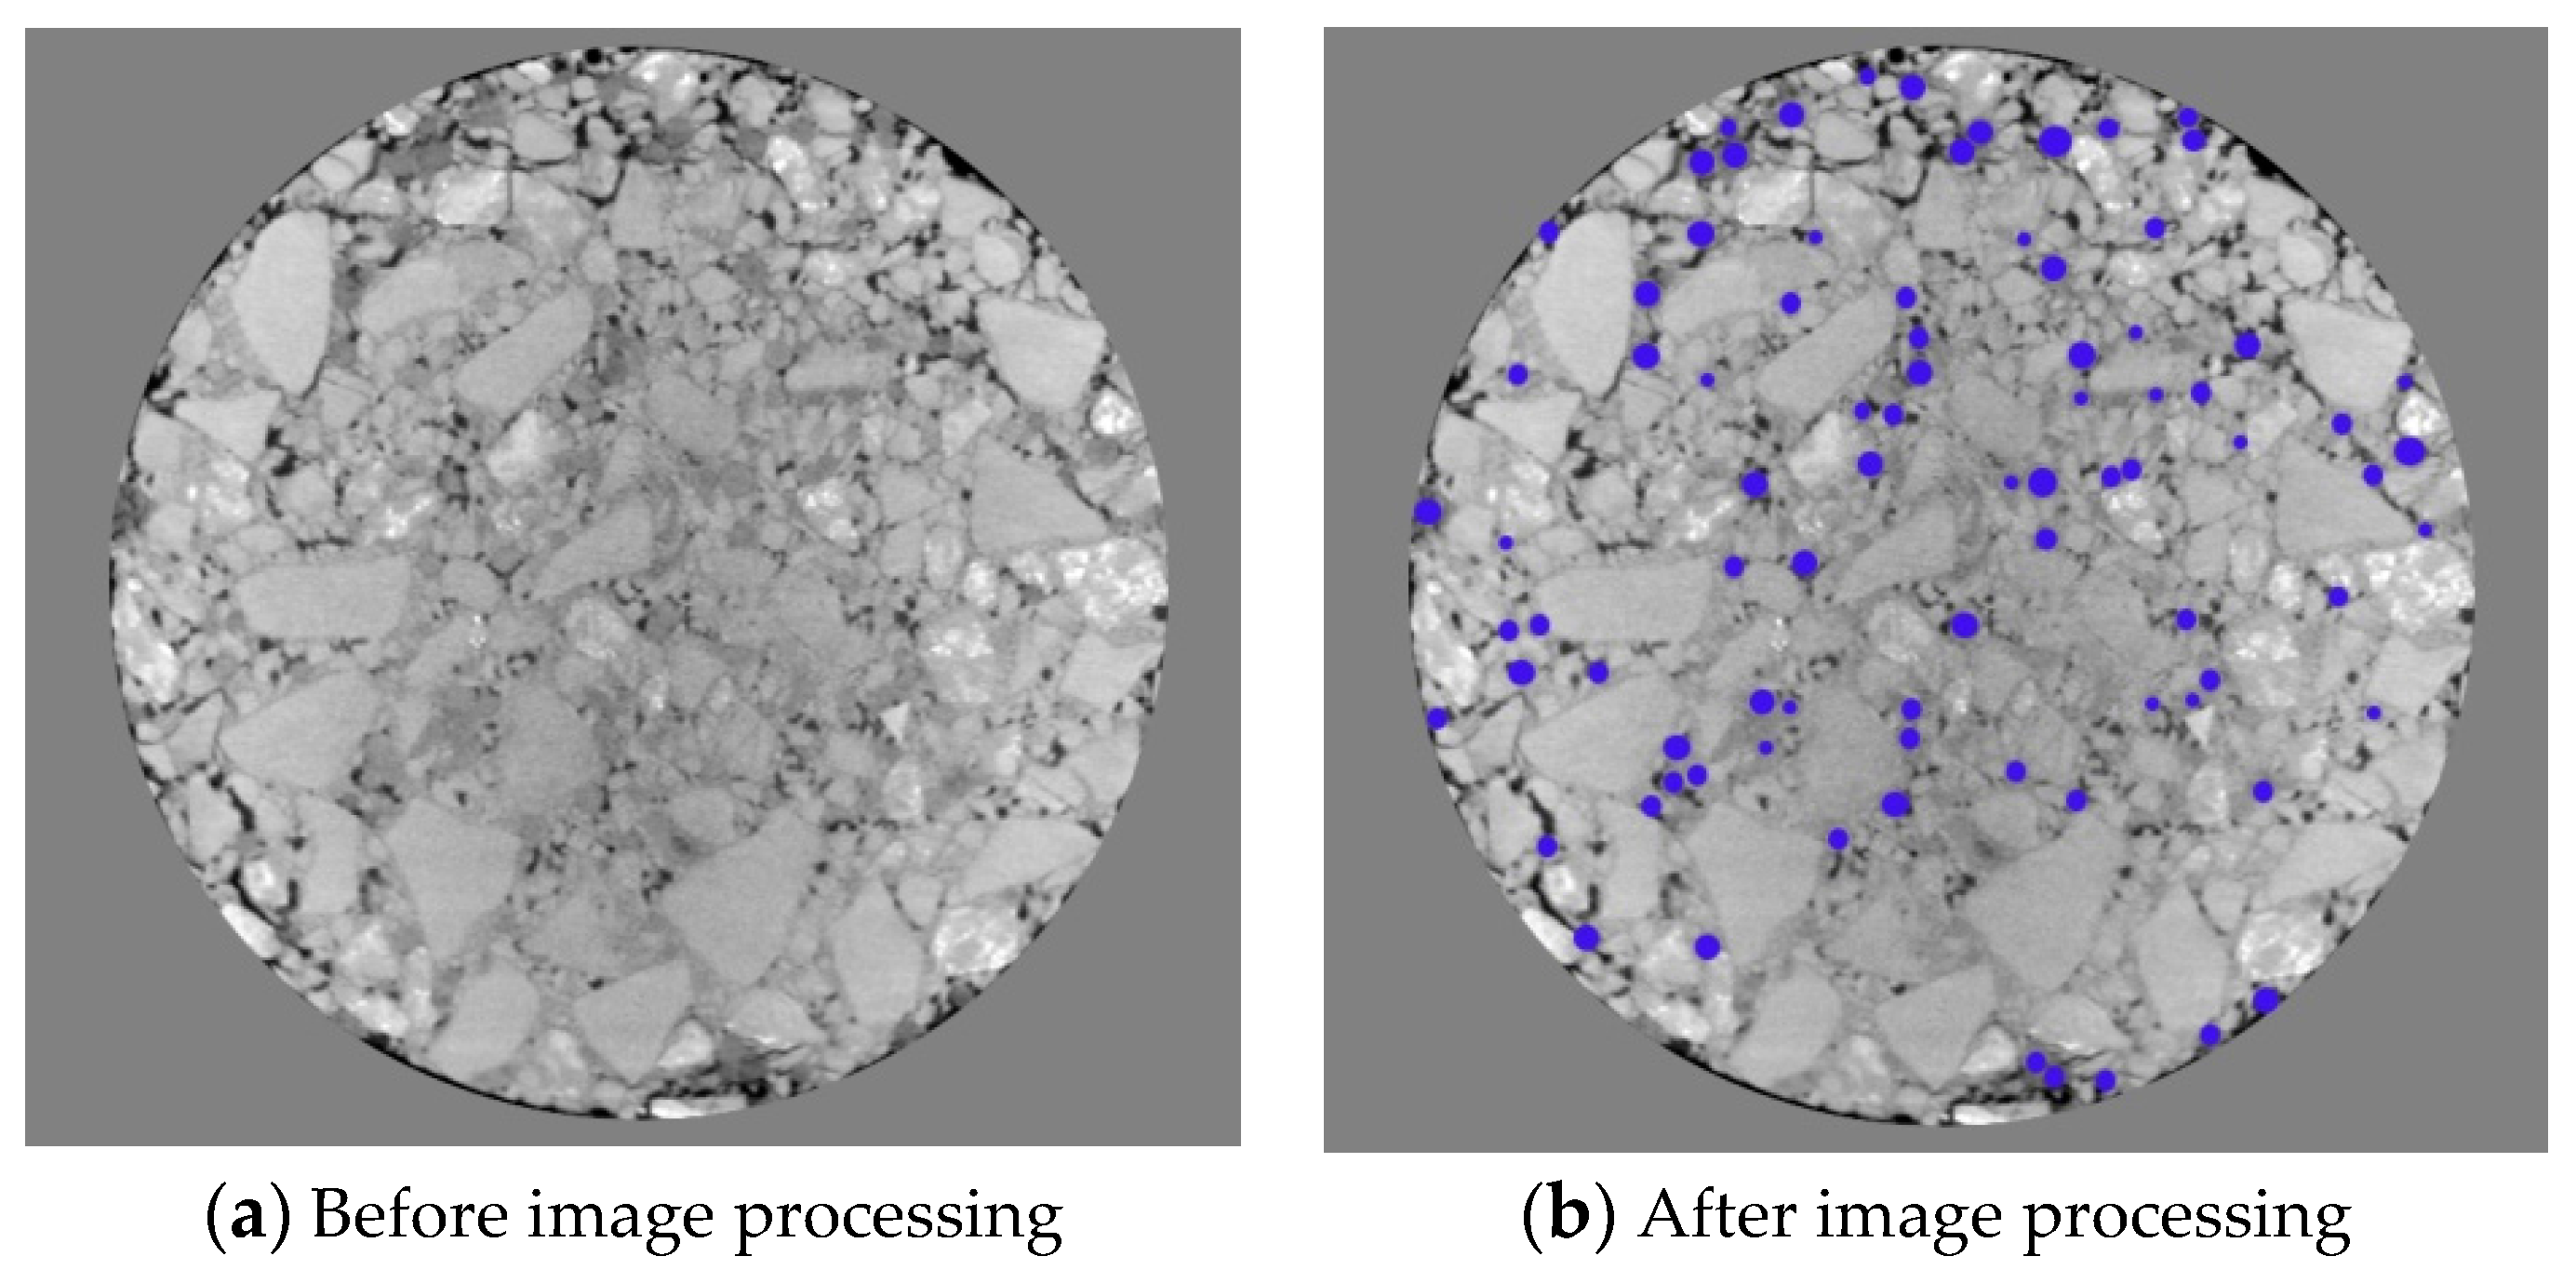
2.2.2. Determination of Anti-Icing Filler Distribution
The asphalt mixture specimens containing 5% of V-260 were made according to the gradation in Section 2.2.1. The cross-sectional image of anti-icing asphalt mixture specimens were obtained by CT scanning technology and then processed by digital image processing technique [29,30]. The anti-icing filler was separated from the asphalt mixture. Taking the Marshall specimen as an example, the images were firstly extracted along both longitudinal and transverse directions, and then equally divided into 12 pieces with equal areas; the number of anti-icing filler points in each piece was counted. The variance of the number was calculated. The uniformity of anti-icing filler distribution in the image can be characterized by Equations (1) and (2):
where U is distribution uniformity value, S is variance, is number of anti-icing filler points, and is average of the number of anti-icing filler points.
The calculated distribution uniformity value (U) in Equation (1) represents the uniformity of anti-icing filler distributed in the entire image. A greater value of U reflects more favorable uniformity of the distribution of characteristic points. If U is greater than or equal to −2, the uniformity is good; otherwise, the uniformity is poor [31].
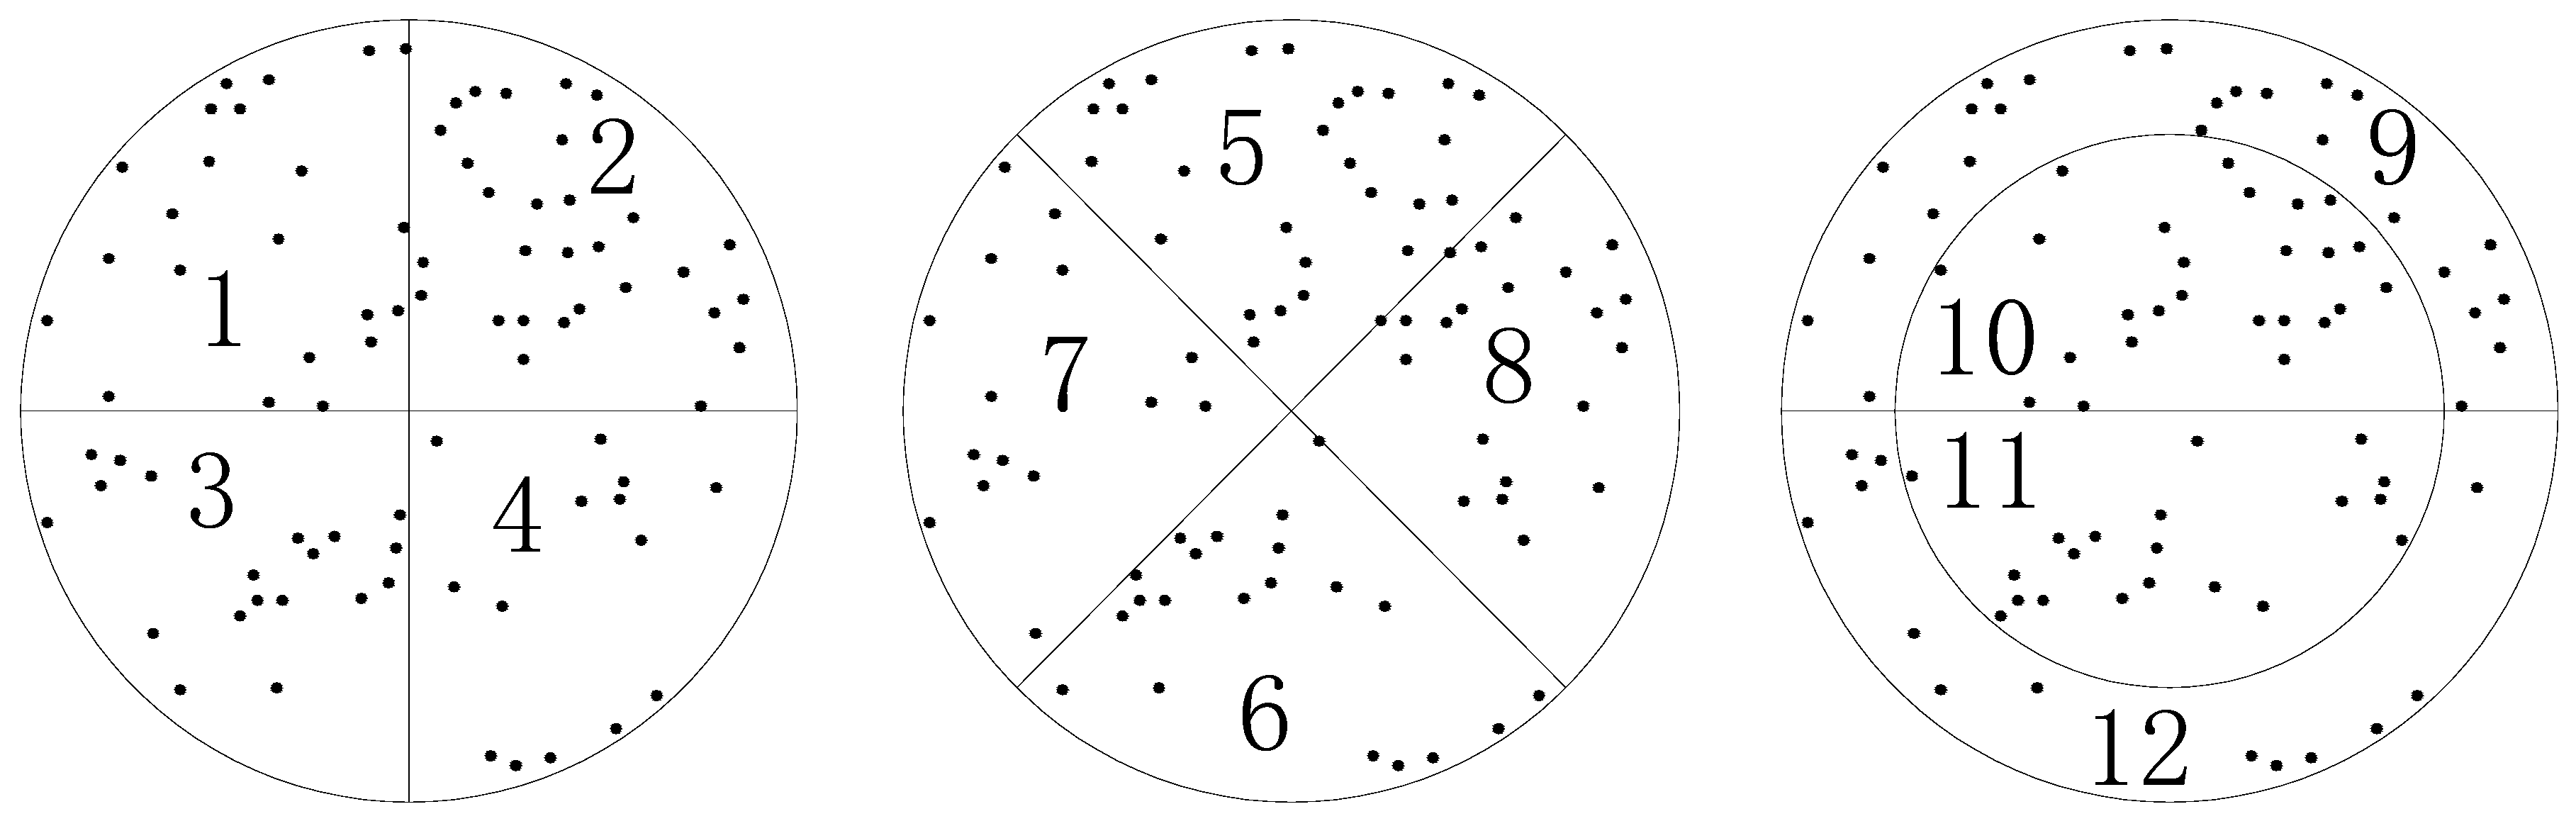
2.2.3. Longitudinal Distribution Evaluation
In the course of scanning the Marshall specimen, nine images were evenly extracted in the longitudinal direction at an interval of 10.15 mm. Each image was further divided into 12 equal segments from four directions (vertical, horizontal, 45° and 135°, respectively), and these segments were then referred to as directional image blocks. The anti-icing filler points were labeled in Photoshop CS6. Then, the coordinates were added after image segmentation. Figure 3 and Figure 4 show the processed results of Image 2 which is the second image in the longitudinal direction.
Figure 3.
Image partition.
Figure 4.
Extract scatter.
In Figure 4, the numbers of anti-icing filler points in the 12 blocks are 12, 12, 9, 14, 9, 14, 14, 11, 11, 13, 18, and 5. The variance S is 9.81. The U value is equal to −0.99 (more than −2), representing a great uniformity in the longitudinal direction.
The statistical results of the remaining images are described in Table 8.
Table 8.
Calculation results of longitudinal uniformity.
2.2.4. Transverse Distribution Evaluation
Likewise, in the transverse direction, the specimen was scanned with Computed Tomography (CT) at an interval of 13.5 mm. Each image was divided into 12 segments for the evaluation of distribution uniformity. After Image 1 was segmented, anti-icing filler points were marked, as illustrated in Figure 5 and Figure 6.
Figure 5.
Image partition.
Figure 6.
Extract scatter.
In Figure 6, the numbers of anti-icing filler points in Segments 1–12 are 22, 29, 19, 14, 28, 21, 15, 20, 26, 25, 20, and 13, respectively. The variance S is 25.83. The U value is equal to −1.41 (more than −2), indicating a great uniformity in the transverse direction. The results of the other five images are shown in Table 9.
Table 9.
Calculation results of horizontal uniformity.
The average longitudinal and transverse uniformity values are −0.999 and −1.094, respectively. Both are more than −2, indicating that the anti-icing filler was uniformly distributed in the asphalt mixture.
When the anti-icing filler is uniformly distributed inside of the asphalt mixture, the salting-out is uniform, so the snow melt effect of every part of the pavement is consistent and the asphalt mixture performances are less affected. Because of the uniform salting-out, the void volume will not increase sharply in certain parts. As a result, uniform changes of pavement performances can be guaranteed.
2.3. Experimental
2.3.1. Evaluation of Self-Snow-Melting Performance
In this study, using a self-developed experimental device (as shown in Figure 7), the effect of the load of vehicles was simulated under different snowfall intensities and different temperature for quantitatively evaluating the snow-melting performance of the anti-icing asphalt pavement.
Figure 7.
Melting ice-snow quality measuring device of self-ice-melting pavement: (1) specimen; (2) snow; (3) wheel; (4) waterproof material; (5) temperature sensing device; (6) density meter; (7) floater; (8) volume measuring device; (9) diversion meter; (10) loading device; (11) external refrigeration system; and (12) control system.
2.3.2. Determination of Snow Amount
Generally, snowfall intensity can be classified into four levels: light snow, moderate snow, heavy snow and blizzard. Taking the condition in China as an example, light snow has snowfall of less than 1.0 mm in 12 h or less than 2.5 mm in 24 h; moderate snow has snowfall of between 1.0 and 3.0 mm in 12 h or between 2.5 and 5.0 mm in 24 h; heavy snow has snowfall of between 3.0 and 6.0 mm in 12 h or between 5.0 and 10.0 mm in 24 h; and blizzard has snowfall of greater than 6.0 mm in 12 h or greater than 10.0 mm in 24 h. One millimeter of snowfall means 0.001 m3 of water added over 1 m2 of area. When using visibility or the other indexes for measuring snowfall intensity, the accumulative snow thickness within 12 or 24 h can be acquired and the corresponding relationships are then established.
The dimensions of the specimen are 100 mm (length) × 100 mm (width) × 50 mm (height). The surface area S is 0.01 m2:
(S = a × b = 0.1 × 0.1 m2).
Hence, 1 mm of snowfall on the specimen surface corresponds to 10−5 m3:
or 10 g of water; water density is 1.0 g/cm3 and:
In other words, the icing layer thickness h is 1.1 mm; ice density is 0.9 g/cm3 and:
The corresponding snow layer thickness H is 15 mm; snow density is 1/15 of water density. The thickness values of icing layer and snow layer in different snowing weathers are depicted in Table 10.
Table 10.
Snowfall scale.
2.3.3. Determination of the Freezing Point of Anti-Icing Filler Solutions
Calcium chloride and sodium chloride are two main components used in the anti-icing products in China and abroad. Thus, calcium chloride is the main ingredient in both V-260 and IGD. To better compare the freezing points between V-260 and IGD, another anti-icing product—Mafilon (Beijing Mafilon Anti-Icing Technology Limited Company, Beijing, China) (MFL)—is introduced, and it’s main components are silicon dioxide, sodium chloride, calcium chloride and calcium carbonate; among these components, the sodium chloride content is about 55% of the total mass.
V-260, IGD, and MFL were separately dissolved in water to prepare 600 mL of solutions (5.0 wt %), and the quality of the anti-icing fillers was 30 g. These solutions were denoted by numbers 2, 3, and 4, while 600 mL water solution, denoted by 1, was adopted as the control group. These solutions were placed into an environmental chamber at a certain temperature. The freezing condition of each solution was observed, and the results are listed in Table 11.
Table 11.
Different time and different temperature Salt storage solution freezing conditions.
As shown in Table 11, MFL, IGD, and V-260 were completely frozen at −7, −18 and −19 °C, respectively, indicating that IGD and V-260 have lower action temperatures and can more effectively prohibit freezing. The reason is that the main component of IGD and V-260 is CaCl2, the MFL is NaCl, and the freezing point of CaCl2 solution is lower than that of NaCl solution at the same concentration. The salt content in V-260 is higher than that in IGD.
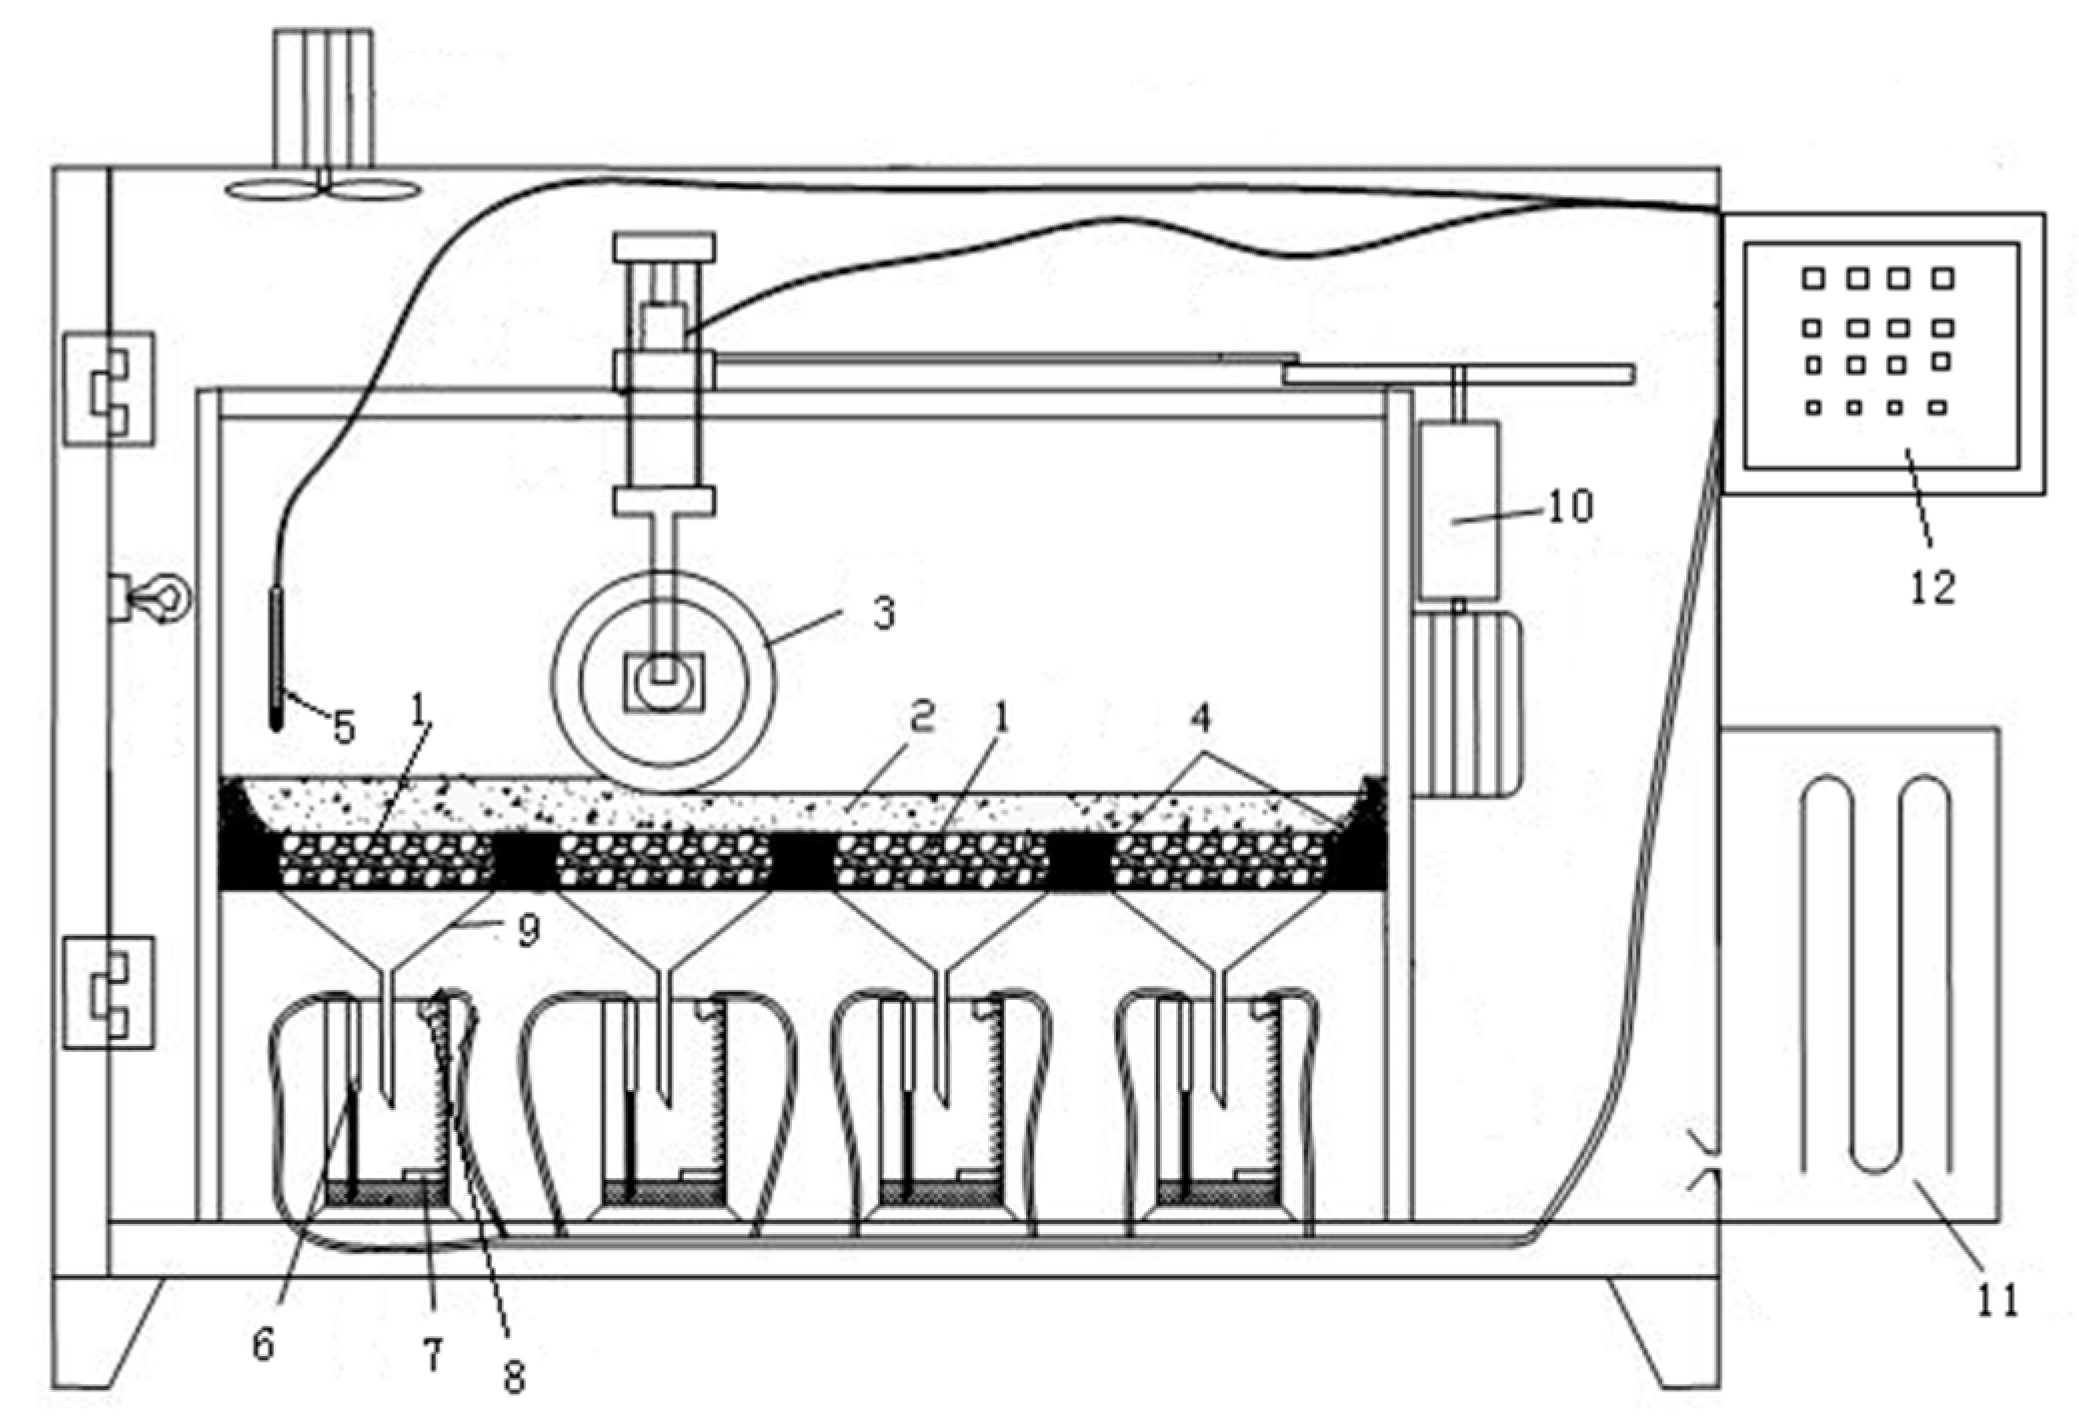
2.3.4. Experimental Procedure
The mixtures were compacted to a block of the size 300 mm (length) × 300 mm (width) × 50 mm (height). Three groups were independently added with 4%, 5%, and 6% of V-260. The fourth group was the conventional asphalt mixture as reference group.
Each specimen was cut into a standard size (100 mm × 100 mm × 50 mm) in a dry state. After the side wall was encapsulated with the waterproof materials, the specimen was placed on a porous plate in the environmental chamber.
The specimens were frozen at −15, −10, −5, 0 and 5 °C according to the results in Table 11. In order to prevent the effects of environment temperature on experimental results and simulate the pavement’s actual conditions, the specimens were pre-frozen under the corresponding temperatures until the specimens’ surface temperature equaled the temperature of the environmental cabinet. Generally, the pre-freezing time was set within 2–4 h.
Based on the snowfall intensity level in Table 10, corresponding quality of water was taken and injected to the specimen container; the water was separately frozen in the environmental cabinet and the ice was made into snowflakes by an ice crusher, then the snowflakes were evenly spread on the specimen surface.
The testing device was started and the specimen was subjected to a load of 0.7 MPa. The values of density meter and volume measurement device are read every 1 h. According to:
M = ρ × V
The quality of melted snow is calculated, and average value is obtained. The mass of melted ice and snow was the dependent variable and time was the independent variable.
The test variables are asphalt mixture type, snowfall intensity, temperatures, and (anti-icing filler) content. There are 328 specimens in total. The parameters measured are the time and melting quality of snow.
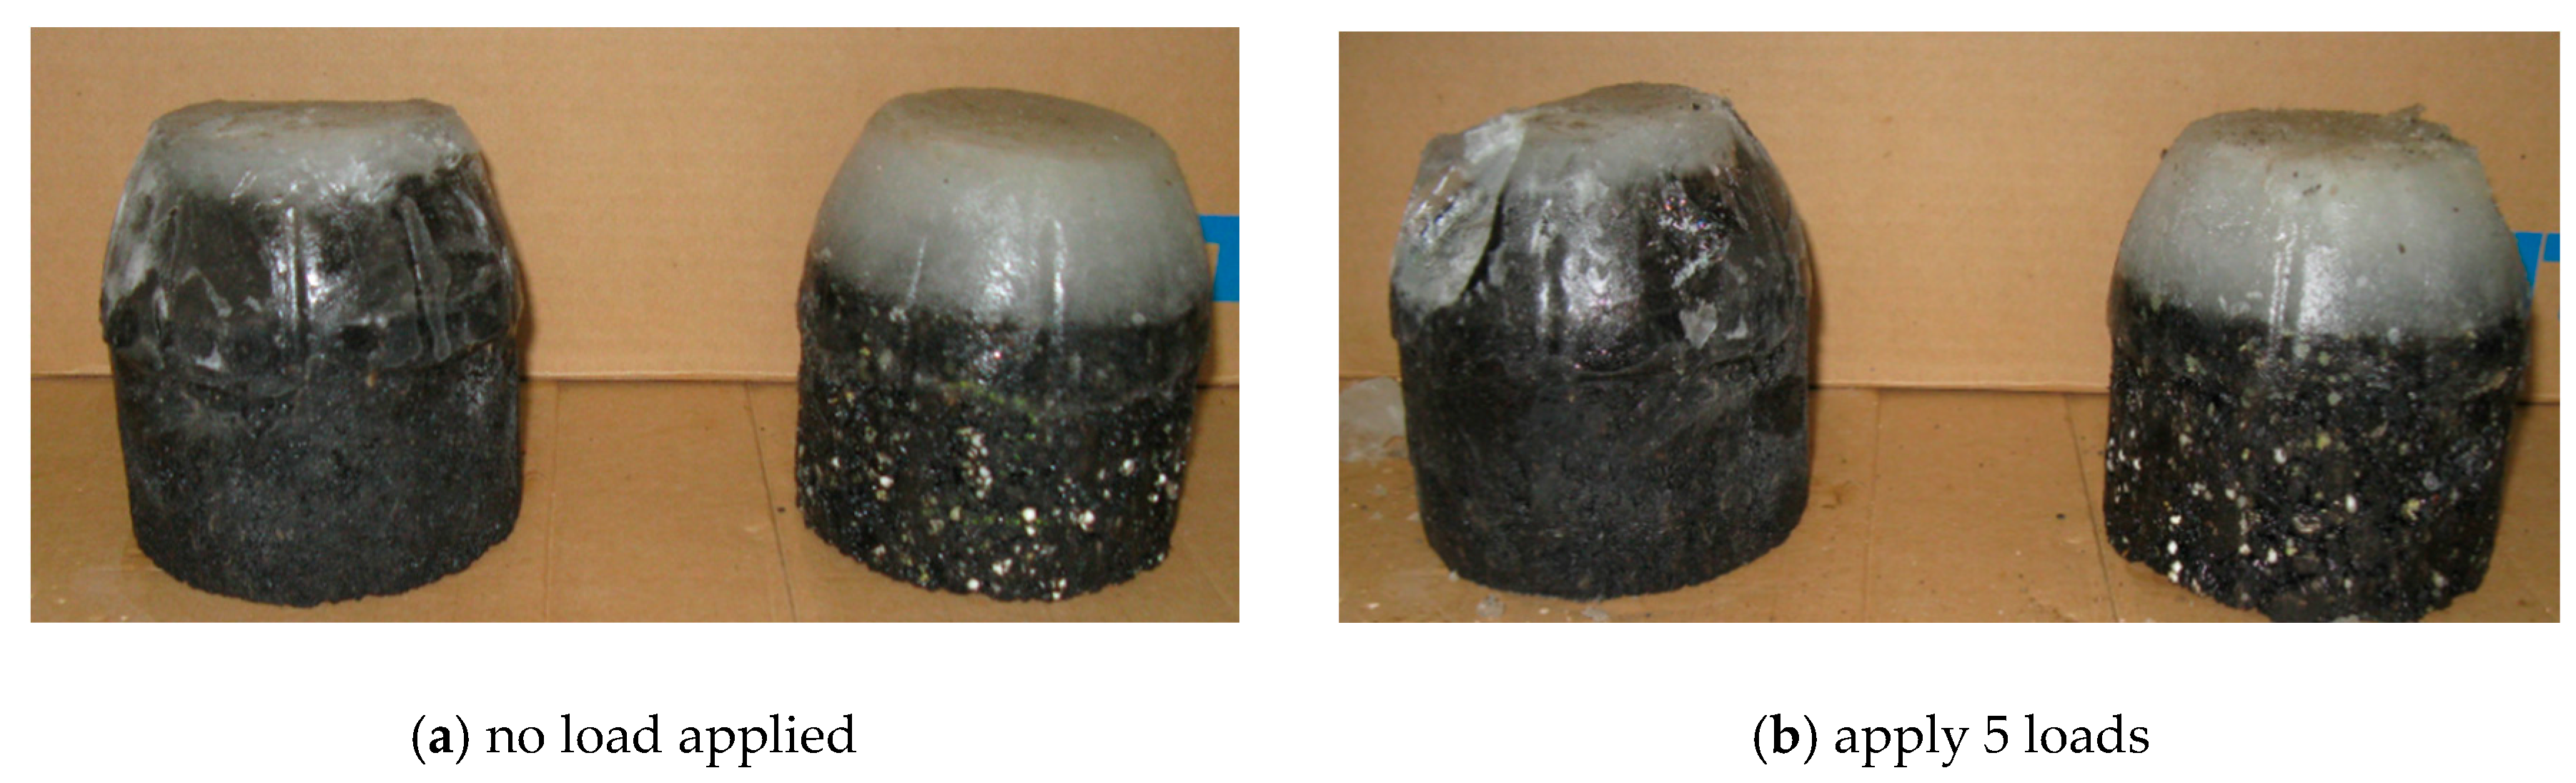
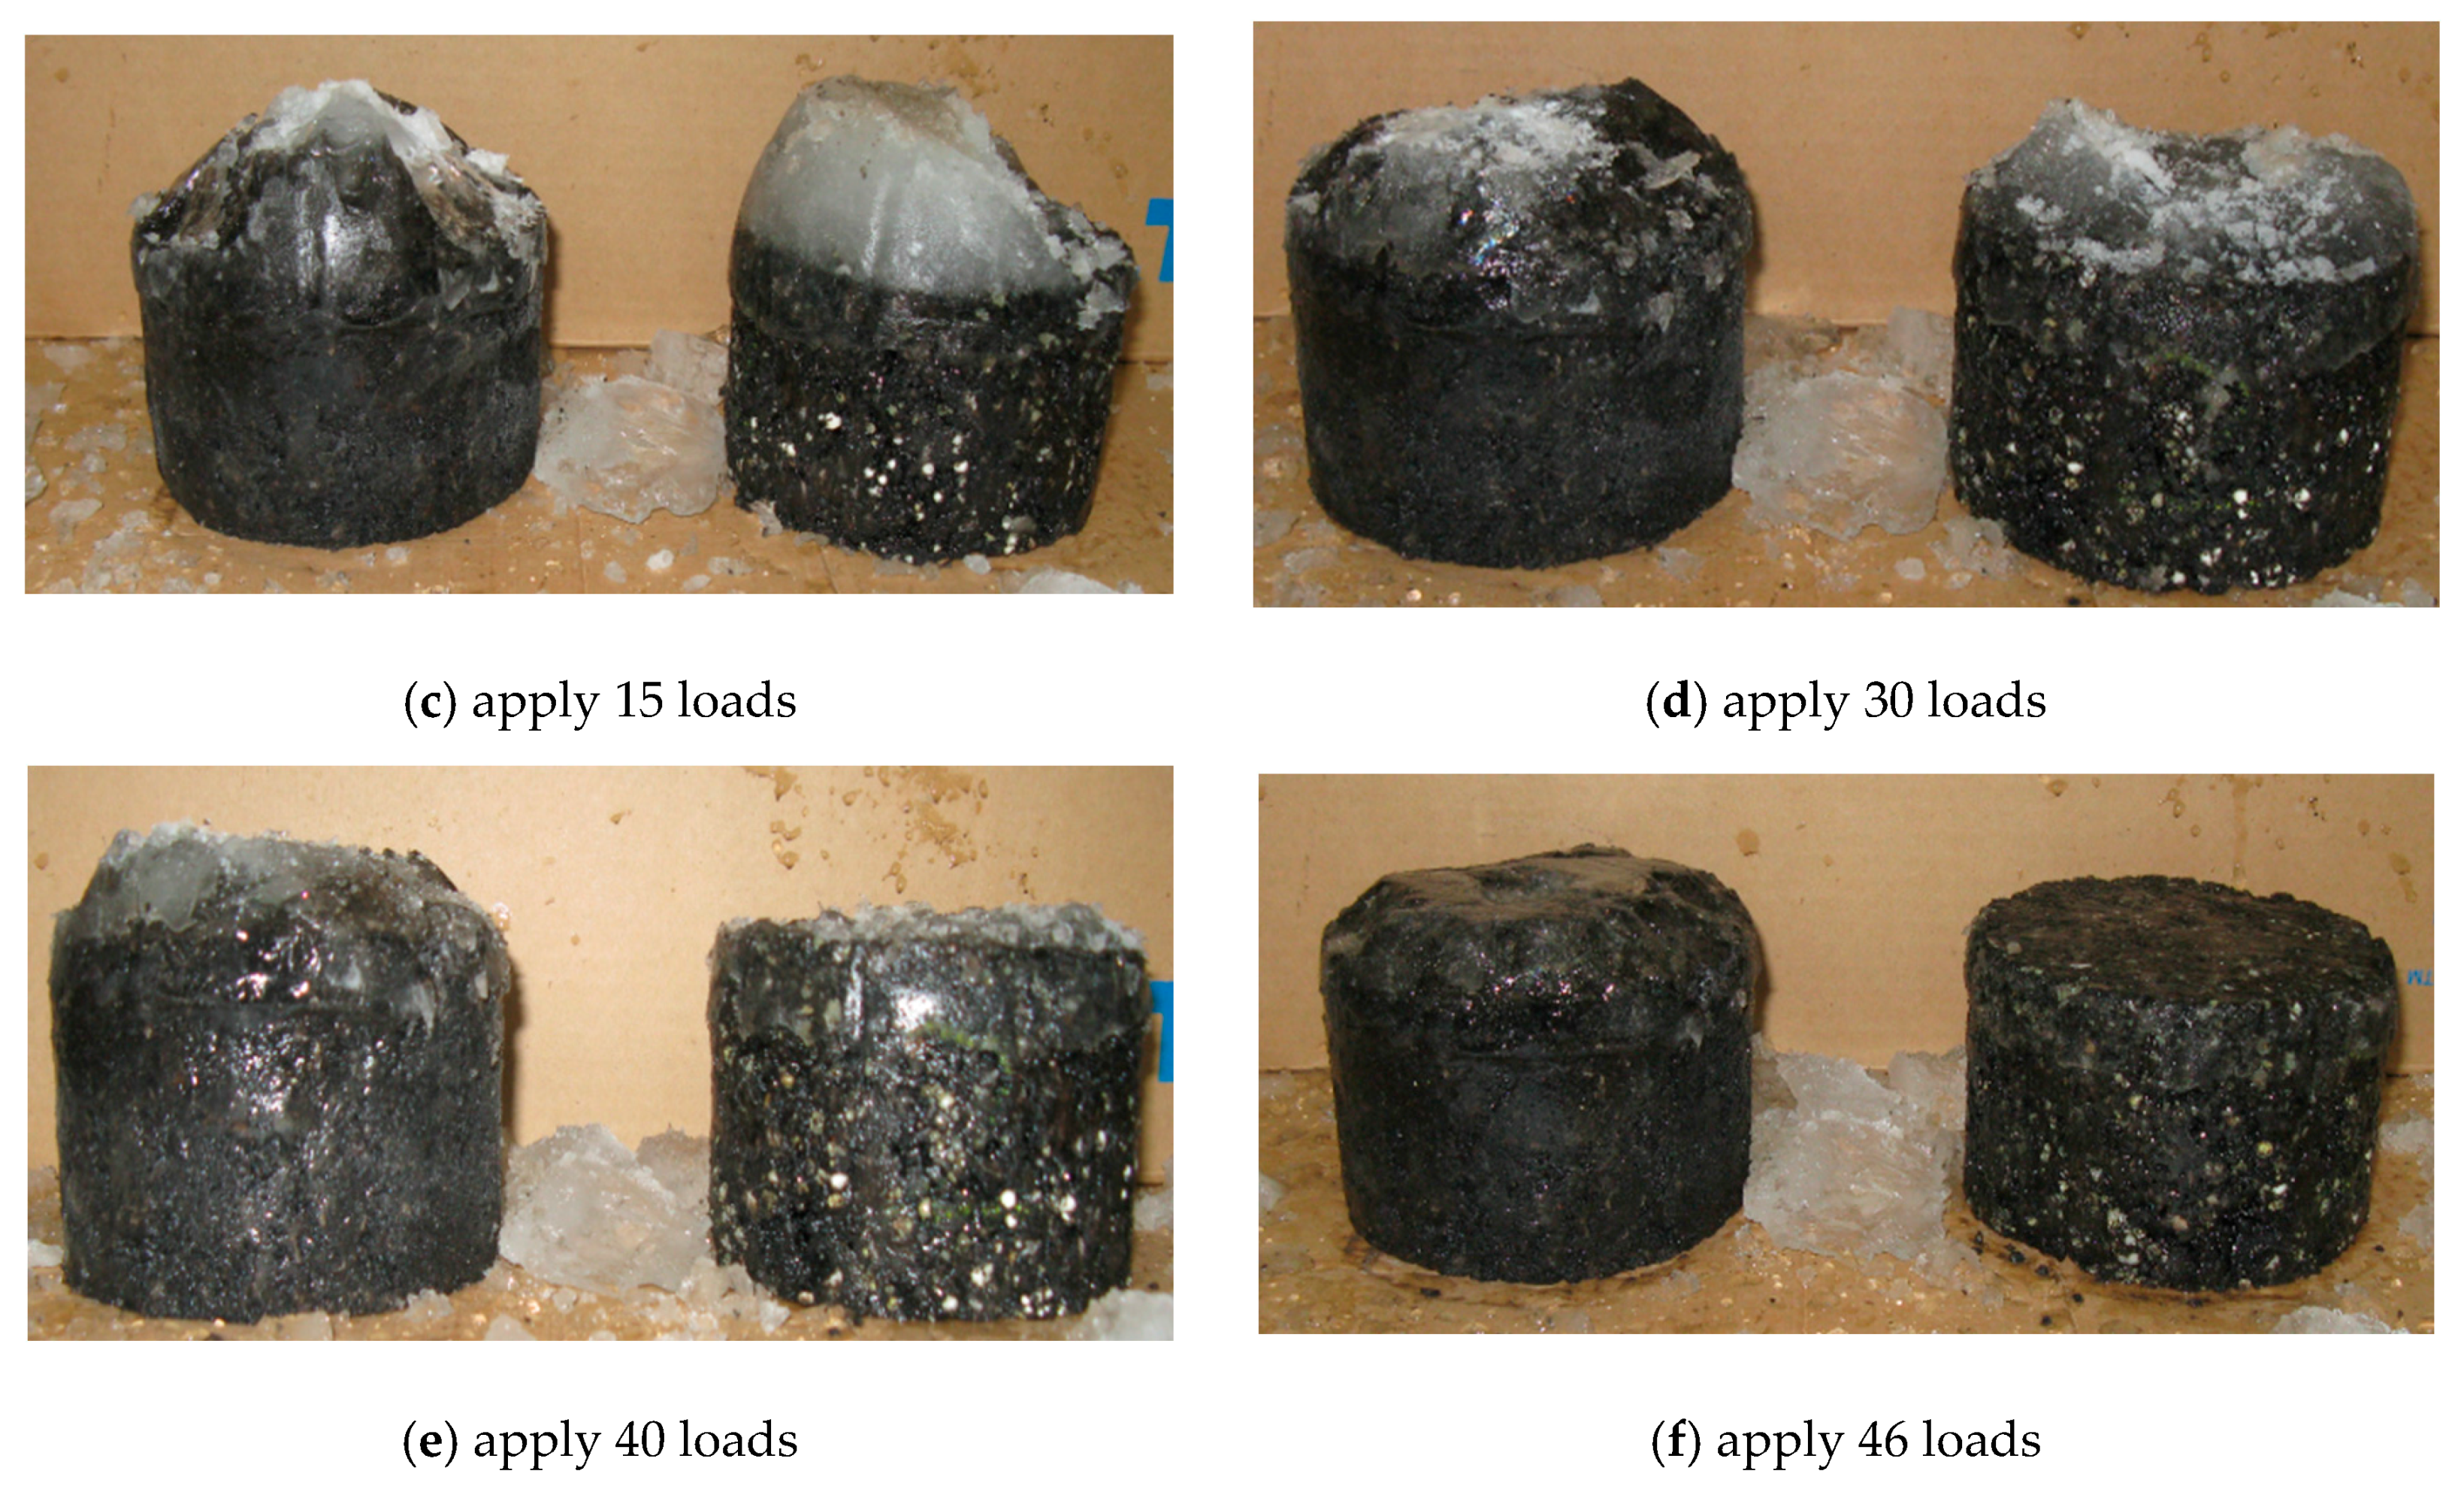
2.3.5. Evaluation of Deicing Performance
Freezing rains and the melted snows refreeze at low temperatures, which will also increase the occurrence of traffic accidents. Anti-icing filler can effectively suppress the freezing of rain and snow water. In this study, the Marshall specimen was not demolded and the edge was sealed with hot asphalt. The specimen was placed in a −20 °C environmental chamber. A certain amount of water corresponding to the snowfall intensity was poured on the Marshall specimen. The conventional asphalt mixture was frozen for 10 h as well as asphalt mixture containing 5% of V-260.
The frozen specimens were placed on a Marshall Compaction Apparatus, (Chang Sha Ya Xing Digit-Control Limited Company, Changsha, China) and the impact load produced in the hammer’s free fall was calibrated with an impact sensor. The height was adjusted so that the impact load equaled to 100 KN (standard axial load). According to the frequency of the vehicles passing through a section, the impact frequency was 30 times per minute. The number of impact was recorded until the ices over the specimen were completely cleared.
The test variable is asphalt mixture type. There are eight specimens. The parameter measured is the frequency of load application.
3. Results and discussion
3.1. Self-Snow-Melting Test
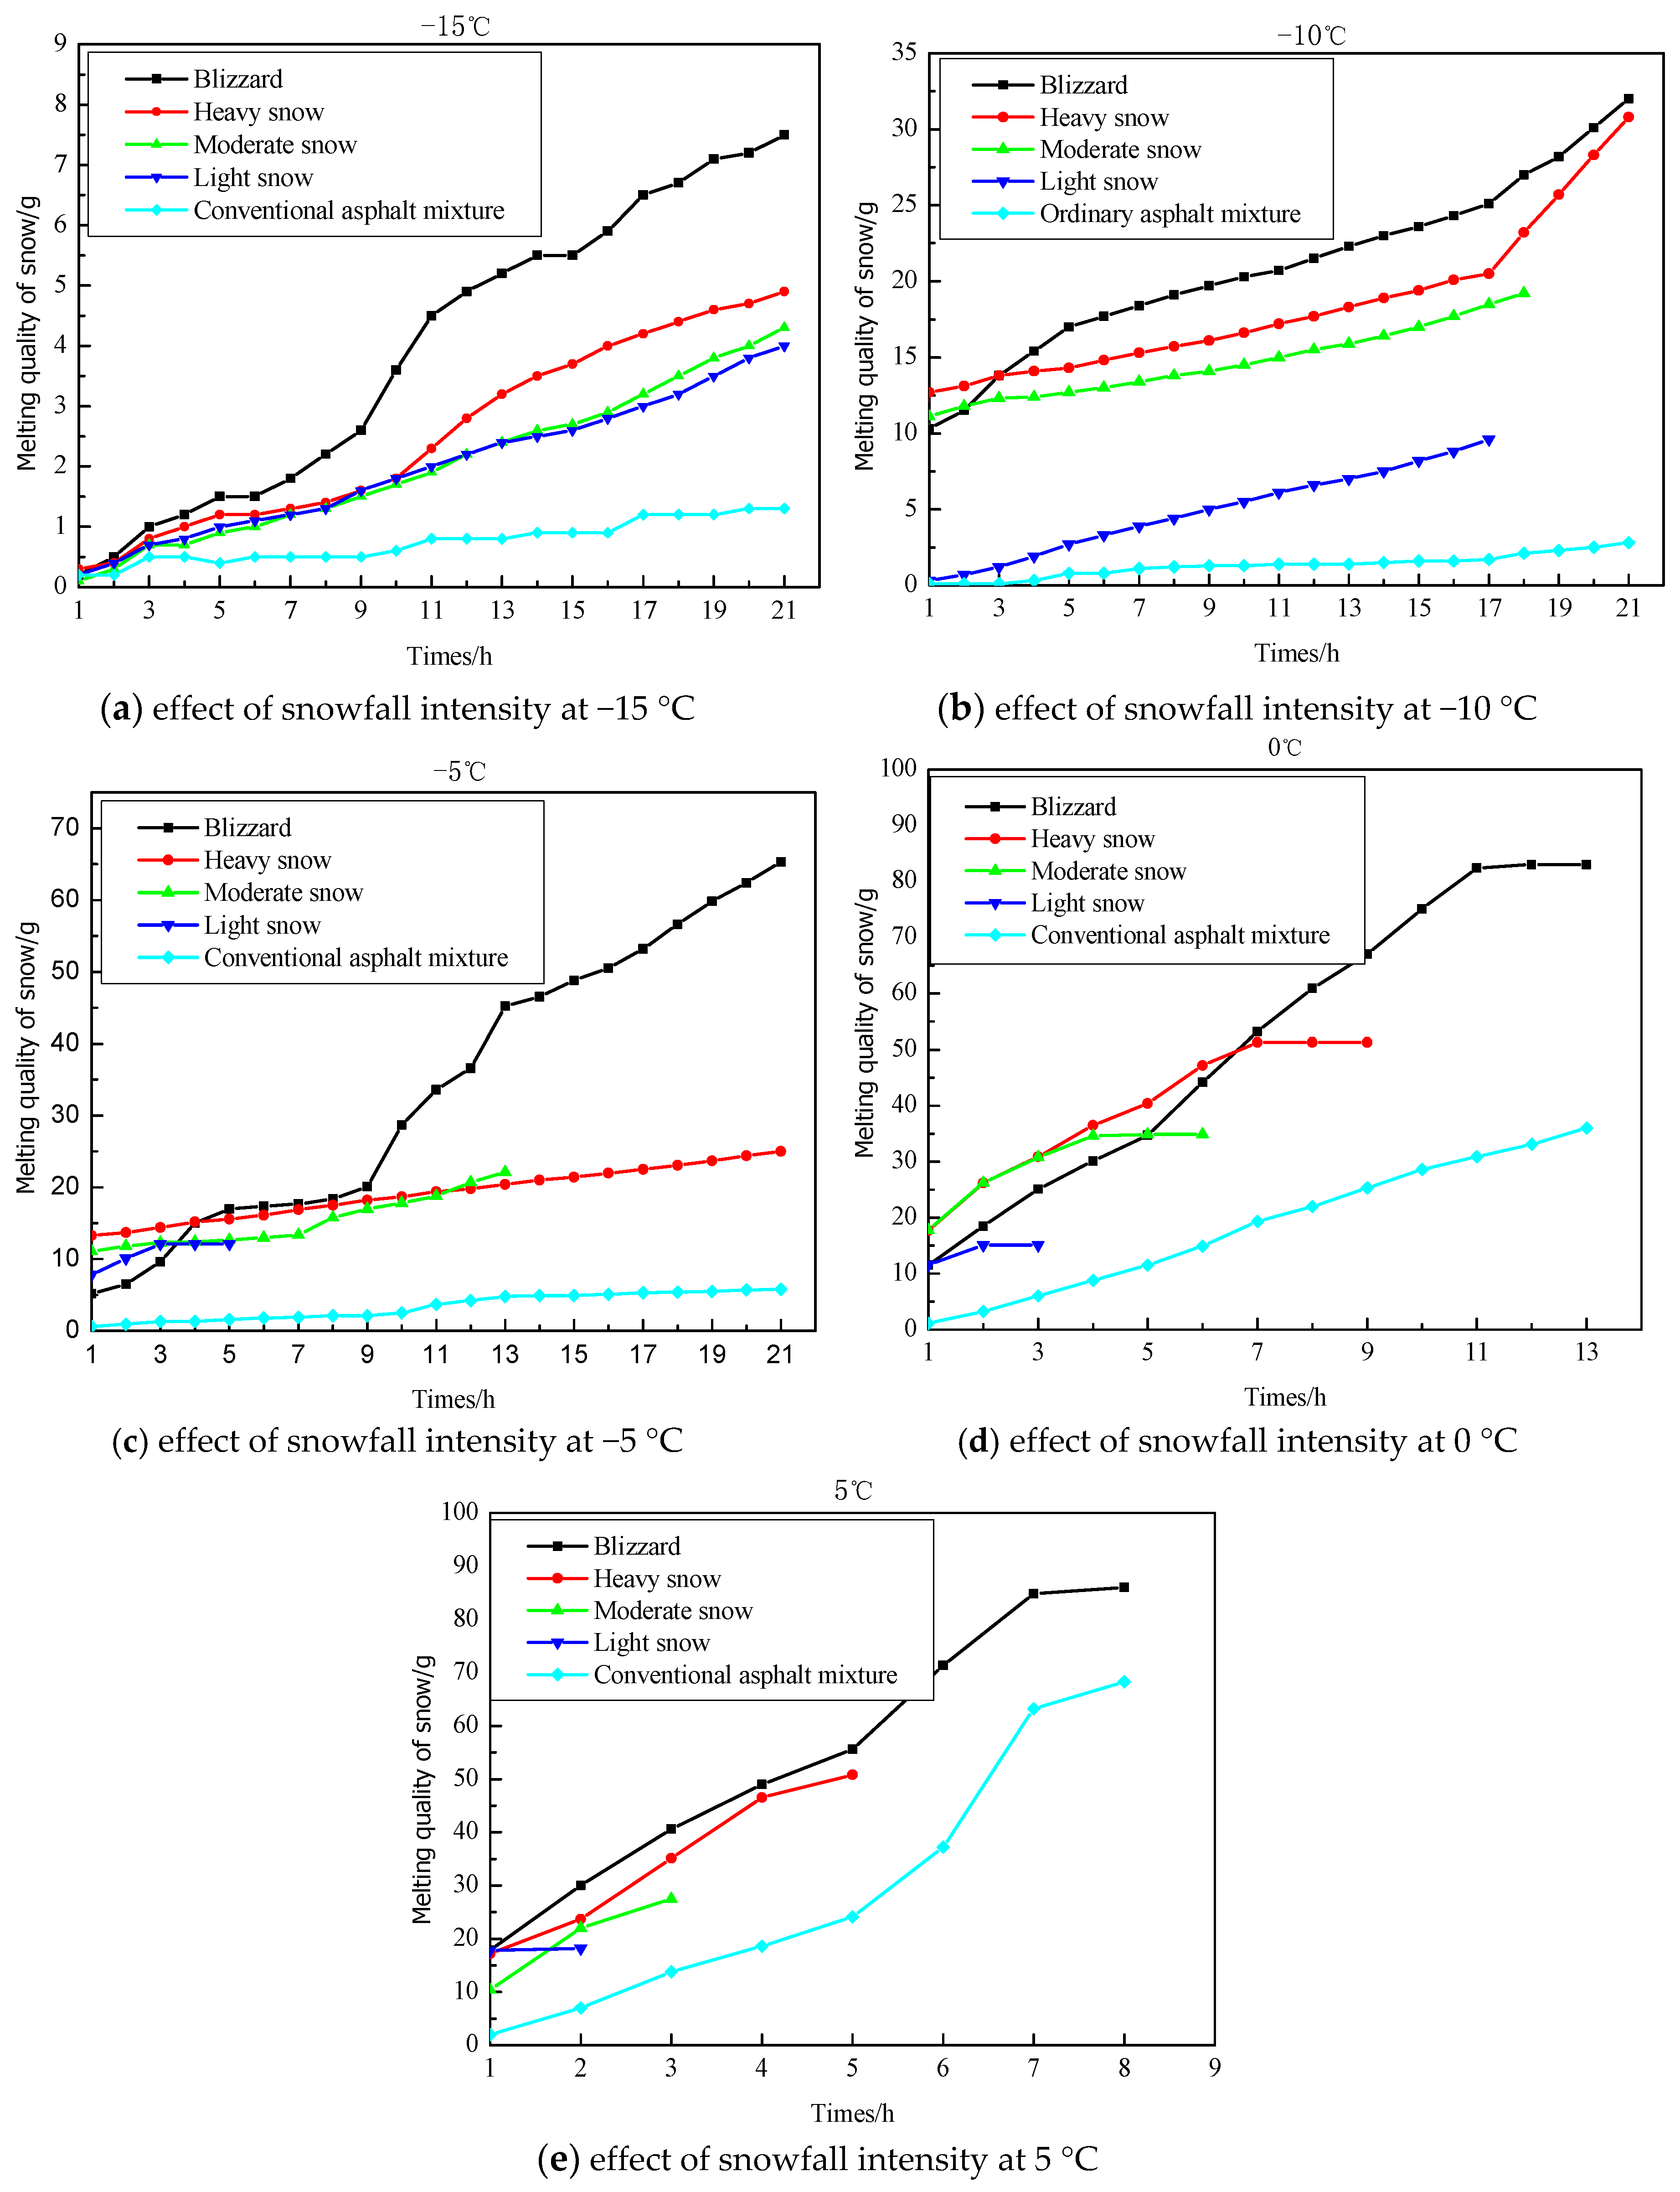
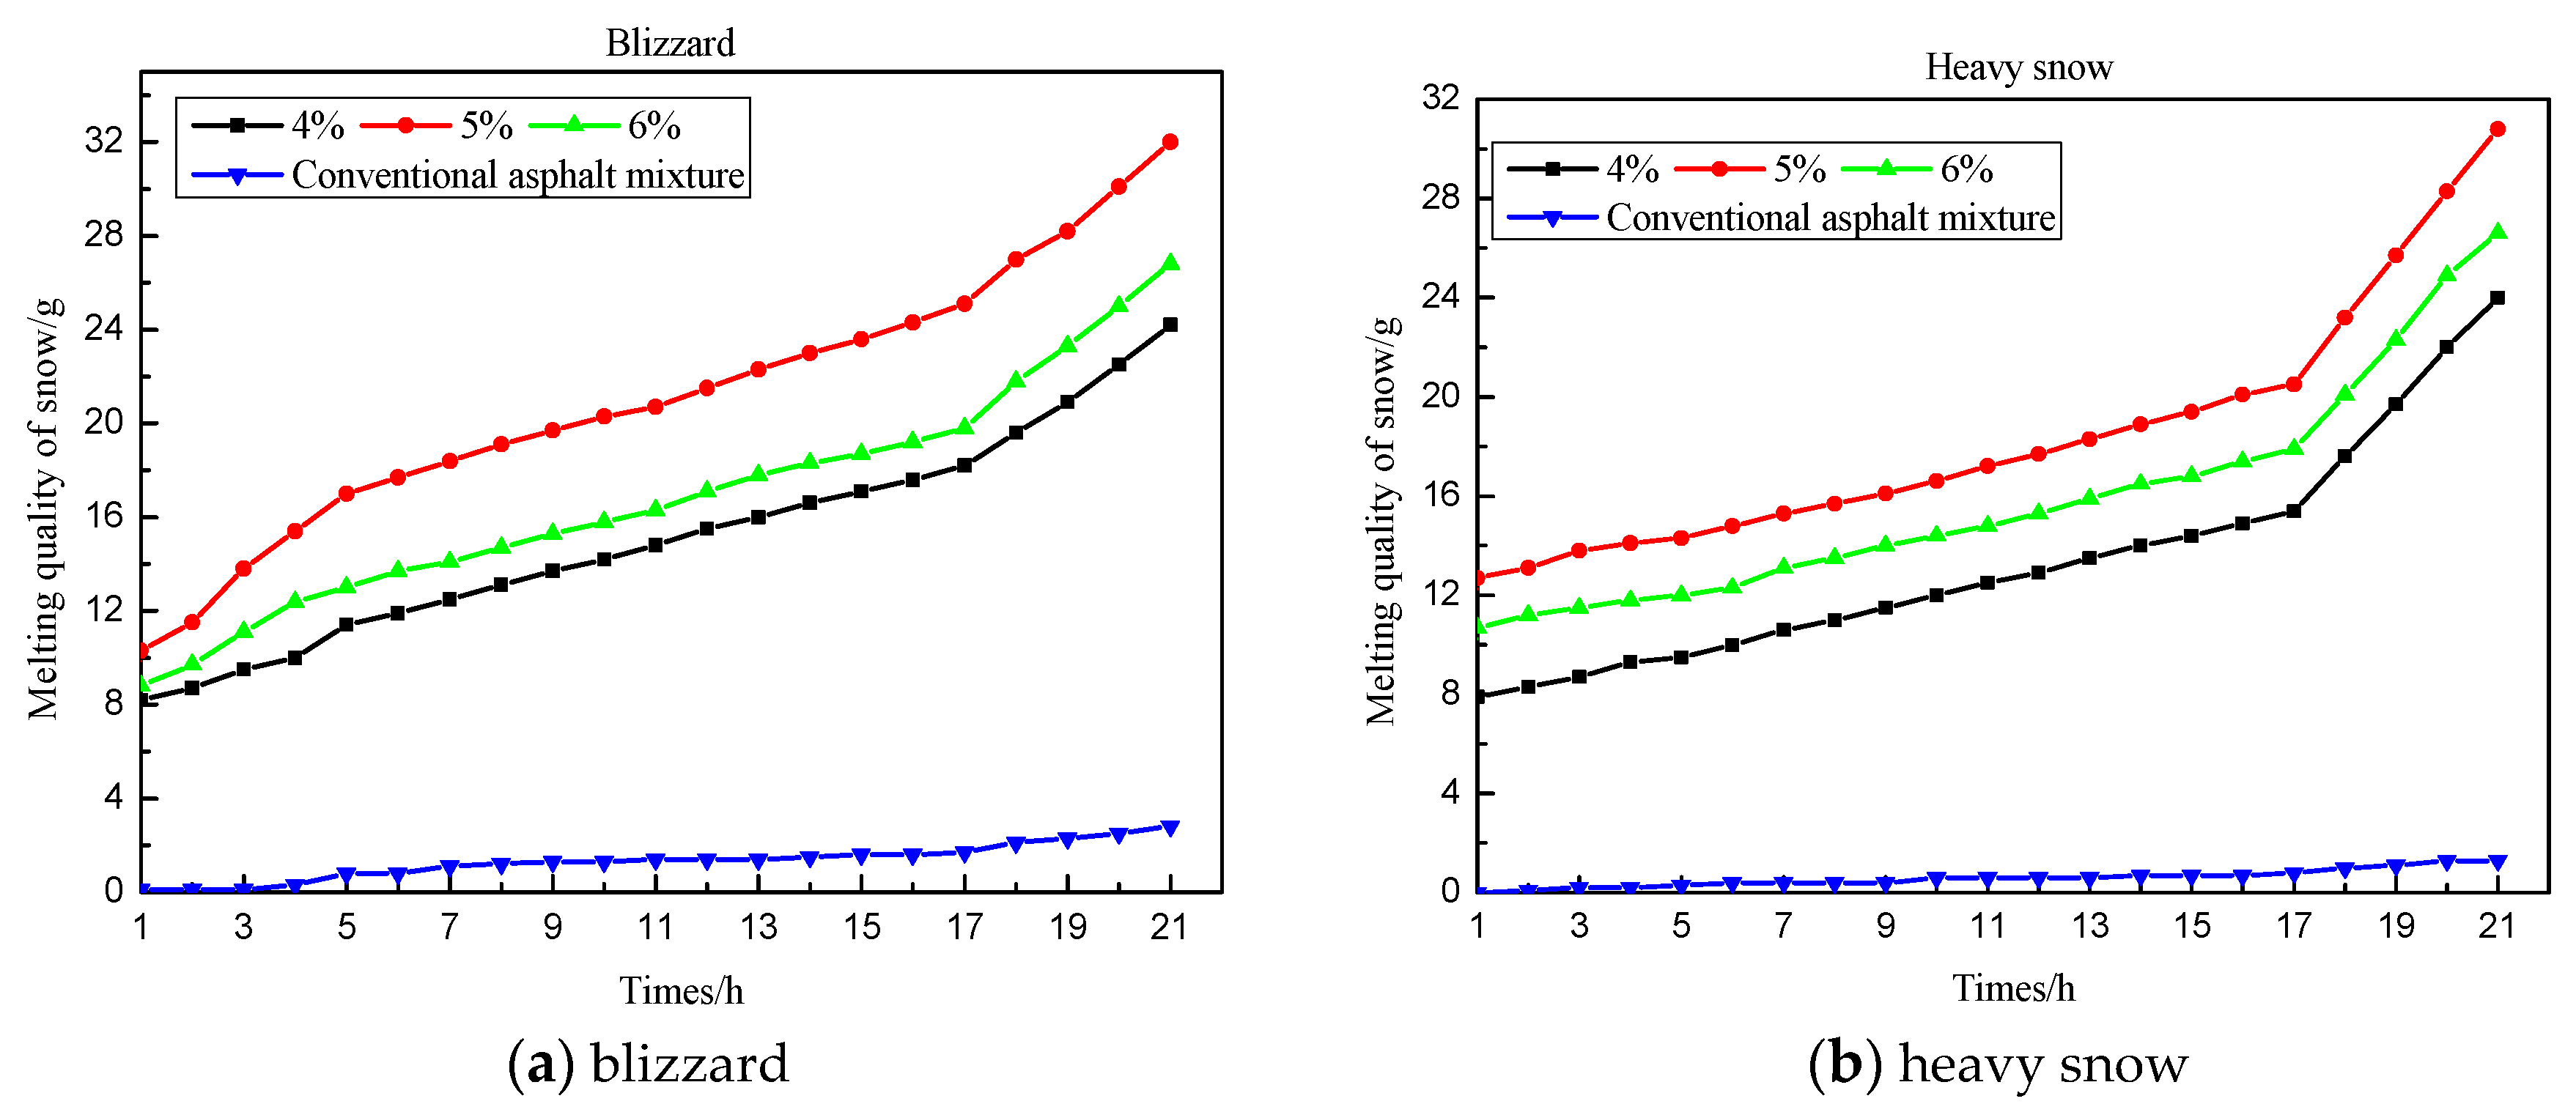
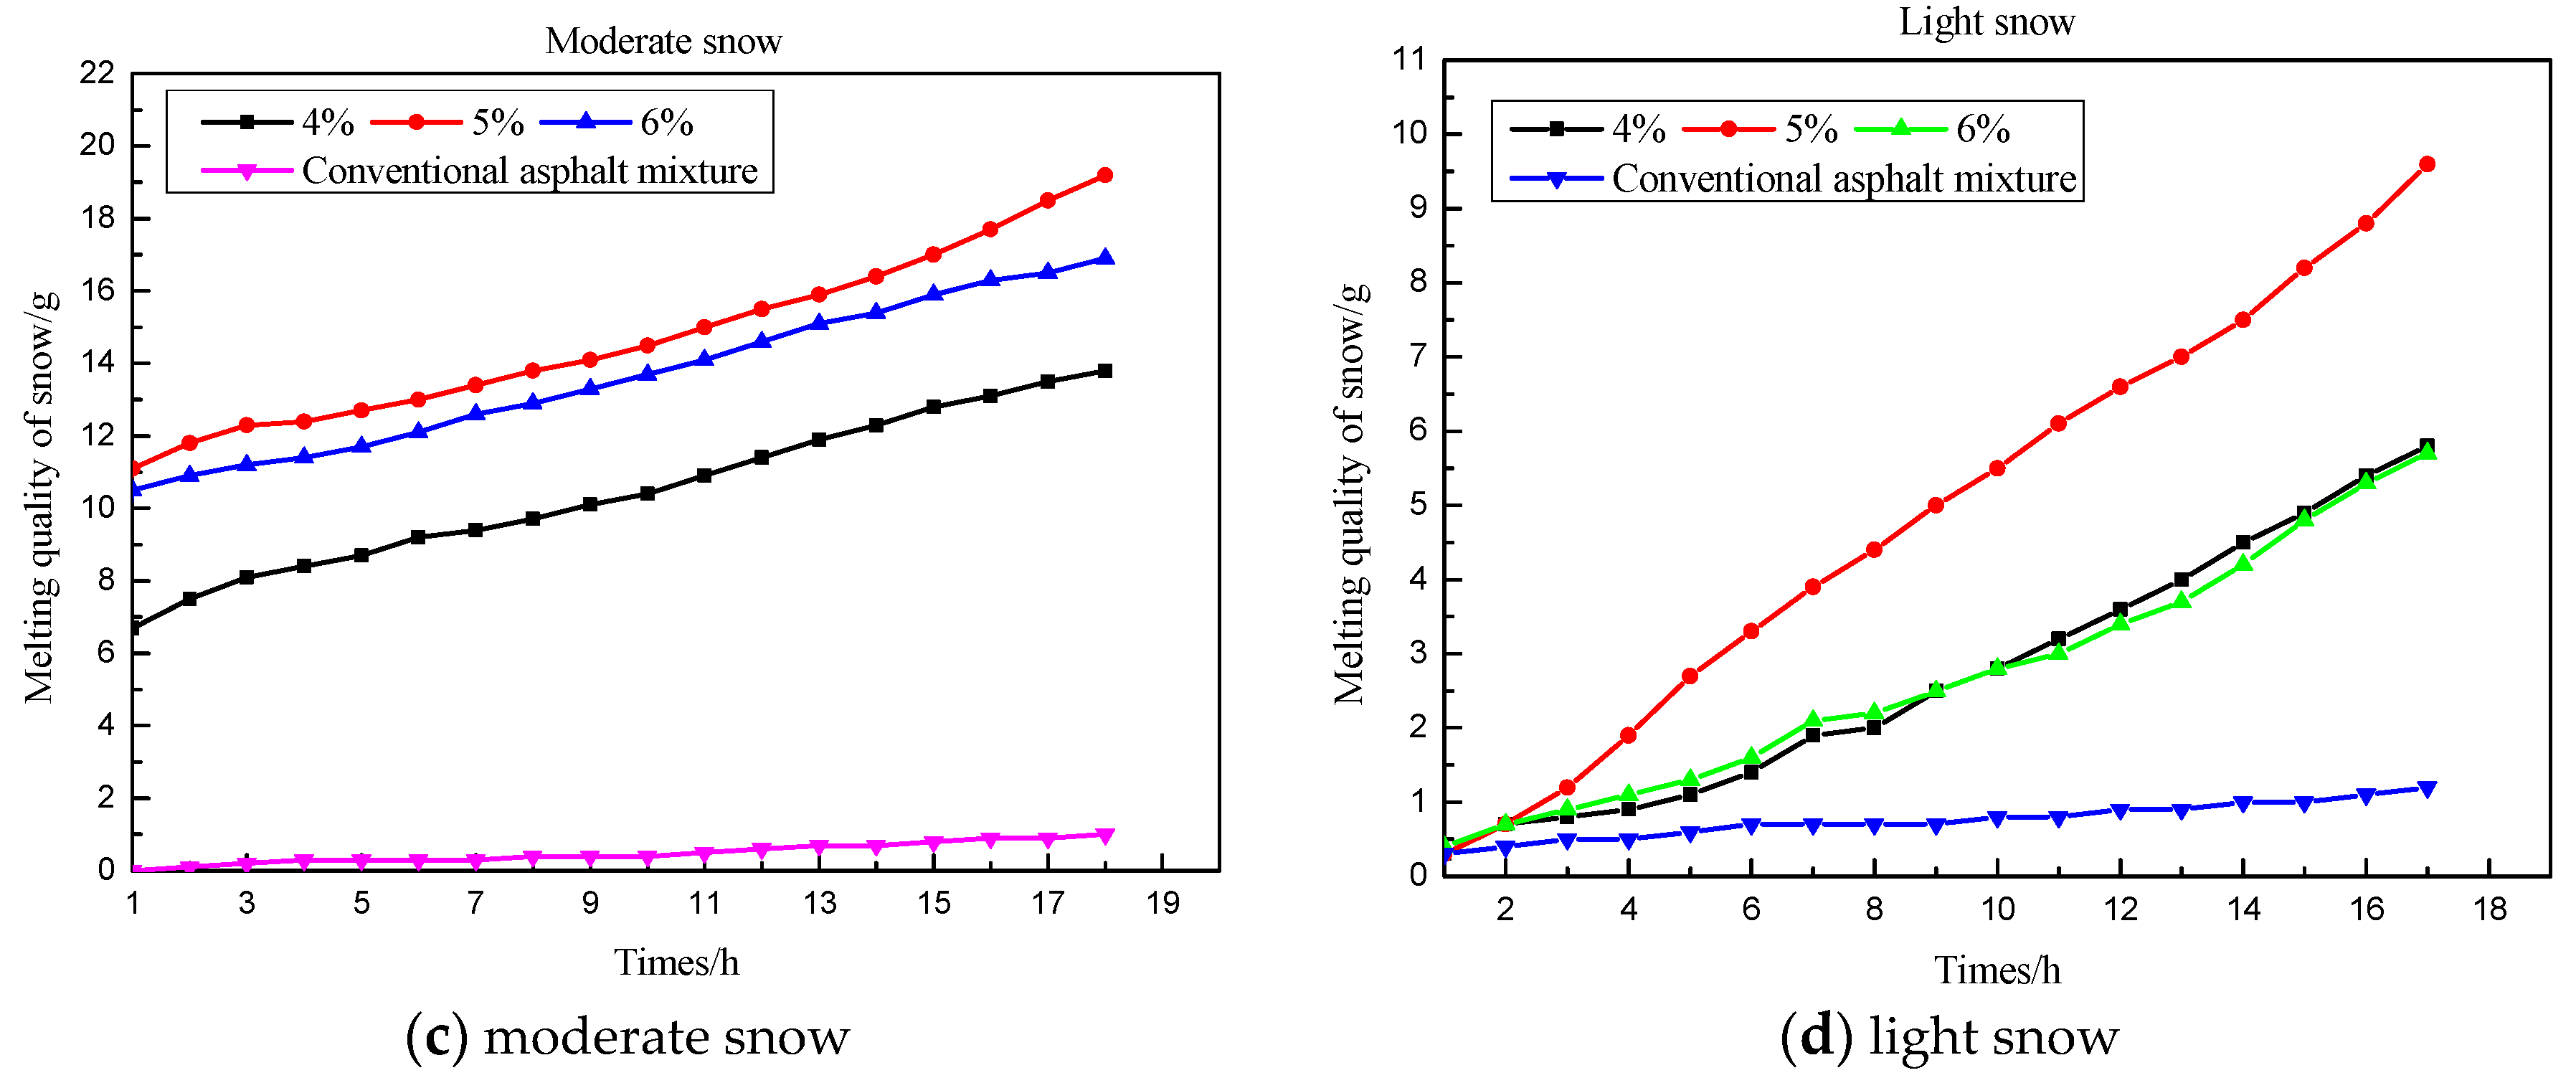
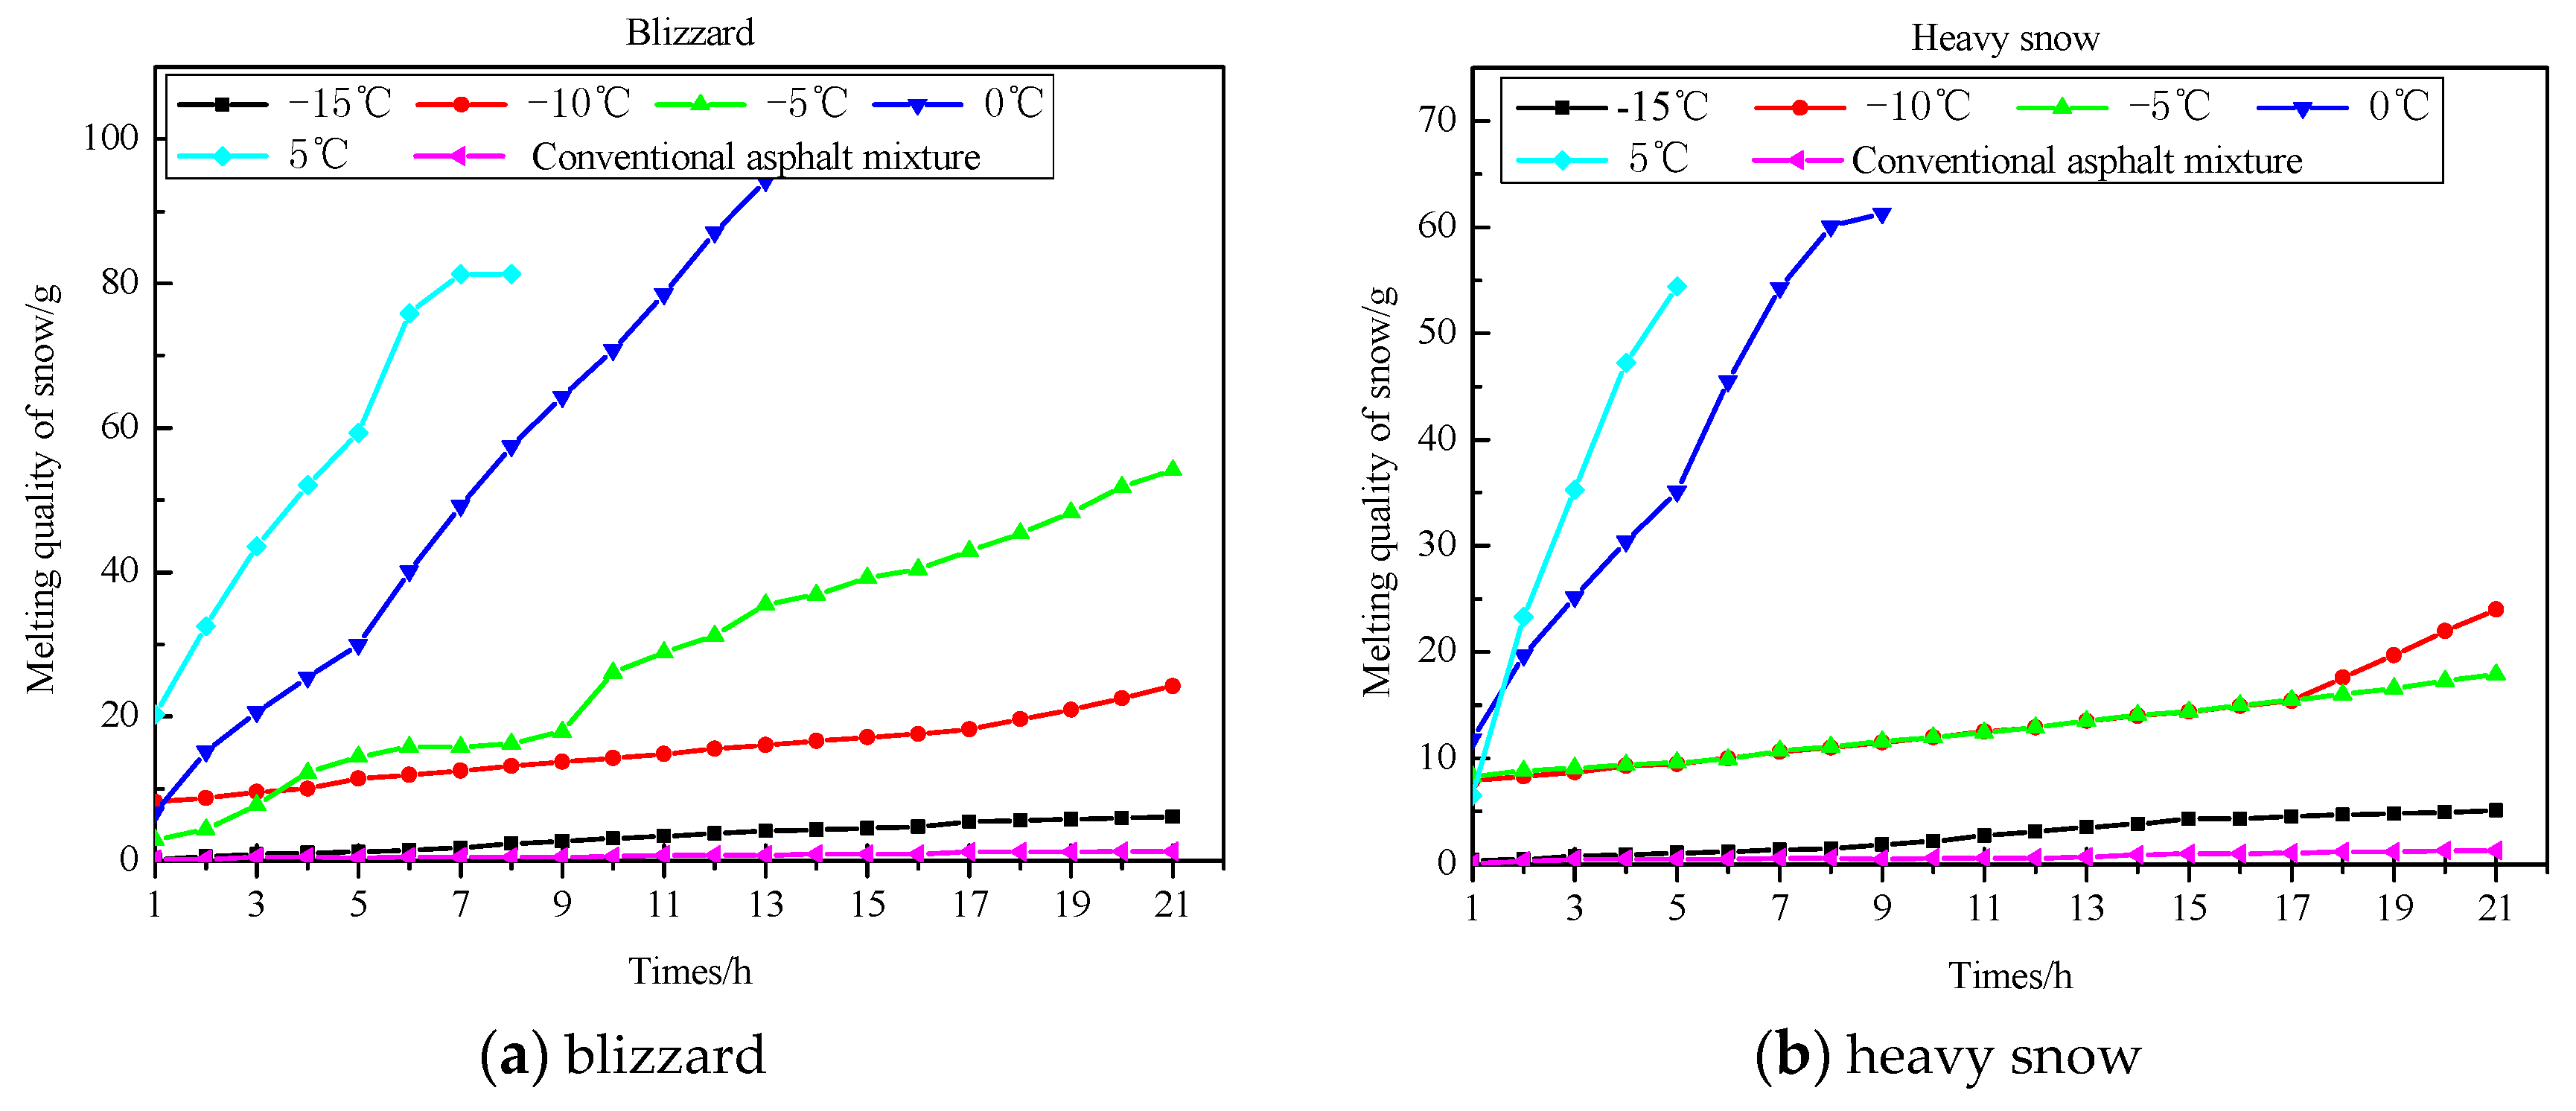
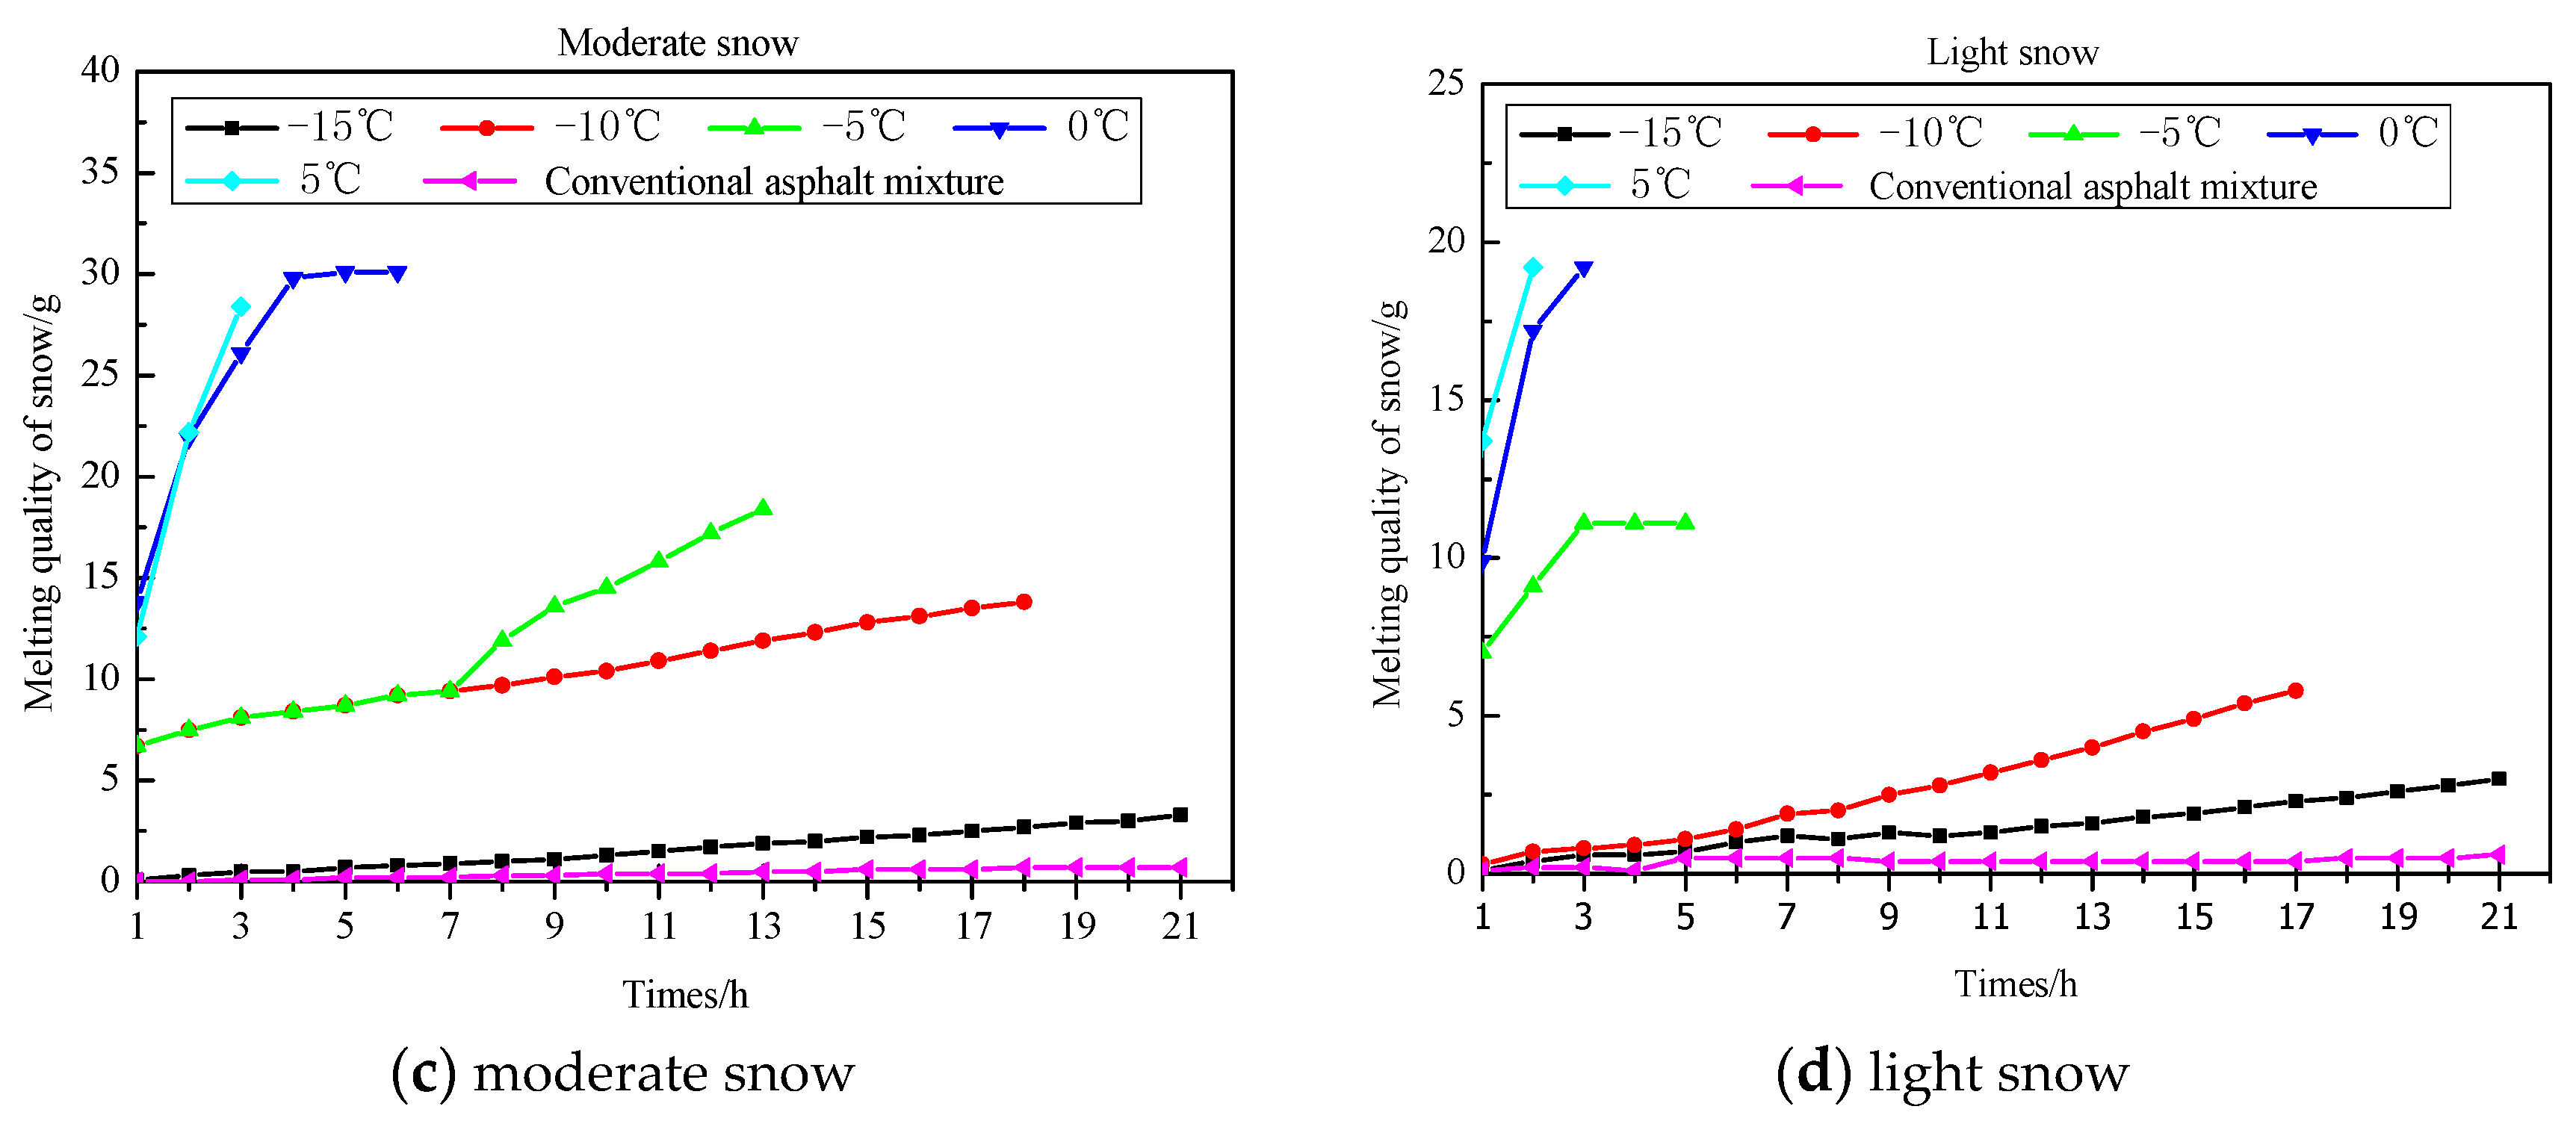
3.1.1. Effect of Snowfall Intensity
With the asphalt mixture containing 5% of V-260, the effect of different snowfall intensity on the melting quality of snow at −15, −10, −5, 0, and 5 °C is illustrated in Figure 8.
Figure 8.
The effect of different snowfall intensity on the melting quality of snow at different temperatures.
The following conclusions are drawn:
- At the five different temperatures, the anti-icing asphalt mixture exhibited a higher snow melting efficiency compared with the conventional asphalt mixture. The reason is that the snow increased the air humidity, which promoted the precipitation of anti-icing filler and formed a salt solution. The salt could be transferred from inside the high-concentration zone to the low-concentration surface, further promoting the precipitation of anti-icing filler and thereby accelerating the snow melting.
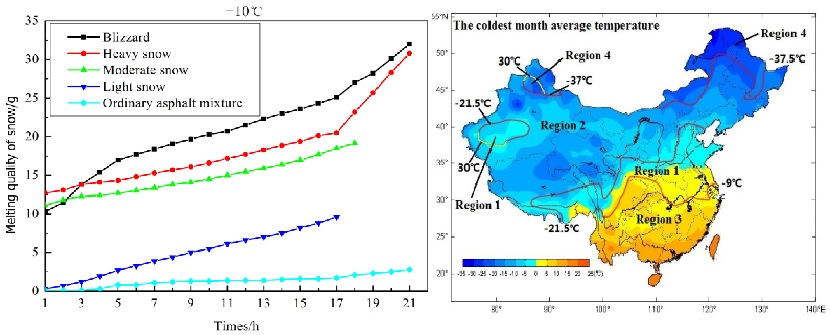
- Under the condition of moderate or light snow, the appropriate application temperature of the anti-icing asphalt mixture is not less than −10 °C. Under the condition of heavy snow or blizzard, the appropriate application temperature is not less than 0 °C, because snow was evidently melted at these temperature ranges. At below 0 and −10 °C, respectively, in both cases, snow was rarely melted. However, the brine solution can lower the adhesion between pavement and ice-snow layer, and the snow-removing efficiency can be improved when other snow-removing methods are applied.
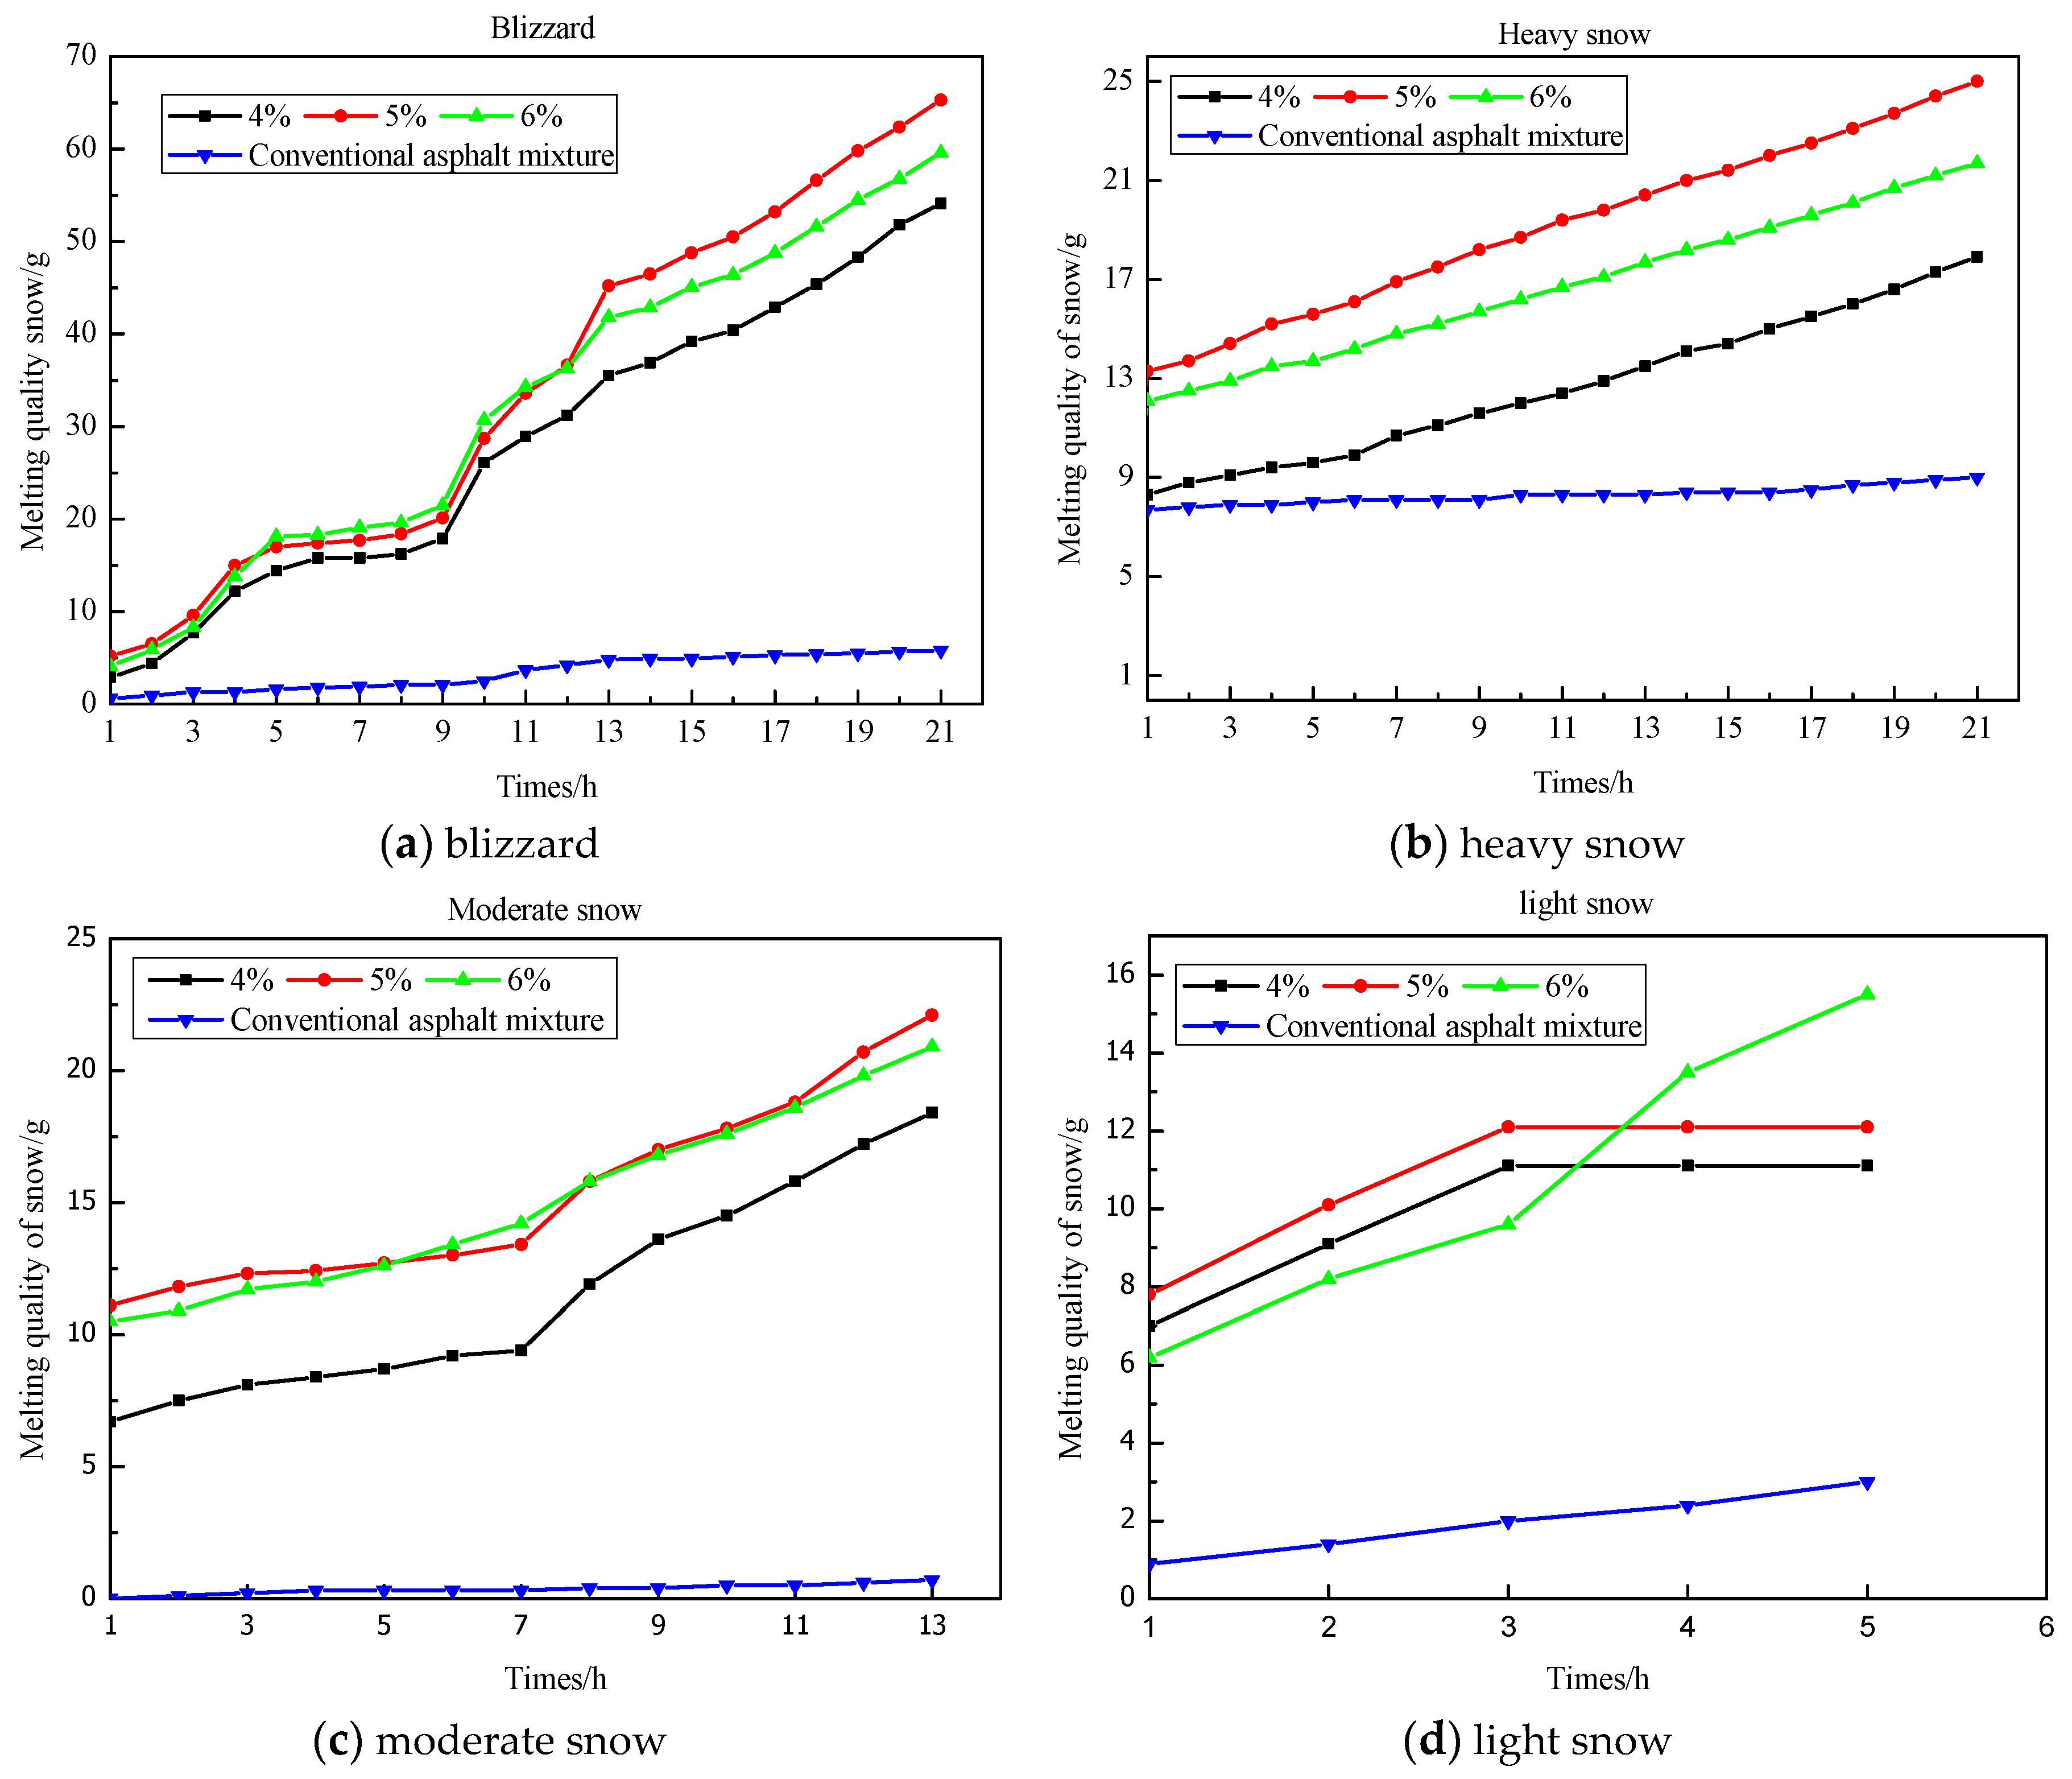
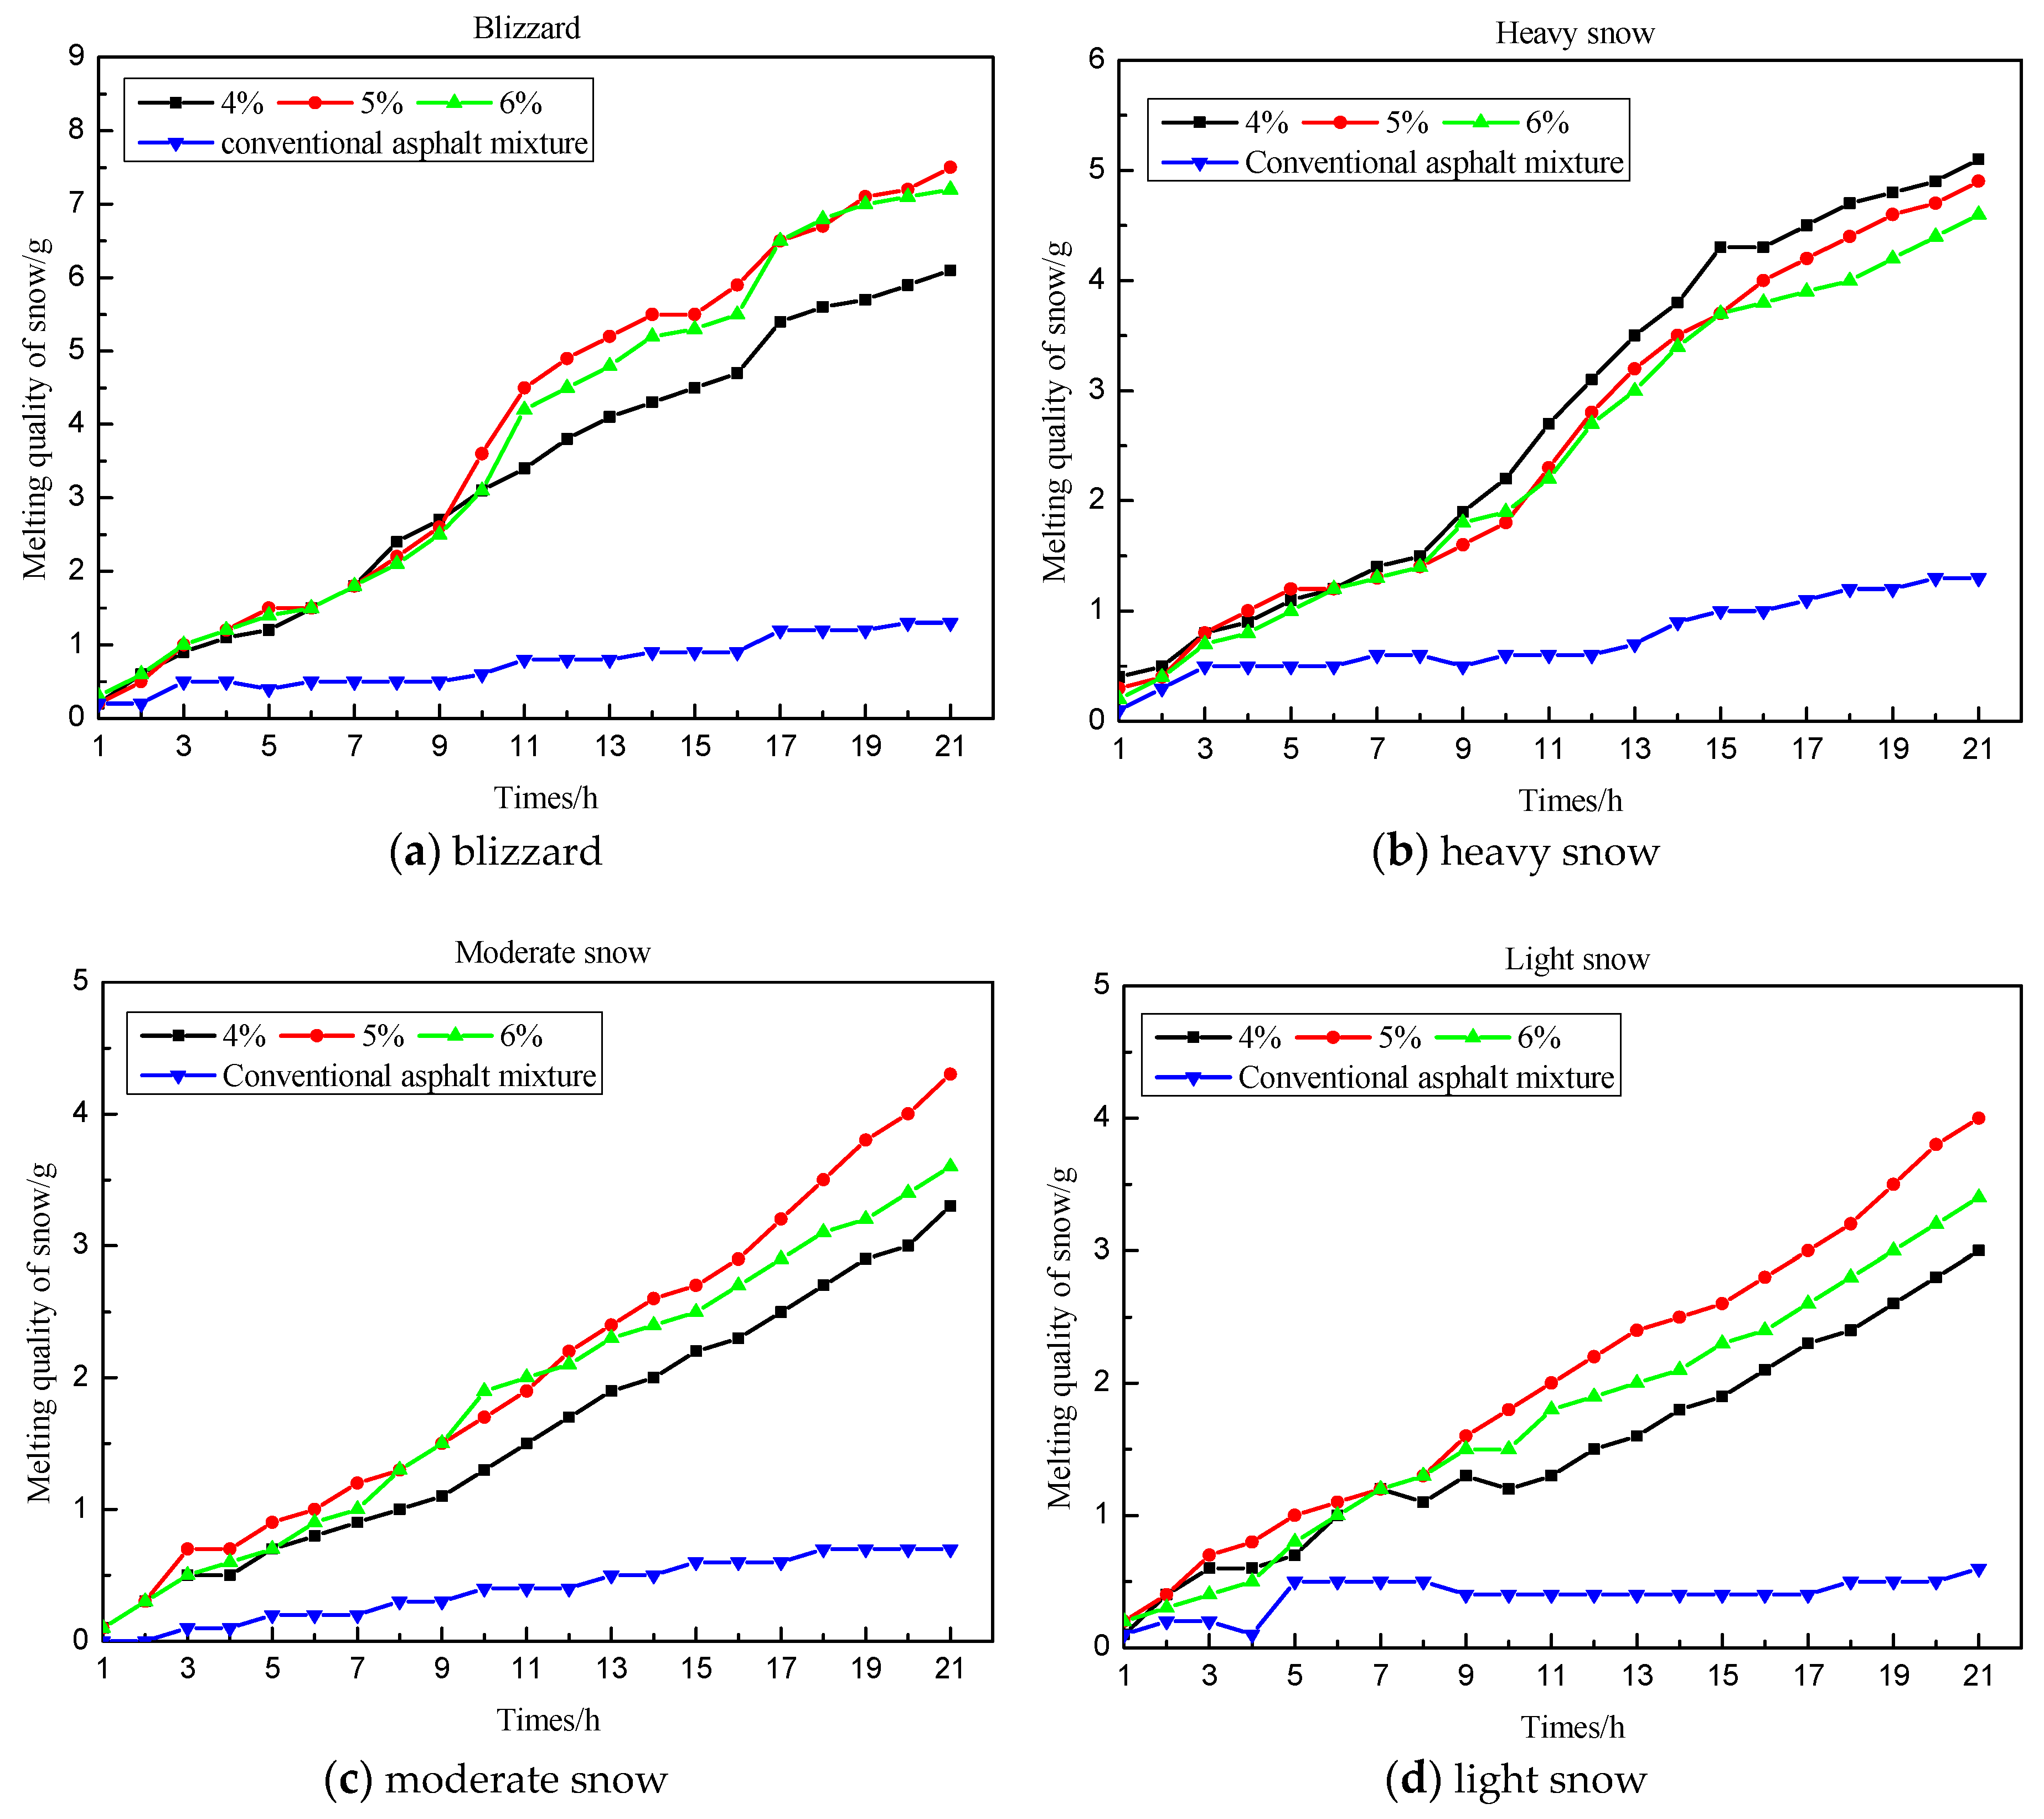
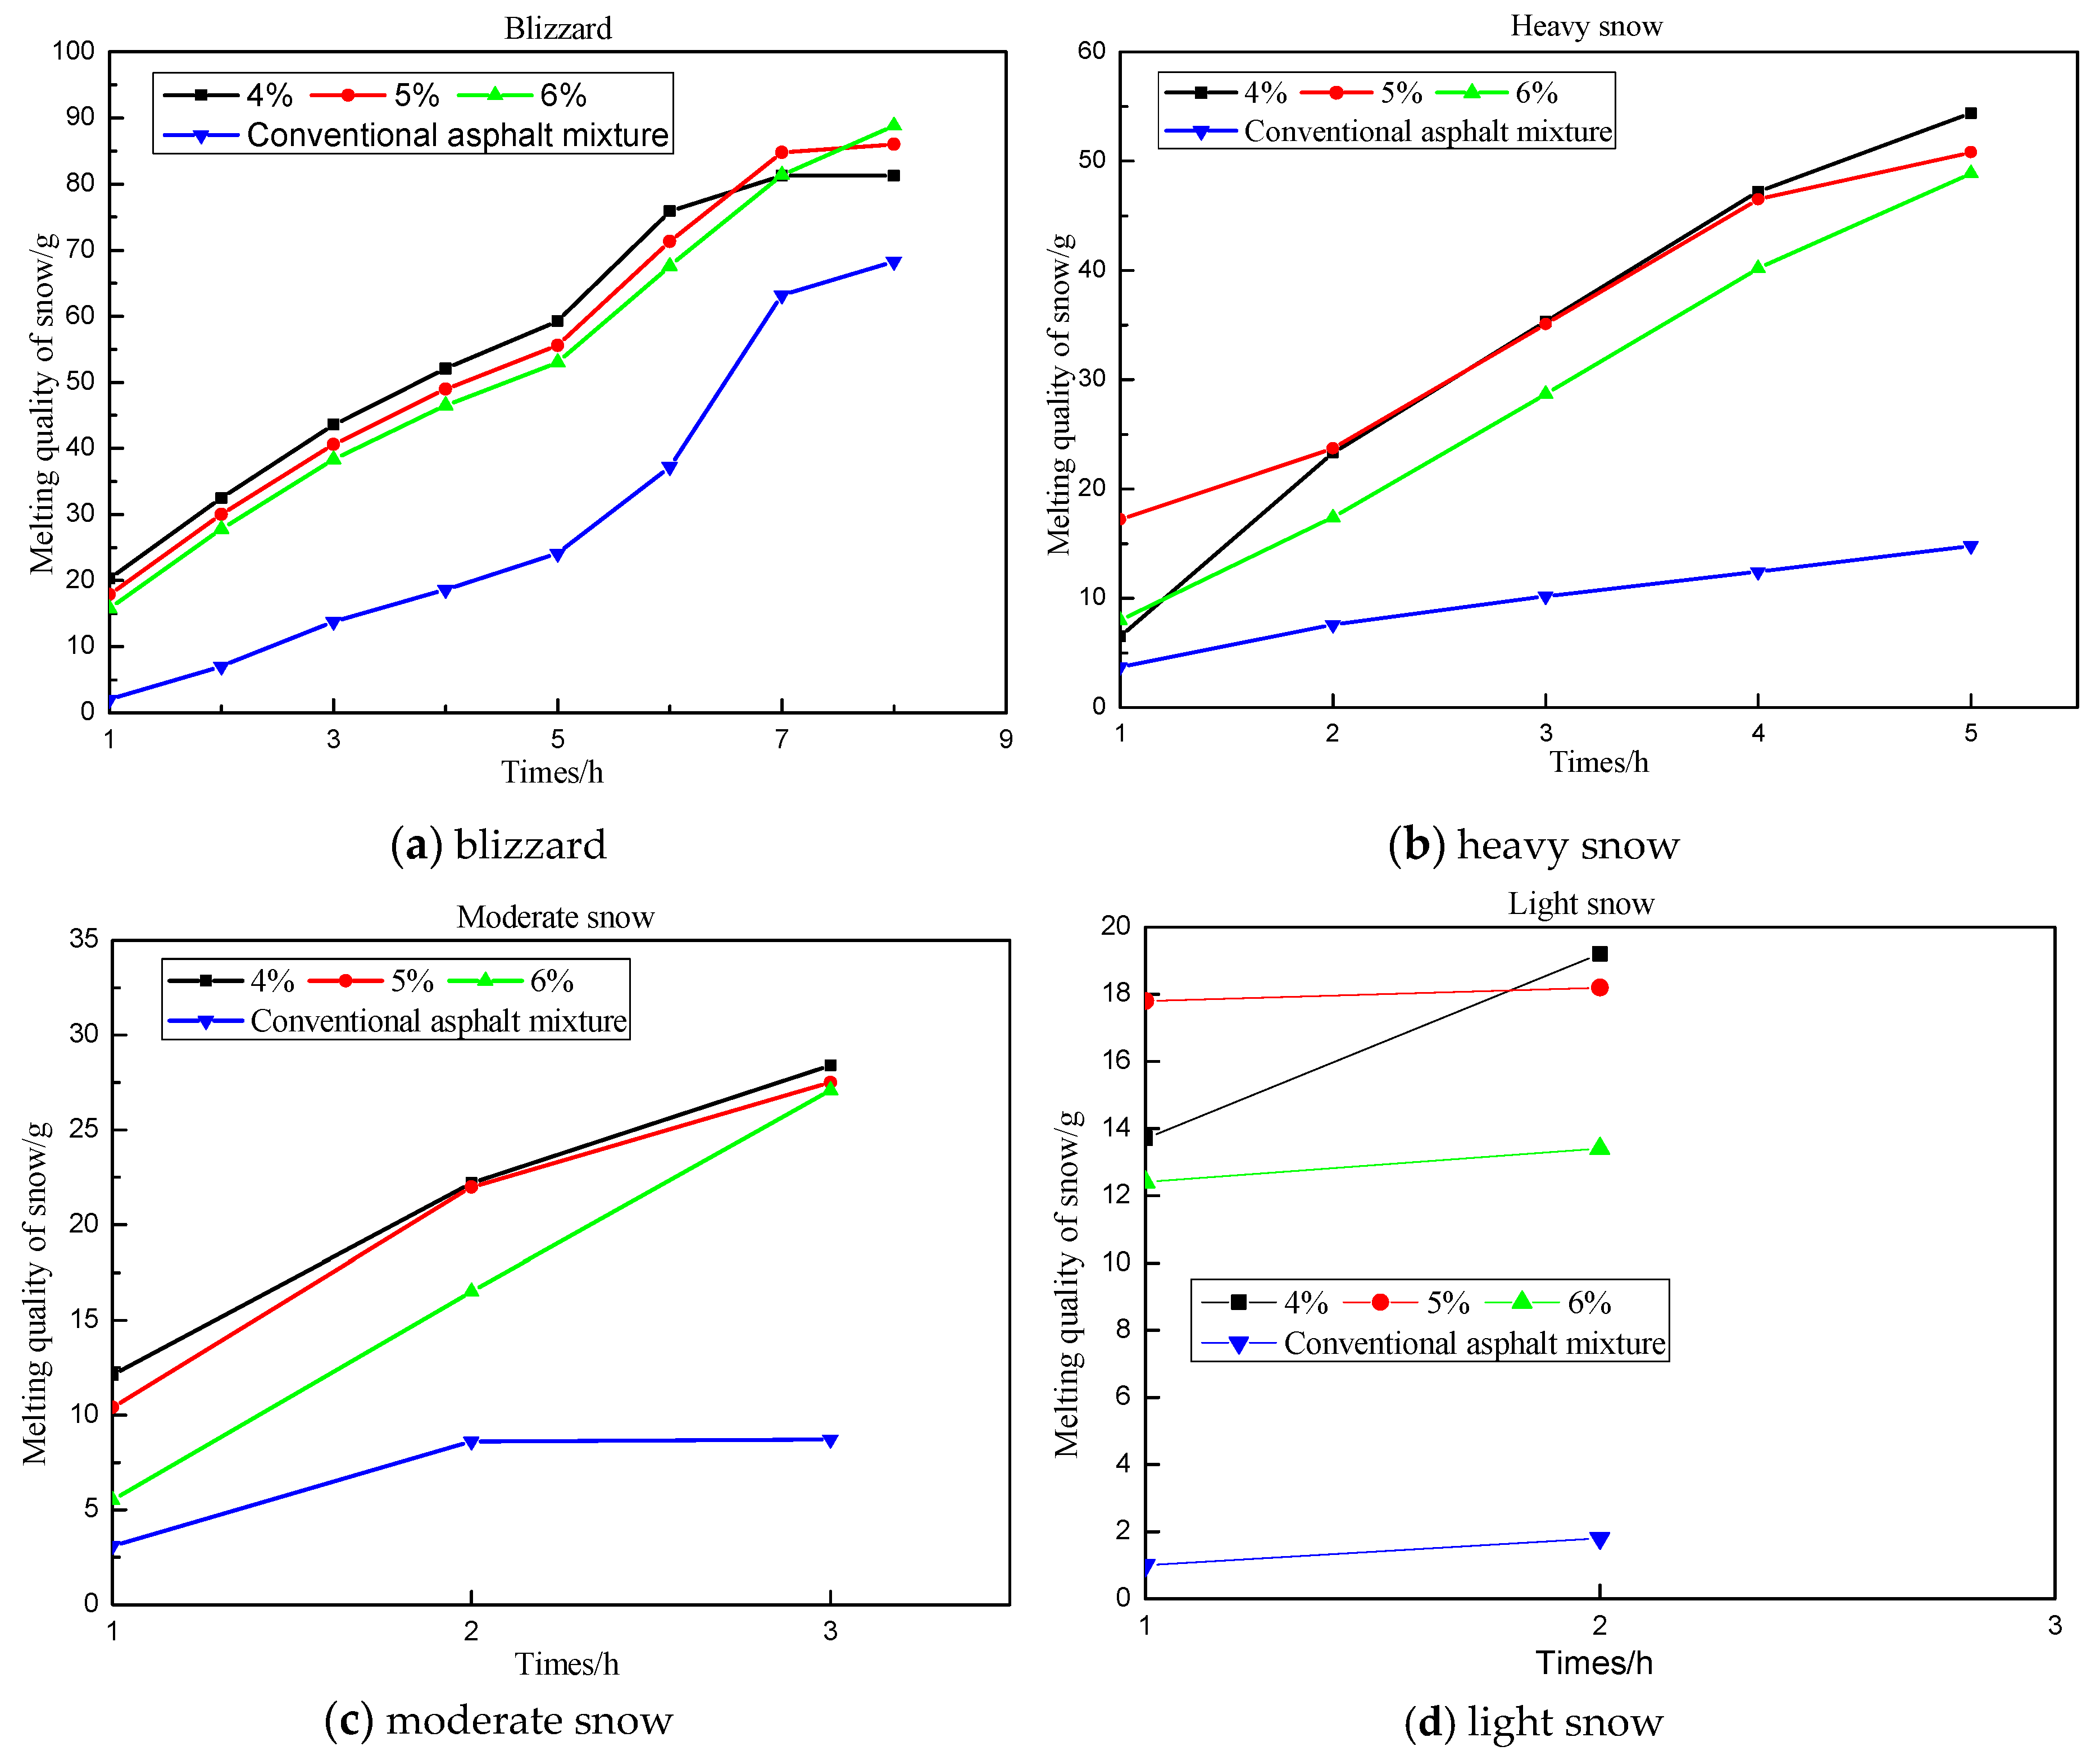
3.1.2. Effect of the Dosage of Anti-Icing Filler
At −5 °C in the environmental chamber, when the snowfall intensity was blizzard, heavy snow, moderate snow, and light snow, the quality of melted snow with the V-260 addition of 4%, 5%, and 6% were determined, respectively.
Figure 9 shows the following results:
Figure 9.
The effect of different dosage of anti-icing filler on the melting quality of snow at different snowfall intensity and −5 °C.
- Compared with the conventional asphalt mixture, the asphalt mixtures with different amounts of V-260 addition all exhibit an obviously improved ice and snow melting performances.
- At −5 °C, the effect of the amount of anti-icing filler had a minor influence on the melting quality of snow. At −15, −10, 0, and 5 °C, the results of these effects were similar, as shown in Figure 10, Figure 11, Figure 12 and Figure 13. This can be attributed to low addition amounts and short test times.
Figure 10. The effect of different dosage of anti-icing filler on the melting quality of snow at different snowfall intensity and −15 °C.
Figure 11. The effect of different dosage of anti-icing filler on the melting quality of snow at different snowfall intensity and −10 °C.
Figure 12. The effect of different dosage of anti-icing filler on the melting quality of snow at different snowfall intensity and 0 °C.
Figure 13. The effect of different dosage of anti-icing filler on the melting quality of snow at different snowfall intensity and 5 °C.
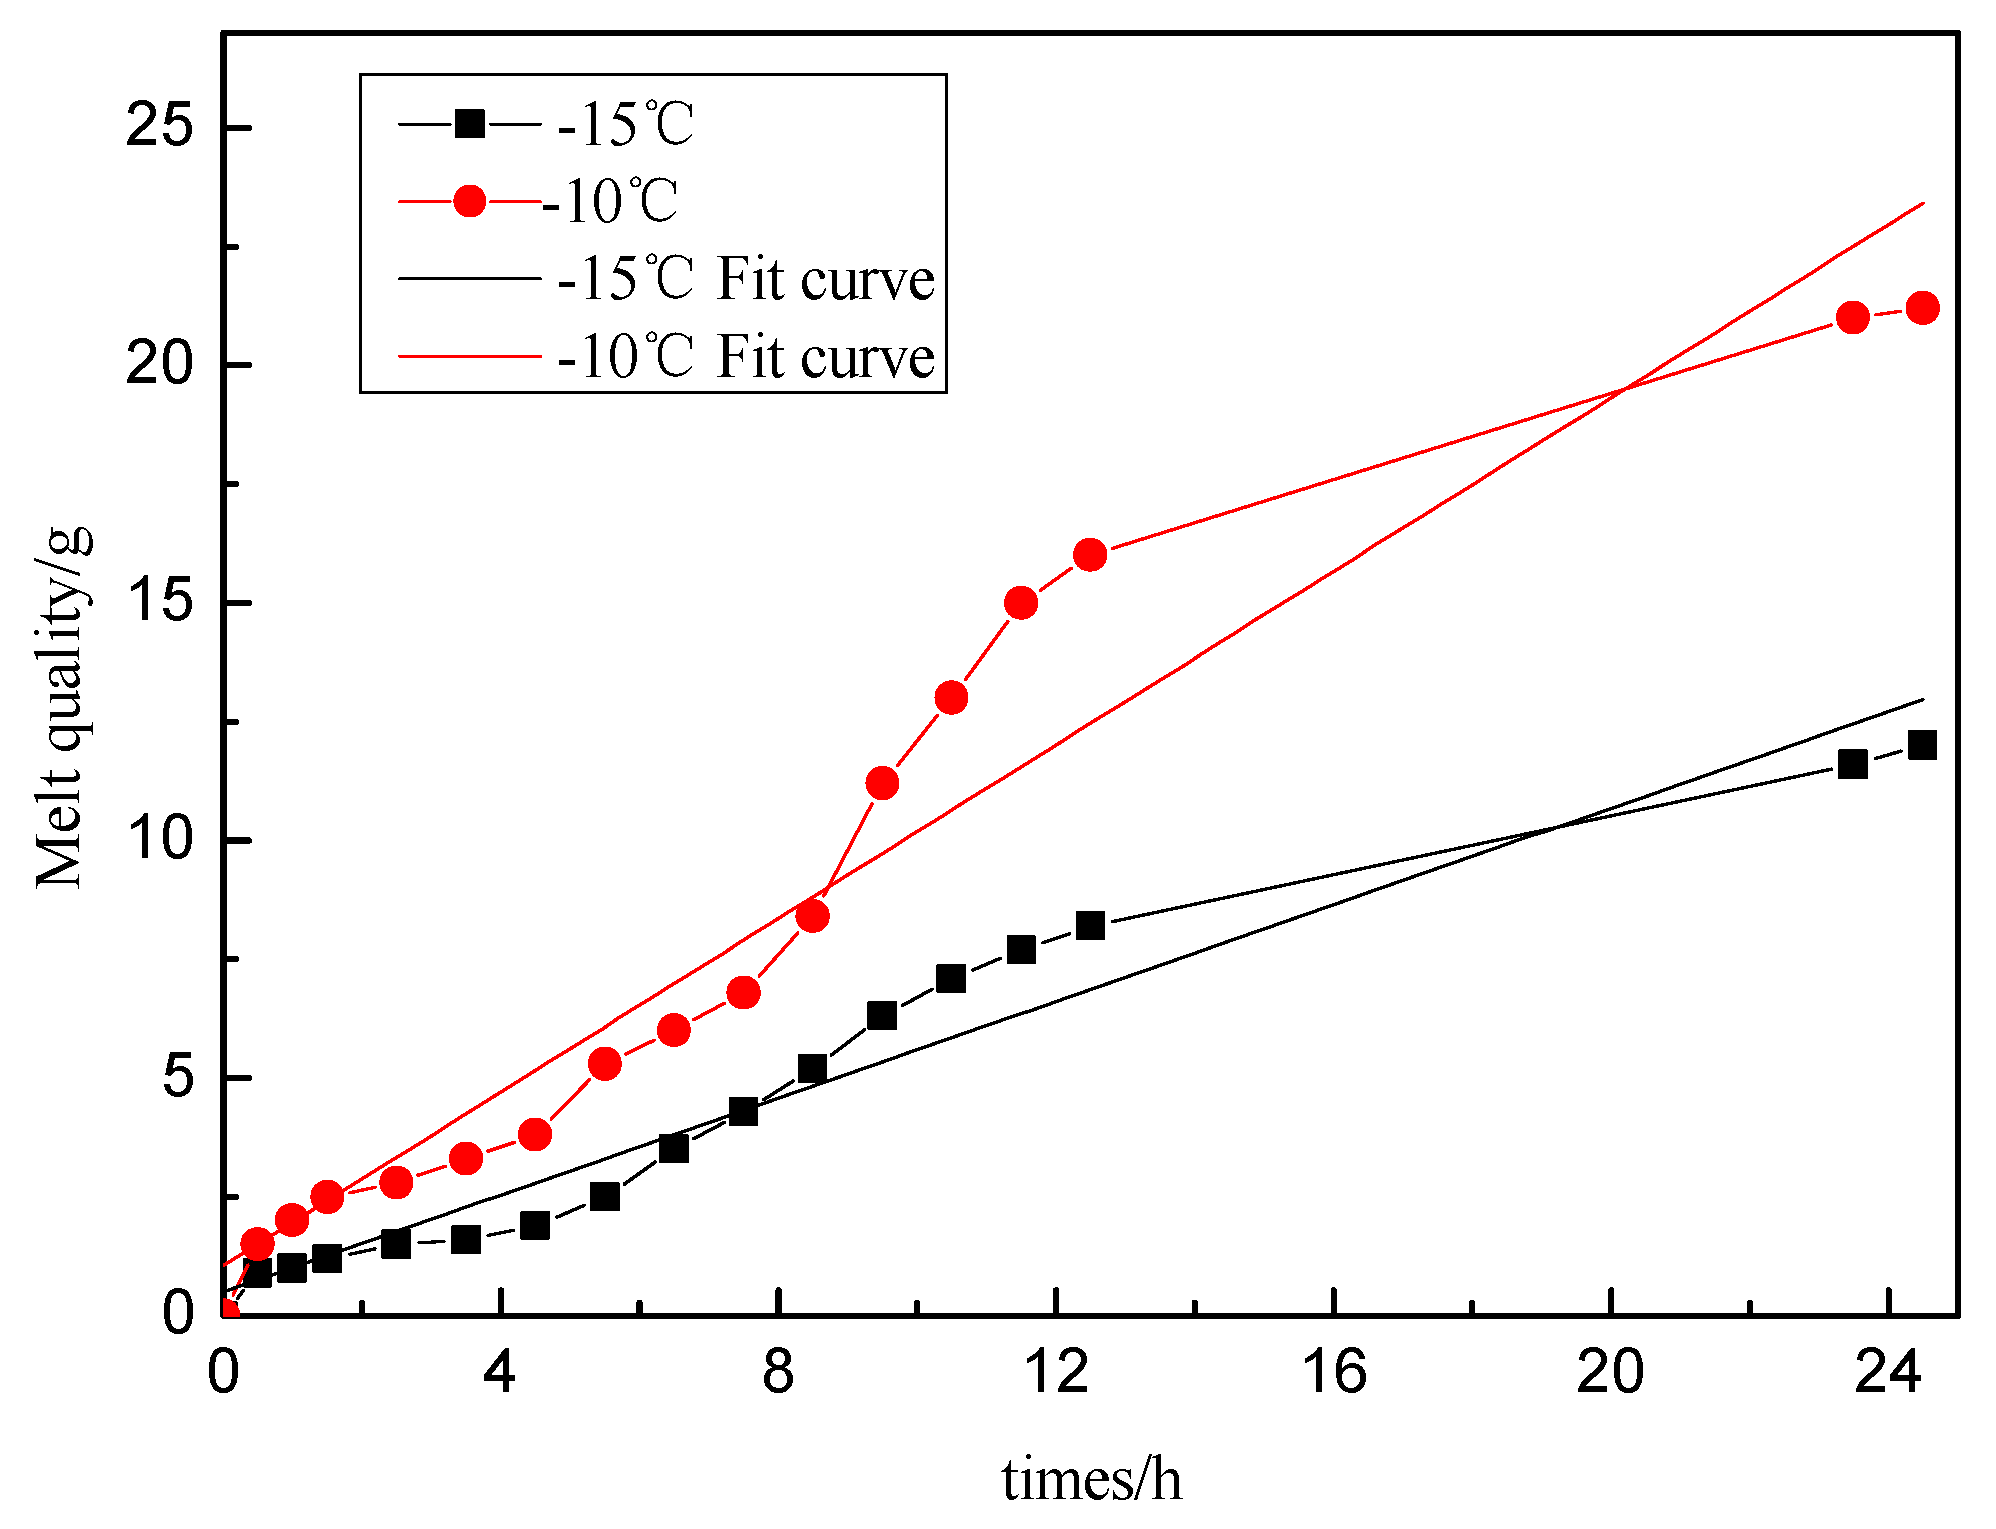
3.1.3. Effect of Temperature
With the asphalt mixture containing 4% of V-260, the quality of melted snow at different temperatures and snowfall intensities was studied, as shown in Figure 14.

Figure 14.
The effect of different temperatures on the melting quality of snow at different snowfall intensity.
It can be observed that moderate snow was melted within 18, 13, 6 and 3 h at −10, −5, 0, and 5 °C, respectively; light snow was melted within 17, 5, 3 and 2 h at −10, −5, 0, and 5 °C, respectively; snow from a blizzard was melted within 13 and 5 h at 0 and 5 °C, respectively; and heavy snow was melted within 9 and 8 h at 0 and 5 °C, respectively. The melting rate rose with the increase of temperature. Under same snowfall intensity, anti-icing filler spent less time on melting the snows with same masses at a higher temperature. It is indicated that the snow-melting effect of anti-icing admixture is strongly dependent on temperature. The melting effect is weak at low temperatures.
3.1.4. Regression Analysis of Snow Melting Effect
The profile in Figure 8 was regressed following the model (y = ax + b, where x is the time; y is the melting quality of snow with the use of V-260; a and b are coefficients) and the regression formula and the determination coefficient (R2) are listed in Table 12. The determination coefficients reflect that the regression is reliable.
Table 12.
Regression formula between melting quality and times of anti- icing asphalt mixture.
All the regression results in Table 12 show a significant linear relationship between time and the mass of melted snow. On the other hand, with the increase of temperature, the melting rate was 2–3 times increased under the same snowfall intensity. At the same temperature, the melting rate varied slightly under different snow intensities, consistent with the results in Section 3.1.1.
Moreover, IGD was also selected as the anti-icing filler for validating the above-described regression results. The experiments were conducted following the gradation in Section 2.2.1 (4.8% asphalt-aggregate ratio, 5.0% mass ratio of IGD to asphalt mixture, and 5.0% mineral powder). The experimental results are shown in Figure 15, and the regression results are shown in Equations (8) and (9). The melting rate also corresponds with the linear relationship, and the melting rate of the above two temperatures has a nearly twofold relationship. Besides, the snow melting performance of anti-icing asphalt mixture with IGD is approximate to that of anti-icing asphalt mixture with V-260 in a short term.
Figure 15.
The effect of asphalt mixture with IGD on the melting quality of snow at blizzard.
3.2. Deicing Test
Deicing test processes of the conventional (left specimen) and anti-icing (right specimen) asphalt mixtures with V-260 are shown in Figure 16.

Figure 16.
Dropping experiment with different loading times.
During the freezing process, the anti-icing filler precipitated from the inside, and thus the surface of the anti-icing asphalt mixtures was white. By contrast, the ice on the top of conventional asphalt mixture was nearly transparent. After 46 impact loads, the ice over the anti-icing asphalt surface was completely removed, while the ice over the normal asphalt mixture was completely removed after 61 impact loads. Affected by the loads and humidity, the anti-icing filler continuously precipitated to form a salt solution. The freezing point was hence decreased and a small amount of ice was melted, reducing the adhesion between the specimen and ice. Therefore, the ice is more easily to be removed on the anti-icing asphalt surface, especially when subjected to impact loads. According to deicing test results, self-ice-melting pavements are recommendable when ice and snow freeze on the pavement under a great snowfall intensity at a low temperature since it can accelerate the removal of ice and snow.
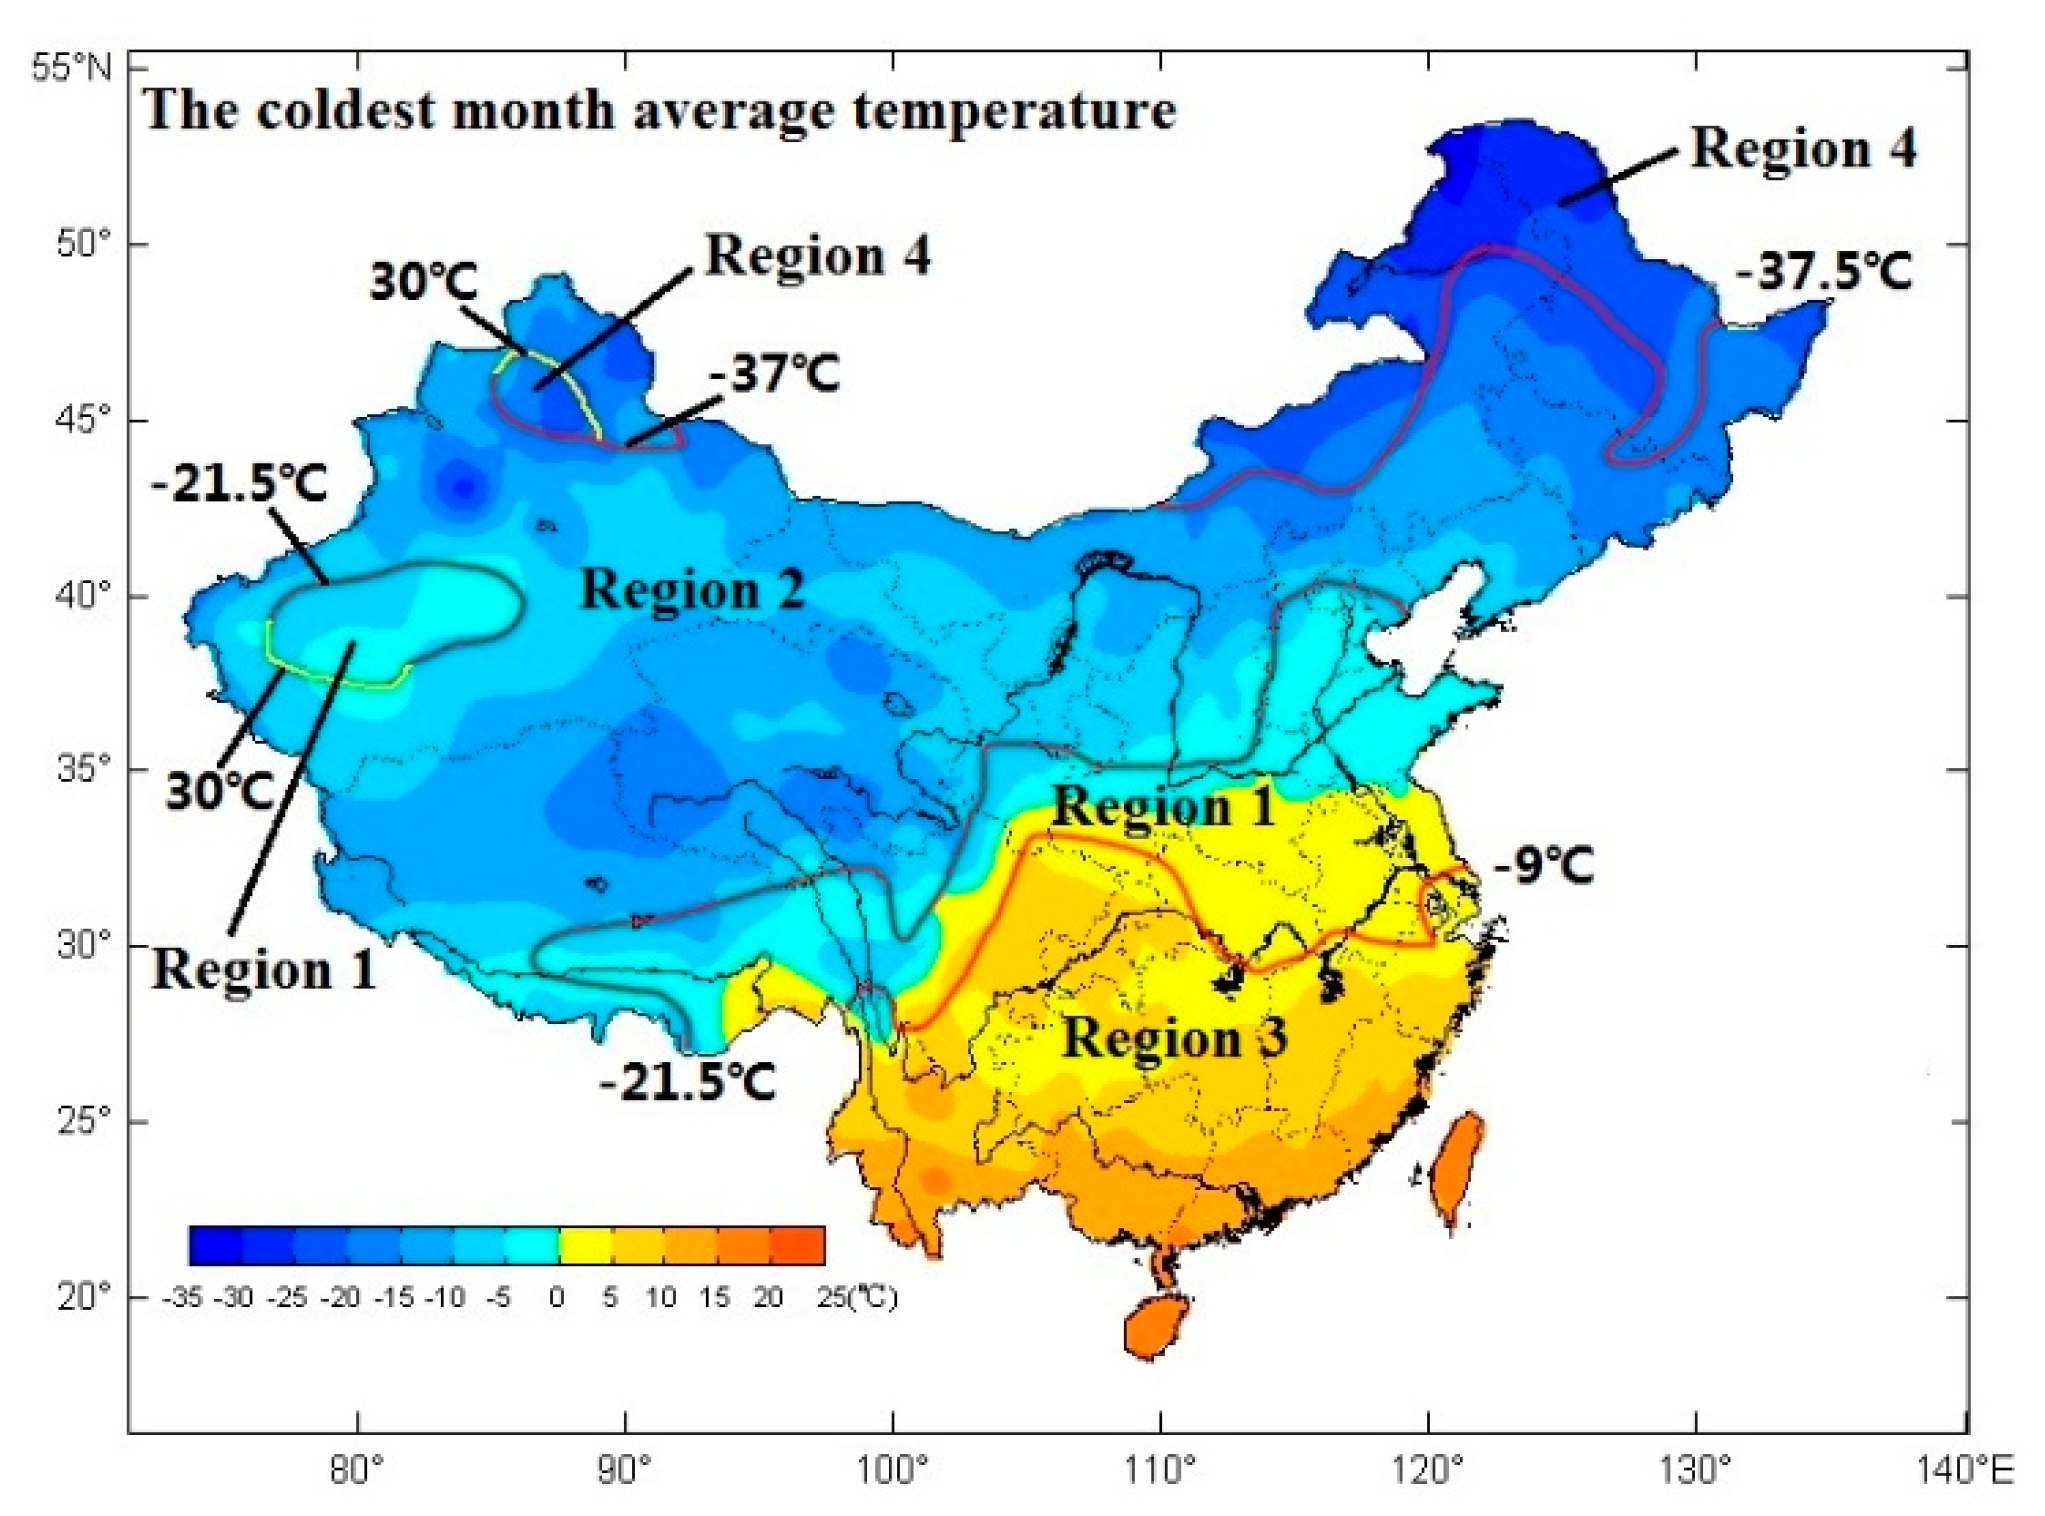
3.3. Climate Zone of the Anti-Icing Asphalt Mixture
Because the climatic conditions in different regions of the world are very different, the climate zone of the anti-icing asphalt pavement is presented for ensuring that the anti-ice asphalt road can adapt to the climate. Firstly, the extremely minimum temperature, snowfall intensity and the coldest month’s average temperature of a region in the last 30 years should be considered to ensure the continuous self-snow effect of anti-icing filler. Secondly, the high temperature indicators and the rainfall are considered to make anti-ice asphalt pavement performance to meet the requirements. Taking China as an example to introduce the method of climate zone, the climate zone index is shown in Table 13, the climate zone boundaries are shown in Figure 17.
Table 13.
Climatic Division of anti-icing asphalt mixture.
Figure 17.
Climatic Division of anti-icing asphalt mixture.
Region 1: The area with the extremely minimum temperature in the last 30 years between −9 and −21.5 °C is chilling region. In this region, the average temperature in the coldest month is above −10 °C; in terms of snowfall intensity, moderate and light snows frequently fall. Because snow can be melted in a short time, the anti-icing asphalt mixture is most applicable.
Region 2: The area with the extremely minimum temperature in the last 30 years between −21 and −37 °C is cold region. In this region, the average temperature in the coldest month is above −15 °C. Moderate snowfalls frequently occur while heavy snowfalls occasionally occur. Because of the variance of temperature, the anti-icing asphalt mixture is also applicable.
Region 3: The area with the extremely minimum temperature in the last 30 years above −9 °C is warm region. In this region, the average temperature in the coldest month is above 0 °C. Light snowfalls most frequently occur. The frozen rain or melted snow in some regions could be iced again, and hence the anti-icing asphalt mixture can be paved in some special sections such as bridges and tunnel entrances.
Region 4: The area with the extremely minimum temperature in the last 30 years below −37 °C is severely cold region. Moderate and heavy snowfalls dominate the snowfalls in this region, and blizzard occasionally occur. The anti-icing filler is ineffective for a long time in this region. Hence, the anti-icing filler is not suitable in this region. However, the afore-mentioned experiments in Section 3.2 proved that the application of the anti-icing filler can reduce the adhesion between pavement and ice-snow. Hence, anti-icing asphalt mixtures are applicable to some special sections such as bridges and tunnel entrances for accelerating the removal of ice and snow.
4. Conclusions
- The application temperatures of the anti-icing asphalt mixture should exceed −10 °C for the moderate or light snow conditions and exceed 0 °C for heavy or blizzard conditions.
- A linear dependence between the anti-icing asphalt mixture snowmelt quality and time was observed for all tested values of snowfall intensity and temperature. On the other hand, under the same snowfall intensity conditions, a two- to threefold increase of the melting rate with temperature was observed. At the same temperature, only a slight variation of the melting rate for different snowfall intensities was observed.
- The anti-icing asphalt mixture has the function of deicing performance so that the adhesion between ice and pavement can be reduced.
Four regions of the anti-icing asphalt mixture application climate zone have been identified as follows: Region 1, which is denoted as the chilling region, and the extremely minimum temperature range is between −9 and −21.5 °C; Region 2, which is denoted as the cold region, and the extremely minimum temperature range is between −21 and −37 °C; Region 3, which is denoted as the warm region, and the extremely minimum temperature is above −9 °C; and Region 4, which is denoted as the severely cold region, and the extremely minimum temperature is below −37 °C.
Acknowledgments
This research was supported by the Fundamental Research Funds for the Central Universities in China (No. 310821163502), the Customize Traffic Science and Technology Project of Rizhao city in Shandong Province, the Science and Technology Innovation Plan of Shandong Province (Grant No. LU Transport Technology [2011] 22), the Science and Technology Project of Tianjin city and the Transportation Science and Technology project of Henan Province (Grant No. 2010P229).
Author Contributions
Mulian Zheng was in charge of the whole research plan and paper submission matters. The first author extends gratitude to Shujuan Wu, Chongtao Wang and Lei Peng for performing the experiment and analyzing test data; and Yifeng Li and Zonghui Ma for offering help in doing the experiment.
Conflicts of Interest
The authors declare no conflict of interest.
References
- Hall, W.; Smith, L.; Titus-Glover, L.; Wambold, C.; Yager, J.; Rado, Z. NCHRP Research Results Digest 321: Guide for Pavement Friction: Background and Research Guide for Pavement Friction; TRB Publications: Washington, DC, USA, 2009. [Google Scholar]
- COST 344: European Cooperation in the Field of Scientific and Technical Research. Improvements to Snow and Ice Control on European Roads and Bridges; Krzan, S., Oberg, G., Herga, L., Eds.; COST 344: Ljubljana, Slovenia, 2002. [Google Scholar]
- Kiljan, J. Placement of an Experimental Bituminous Concrete Mixture Utilizing an Asphalt Additive—Verglimit; Final Report to Colorado Department of Highways, Report No.: CDOH/DTD/R-89-4; Colorado Department of Highways: Denver, CO, USA, 1989. [Google Scholar]
- Augeri, F. Placement of an Experimental Bituminous Concrete Mixture Utilizing n Asphalt Additive—Verglimit; Final Report to Connecticut Department of Transportation, Report No.: FHWA/CT/RD 1085-2-87-6; Connecticut Department of Transportation: Rocky Hill, CT, USA, 1987.
- Felice, G.; Filippo, M.; Giovanni, P.; Sara, F.; Massimo, P. Effectiveness of sodium chloride-based anti-icing filler in asphalt mixtures. Constr. Build. Mater. 2012, 30, 174–179. [Google Scholar]
- Turgeon, M. Evaluation of Verglimit (A De-Icing Additive in Plant Mixed Bituminous Surface); Final Report to Minnesota Department of Transportation, Report No.: FHWA/MN/RD-89/02; Minnesota Department of Transportation: St. Paul, MN, USA, 1989. [Google Scholar]
- Sato, K.; Hori, H. Development of anti-icing asphalt pavement using rubber particles. In Proceedings of the 11th New Challenges for Winter Road Service, XIth International Winter Road Congress, Sapporo, Japan; 2002. [Google Scholar]
- Stroup-Gardiner, M. Use of Verglimit De-Icing Product on El Dorado County Highway 50 PM 38.6 to 39.7; California Pavement Preservation Center, Report No.: CP2C-2008-103 TB; California Pavement Preservation Center: Chico, CA, USA, 2008. [Google Scholar]
- Chappelow, C.; McElroy, D.; Blackburn, R.; Darwin, D.; de Noyelles, G.; Locke, E. Handbook of Test Methods for Evaluating Chemical Deicers. Strategic Highway Research Program; National Research Council, National Academy of Sciences: Washington, DC, USA, 1992. [Google Scholar]
- Wuori, F. Ice-Pavement Bond Disbonding Surface Modification and Disbonding; Strategic Highway Research Program: Washington, DC, USA, 1993. [Google Scholar]
- Anburaj, M.; Laura, F.; Michelle, A.; Wang, S.; Gong, J.; Shi, X. Correlating lab and field tests for evaluation of deicing and anti-icing chemicals: A review of potential approaches. Cold Reg. Sci. Technol. 2014, 97, 21–32. [Google Scholar]
- Nixon, A.; Qiu, J.; Qiu, L.; Kochumman, G.; Xiong, J. Ice melting performance for ice-control chemicals. In Proceedings of the 84th Annual Meeting of the Transportation Research Board, Washington, DC, USA, 9–13 January 2005. [Google Scholar]
- Gerbino-Bevins, M. Performance Rating of De-Icing Chemicals for Winter Operations. Master’s Thesis, University of Nebraska, Lincoln, NE, USA, August 2011. [Google Scholar]
- Sang, L.; Xu, Y. Performance evaluation of high-elastic asphalt mixture containing deicing agent Mafilon. Constr. Build. Mater. 2015, 94, 494–501. [Google Scholar]
- Cuelho, E. Establishing Best Practices of Removing Snow and Ice from California Roadways. In Proceedings of the Winter Maintenance Committee at the 89th Transportation Research Board Annual Meeting, Washington, DC, USA, 10–14 January 2010. [Google Scholar]
- Nixon, A.; Wei, Y. Optimal Usage of De-Icing Chemicals When Scraping Ice: Final Report of Project HR 391; IIHR Technical Report No. 434; IIHR-Hydrocsience and Engineering, University of Iowa: Iowa, IA, USA, 2003. [Google Scholar]
- Xu, O.; Han, S.; Zhang, C.; Liu, Y.; Xiao, F.; Xu, J. Laboratory investigation of andesite and limestone asphalt mixtures containing sodium chloride-based anti-icing filler. Constr. Build. Mater. 2015, 98, 671–677. [Google Scholar] [CrossRef]
- Ma, T.; Geng, L.; Ding, X.; Zhang, D.; Huang, X. Experimental study of deicing asphalt mixture with anti-icing additives. Constr. Build. Mater. 2016, 127, 653–662. [Google Scholar] [CrossRef]
- Sun, Y. Study on the Performance of Asphalt Pavement with Snow Melt Salt. Master’s Thesis, Chang’an University, Xi’an, China, May 2011. [Google Scholar]
- Wang, F.; Han, S.; Zhang, L.; Ling, J. Efflorescence experiment of asphalt mixture with salt for melting snow and ice. J. Chang’an Univ. 2010, 30, 16–19. [Google Scholar]
- Nihira, Y.; Asano, K.; Miyamoto, S.; Oikawa, S. The effect of vehicle on ice- and snow-coated road surface. Mon. Rep. Civ. Eng. Inst. Hokkaido Dev. 2001, 581, 41–45. [Google Scholar]
- Liu, Z.; Sha, A.; Xing, M.; Li, Z. Low temperature property and salt releasing characteristics of antifreeze asphalt concrete under static and dynamic conditions. Cold Reg. Sci. Technol. 2015, 114, 9–14. [Google Scholar] [CrossRef]
- Sun, R. Develop and Performance Evaluate of Sustained-Release Mixture Include Salt. Master’s Thesis, Harbin Institute of Technology, Harbin, China, May 2012. [Google Scholar]
- Anti-icing Materials International Laboratory. Ice Penetration Test: Method for Runways and Taxiways Deicing/Anti-icing Chemicals; Issuing Committee: 2012b, G-12rdf; Runway Deicing Fluids (AIR6211) (04); SAE International: Warrendale, PA, USA, 2012. [Google Scholar]
- Anti-icing Materials International Laboratory. Ice Undercutting Test: Method for Runways and Taxiways Deicing/Anti-icing Chemicals; Issuing Committee: 2012c, G-12rdf; Runway Deicing Fluids (AIR6172) (02); SAE International: Warrendale, PA, USA, 2012. [Google Scholar]
- The Ministry of Communications of the People’s Republic of China. Standard Test Methods of Bitumen and Bituminous Mixtures for Highway Engineering (JTG E20-2011); China Communications Press: Beijing, China, 2011. [Google Scholar]
- The Ministry of Communications of the People’s Republic of China. Standard Test Methods of Aggregate for Highway Engineering (JTG E42-2005); China Communication Press: Beijing, China, 2005. [Google Scholar]
- The Ministry of Communications of the People’s Republic of China. Technical Specifications for Construction of Highway Asphalt Pavements (JTG F40-2004); China Communications Press: Beijing, China, 2005. [Google Scholar]
- Guo, N.; You, Z.P.; Tan, Y.; Zhao, Y. Prediction method on volume of air void of asphalt mixtures based on CT technique. China J. Highw. Transp. 2016, 29, 13–22. [Google Scholar]
- Zhang, Y.; Verwaal, W.; van de Ven, M.; Molenaar, A.; Wu, P. Using high-resolution industrial CT scan to detect the distribution of rejuvenation products in porous asphalt concrete. Constr. Build. Mater. 2015, 100, 1–10. [Google Scholar] [CrossRef]
- Zhu, H.; Zhao, C. Evaluation method of image feature point distribution uniformity. J. DaQing Normal Univ. 2010, 130, 9–12. [Google Scholar]
© 2017 by the authors. Licensee MDPI, Basel, Switzerland. This article is an open access article distributed under the terms and conditions of the Creative Commons Attribution (CC BY) license (http://creativecommons.org/licenses/by/4.0/).