Abstract
This paper proposes a new voltage control methodology using the particle swarm optimization (PSO) technique for smart grid loadability enhancement. The goal of this paper is to achieve reliable and efficient voltage profile/stability regulation in power grids. This methodology is based on the decouple power flow equations and the worst-case design technique. Specifically, the secondary voltage control (SVC) problem is formulated as an L-infinity norm minimization problem which considers overall load voltage deviations in electrical power systems as an objective model, and the PSO technique is employed to determine a robust control action which aims to improve voltage profile and to enlarge transmission grid loadability by optimal coordinated control of VAR sources. The methodology was successfully tested on several IEEE benchmark systems.
1. Introduction
Voltage instability has always been an important issue for grid engineers during the past few decades [1]. Nowadays, renewable generation, energy storage, demand response, and electric vehicles add complexities to power system operation. These factors present more challenges in maintaining voltage stability in a prevailingly open access environment.
The grid components such as system loads, transmission networks, and generators may contribute to voltage instability [2]. When system voltage drops dramatically, it endangers the integrity of the system. Therefore, it is imperative that system operators be provided with good information regarding the system voltage stability [3,4,5]. Indeed, when voltage instability is detected (i.e., the computed value of voltage stability margin is less than or equal to the predefined security margin), appropriate remedial actions should be initiated to prevent the system from possible voltage collapse. For a bulk power system, however, just relying on grid operators to manually adjust many widely dispersed reactive power resources in real-time is an un-realistic and uneconomic way. Thus, the effectiveness and robustness of the control systems are always expected.
To address this issue, the coordinated automatic voltage control (AVC) has been developed. It is organized as a hierarchical structure with three levels: the tertiary, secondary, and primary voltage control, in which tertiary is the highest level and primary is the lowest level. Each higher control level commands the voltage set point for the lower level. In recent years, many research studies have focused on the secondary level for the achievement of the stability and security operation in smart grids [6,7,8,9,10,11,12,13,14,15,16,17,18,19,20,21,22,23,24,25,26,27]. The secondary voltage control (SVC) method was first established in France [6], and has been applied in several countries, such as some European countries [6,7,8,9,10], Brazil [11], South Africa [12], US [13,14], and China [15].
On the other hand, the particle swarm optimization (PSO) technique, which is the family of the evolutionary computation algorithms, has attracted a lot of attention in many research areas [28,29,30]. Indeed, PSO is a heuristic optimization technique, inspired by the social behavior of bird flocks and fish schools. With flexibility and well-balanced mechanism, PSO has the abilities to enhance the global and local search [31]. Due to the simplicity of the concept and implementation, PSO has been effectively applied to various optimization problems in smart grids [32]. For example, PSO based methods were used to solve the problem regarding the optimization in the distribution networks [33,34].
This research is mainly devoted to the protection of any disturbances that may result in power grid voltage collapse. The main contribution is the development of a new voltage stability enhancement methodology for safe power grid operations. To this end, a PSO-based optimal voltage control methodology, which enables achieving reliable and efficient voltage profile/stability regulation in power grids, is proposed. The remainder of this paper is organized as follows: Section 2 gives a brief review of the related work. The basic concept of voltage stability is introduced in Section 3. In Section 4, the problem formulation of power gird Q-V control is stated. Section 5 proposes an optimal voltage control algorithm using particle swarm optimization. Test results are presented in Section 6. The paper finishes with some concluding remarks in Section 7.
2. Related Work
Voltage control has been recognized as an important issue in power grid operation during the past few years. Secondary voltage control (SVC), the structure of which is shown in Figure 1, is able to reduce the possibility of voltage instability. Indeed, a lot of approaches for the design of secondary voltage controllers have been reported in the literature [6,7,8,9,10,11,12,13,14,15,16,17,18,19,20,21,22,23,24,25,26,27], some of which have been proven to be effective methods to guarantee the stability and security operation in some electric power industries [6,7,8,9,10,11,12,13,14,15]. The basic operation principle of the SVC is summarized in the following: when voltage violations occur at certain key load buses which are designated as pilot nodes, the SVC will be enabled to keep the scheduled voltage profiles by optimal coordinated control of reactive power sources. Furthermore, the potential benefit that can be gained from the secondary voltage control is the improvement of system security and power quality.
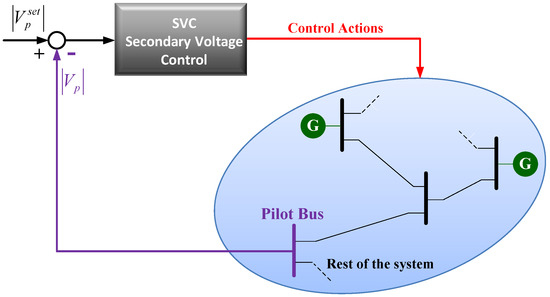
Figure 1.
Secondary voltage control (SVC) in a power grid.
In recent years, some worst-case design based methods [24,25,26,27], which ensure that the largest load voltage deviation remains within the specified limit after control, have been proposed to design SVC. In general, the reactive power resources should be adjusted based on their capabilities in order to gain more reactive power margin. However, without taking reactive power generation limits into account, the control outputs provided by the methods [24,25] have high risk to exceed the VAR capacities of the generating units. Recently, a method [26] considering generator reactive power limits for practical applications was proposed to design SVC. An extension of the method in [26] was proposed in [27]. Indeed, the work [27] is a two-stage method with two optimization problems in the control algorithm. In the first stage, system load disturbances are estimated by applying the least-norm technique. With the estimated system load disturbances, a set of optimal control actions can be determined by applying the worst-case design technique in the second stage. For a bulk power network, however, it is difficult and is a time-consuming task for approximating system load disturbances due to the requirement of matrix inversion in the computation. In other words, a two-stage method may require a large amount of computation time to determine optimal control actions. To address these difficulties, a more flexible method to voltage control using the PSO technique for the achievement of the stability and security operation in power grids is developed in this paper. The performance comparison between the proposed PSO-based method and some worst-case design based methods is illustrated and discussed in Section 6.2.2.
3. Basic Concepts of Voltage Stability
3.1. Voltage Stability Margin (VSM)
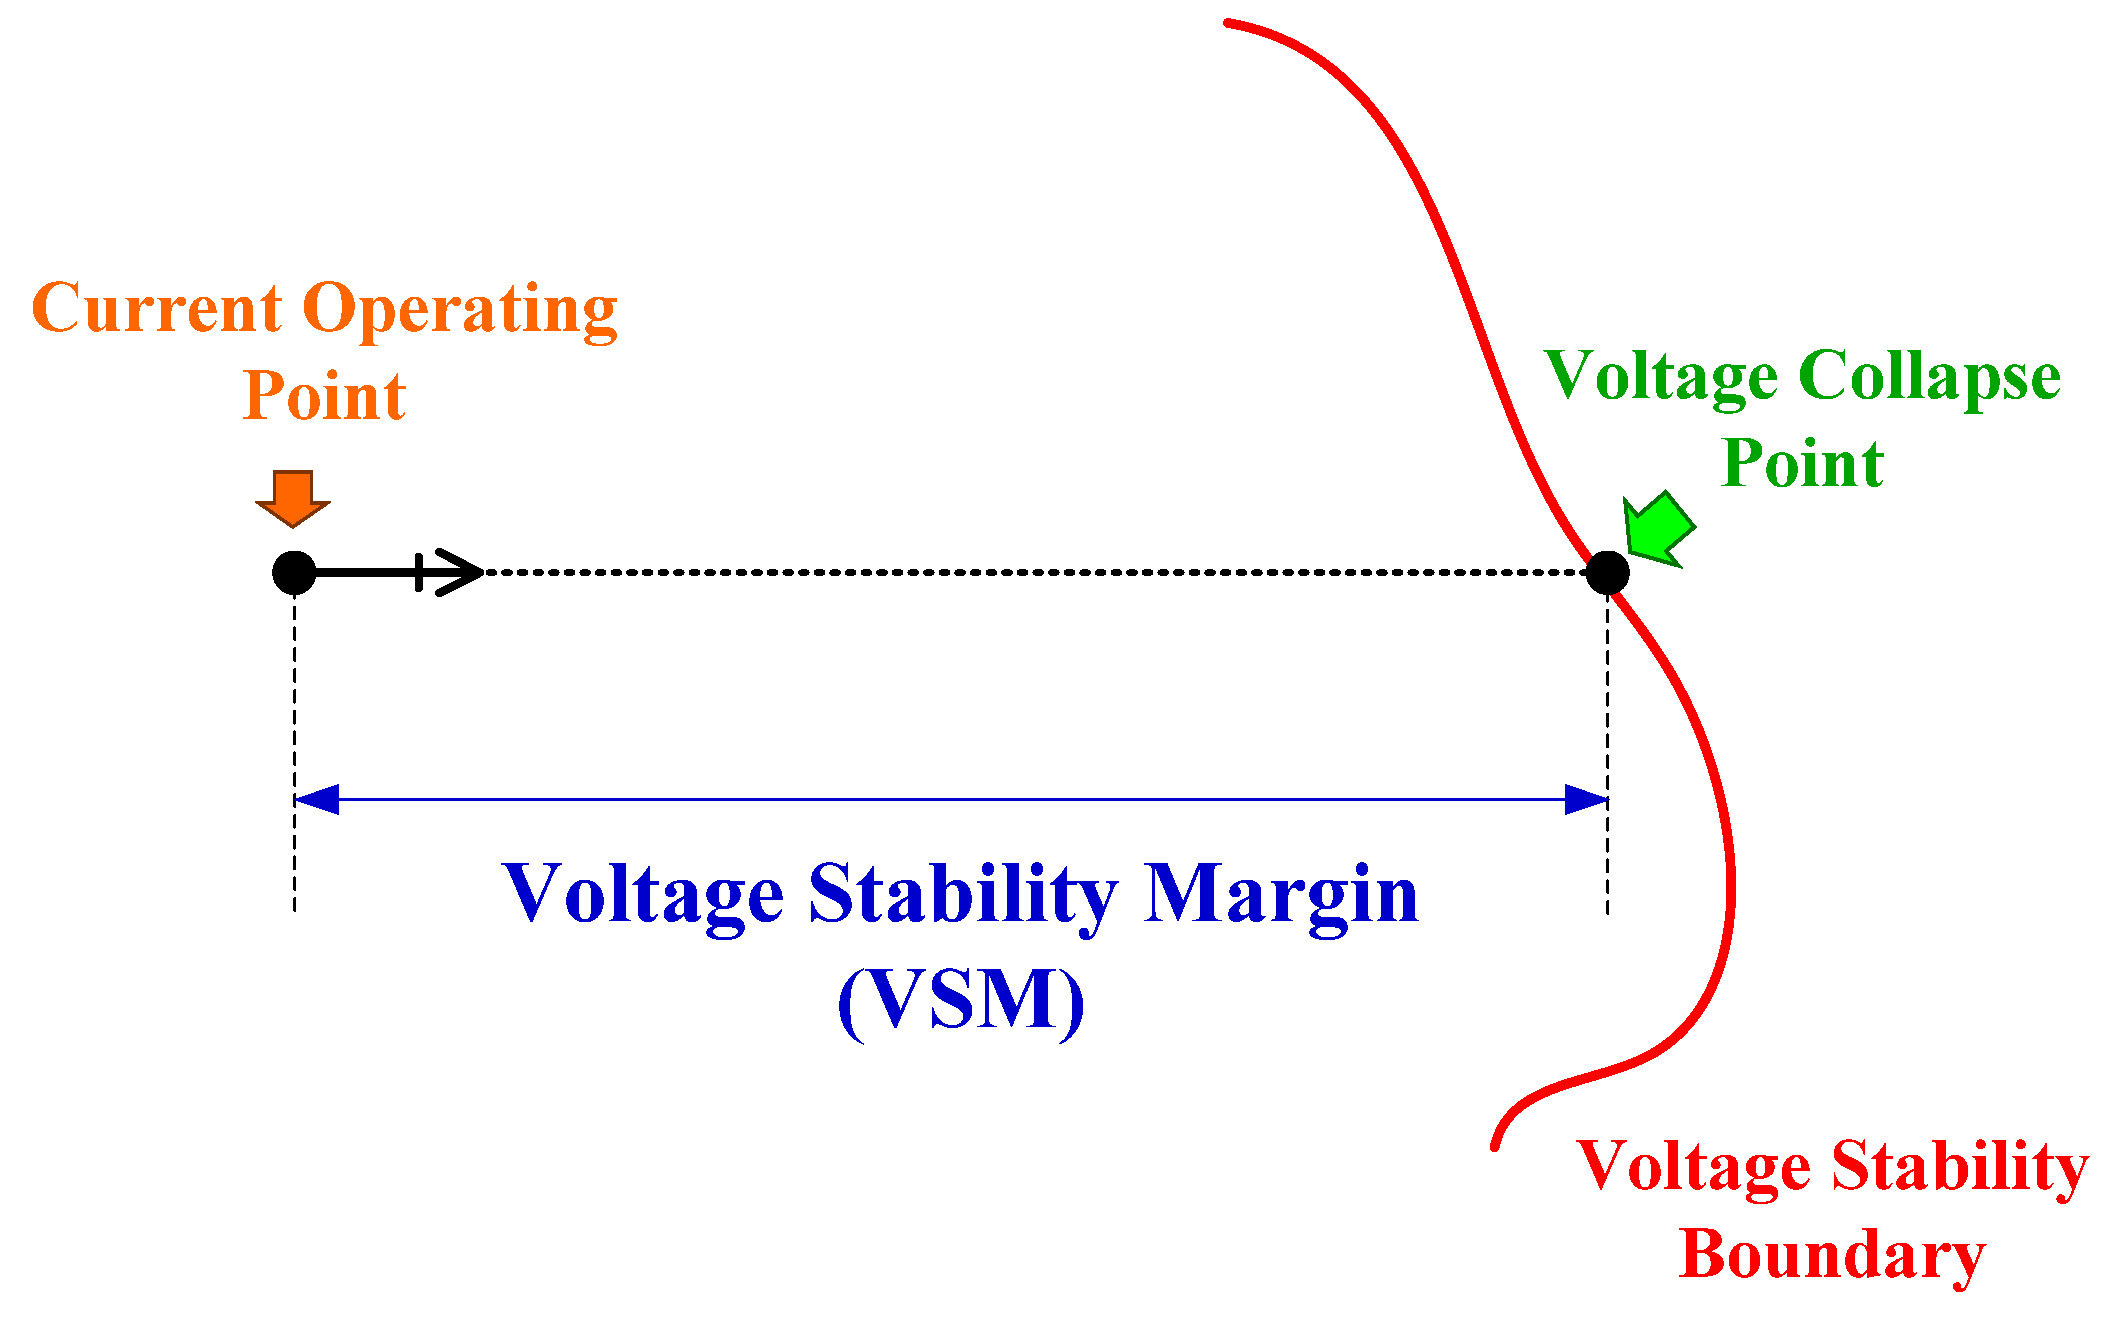
Voltage instability problems usually occur when the system is heavily loaded, especially under cases with insufficient transmission or generation enhancements. In view of this, the concept of VSM, as shown in Figure 2, has been proposed.

Figure 2.
Illustration of Voltage Stability Margin (VSM).
Indeed, voltage stability is related to saddle-node bifurcation that coincides with the maximum loading point [2]. When the generation-transmission system is unable to supply the continuous increase of load demand, voltage instability and even voltage collapse situations are more likely to take place. Accordingly, the load power margin is extended to the VSM. In fact, a number of methods proposed (e.g., [4,5]) utilize this kind of measure as a monitoring index of voltage stability.
3.2. P-V Curve Analysis
To determine load power margin Pmargin under a certain load level, the electric utility industry depends largely on the P-V curve analysis at selected load buses, as shown in Figure 3. When the Pmax is determined, the Pmargin can be expressed as
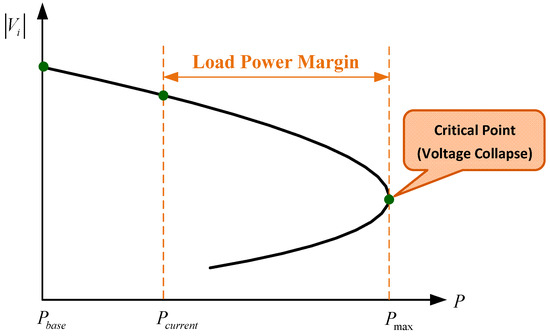
Figure 3.
Typical P-V curve.
Generally, the P-V curve is generated by means of a series of power-flow solutions at different load levels. However, successive computation by the use of the traditional power-flow approach may encounter a divergence problem near the voltage stability boundary. Thus, the continuation power flow (CPFLOW) based methods were used to cope with the numerical difficulties caused by the singularity of the power-flow Jacobian matrix at and around the critical point [4]. Using CPFLOW, the VSM, which is defined by the percentage of the Pmargin, can be computed as
4. Problem Statement
4.1. Power Grid Q-V Control
The steady-state model of power grid Q-V control can be considered as
where B is the system susceptance matrix, and ΔQ and ΔV are the vector of reactive power variation and vector of voltage magnitude variation, respectively. Expending Equation (3) gives
where the subscripts L denotes the load buses and G denotes the generator buses. Next, let and , then substitute for q and u in Equation (4) yields
In the above equation, and q can be expressed as
Substituting for in Equation (7) yields
Equation (8) can be rearranged as
where
Note that and are the matrices with respect to system configurations. In this case, in Equation (9) represents uncontrolled in response to q, while represents the impacts of control outputs u on .
4.2. Linear Feedback Control Design
In this study, a linear feedback control, which utilizes monitored voltages as control inputs and produces control actions as control outputs, is employed to develop a secondary voltage controller. Furthermore, it must be stressed that only pilot-bus voltage data are available to control devices. If there are sufficient measurement units at all load buses, voltage changes will be the control inputs. In practical applications, however, only partial load buses are pilot buses. That is, the monitored voltage deviations can be expressed as
where is the rows of relating to the selected pilot buses. Indeed, are only some entries of the vector . In this case, linear control vector u is given by
where K denotes the control gain matrix that needs to be determined. Replacing the second term of Equation (9) with the control outputs u in Equation (12) results in
4.3. Objective Function
In this research, the worst-case design is employed to determine the optimal control gain matrix in Equation (13). Thus, the problem is to minimize . Suppose that q is within a certain limit in a practical power system; i.e.,
Thus, the objective function is expressed as
Due to the fact that
The minimization problem in Equation (15) is also equivalent to
From the preceding equation, one can see that the optimal robust gain matrix depends entirely on system configurations on pilot-point locations. In other words, remains the same regardless of any unexpected load disturbance. Once is obtained, the optimal control action u can be computed by . Note that it must be within the bounds of control variables.
5. Solution Method
5.1. Particle Swarm Optimization (PSO)
PSO, which was first introduced in [29,30], is a population-based stochastic optimization tool. It was originally developed via the simulation of the simplified social models. PSO has been found to be simple, robust, and computationally efficient in solving optimization problems.
Suppose that there are n particles, denoted by , in a population. Each represents a potential solution to the problem. Let x and v be the position and velocity of the particle coordinates in an m-dimensional search space, in which m denotes the number of optimized parameters. Thus, the ith particle and its velocity can be expressed as and , which are two real-valued vectors. In a PSO algorithm, particles move via the feasible solution space. For the search process, each particle in the swarm updates its position according to the inertia weight , the personal best pbest, and the global best gbest. At time step t, the velocity and position of the ith particle corresponding to the dth dimension are modified by
Notice that and in Equation (18) denote learning coefficients, and and denote random values from uniform distribution in the range of [0, 1]. To ensure the convergence of the PSO algorithm, a constriction factor proposed in [35] is added in Equation (18) yielding
with
where and . In general, both and are set to 2.05, resulting in and . More details on the comparison of inertia weight and constriction factors in particle swarm optimization can be found in [36].
5.2. Proposed Algorithm
In this study, the PSO technique is applied to solve the optimization problem in Equation (17). The aim is to determine the feasible control actions to the participating control devices in power grids. The search procedures for the proposed PSO-based control algorithm is described below:
- Step 1:
- Input branch parameters and bus data.
- Step 2:
- Input pilot-bus measured voltages.
- Step 3:
- If the measured voltages are not within the specified limits, the proposed PSO-based control algorithm will be activated automatically.
- Step 4:
- Form the matrices , , and .
- Step 5:
- PSO Initialization.
- (1)
- Set iteration counter and maximum iteration .
- (2)
- Set population size.
- (3)
- Set learning coefficients and , and in Equation (21).
- (4)
- Initialize and according to the constraints of the control variables.
- (5)
- Initialize pbest and gbest.
- Step 6:
- Update iteration counter .
- Step 7:
- For each , evaluate the objective function in Equation (17), i.e., measure the fitness value for each particle (pbest) and store the particle with the best fitness (gbest) value.
- Step 8:
- Update using Equation (20).
- Step 9:
- Update using Equation (19).
- Step 10:
- If t reaches , then go to Step 11. Otherwise, go back to Step 6.
- Step 11:
- Print out the latest gbest which is the optimal control strategy.
6. Numerical Examples and Results
The proposed PSO-based voltage control algorithm is applied to two sample test systems: IEEE 9-bus and IEEE 118-bus. The grid data involving branch parameters and bus information are given in [37]. In this research, the PSO settings are selected as below:
- (1)
- population size = 100;
- (2)
- maximum iteration = 200;
- (3)
- learning coefficients: and ;
- (4)
- in Equation (21) is set to 0.729.
Suppose that there are n load buses in the test system, the performance of the control strategy is measured through the root-mean-square (RMS) defined as
where and for each are the load bus voltage before and after control, respectively. Note that smaller gives better performance. In order to illustrate the system loadability enhancement after the proposed control strategy, the open-source software PSAT [38] is used to generate the P-V curves for calculating the VSM.
6.1. IEEE 9-Bus
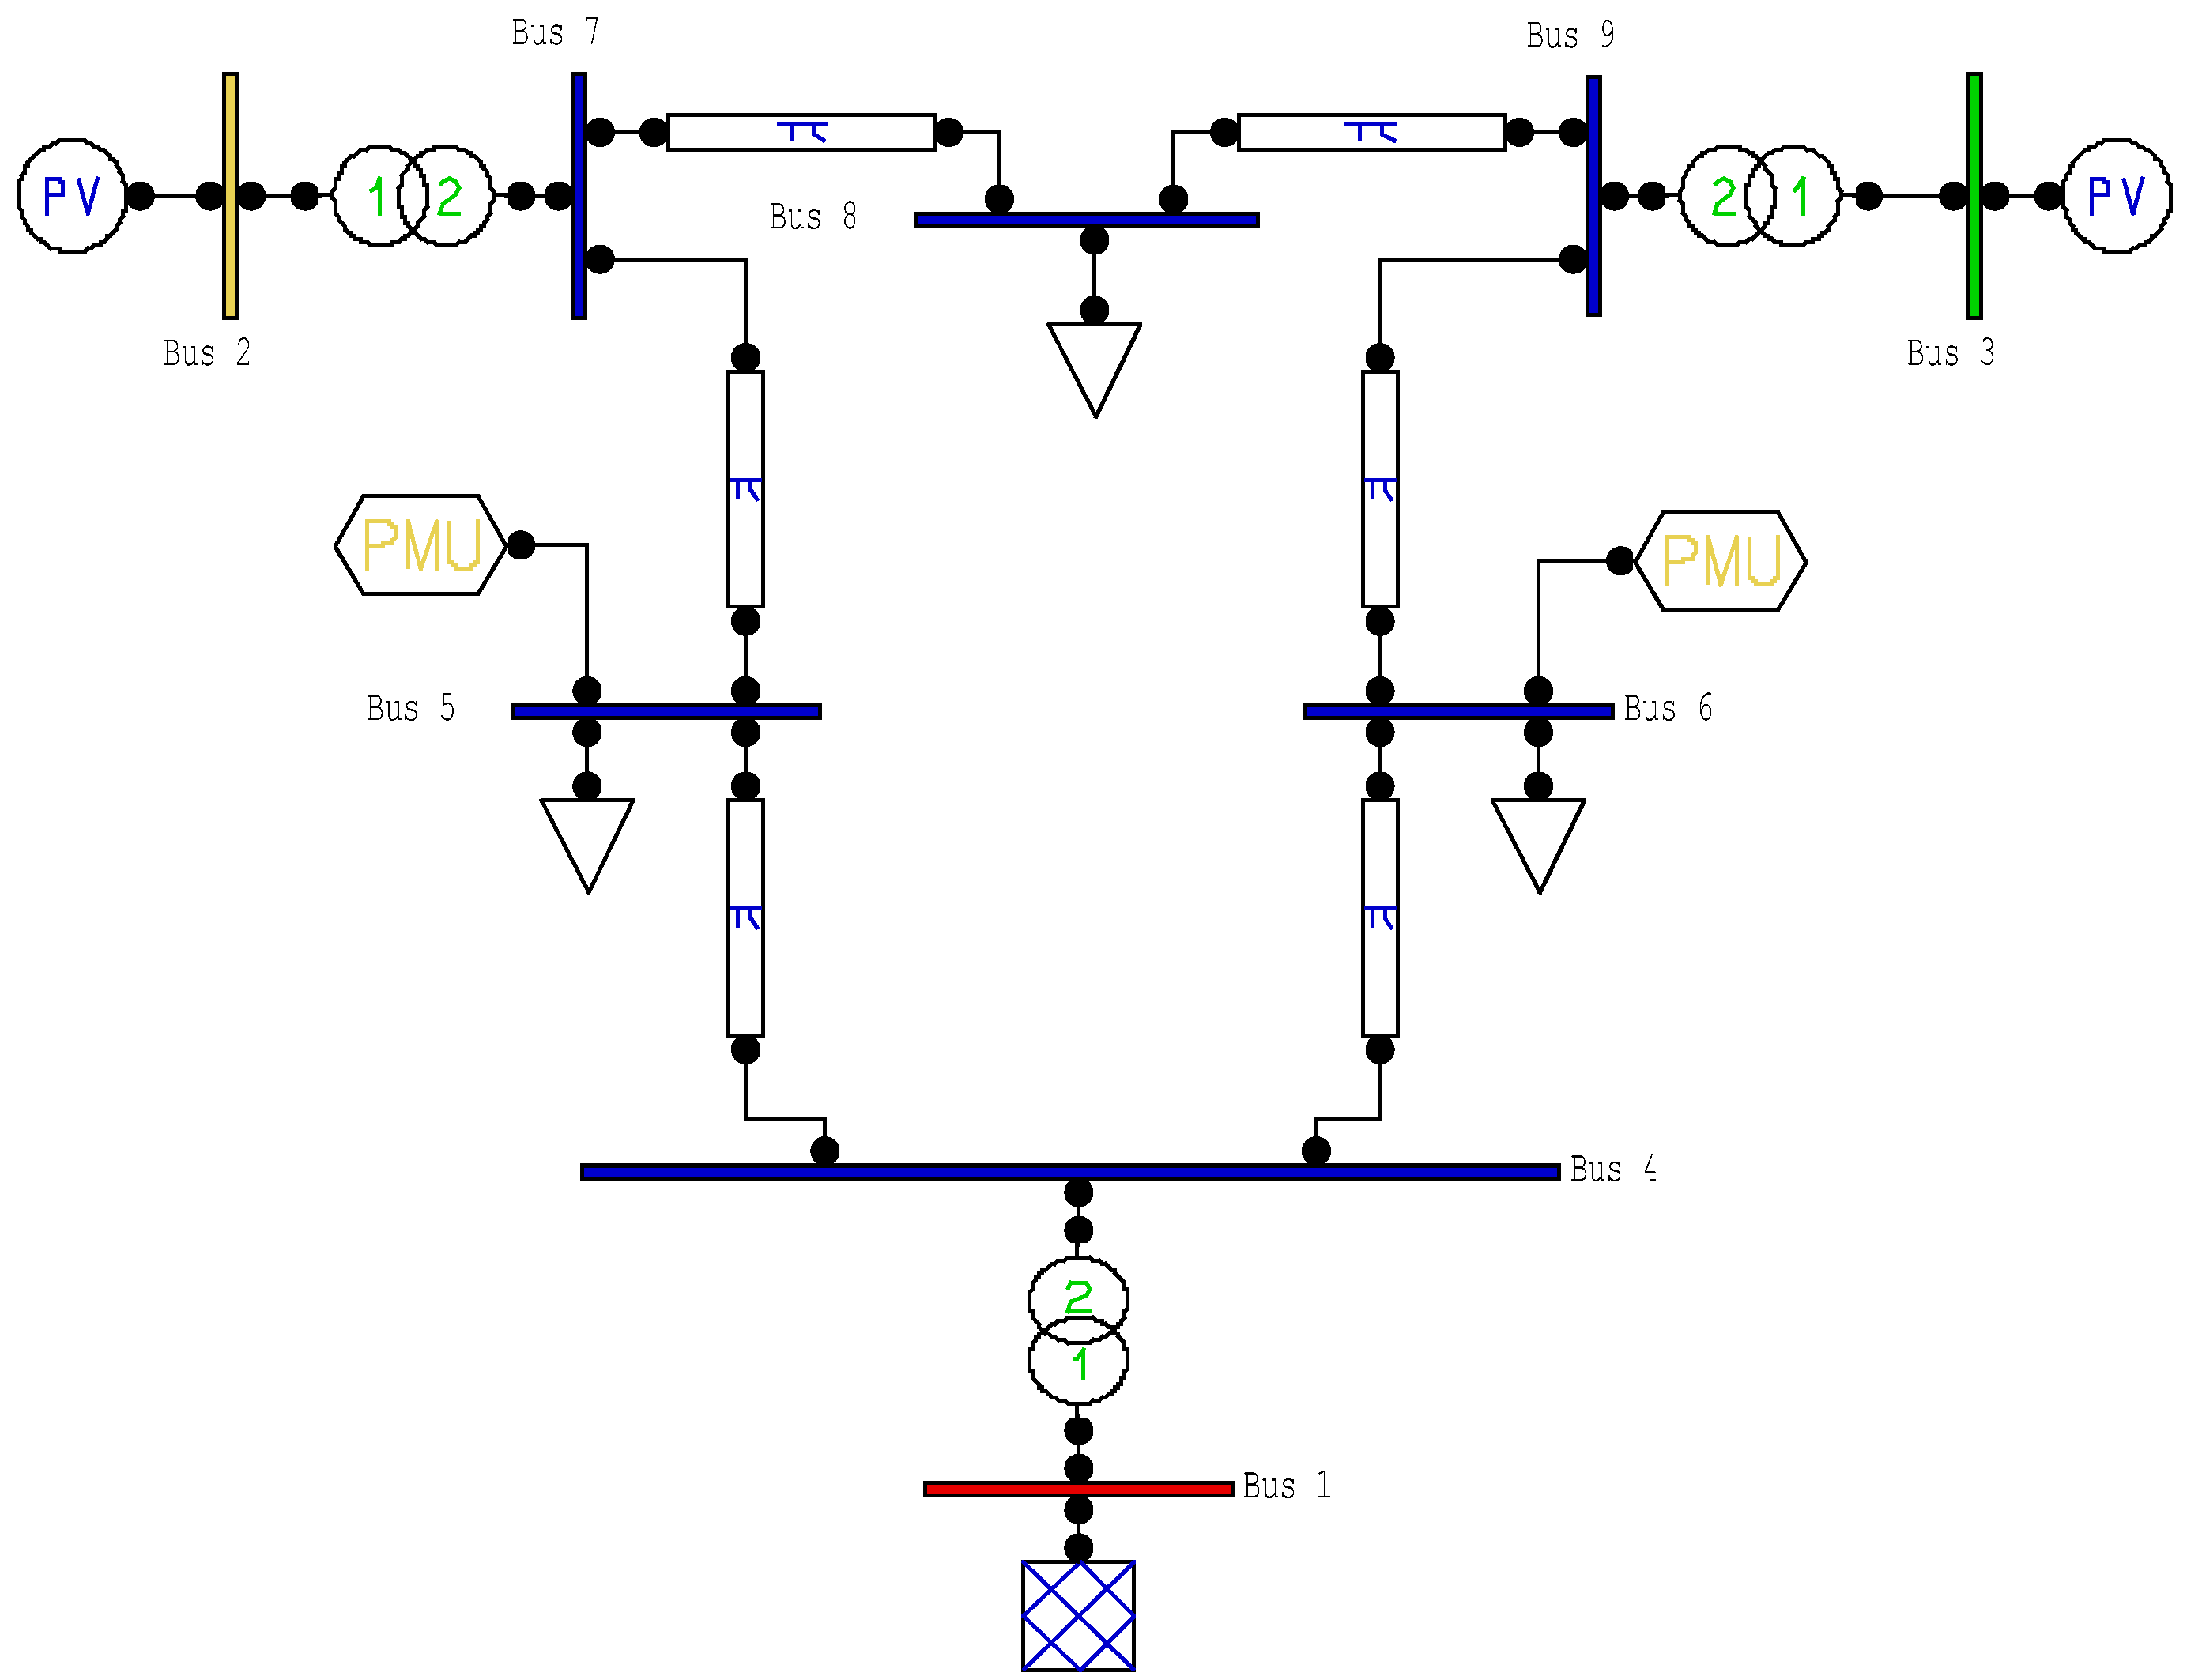
The first test system is concerned with IEEE 9-bus system that consists of three generators, three loads, and nine branches, as shown in Figure 4. Furthermore, it is simply assumed that the phasor measurement units (PMUs) are installed at bus 5 and bus 6 (i.e., bus 5 and bus 6 are chosen as pilot buses). In other words, only the voltage magnitudes at bus 5 and bus 6 are used as control inputs.
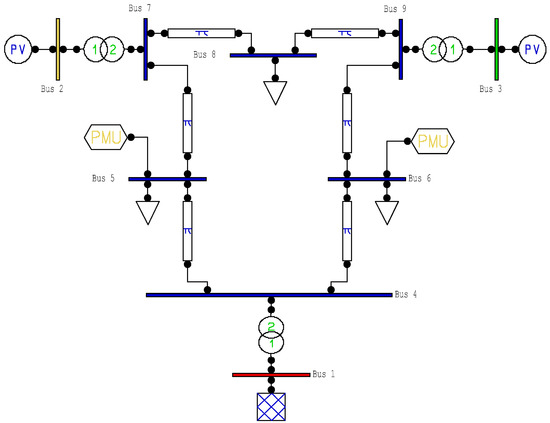
Figure 4.
One-line diagram of IEEE 9-bus system with phasor measurement units (PMUs). PV: PV generaotr bus (voltage-controlled bus).
To confirm the effectiveness of the proposed control algorithm, comprehensive simulations including different load bus variations, different load levels, and different branch outage contingencies have been studied. Among those experiments, only the results listed below are discussed.
- Case 1: All load bus variations and light load conditions.
- Case 2: Single load bus variation and peak load condition.
- Case 3: Several load bus variations, peak load conditions, and line outage contingencies.
Case 1
In the first test case, all load bus variations are simulated. The test system is operated at a light load condition, where the voltage magnitudes obtained from the PMUs are V5 = 0.8866 p.u. and V6 = 0.9902 p.u.
In this case, low voltage violation occurs at bus 5 since V5 = 0.8866 p.u. is less than the predetermined value of 0.9 p.u. This will activate the proposed method, and the effect of the control strategy is shown in Figure 5. From the shown figure, one can see that the voltage magnitude of bus 5 is improved from 0.8866 to 0.9974 p.u. Also, the maximum load power is increased from 3.94 to 4.47 p.u.
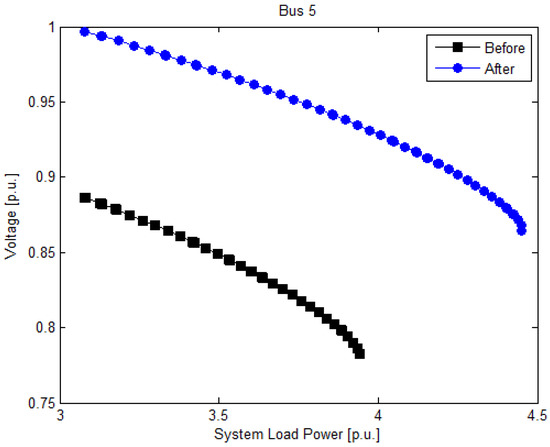
Figure 5.
Simulation result of Case 1 for IEEE 9-bus.
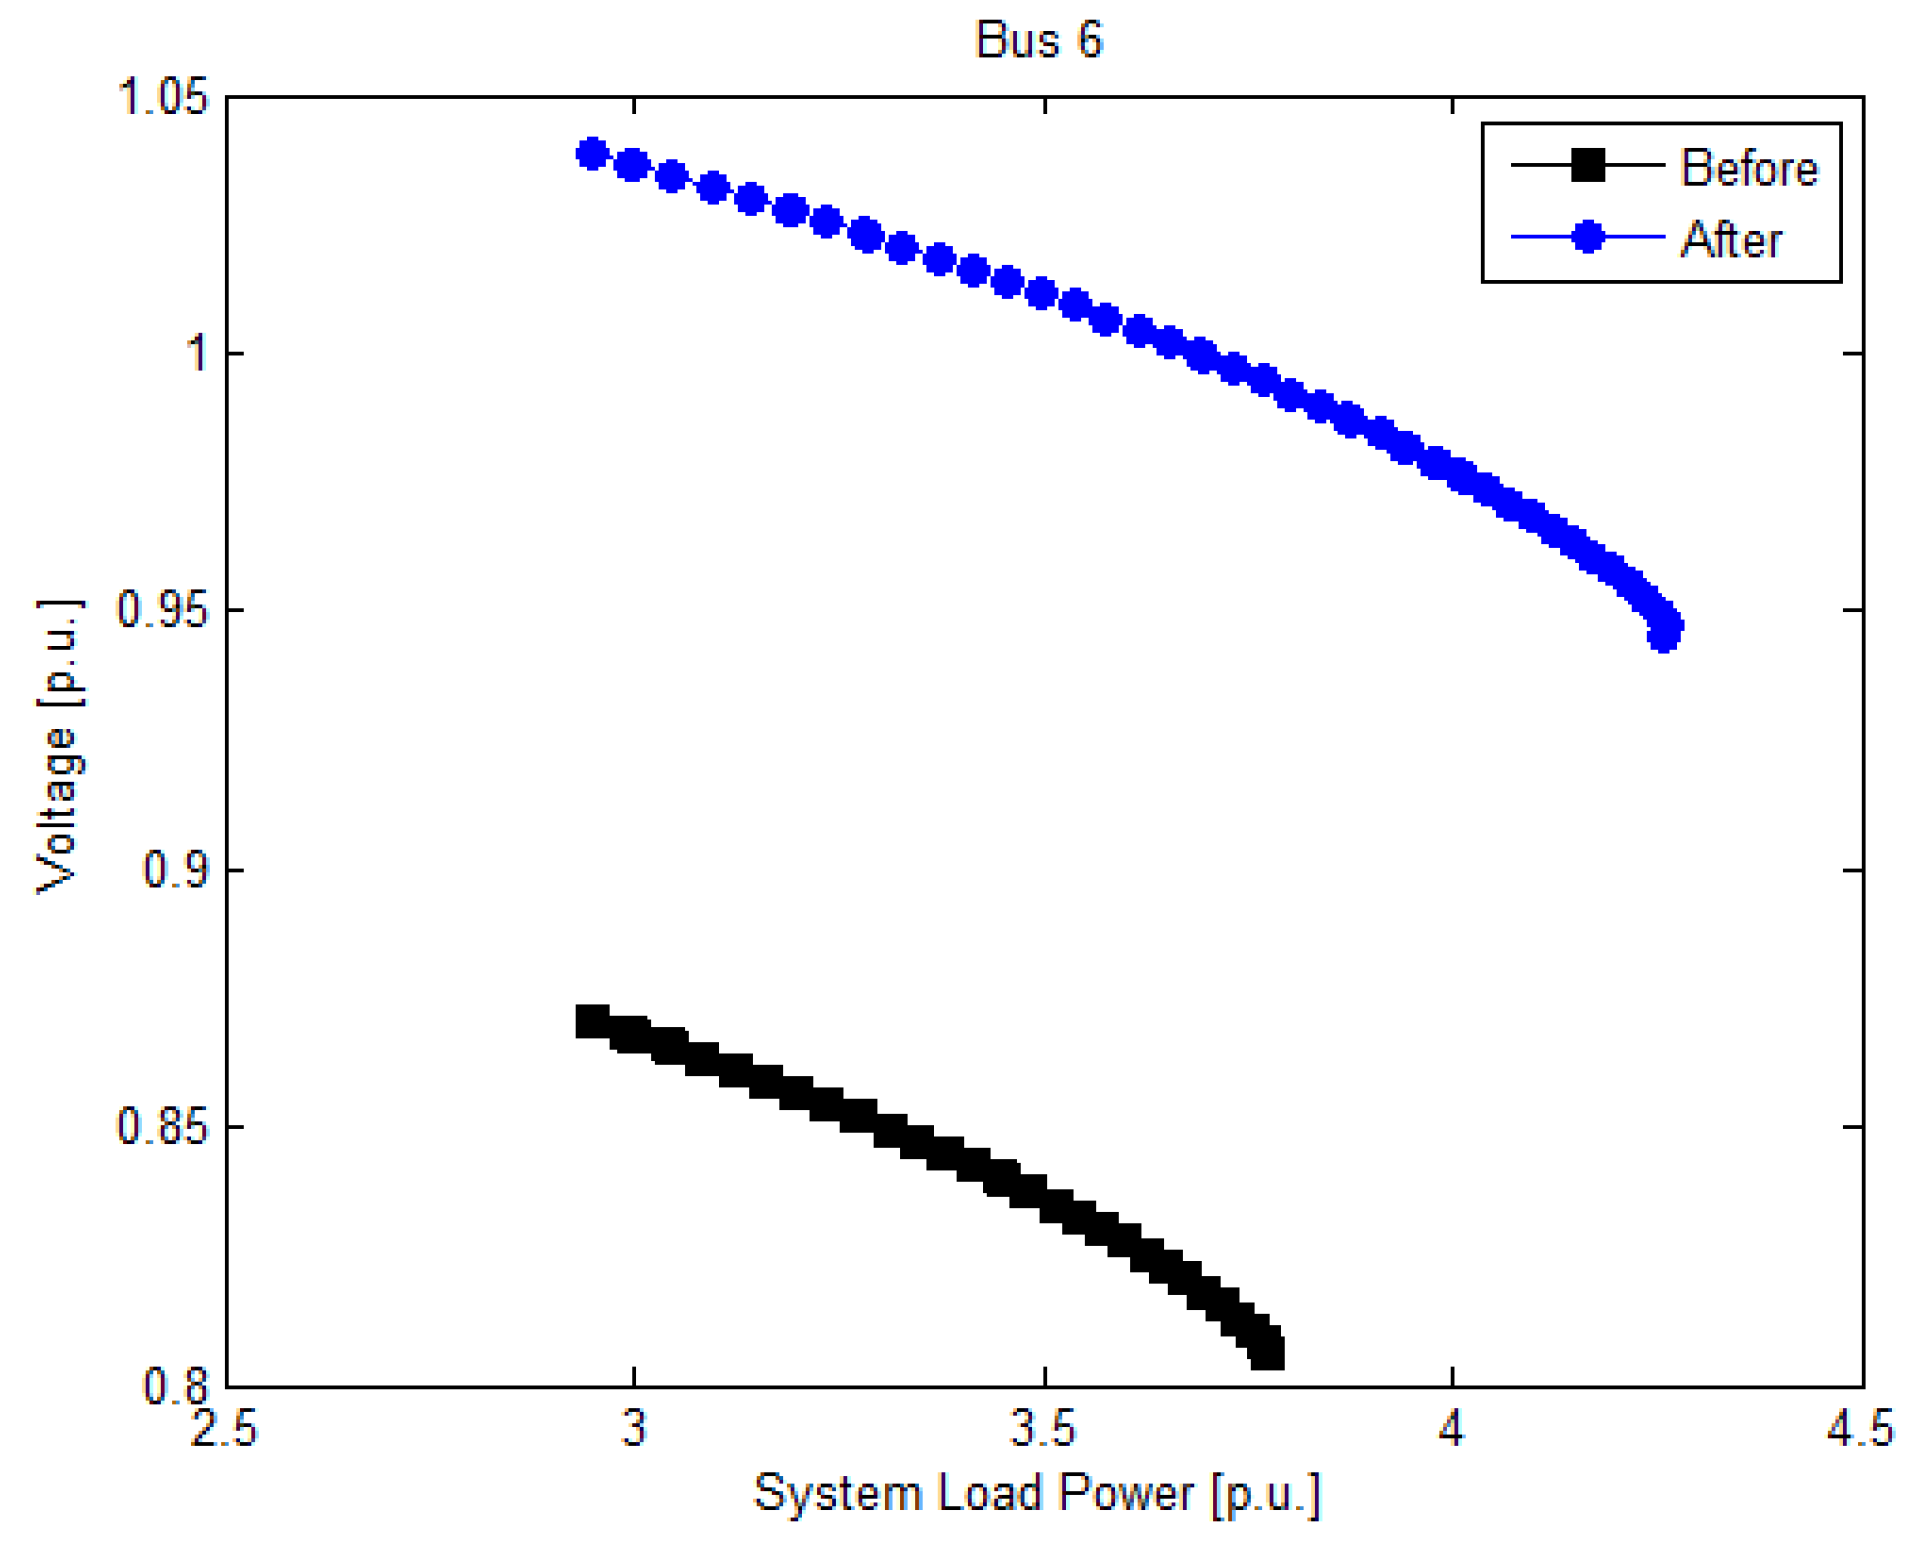
Case 2
Single load bus variation is considered in this case. During the simulation, we raise load disturbance at bus 6. The test system is investigated under peak load conditions and is operated in the dangerous region. The measured voltages without control actions are V5 = 0.9801 p.u. and V6 = 0.8707 p.u.
Figure 6 illustrates the simulation result, indicating that the maximum load power is greatly enhanced from 3.77 to 4.29 p.u., and V6 improved from 0.8707 to 1.0404 p.u.

Figure 6.
Simulation result of Case 2 for IEEE 9-bus.
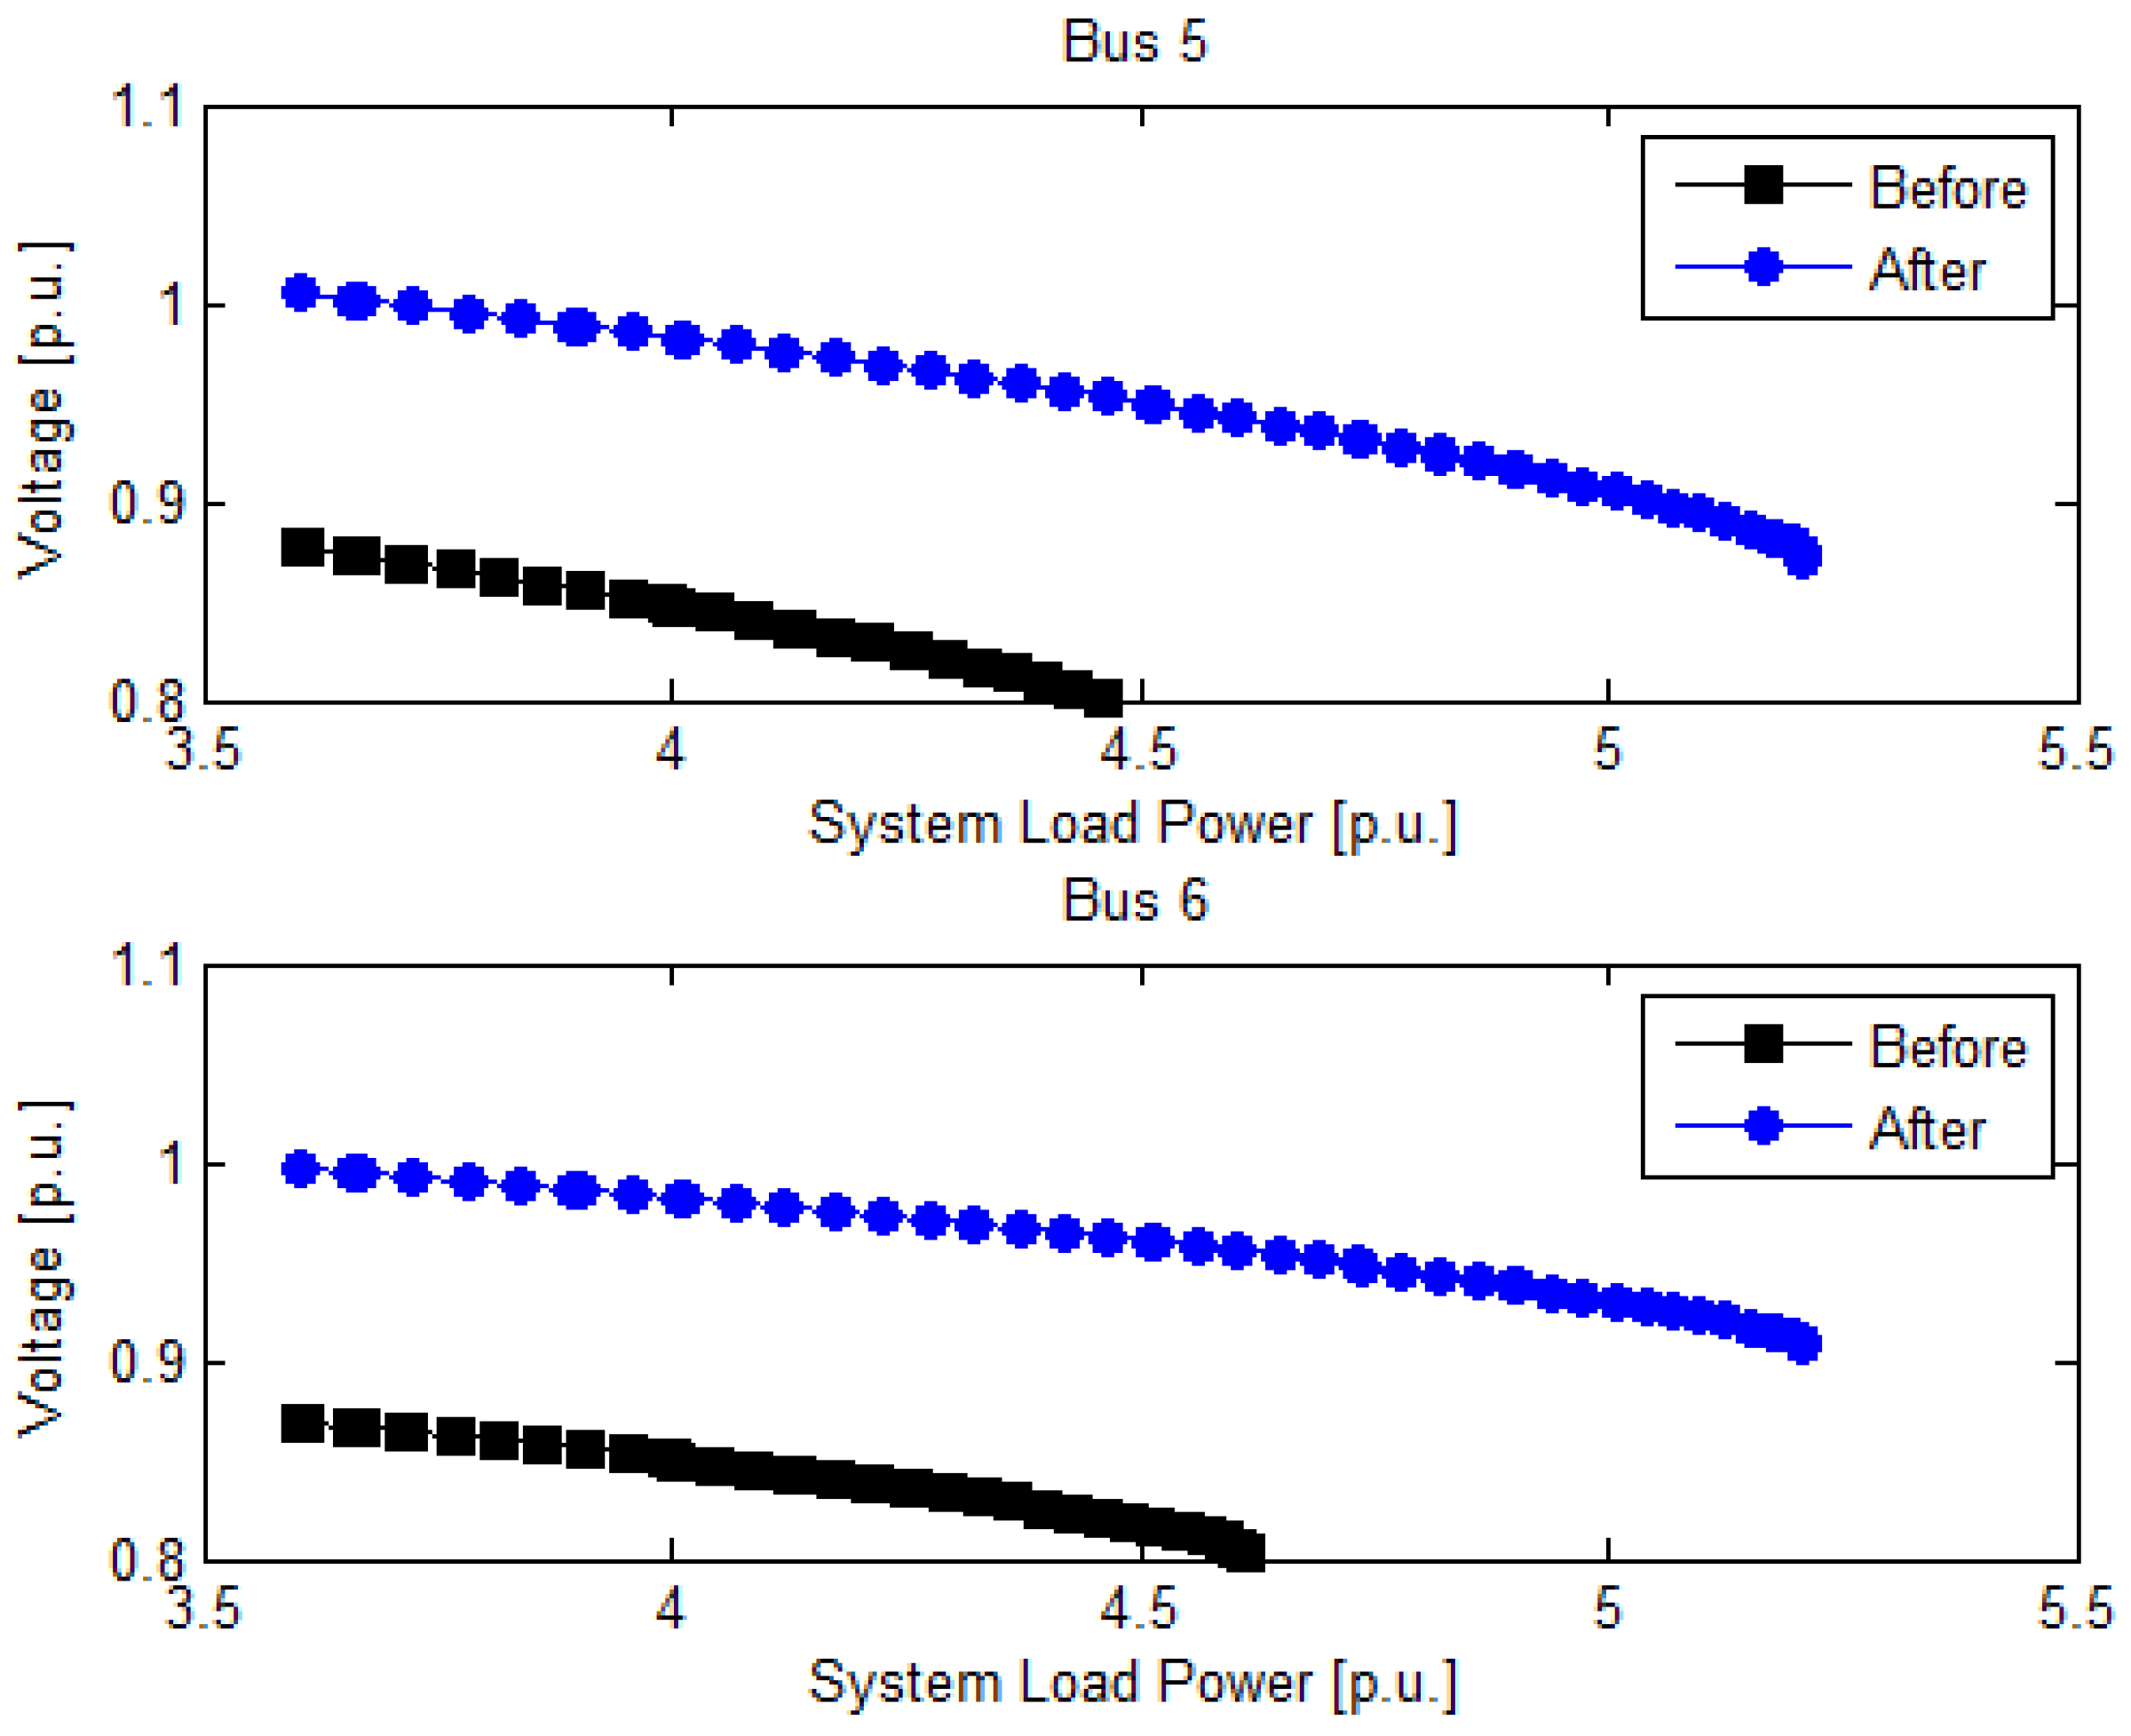
Case 3
In the third simulation, several load bus variations are simulated. The test system is investigated under stressed conditions, and the line #7-8 is studied under branch outage contingency condition. The system is operating in the dangerous region, which could result in V5 = 0.8773 p.u. and V6 = 0.8687 p.u. before control actions performed. Since the system has poor voltage level, the proposed methodology will be activated to prevent imminent voltage collapse. Figure 7 shows the simulation result. In Figure 7, it is clearly seen that system voltage stability is considerably improved after the proposed methodology.
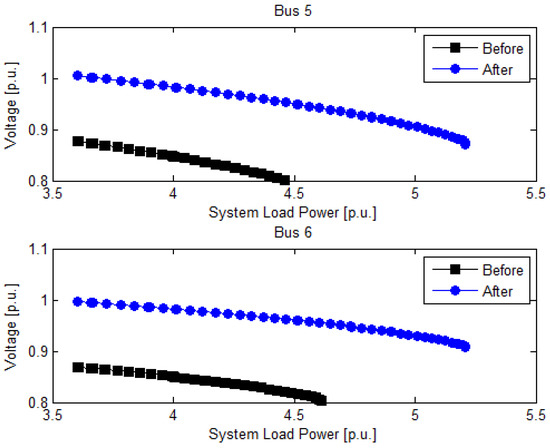
Figure 7.
Simulation result of Case 3 for IEEE 9-bus.
The results in terms of and VSM for the above three cases are summarized in Table 1, showing that the performance of the power grid is significantly enhanced. This means that the control decisions provided by the proposed scheme are efficient and effective for the improvement of overall power grid voltage stability.

Table 1.
Summary of the results for IEEE 9-bus. VSM, Voltage Stability Margin.
6.2. IEEE 118-Bus
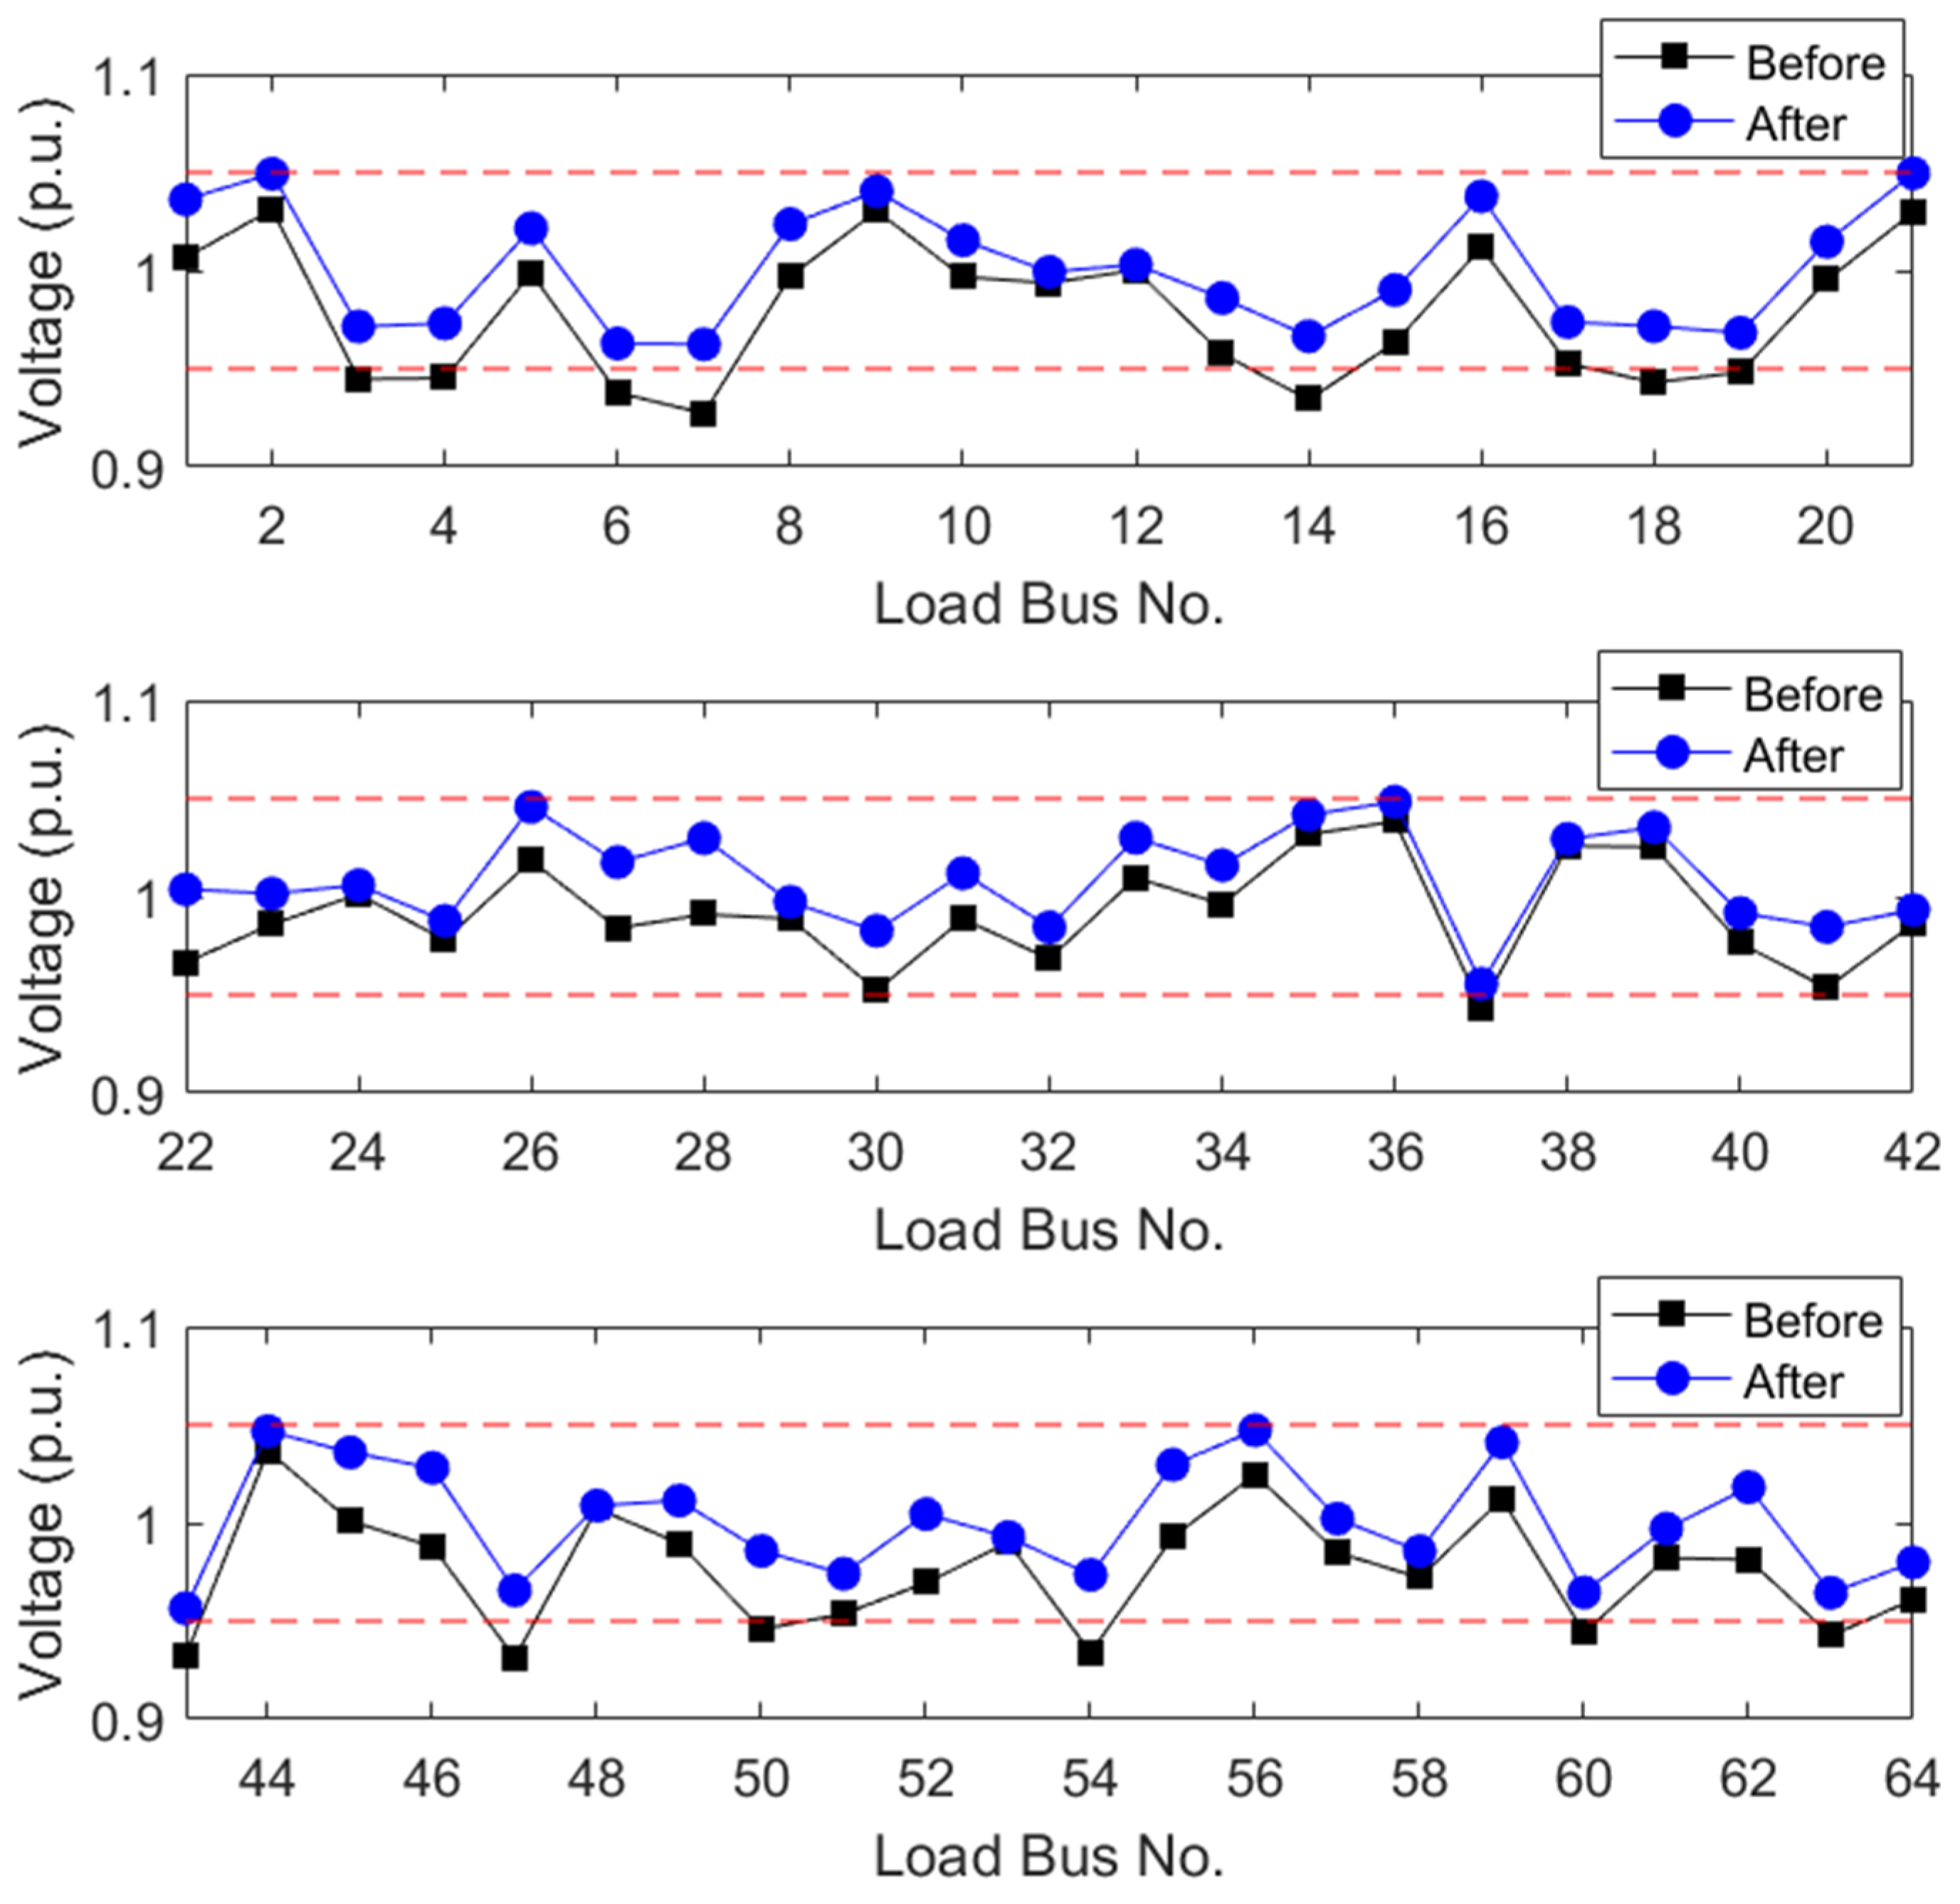
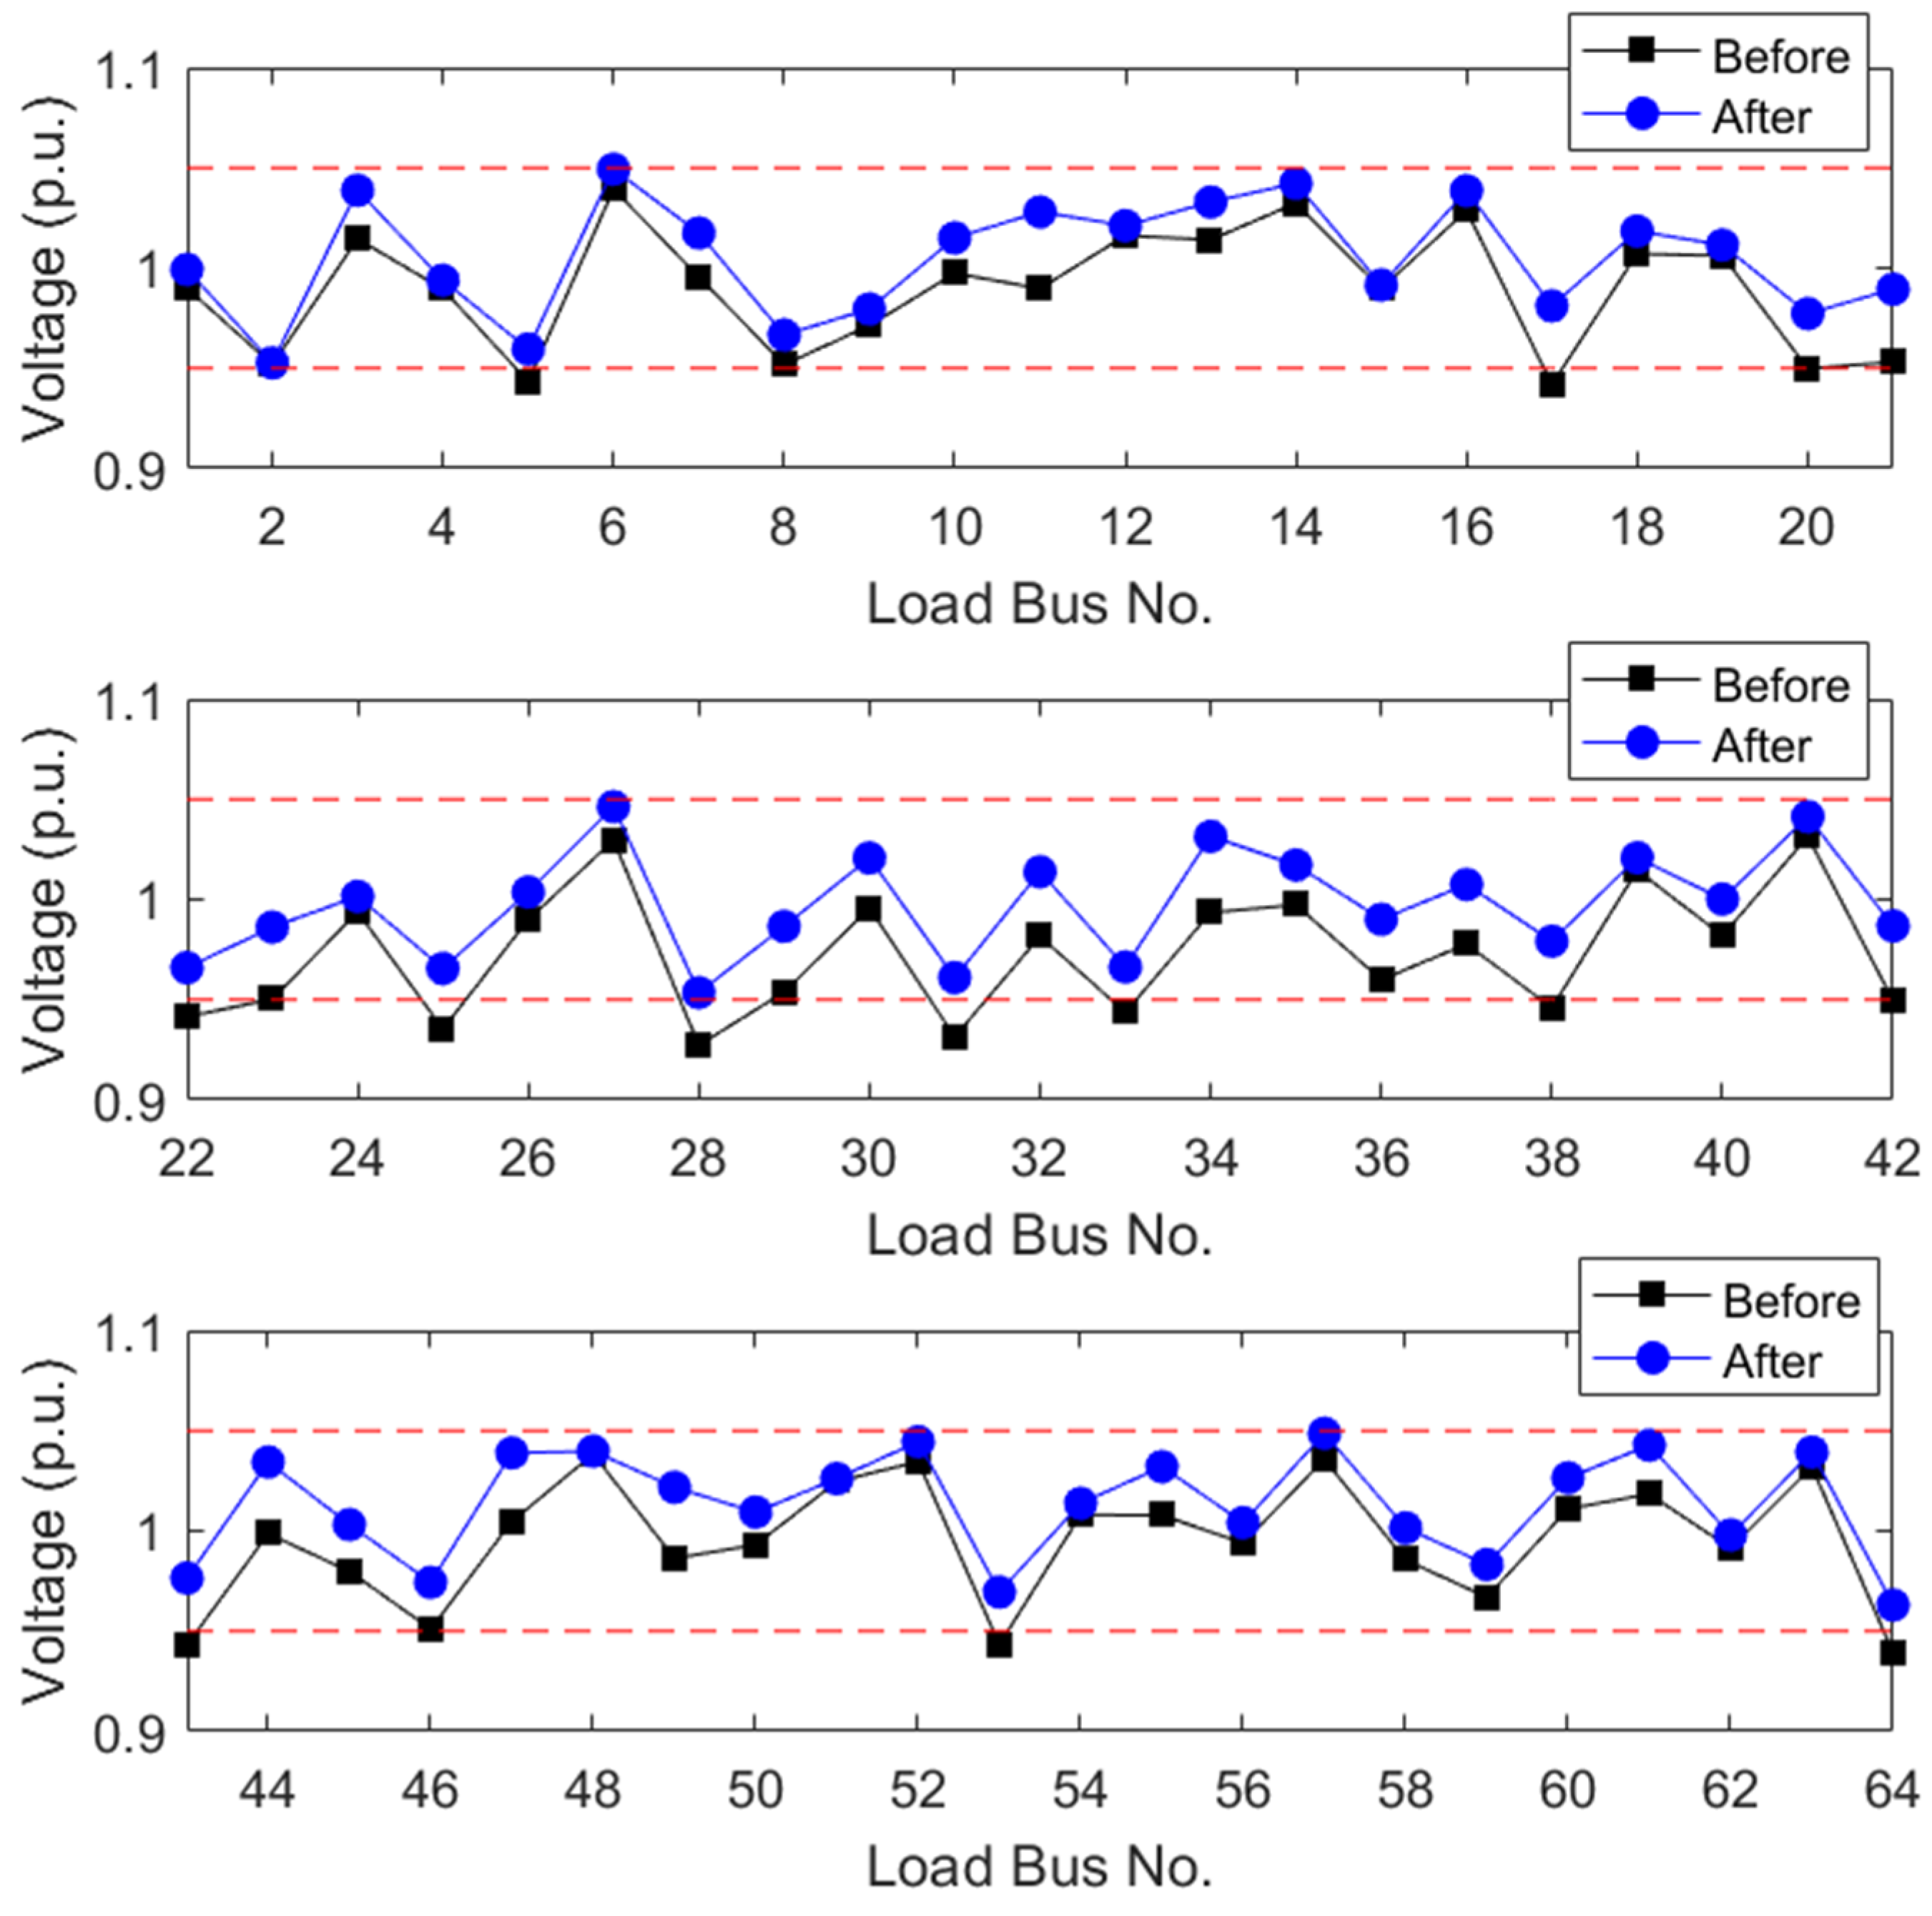
To demonstrate the applicability of the proposed algorithm to large-scale power grids, the IEEE 118-bus is utilized as an example. This test model is composed of 54 generators, 64 loads, and 186 transmission lines [37].
A series of simulations including different load bus variations, different load levels, and different branch outage contingencies has been conducted. Among those investigated tests, some selected cases listed are presented below.
- Case 1: Several load bus variations and peak load conditions.
- Case 2: All load bus variations, peak load conditions, and line outage contingencies.
The simulation results are shown in Figure 8 and Figure 9. From the shown figures, one can see that the load bus voltage magnitudes after the proposed control strategy are all at the acceptable level.
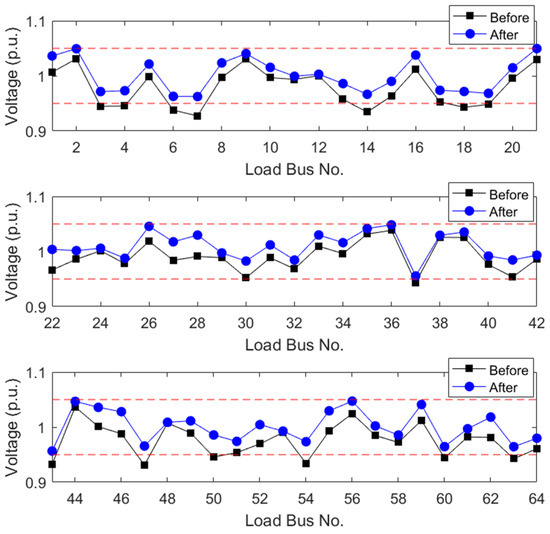
Figure 8.
Load bus voltage profile of Case 1 for IEEE 118-bus.
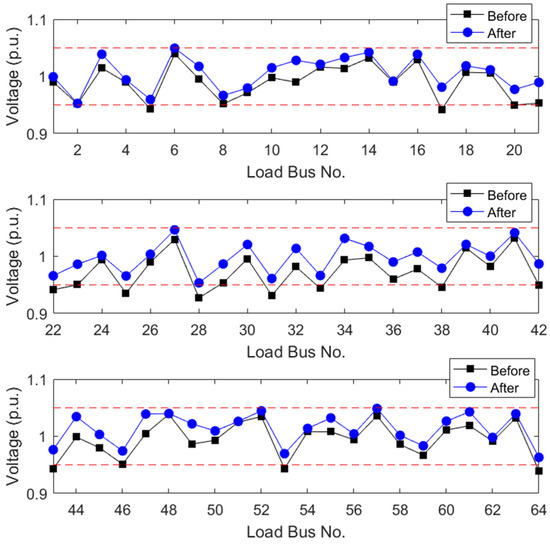
Figure 9.
Load bus voltage profile of Case 2 for IEEE 118-bus.
6.2.1. Effects of Different Pilot-Bus Selections
To illustrate the effect of different pilot-bus selections on control performance, a series of simulations has been performed. Some selected cases are listed in Table 2. The simulation results are depicted in Figure 10, showing that and VSM are considerably enhanced after the proposed control algorithm.
Table 2.
Selected scenarios for IEEE 118-bus.
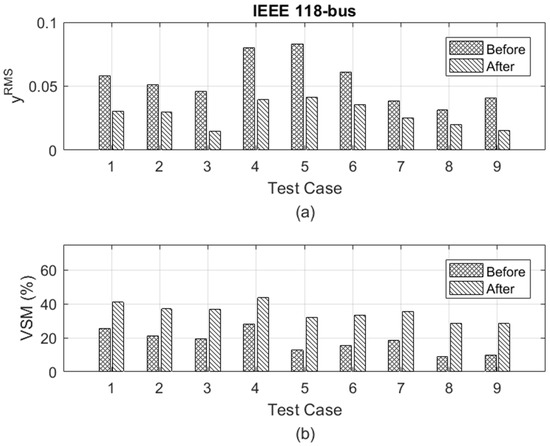
Figure 10.
Results of IEEE 118-bus. (a) Results in terms of ; (b) Results in terms of VSM.
6.2.2. Comparison with Worst-Case Design Based Methods
A performance comparison study of the proposed method with some worst-case design based methods [25,27] for IEEE 118-bus system is carried out. Let be the number of load buses in the test system, be the number of pilot buses used in the control algorithm, and be the number of simulation runs. The measure for performance evaluation under different can be expressed as
The performance evaluation between the compared methods under the selected cases for the IEEE 118-bus system is demonstrated in Table 3. In addition, the average computation time for each is provided. In Table 3, it can be observed that the results in terms of given by the proposed method are much smaller than the results provided by the method [25], and are very close to the results provided by the method [27]. However, the results in terms of obtained by the proposed method are the smallest ones. In other words, the proposed method is able to significantly reduce the computation time in comparison with both method [25] and method [27]. In summary, the proposed method is superior over both method [25] and method [27].
Table 3.
Result comparison for IEEE 118-bus.
7. Conclusions
In this paper, a new voltage control methodology using the PSO technique for the achievement of the stability and security operation in smart grids was developed. The developed methodology is based on the normal form of voltage-var control model. Considering the worst-case design of overall load voltage deviations in electrical power systems, this methodology determines an optimal set of robust control actions by utilizing a PSO-based l-infinity norm minimization algorithm to eliminate voltage violations in smart transmission grids. With the proposed methodology, the overall network voltage levels can be improved and voltage stability margin can be enlarged as well by an appropriate reactive power management against voltage instability. The proposed methodology was applied in some standard IEEE test systems. The results of the proposed methodology are promising.
Acknowledgments
This work was supported by the Ministry of Science and Technology of Taiwan, R.O.C., under Contract MOST 104-2221-E-035-041, Contract MOST 105-2221-E-035-057, and Contract MOST 105-2119-M-035-002.
Author Contributions
Heng-Yi Su proposed the approach and wrote the manuscript with input from Yu-Liang Hsu and Yi-Chung Chen.
Conflicts of Interest
The authors declare no conflicts of interest.
References
- Kundur, P. Power System Stability and Control; McGraw-Hill: New York, NY, USA, 1994. [Google Scholar]
- Van Cutsem, T.; Vournas, C. Voltage Stability of Electric Power Systems; Kluwer: Norwell, MA, USA, 1998. [Google Scholar]
- Ajjarapu, V. Computational Techniques for Voltage Stability Assessment and Control; Springer: New York, NY, USA, 2006. [Google Scholar]
- Kundur, P.; Paserba, J.; Ajjarapu, V.; Andersson, G.; Bose, A.; Canizares, C.; Hatziargyriou, N.; Hill, D.; Stankovic, A.; Taylor, C.; et al. Definition and classification of power system stability IEEE/CIGRE joint task force on stability terms and definitions. IEEE Trans. Power Syst. 2004, 19, 1387–1401. [Google Scholar]
- Chiang, H.D.; Flueck, A.J.; Shah, K.S.; Balu, N. CPFLOW: A practical tool for tracing power system steady-state stationary behavior due to load and generation variations. IEEE Trans. Power Syst. 1995, 10, 623–634. [Google Scholar] [CrossRef]
- Paul, J.P.; Leost, J.T.; Tesseron, J.M. Survey of the secondary voltage control in France: Present realization and investigations. IEEE Trans. Power Syst. 1987, 2, 505–511. [Google Scholar] [CrossRef]
- Corsi, S.; Marannino, P.; Losignore, N.; Moreschini, G.; Piccini, G. Coordination between the reactive power scheduling function and the hierarchical voltage control of the EHV ENEL system. IEEE Trans. Power Syst. 1995, 10, 686–694. [Google Scholar] [CrossRef]
- Vu, H.; Pruvot, P.; Launay, C.; Harmand, Y. An improved voltage control on large scale power system. IEEE Trans. Power Syst. 1996, 11, 1295–1303. [Google Scholar] [CrossRef]
- Sancha, J.L.; Fernandez, J.L.; Cortes, A.; Abarca, J.T. Secondary voltage control: Analysis, solutions, simulation results for the Spanish transmission system. IEEE Trans. Power Syst. 1996, 11, 630–638. [Google Scholar] [CrossRef]
- Corsi, S.; Pozzi, M.; Sabelli, C.; Serrani, A. The coordinated automatic voltage control of the Italian transmission grid—Part I: Reasons of the choice and overview of the consolidated hierarchical system. IEEE Trans. Power Syst. 2004, 19, 1723–1732. [Google Scholar] [CrossRef]
- Taranto, G.N.; Martins, N.; Falcao, D.M.; Martins, A.C.B.; dos Santos, M.G. Benefits of applying secondary voltage control schemes to the Brazilian system. In Proceedings of the IEEE Power Engineering Society Summer Meeting, Seattle, WA, USA, 16–20 July 2000; pp. 937–942.
- Corsi, S.; De Villiers, F.; Vajeth, R. Secondary voltage regulation applied to the South Africa transmission grid. In Proceedings of the 2010 IEEE Power and Energy Society General Meeting, Minneapolis, MN, USA, 25–29 July 2010; pp. 1–8.
- Guo, Q.; Sun, H.; Tong, J.; Zhang, M.; Wang, B.; Zhang, B. Study of system-wide automatic voltage control on PJM system. In Proceedings of the 2010 IEEE Power and Energy Society General Meeting, Minneapolis, MN, USA, 25–29 July 2010; pp. 1–6.
- Tong, J.; Souder, D.W.; Pilong, C.; Zhang, M.; Guo, Q.; Sun, H.; Zhang, B. Voltage control practices and tools used for system voltage control of PJM. In Proceedings of the IEEE Power and Energy Society General Meeting, Detroit, MI, USA, 24–29 July 2011; pp. 1–5.
- Sun, H.; Guo, Q.; Zhang, B.; Wu, W.; Wang, B. An adaptive zone-division-based automatic voltage control system with applications in China. IEEE Trans. Power Syst. 2013, 28, 1816–1828. [Google Scholar] [CrossRef]
- Lagonotte, P.; Sabonnadiere, J.C.; Leost, J.Y.; Paul, J.P. Structural analysis of the electrical system: Application to the secondary voltage control in France. IEEE Trans. Power Syst. 1989, 4, 1477–1484. [Google Scholar] [CrossRef]
- Mehrjerdi, H.; Lefebvre, S.; Saad, M.; Asber, D. A decentralized control of partitioned power networks for voltage regulation and prevention against disturbance propagation. IEEE Trans. Power Syst. 2013, 28, 1461–1469. [Google Scholar] [CrossRef]
- Alimisis, V.; Taylor, P.C. Zoning evaluation for improved coordinated automatic voltage control. IEEE Trans. Power Syst. 2015, 30, 2736–2746. [Google Scholar] [CrossRef]
- Conejo, A.; Aguilar, M.J. Secondary voltage control: Nonlinear selection of pilot buses, design of an optimal control law, and simulation results. IEE Proc. Gen. Trans. Distrib. 1998, 145, 77–81. [Google Scholar] [CrossRef]
- Ilic, M.; Christensen, J.; Eichorn, K.L. Secondary voltage control using pilot point information. IEEE Trans. Power Syst. 1988, 3, 660–668. [Google Scholar] [CrossRef]
- Zobian, A.; Ilic, M.D. A steady state voltage monitoring and control algorithm using localized least square minimization of load voltage deviations. IEEE Trans. Power Syst. 1996, 11, 929–938. [Google Scholar] [CrossRef]
- Yu, C.; Yoon, Y.T.; Ilic, M.D.; Catelli, A. On-line voltage regulation: The case of New England. IEEE Trans. Power Syst. 1999, 14, 1477–1484. [Google Scholar]
- Stankovic, A.; Ilic, M.; Maratukulam, D. Recent results in secondary voltage control of power systems. IEEE Trans. Power Syst. 1991, 6, 94–101. [Google Scholar] [CrossRef]
- Thorp, J.S.; Ilic-Spong, M.; Varghese, M. An optimal secondary voltage-var control technique. Automatica 1986, 22, 217–222. [Google Scholar] [CrossRef]
- Liu, Z.; Ilic, M.D. Toward PMU-based robust automatic voltage control (AVC) and automatic flow control (AFC). In Proceedings of the 2010 IEEE Power and Energy Society General Meeting, Minneapolis, MN, USA, 25–29 July 2010; pp. 1–8.
- Su, H.Y.; Liu, C.W. An adaptive PMU-based secondary voltage control scheme. IEEE Trans. Smart Grid. 2013, 4, 1514–1522. [Google Scholar] [CrossRef]
- Su, H.Y.; Chen, Y.C.; Hsu, Y.L. A synchrophasor based optimal voltage control scheme with successive voltage stability margin improvement. Appl. Sci. 2016, 6, 1–12. [Google Scholar] [CrossRef]
- Kennedy, J.; Eberhart, R. Particle swarm optimization. In Proceedings of the IEEE International Conference Neural Networks (ICNN), Perth, Australia, 27 November–1 December 1995; Volume 4, pp. 1942–1948.
- Eberhart, R.; Kennedy, J. A new optimizer using particle swarm theory. In Proceedings of the 6th International Symposium on Micro Machine and Human Science, Nagoya, Japan, 4–6 October 1995; pp. 39–43.
- Shi, Y.; Eberhart, R. A modified particle swarm optimizer. In Proceedings of the IEEE World Congress on Computational Intelligence, Anchorage, Alaska, 4–9 May 1998; pp. 69–73.
- Panigrahi, B.; Abraham, A.; Das, S. Computational Intelligence in Power Engineering; Springer-Verlag: Berlin, Germany, 2010. [Google Scholar]
- Alrashidi, M.R.; El-Hawary, M.E. A survey of particle swarm optimization applications in electric power systems. IEEE Trans. Evol. Comput. 2009, 13, 913–918. [Google Scholar] [CrossRef]
- Chen, S.H.; Hu, W.H.; Chen, Z. Comprehensive cost minimization in distribution networks using segmented-time feeder reconfiguration and reactive power control of distributed generators. IEEE Trans. Power Syst. 2016, 31, 983–993. [Google Scholar] [CrossRef]
- Wu, W.C.; Tsai, M.S. Application of enhanced integer coded particle swarm optimization for distribution system feeder reconfiguration. IEEE Trans. Power Syst. 2011, 26, 1591–1599. [Google Scholar] [CrossRef]
- Clerc, M.; Kennedy, J. The particle swarm-explosion, stability, and convergence in a multidimensional complex space. IEEE Trans. Evol. Comput. 2002, 6, 58–73. [Google Scholar] [CrossRef]
- Eberhart, R.; Shi, Y. Comparing inertia weights and constriction factors in particle swarm optimization. In Proceedings of the 2000 IEEE Congress on Evolutionary Computation, Piscataway, NJ, USA, 16–19 July 2000; pp. 84–88.
- Power Systems Test Case Archive, University of Washington College of Engineering. Available online: http://www.ee.washington.edu/re-serach/pstcal/ (accessed on 4 March 2016).
- Milano, F. Power System Analysis Toolbox (PSAT); ver. 2.0.0; University College Dublin: Dublin, Ireland, 2008. [Google Scholar]


© 2016 by the authors; licensee MDPI, Basel, Switzerland. This article is an open access article distributed under the terms and conditions of the Creative Commons Attribution (CC-BY) license (http://creativecommons.org/licenses/by/4.0/).