4.1. Seismic Location Error Characteristics
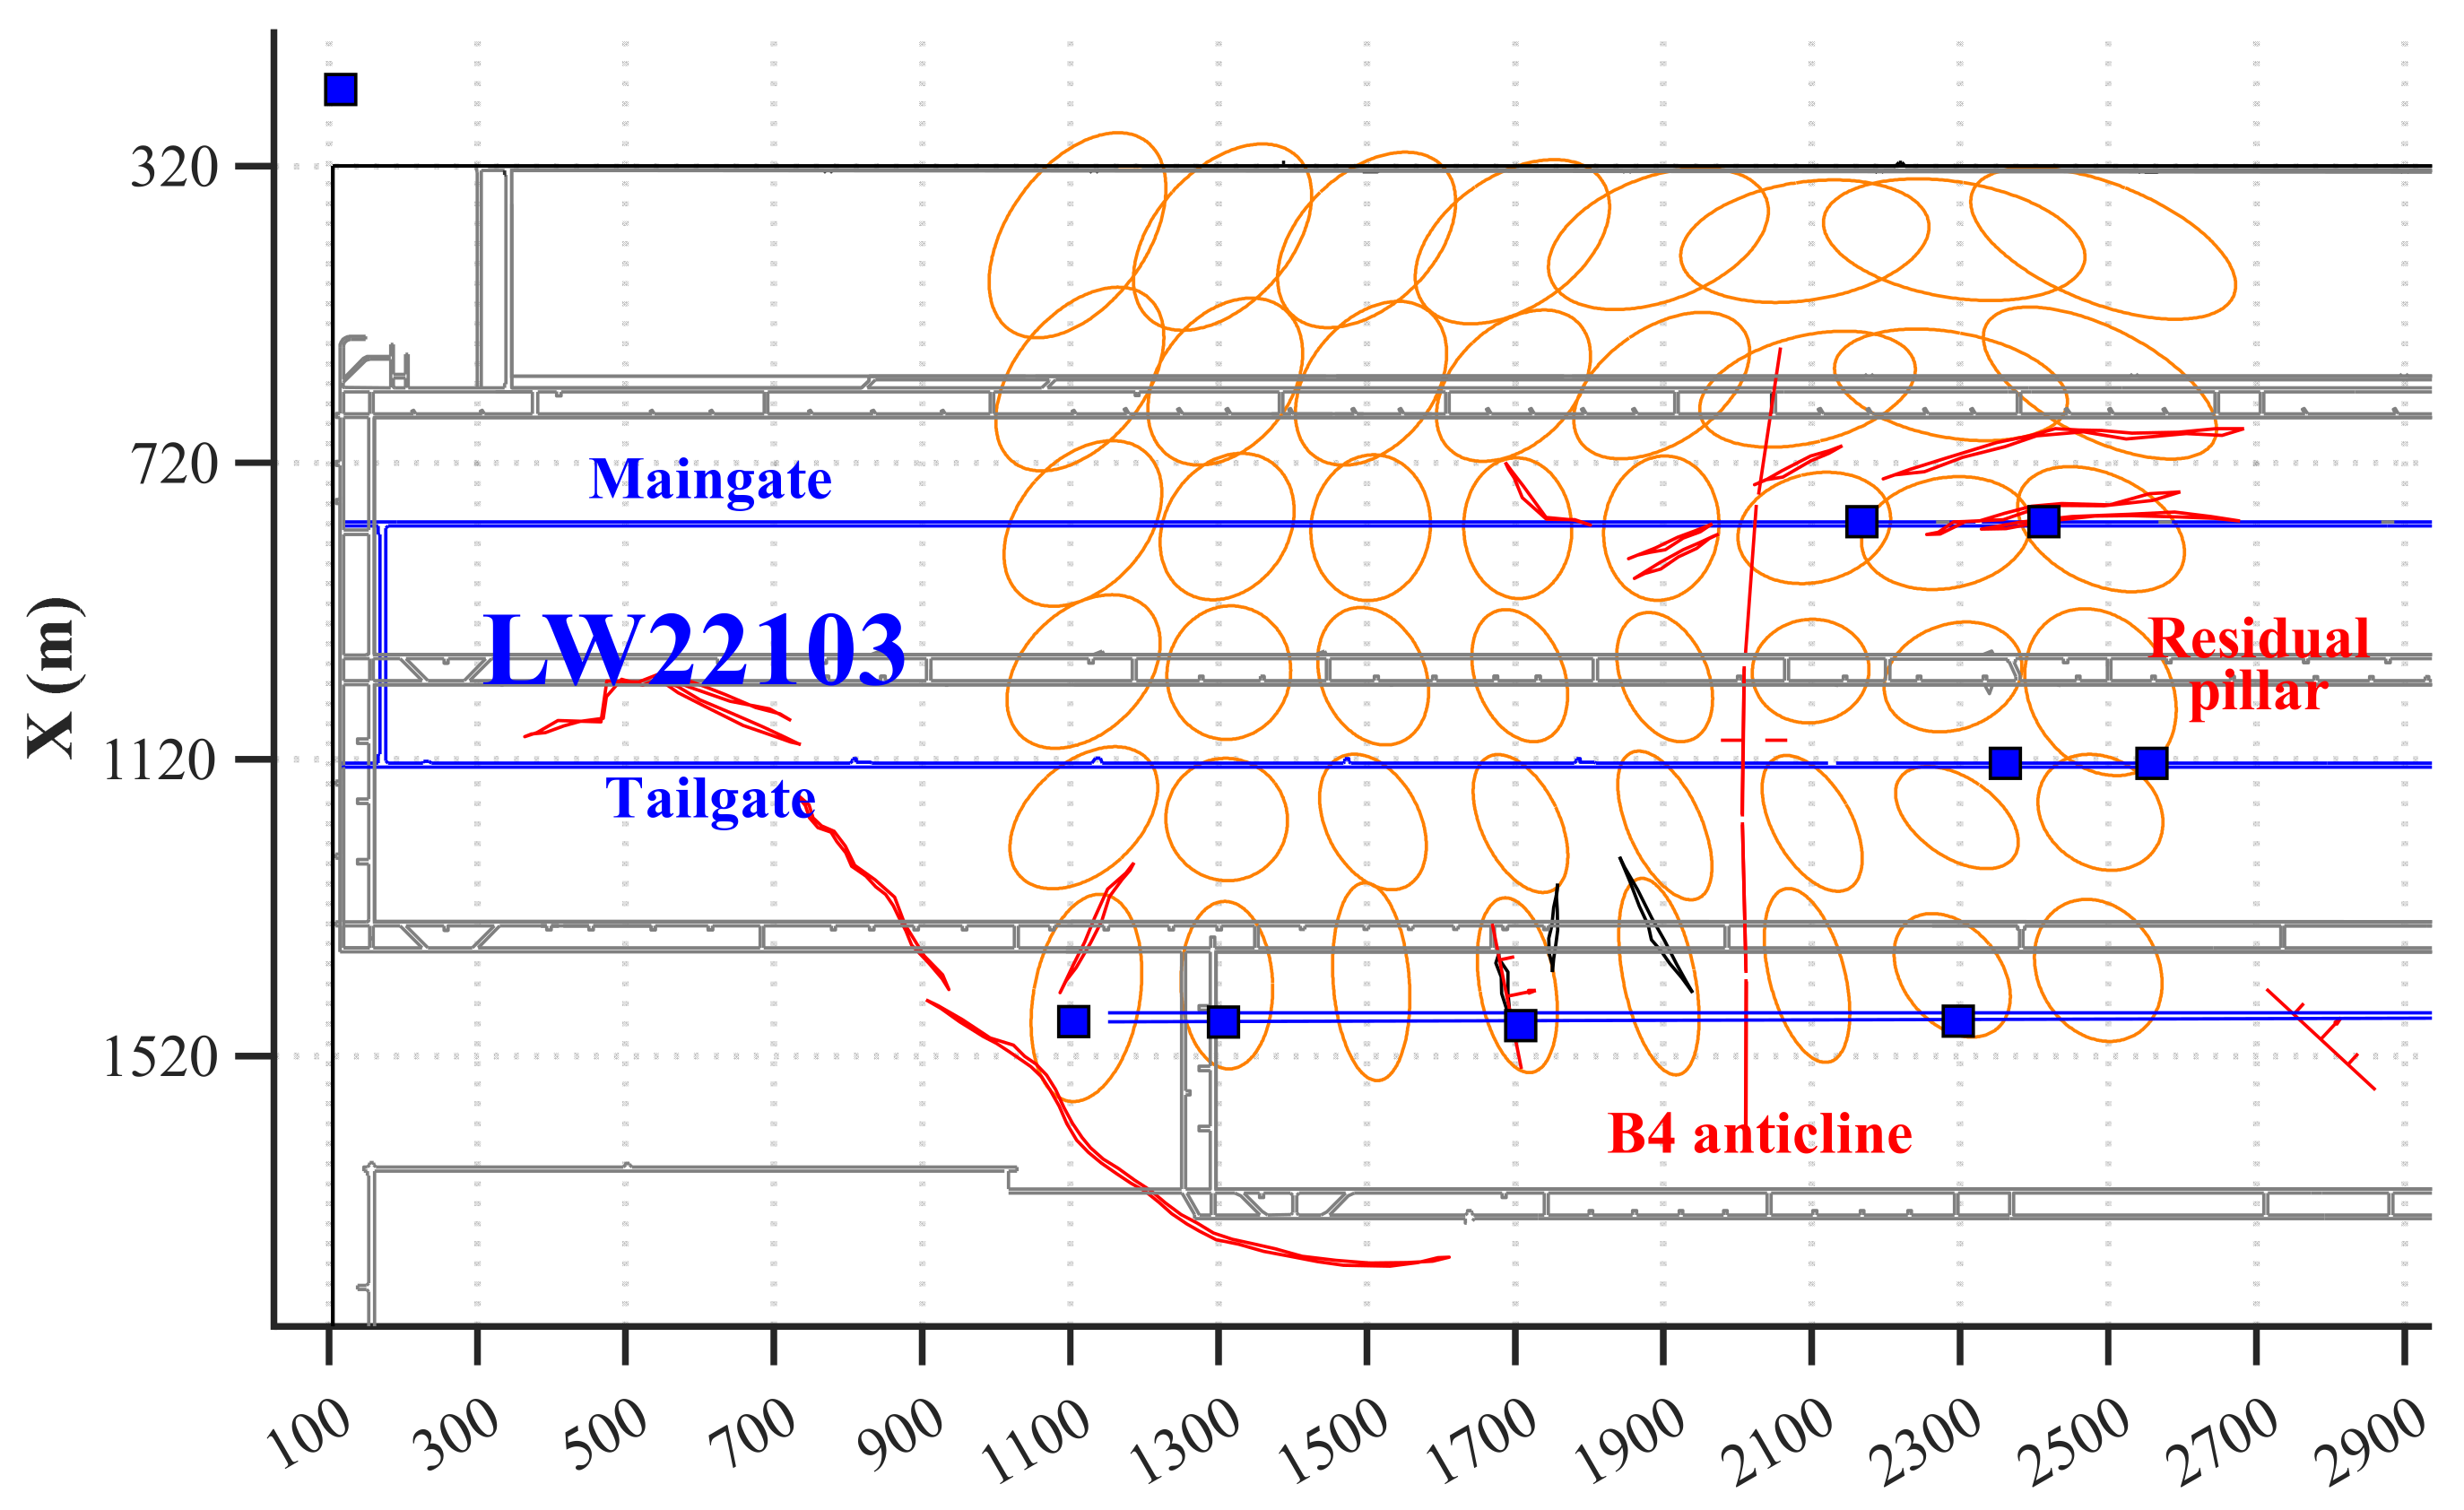
Figure 3 shows the distribution of error ellipses for seismic source location in LW22103 during retreat from February 2024 to June 2024. The figure shows that location accuracy and error orientation vary significantly across the longwall. The region with the minimum location error lies within the X-coordinate range of 1300–2100 m and the Y-coordinate range of 900–100 m, where the horizontal location error ranges from 36.5 m to 40.3 m. Within the longwall face and near the B4 anticline, the major axes of the error ellipses are oriented southwest–northeast, indicating that location errors for seismic activity in this zone are larger in the southwest–northeast direction than in the northwest–southeast direction.
In contrast, due to insufficient geophones to form a network envelope, the seismic location error in the western part of the longwall, i.e., the Y-coordinate range of approximately 400–600 m, is 60 m to 85.3 m. From north to south, the major axis of the error ellipse gradually rotates from northwest–southeast to southwest–northeast, indicating substantial directional differences. Similarly, in the eastern part of the longwall, i.e., the Y-coordinate range of approximately 1200–1400 m, the seismic location error is about 50 m to 78.6 m, and the major axis of the error ellipse is oriented east–west, suggesting that seismic events in this zone may exhibit large location errors in the east–west direction.
The results above indicate that during the LW22103 retreat, the seismic network’s location accuracy is relatively low, and the vector characteristics of location errors across different longwall zones are pronounced, likely causing serious deviations in seismic early warning for seismic hazards. Compared with the traditional scalar value of location error, error ellipses can more comprehensively describe the vector characteristics of seismic network location accuracy, providing a data basis for improving the accuracy of early warning for seismic hazards.
4.2. NPCE Results
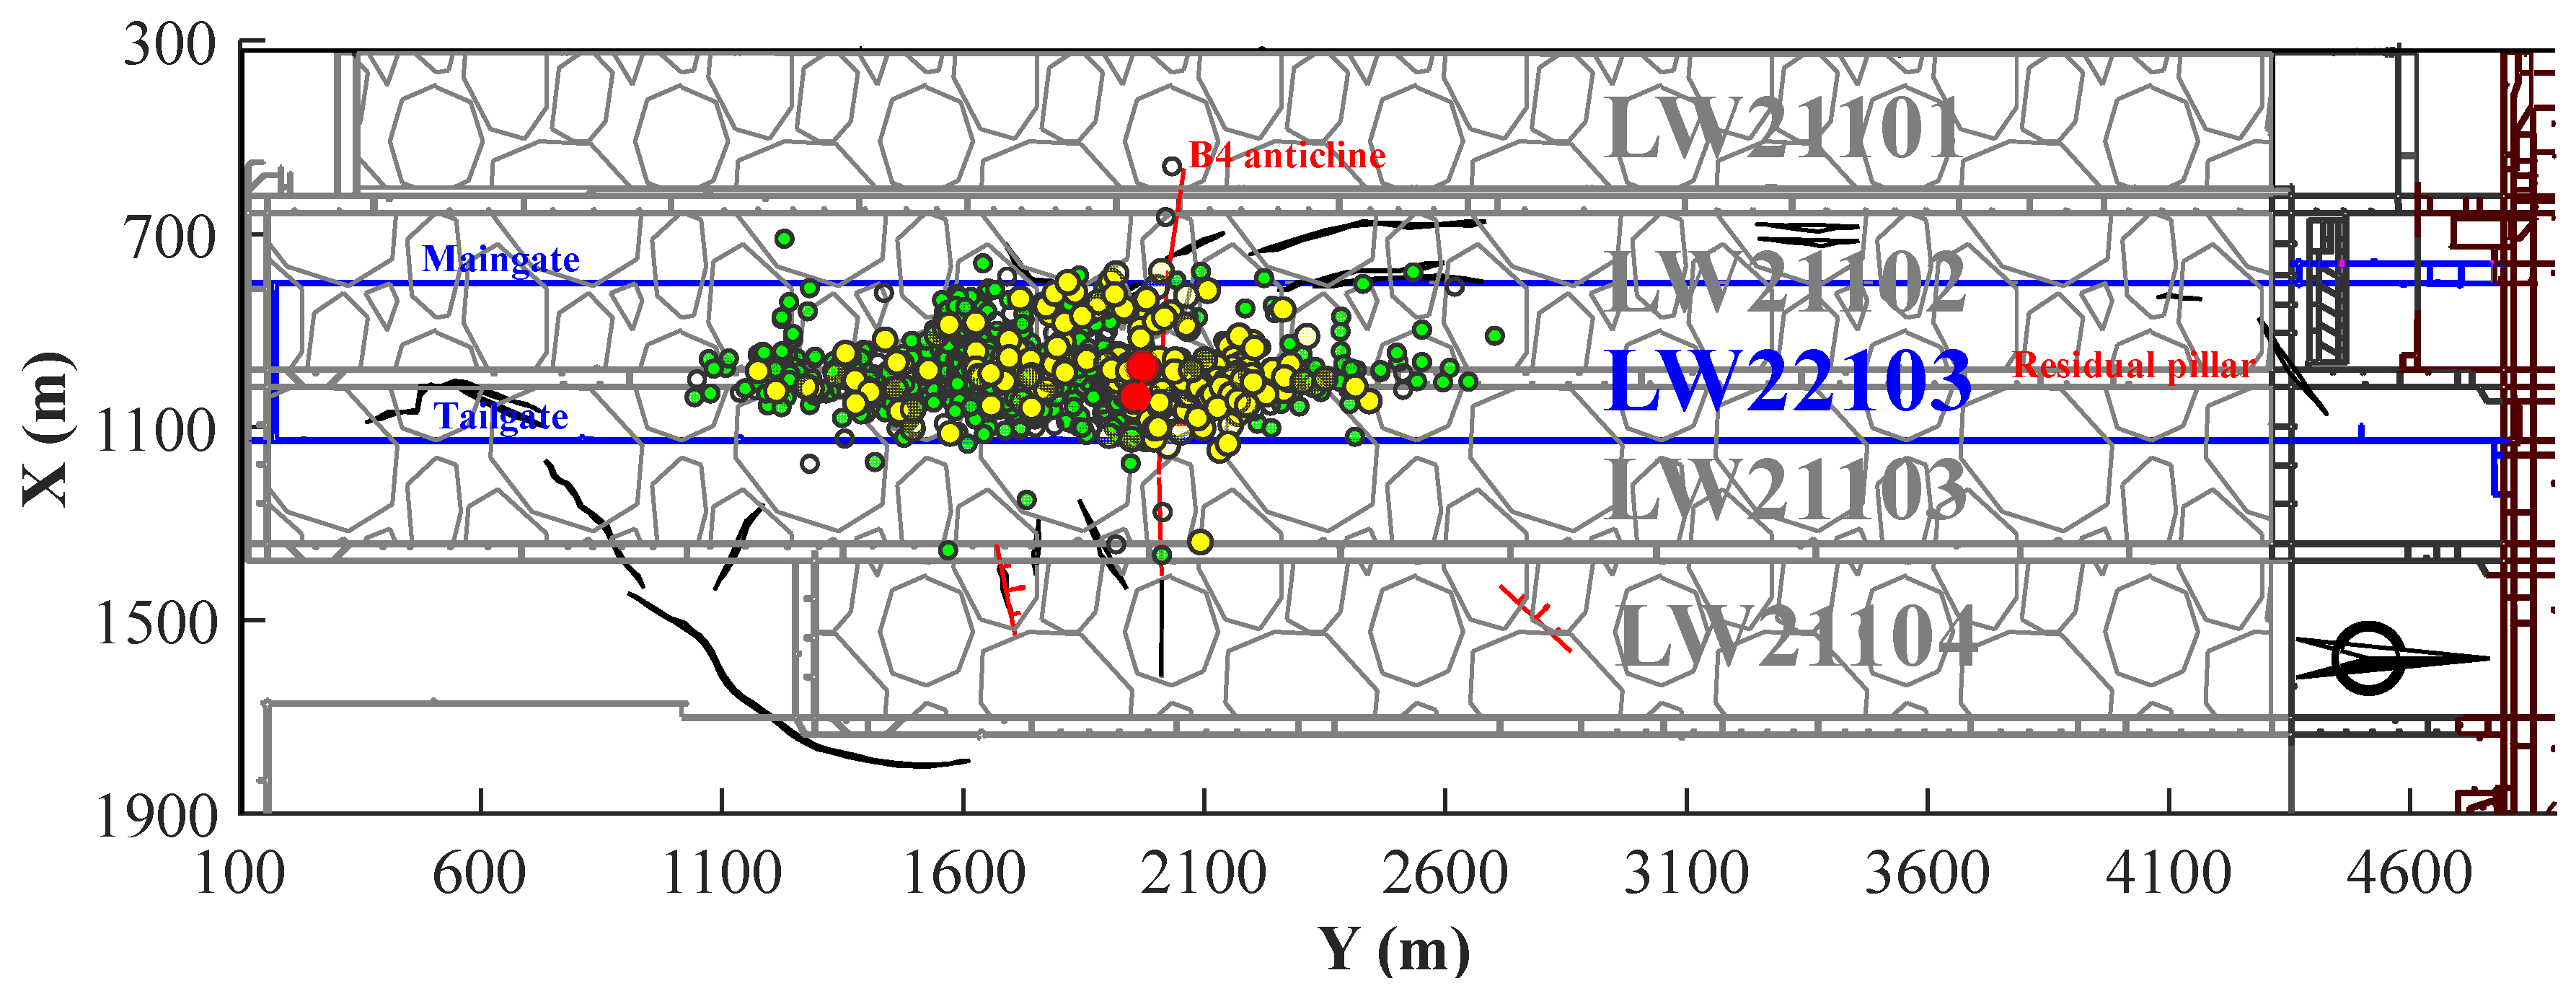
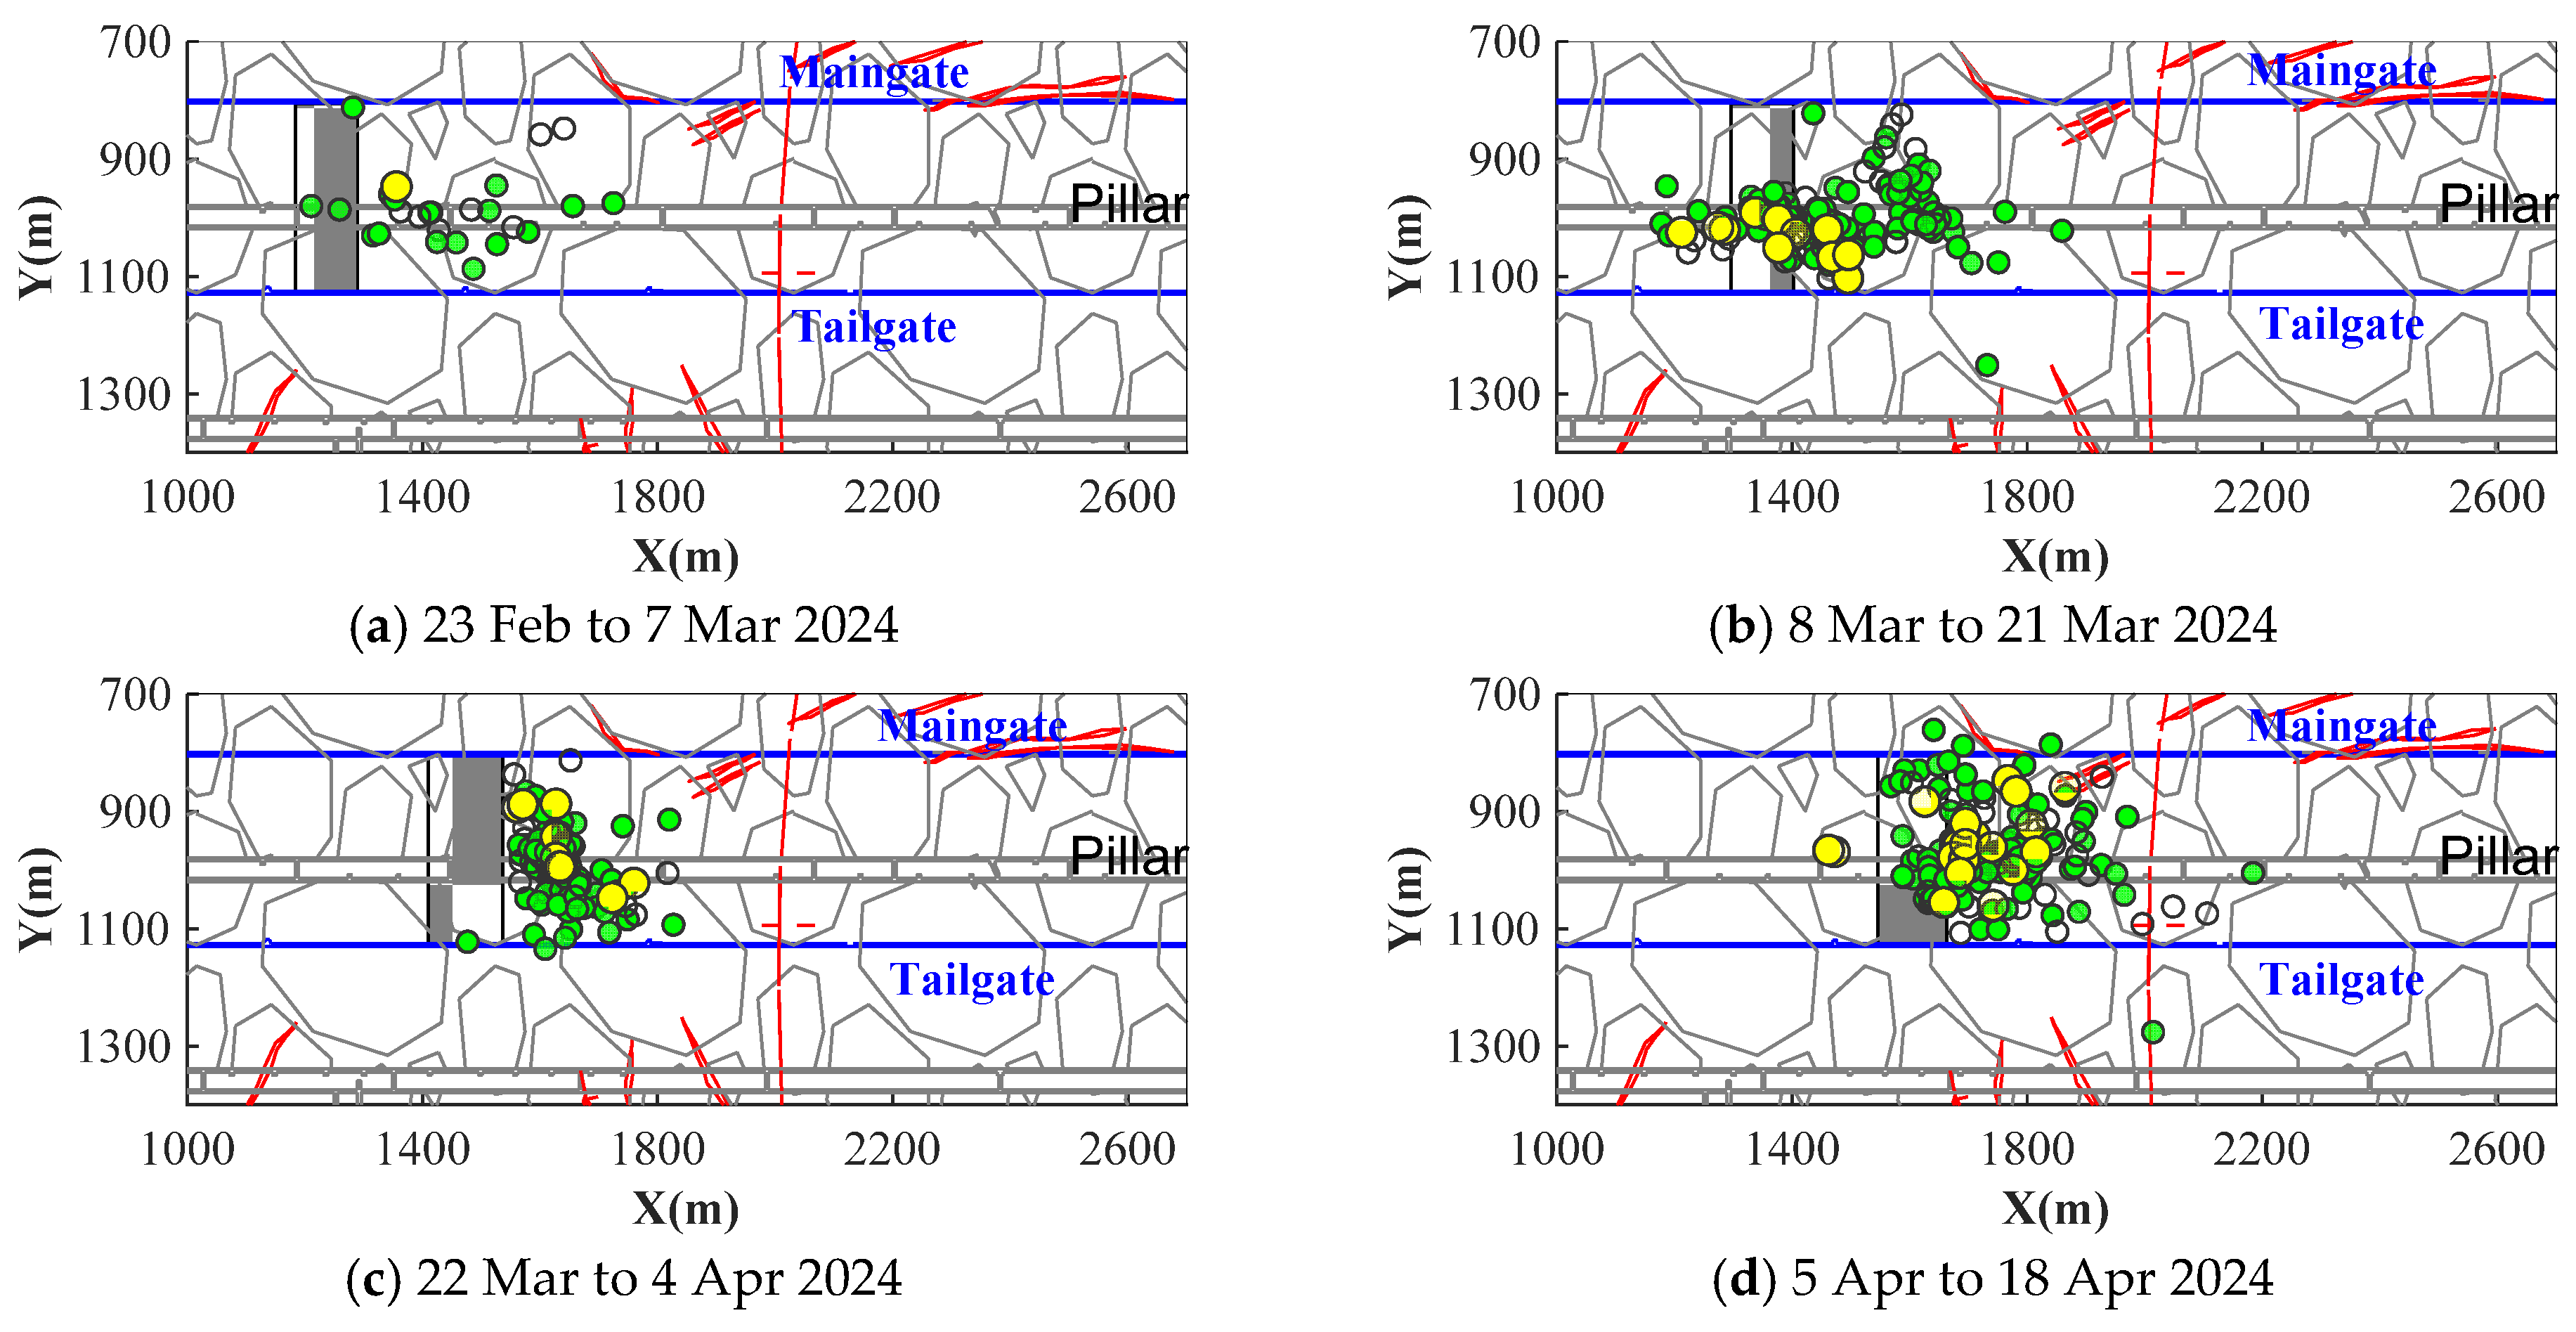
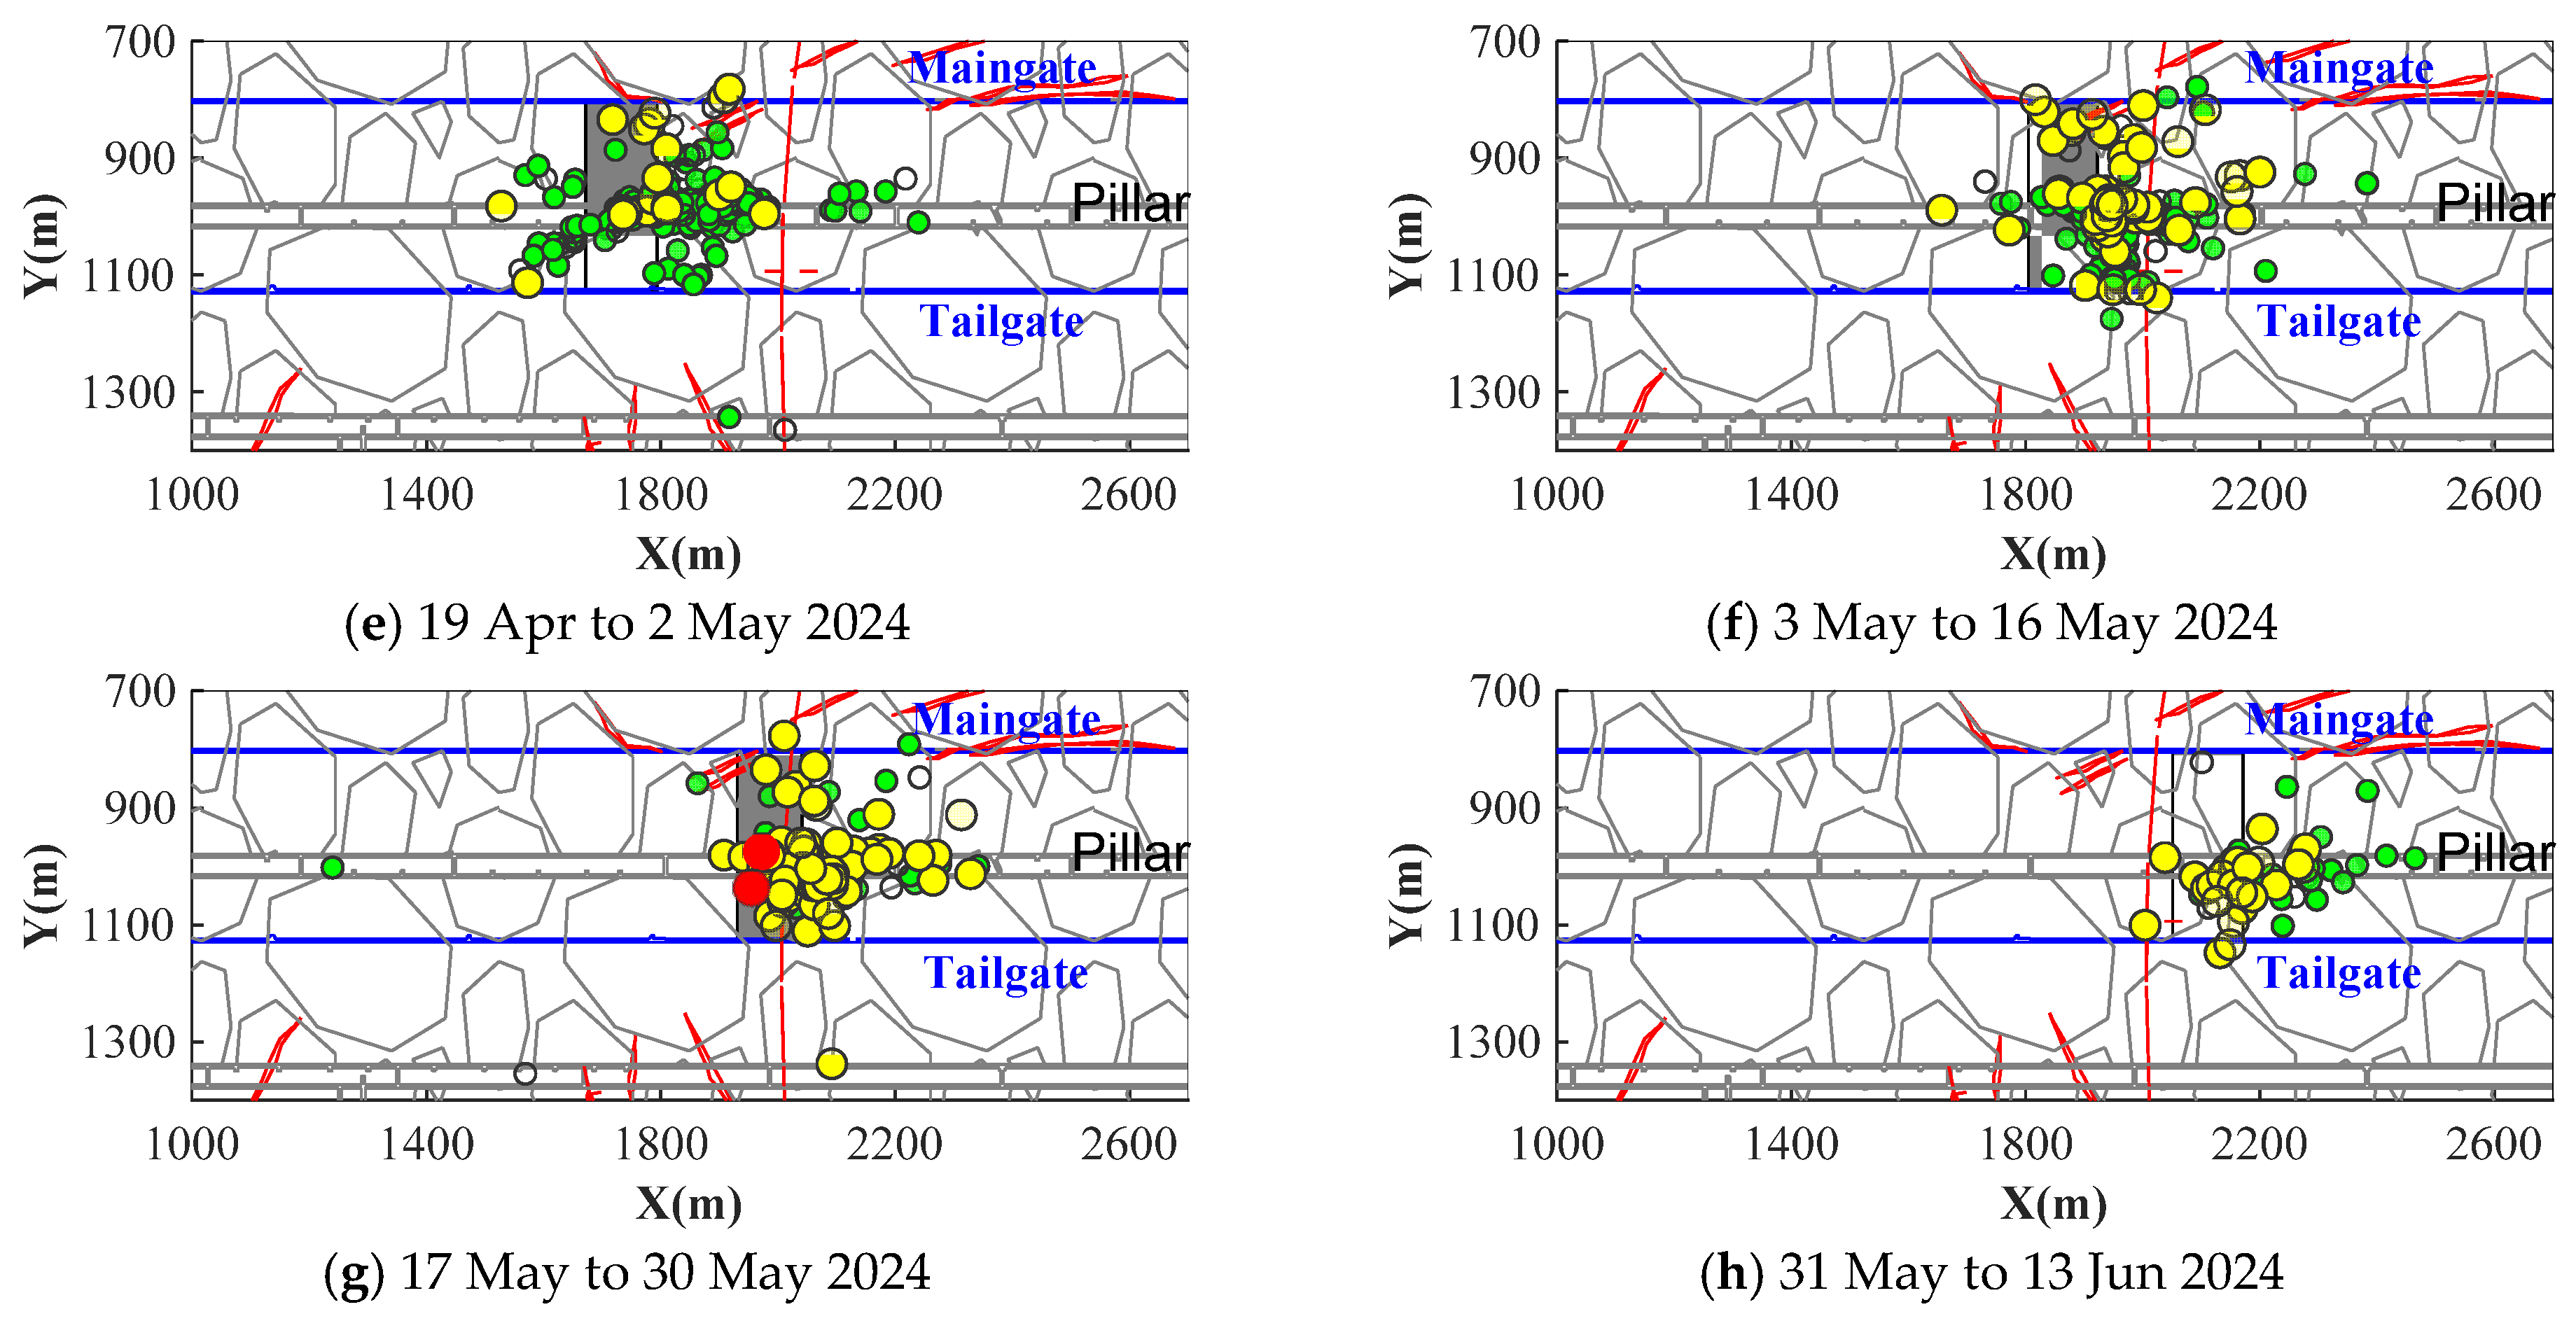
In this study, seismic events recorded in LW22103 during its passage through the B4 anticline from 23 February to 13 June 2024 were analysed. The evolution of the seismic activity distribution in LW22103 is shown in
Figure 4, using a 2-week time window and a 2-week step size for seismic data analysis.
As shown in
Figure 4a, when the longwall was approximately 700 m from the B4 anticline, few seismic events with energy greater than 1 kJ occurred, and seismic activity was mainly confined to the overlying residual coal pillar zone. This indicates a high degree of stress concentration in the coal-rock mass beneath the residual coal pillar. As the longwall gradually approached the B4 anticline (see
Figure 4b to
Figure 5e), seismic activity spread from the overlying residual coal pillar to the entire longwall face area. This suggests that the temporal and spatial evolution of seismic activity is closely controlled by the combined geological constraints of the B4 anticline and the overlying residual coal pillar. The residual pillar induces persistent vertical stress concentration in the underlying coal-rock mass, while the anticline amplifies horizontal tectonic stress as the longwall advances. This dual-stress superposition drives progressive fracture initiation, propagation, and interconnection, which, in turn, leads to a gradual increase in seismic event frequency and the expansion of high-NPCE zones. As the anticline is approached, the intensified tectonic stress accelerates fracture connectivity, leading to frequent high-energy seismic events and a sharp rise in seismic hazard risk.
When the distance to the anticline was less than 100 m (see
Figure 4f), the B4 anticline zone and the overlying residual coal pillar zone exhibited frequent, intense high-energy seismic events, indicating a rapid increase in seismic hazard risk. During passage through the B4 anticline, two strong seismic events with energy exceeding 10 kJ occurred (see
Figure 4g), indicating that the coal-rock mass was in a highly unstable state, with seismic hazard risk at its peak. After retreating past the B4 anticline, the frequency of seismic activity at the longwall decreased significantly, indicating that the abnormal influence of tectonic stress induced by the B4 anticline gradually weakened and the seismic hazard risk correspondingly diminished.
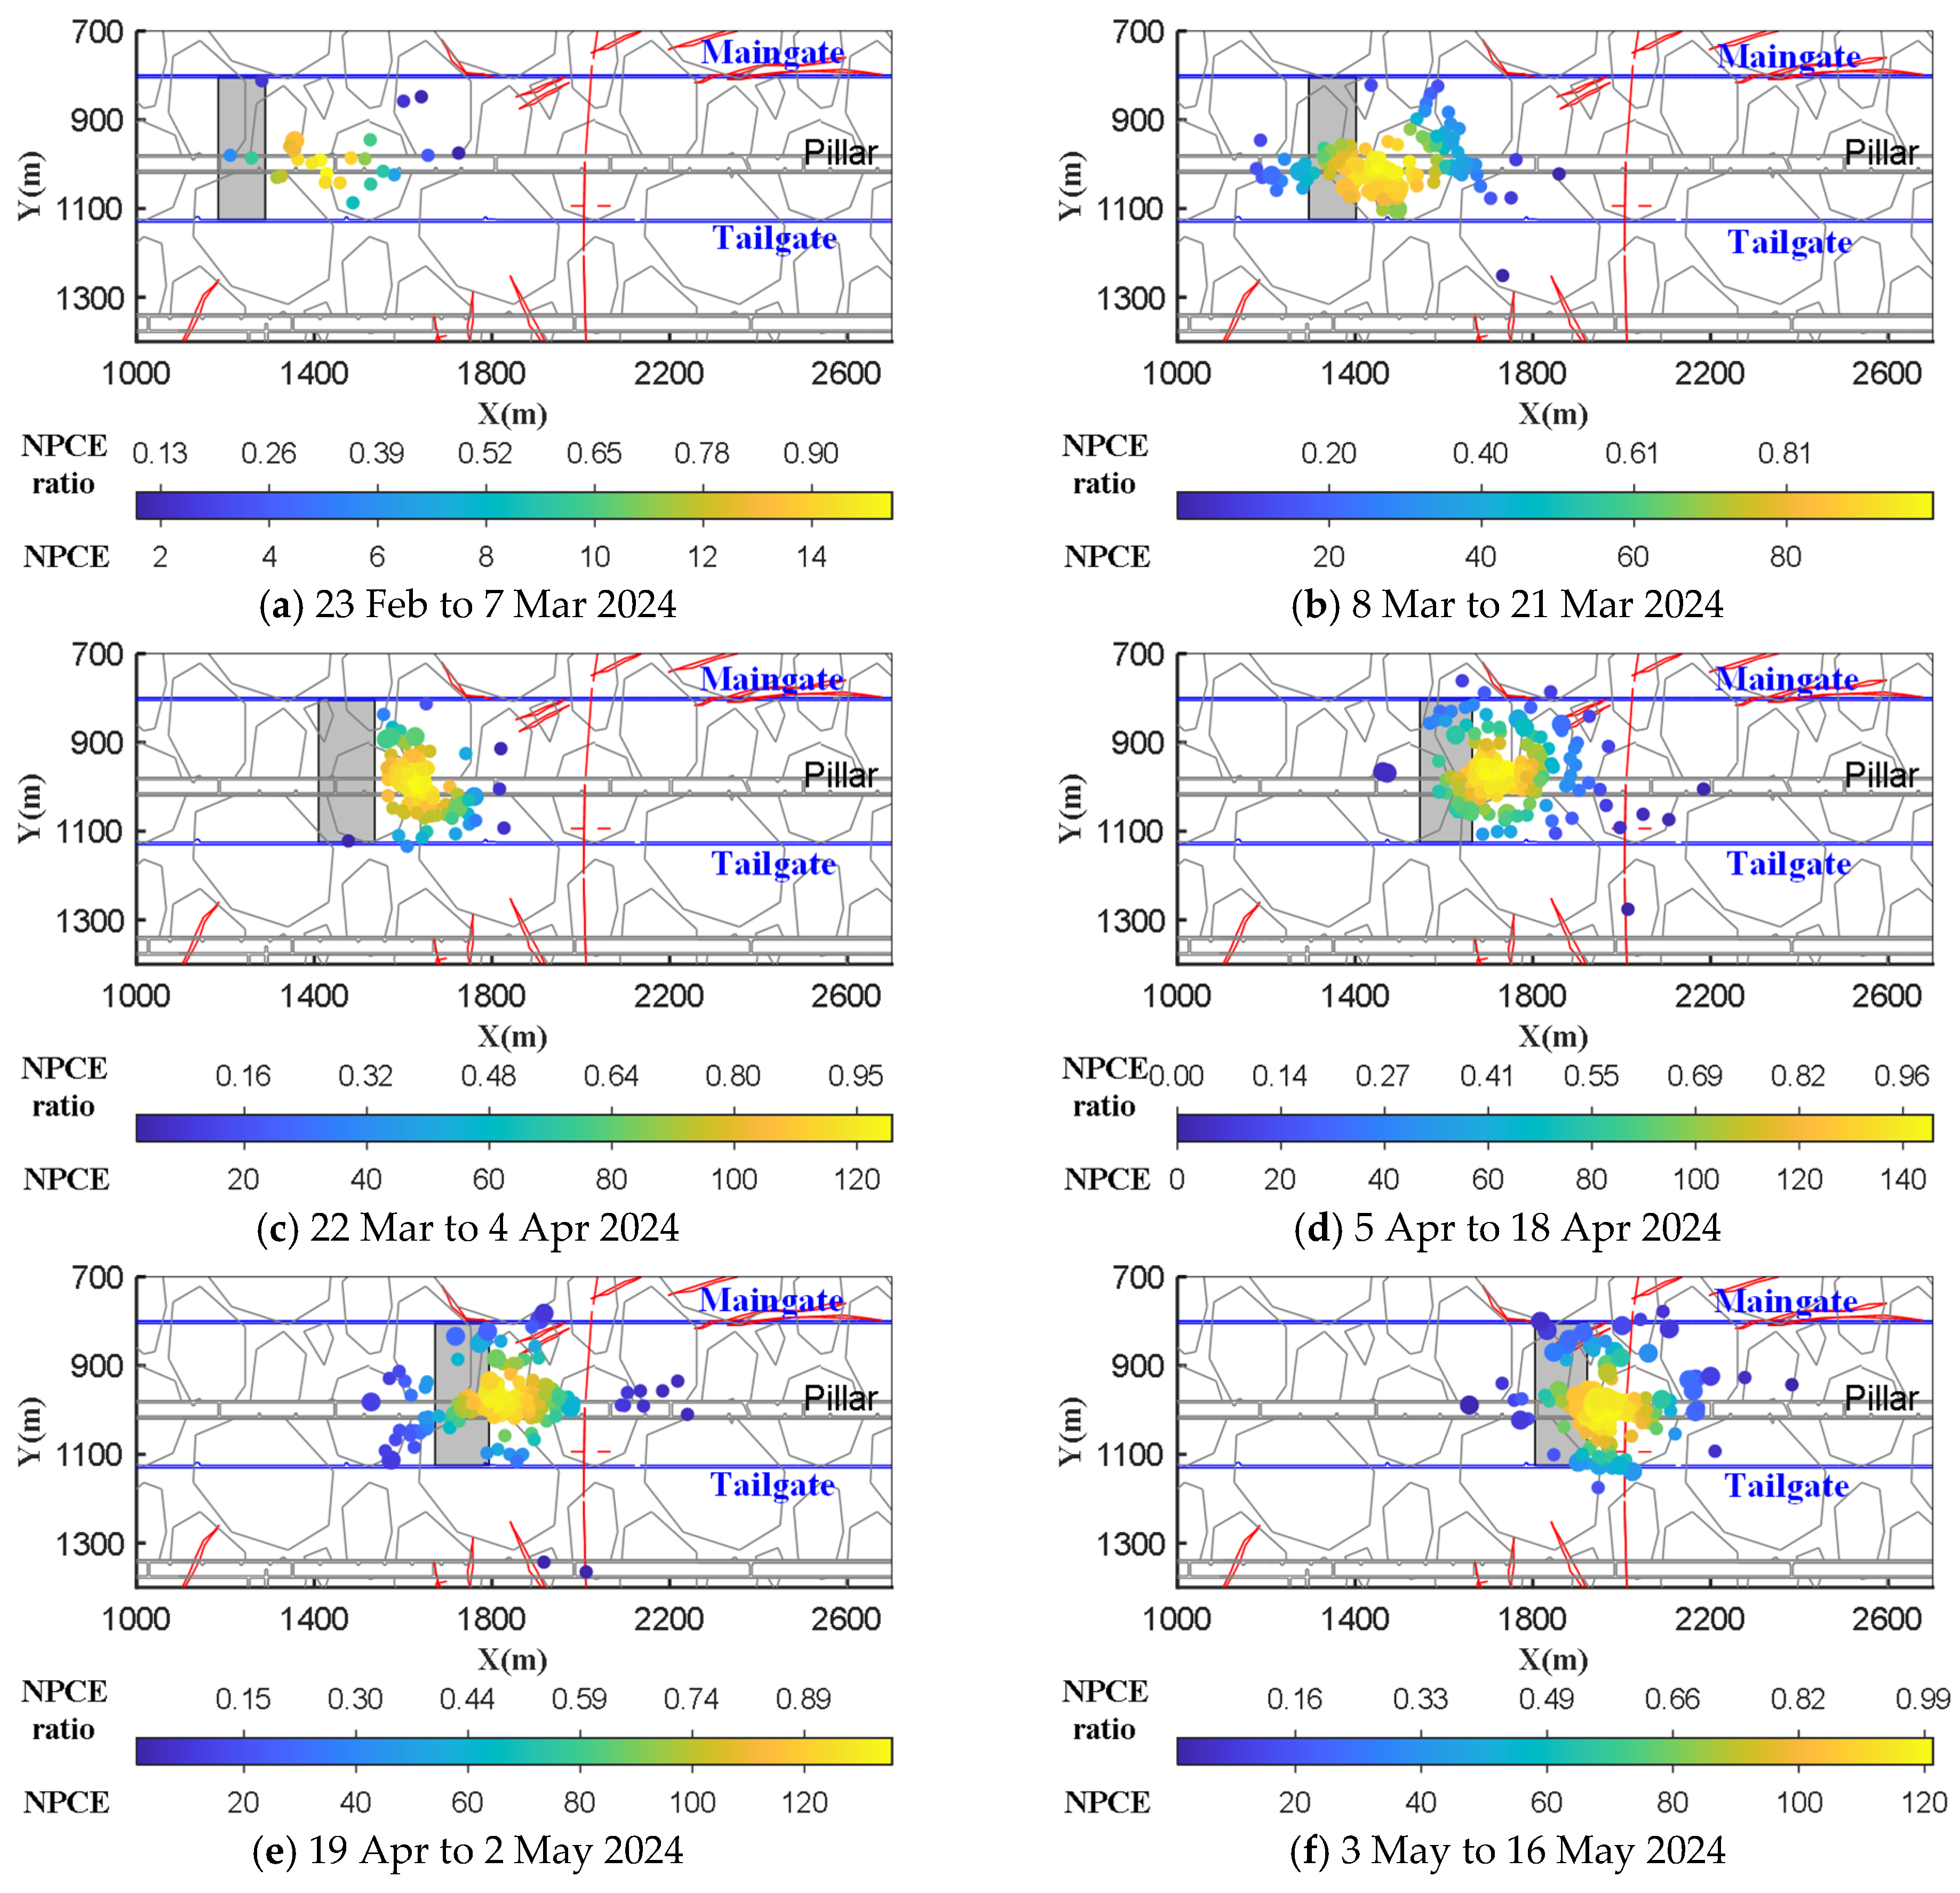
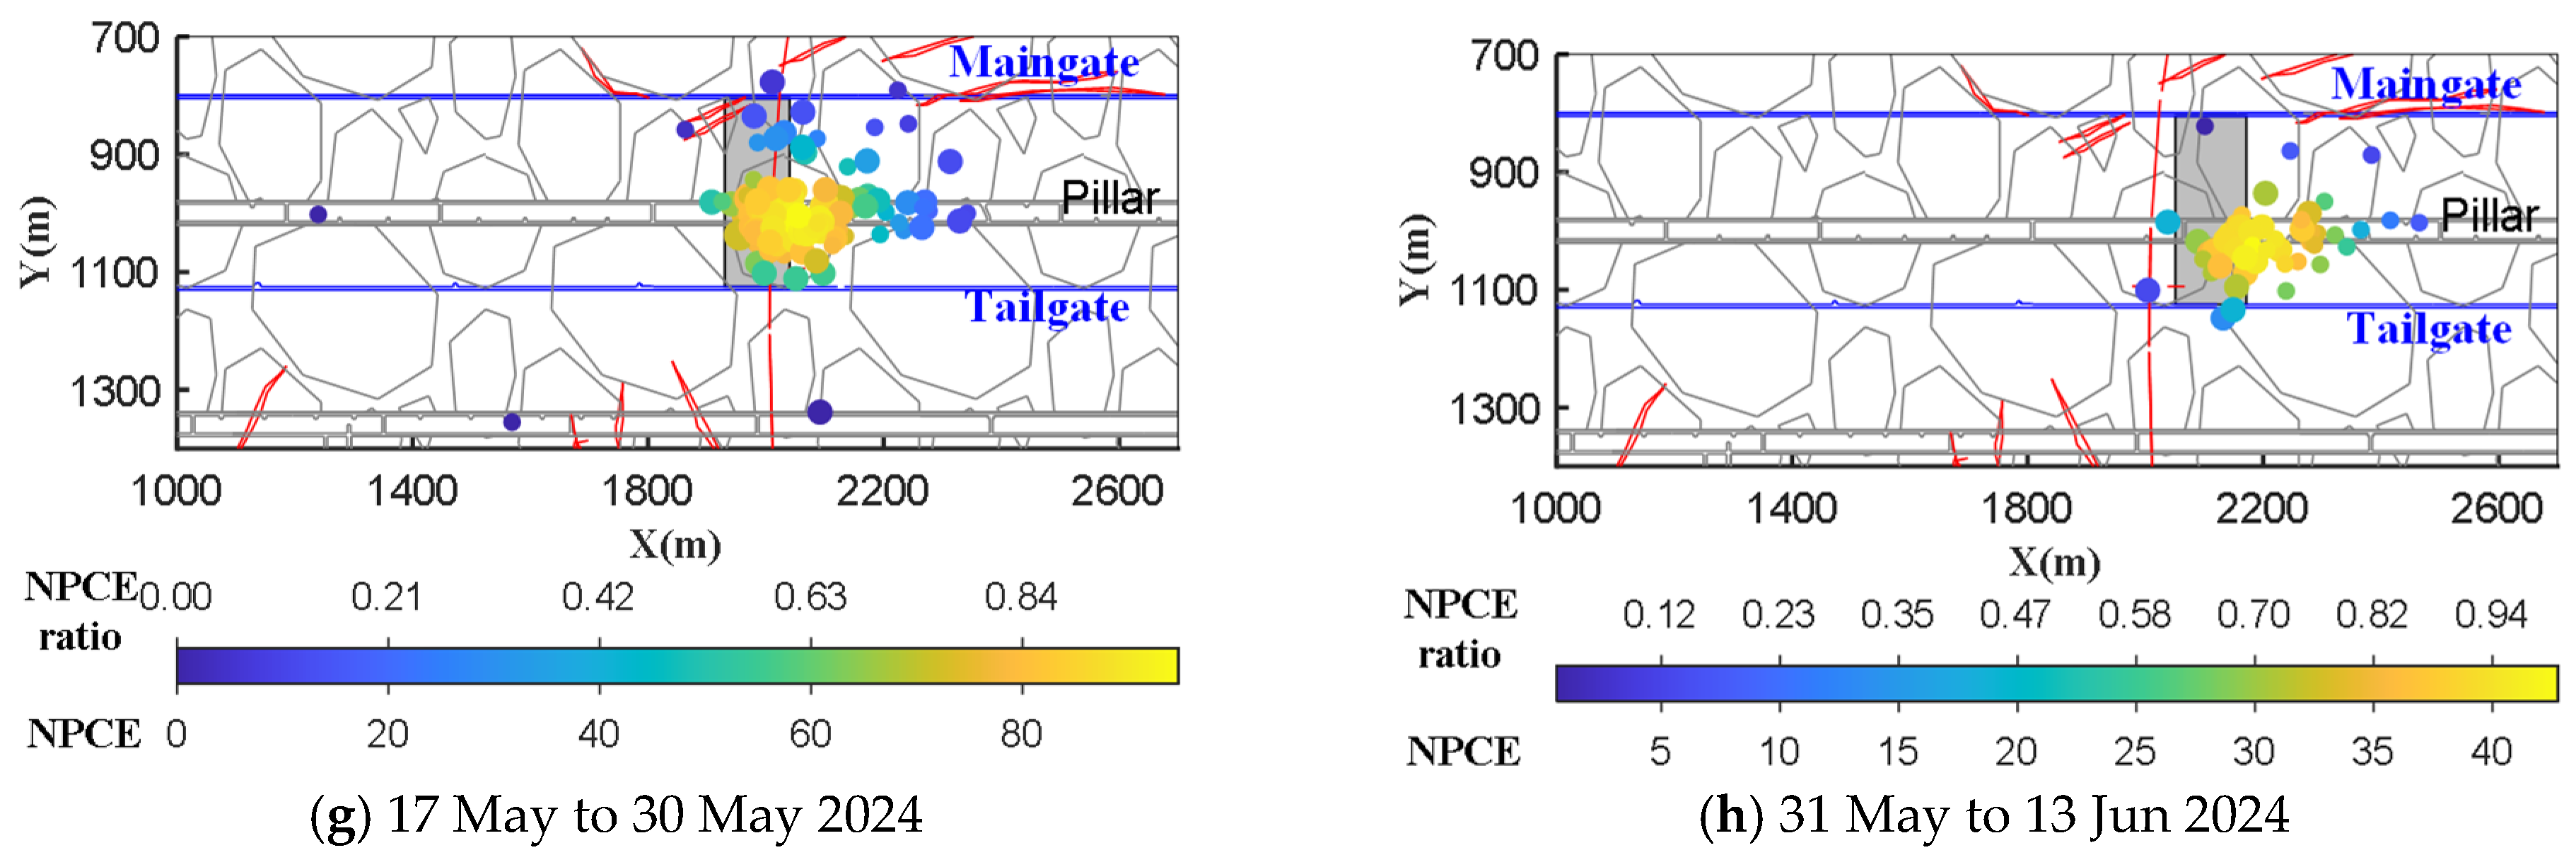
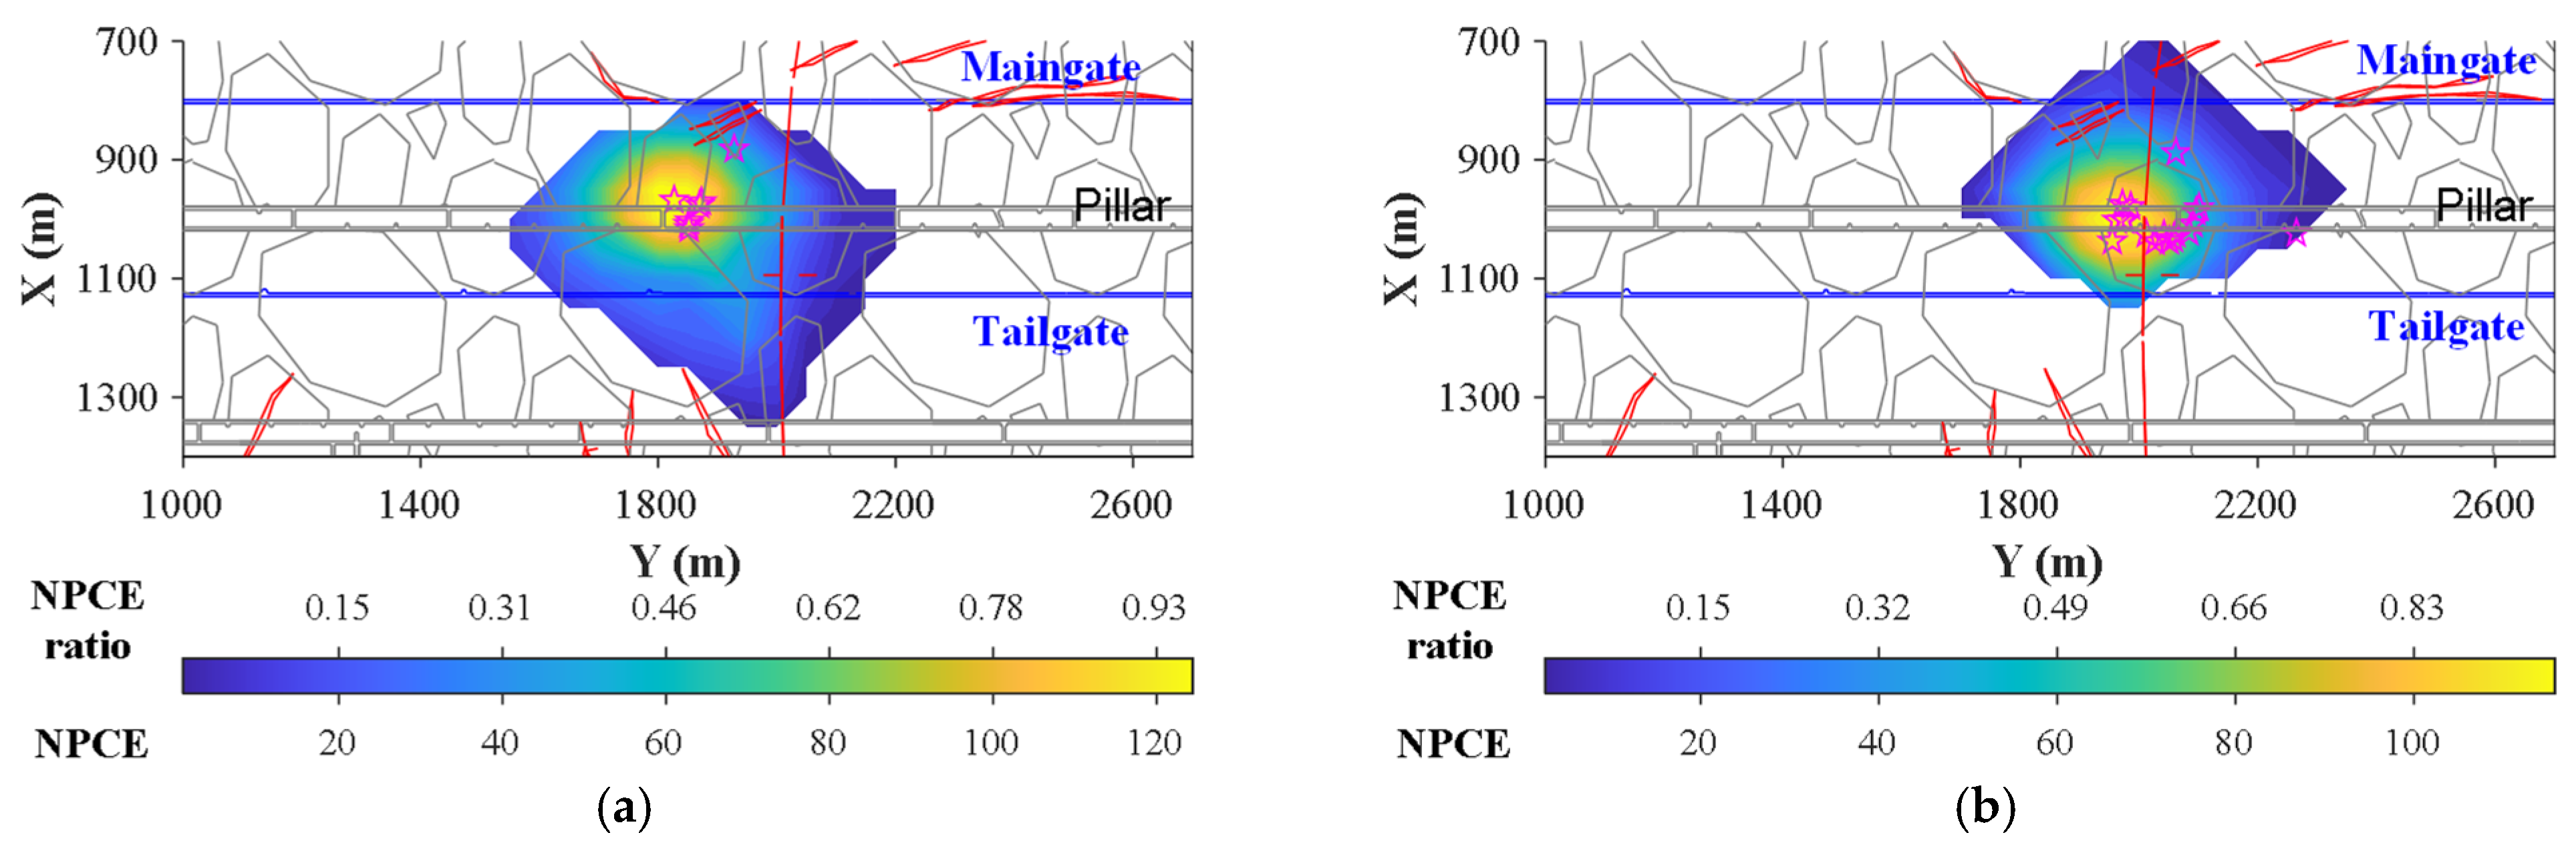
Figure 5 shows the NPCE distribution in LW22103 during the retreat from 23 February to 13 June 2024. To quantitatively compare the clustering degree of seismic activity across periods, the NPCE results were normalised. For the
grid or the
event, the normalised value
of its pre-warning indicator
is as follows:
where
and
are the maximum and minimum indicator results during the study period, respectively.
As shown in
Figure 5a, when LW22103 face was far from the B4 anticline, high NPCE values were mainly concentrated in the overlying residual coal pillar zone, which is basically consistent with the seismic activity distribution in
Figure 4a. Similarly, in
Figure 5b,c, as the longwall face was affected by the geological anomaly, accompanied by a gradual increase in horizontal tectonic stress, the range of high-NPCE zones gradually expanded, which is generally consistent with the distribution characteristics of seismic events with energy greater than 1 kJ in
Figure 4b,c.
However, the NPCE distribution patterns in
Figure 5d differ significantly from those of seismic events with energy greater than 1 kJ in
Figure 4d.
Figure 5d shows that the seismic cluster was still highly concentrated in the overlying residual coal pillar zone with an expanded range, where the maximum NPCE exceeded 140, while the seismic clustering degree in other areas remained low with NPCE values of only about 20–40. In
Figure 4d, seismic events with energy greater than 1 kJ had already appeared near the maingate of the longwall, but their corresponding NPCE values were still low, at only approximately 50.
Similar phenomena were also observed during the period when the LW22103 retreated from 200 m away from the B4 anticline to passing through it (see from
Figure 5e–g). During this period, high NPCE values were mainly concentrated at the intersection of the overlying residual coal pillar and the B4 anticline, whereas seismic events with energy greater than 1 kJ had spread across the entire longwall face (see from
Figure 4e–g). This indicates that under the combined influence of overburden vertical pressure and horizontal tectonic stress from the geological anomaly, internal fractures in the coal-rock mass in the middle of the longwall had become fully connected, unstable failure was likely to occur, and the risk of seismic hazards induced by strong seismic events peaked. After passing through the B4 anticline, NPCE values decreased substantially, and the seismic hazard risk was reduced.
The results in
Figure 5 demonstrate that NPCE does not have a one-to-one correspondence with high-energy seismic events. This discrepancy mainly occurs in two scenarios. First, scattered high-energy events induced by local small faults may occur without widespread fracture connectivity, leading to high energy but low NPCE. Second, high NPCE values can appear in regions with fully connected microcracks but insufficient energy accumulation for immediate high-energy release, reflecting early-stage instability before strong events. This distinction indicates that NPCE characterises fracture connectivity, while high-energy events reflect sudden energy release, representing different stages of the failure process.
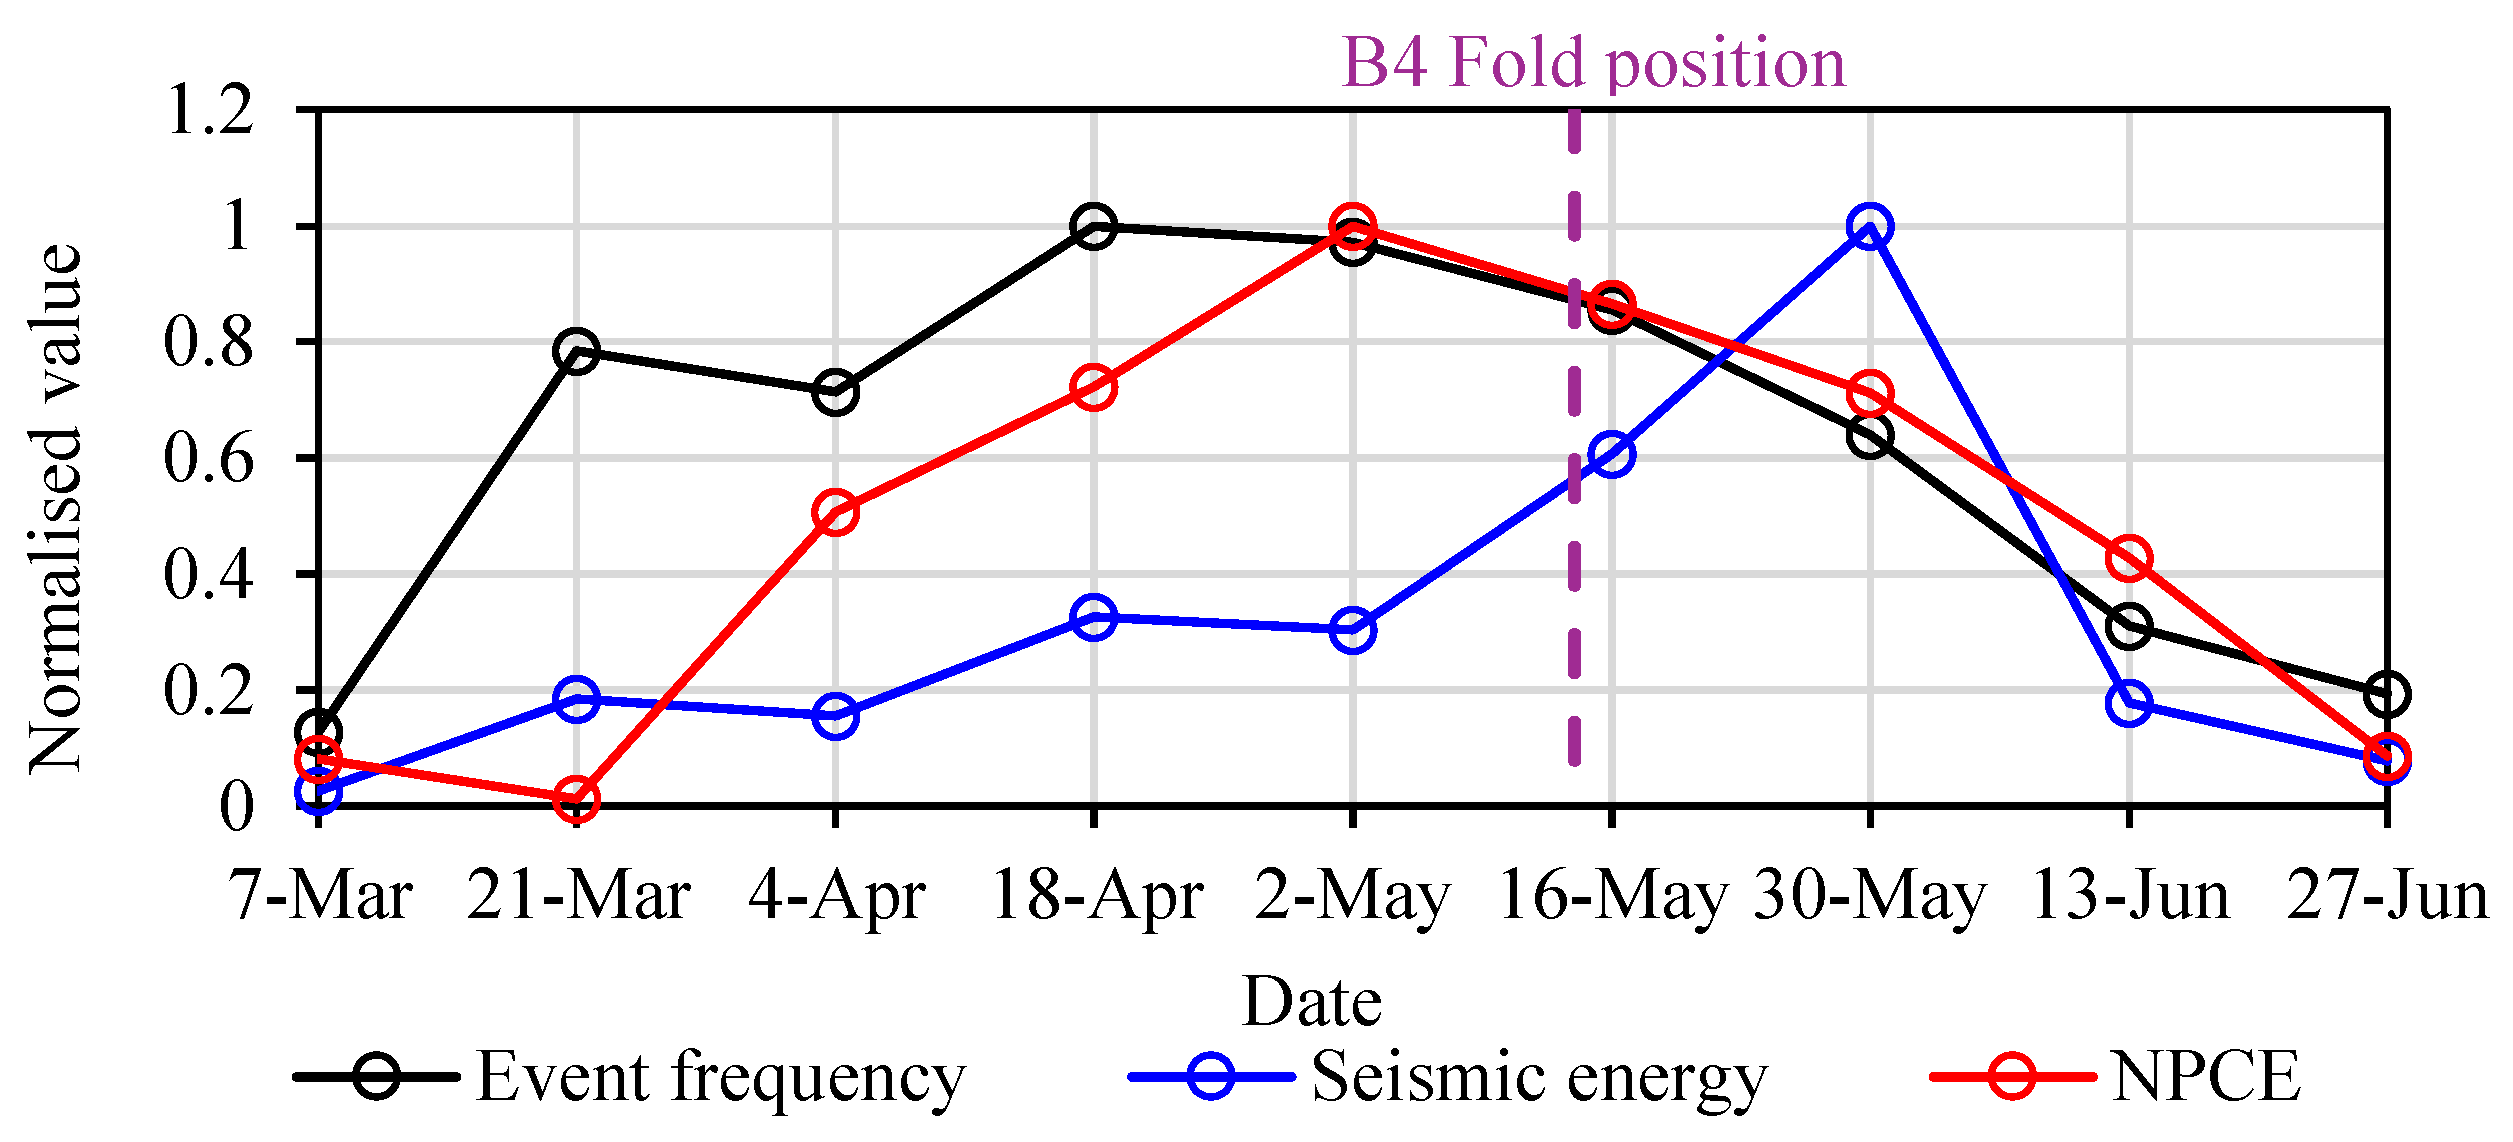
The temporal evolution of normalised event frequency, seismic energy, and NPCE during mining toward the B4 anticline is shown in
Figure 6. Before approaching the B4 fold (7-Mar to 18-Apr), event frequency rises rapidly to a normalised value of 1.0, while seismic energy and NPCE increase gradually to 0.33 and 0.72, respectively. This trend reflects the initial accumulation of stress and microcrack propagation under the combined influence of the residual coal pillar and advancing mining.
As mining advances to the B4 fold position (18-Apr to 16-May), event frequency remains high, between 0.9 and 1.0, and NPCE peaks at 1.0, indicating widespread fracture connectivity. Seismic energy fluctuates between 0.3 and 0.6, corresponding to moderate energy release during progressive crack coalescence. The synchronous elevation of event frequency and NPCE confirms that the B4 anticline amplifies tectonic stress, driving the formation of a connected fracture network.
After passing the B4 fold (16-May to 27-Jun), event frequency and NPCE decline steadily, while seismic energy first surges to 1.0 on 30-May before dropping sharply. This transient energy peak indicates a sudden release of accumulated elastic energy after the working face clears the anticline, while the gradual decrease in NPCE reflects the gradual closure of fractures and reduction in connectivity as stress redistributes. These quantitative changes establish a clear causal link between geological controls (B4 anticline + residual coal pillar) and the evolution of seismic activity and fracture connectivity.
Also, Pearson correlation coefficients and key statistics were calculated for the time series (February–June 2024). NPCE shows a strong positive correlation with event frequency (r = 0.82,
p < 0.01) and a moderate correlation with seismic energy (r = 0.67,
p < 0.01), while frequency and energy are weakly correlated (r = 0.59,
p < 0.01). This indicates that NPCE primarily reflects fracture connectivity rather than sudden energy release. Normalised statistics show NPCE has a mean of 0.58 and a standard deviation of 0.29, balancing sensitivity and stability. Consistent with
Figure 6, NPCE and frequency rise synchronously near the anticline, whereas energy peaks later, reflecting delayed energy release after fracture network formation.
4.3. Seismic Hazard Pre-Warning Performance Assessment
To quantitatively compare the pre-warning performance of NPCE, seismic event frequency, and energy magnitude for seismic hazards, the study analysed the relationship between the distributions of each indicator during mining near the B4 anticline influence zone from 19 April to 16 May 2024, and the locations of 25 strong seismic events with energy greater than 5 kJ that were imminent from 3 May to 30 May 2024.
Figure 7 shows the distribution of NPCE and normalized NPCE (hereafter referred to as
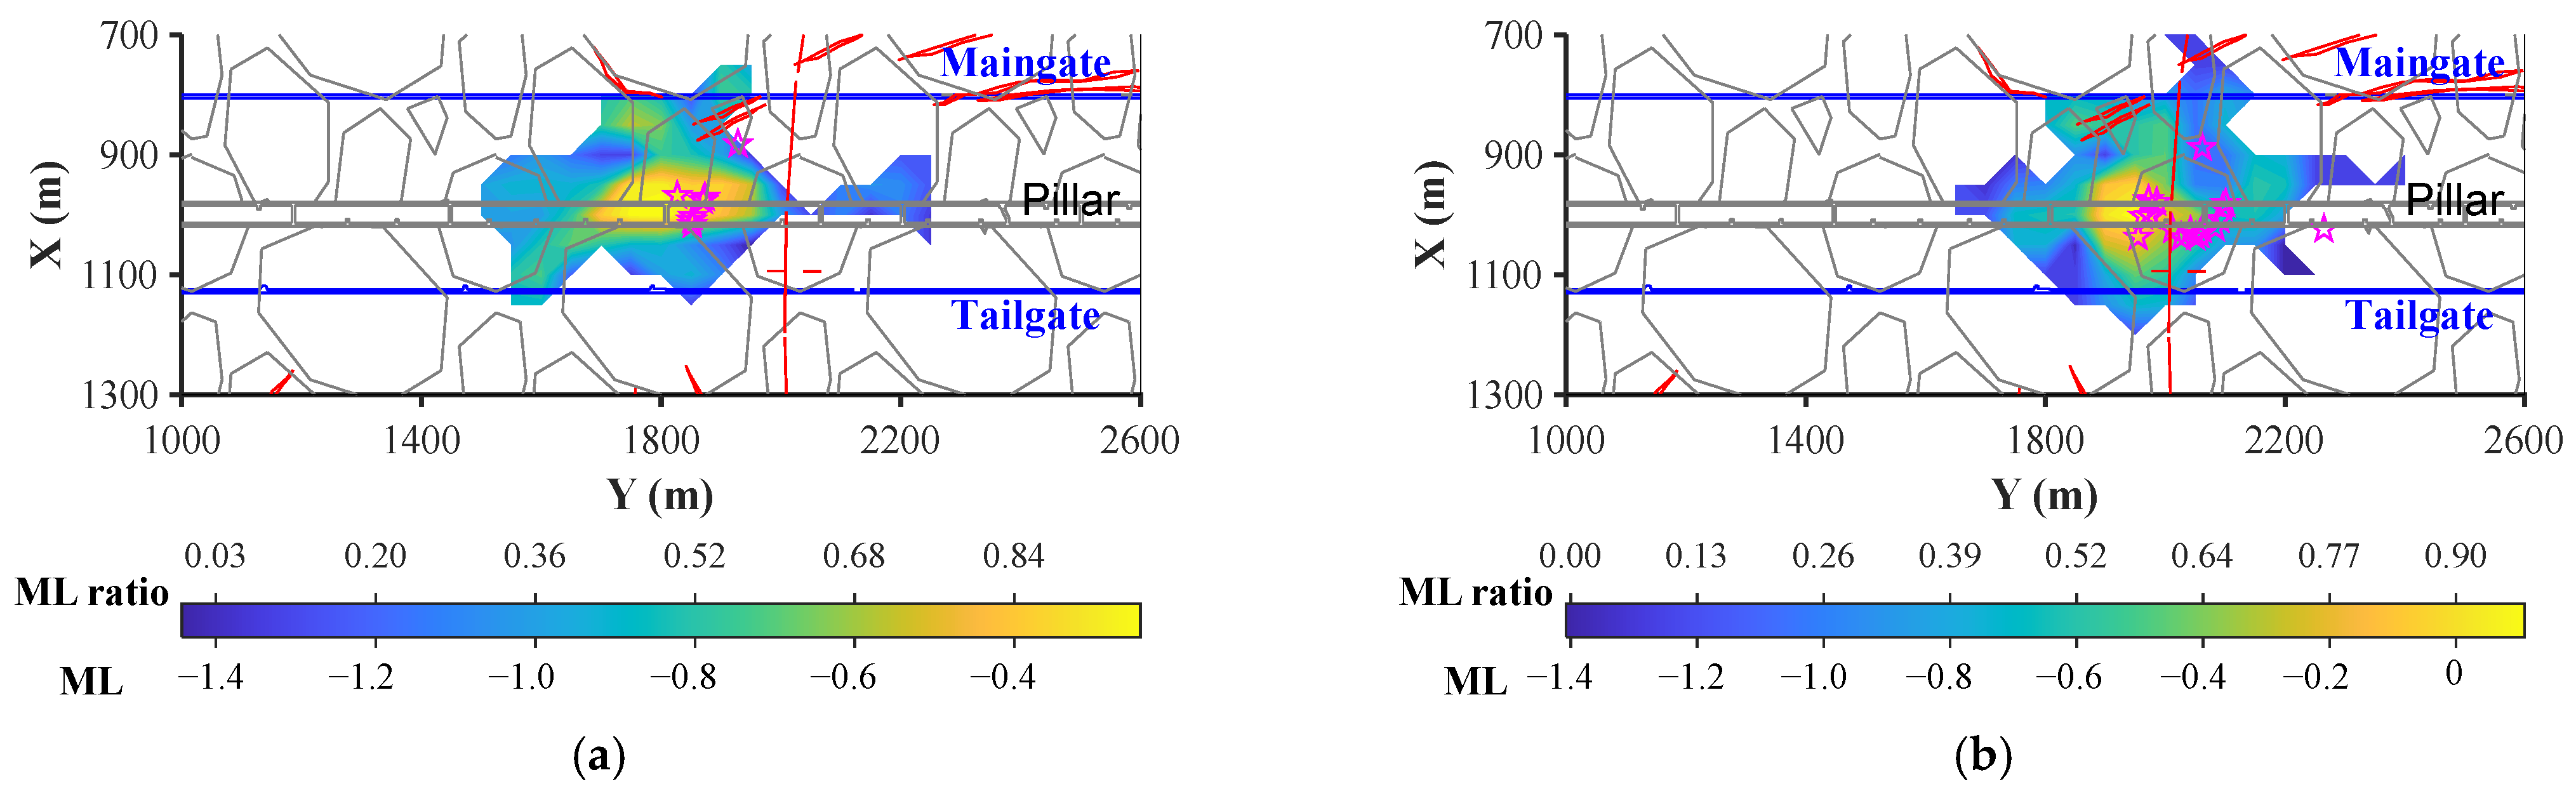
) in LW22103 from 19 April to 2 May 2024 and from 3 May to 16 May 2024, respectively. The pink pentagrams represent the planar locations of strong seismic events with energy greater than 5 kJ that occurred within the following two weeks. As shown in
Figure 7a, based on the NPCE results from 19 April to 2 May 2024, 6 out of 7 imminent strong seismic events were concentrated in the overlying residual coal pillar zone, where NPCE values were all greater than 100 and the corresponding
reached above 0.78. Only one high-energy event near the small fault group had a low NPCE value of 23.84 and
of 0.18. As shown in
Figure 7b, based on the NPCE results from 3 May to 16 May 2024, there were 18 imminent strong events, mainly distributed at the intersection of the overlying residual coal pillar and the B4 anticline. Among them, 12 events were located in the medium-to-high NPCE zone, with NPCE values greater than 82 and
greater than 0.7. Three events were located in the medium NPCE zone, with
ranging between 0.5 and 0.7. The remaining three high-energy events showed poor correspondence with NPCE, as the
in their corresponding zones were less than 0.5. The above results indicate that the NPCE distribution in LW22103 exhibits a strong positive correlation with strong seismic events imminent in the short-term future, and thus, can be used as an ideal periodic pre-warning evaluation indicator for seismic hazards.
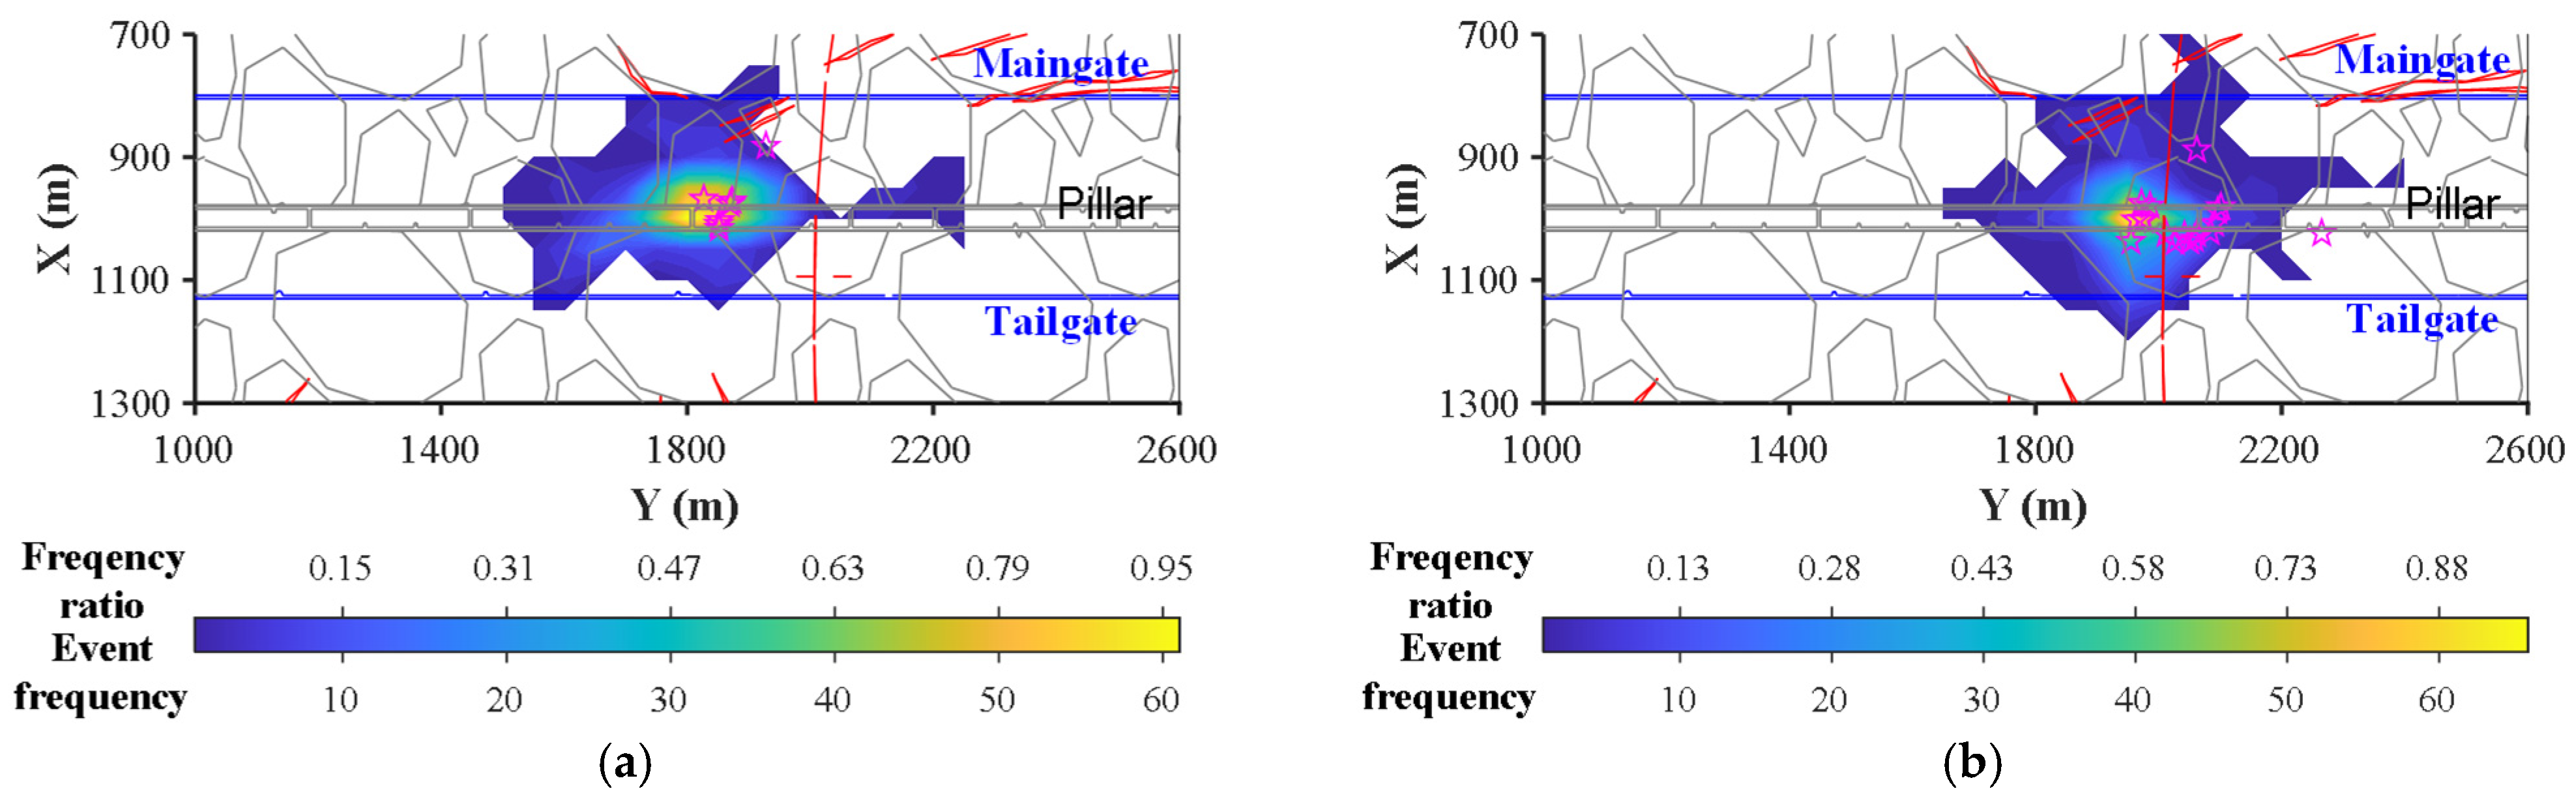
Figure 8 shows the distribution of seismic frequency and its normalised value (hereafter referred to as
) in LW22103 for the periods from 19 April to 2 May 2024, and from 3 May to 16 May 2024. Compared with the NPCE results, the regions with high seismic frequency are more concentrated. In
Figure 8a, the medium-to-high seismic frequency zones are also located in the overlying residual coal pillar area. However, only one imminent strong seismic event has a
value exceeding 0.6, while the
of the other 6 strong events range from 0.3 to 0.5. In
Figure 8b, the medium-to-high seismic frequency zones are still mainly distributed in the residual coal pillar but do not cover the B4 anticline area, resulting in a weak correlation between
and future strong seismic events. Among the 18 strong seismic events, only 4 have relatively high
values of 0.9 and 0.64, respectively, while the remaining
range from 0.01 to 0.59. This indicates that the correlation between seismic events frequency and short-term future strong seismic activity is significantly weaker than that of NPCE.
Figure 9 illustrates the distribution of seismic energy magnitude and its normalised value (hereafter referred to as
) in LW22103 from 19 April to 2 May 2024, and from 3 May to 16 May 2024. As shown in the figure, compared with the NPCE results, the area with high
is considerably larger. In
Figure 9a, zones with high energy magnitude (
> 0.7) remain mainly within the overlying residual coal pillar area, but their coverage length has approached 300 m. Of the 7 strong seismic events in the subsequent period, 4 occur in zones with
> 0.7 and 2 in zones with 0.5 <
< 0.7. Similarly, in
Figure 9b, zones with high energy magnitude extensively cover the intersection area of the overlying residual coal pillar and the B4 anticline. Of the 18 strong seismic events in the subsequent period, 7 occur in zones with
> 0.7, 6 in zones with 0.5 <
< 0.7, and 5 in zones with <0.5. These results indicate that the energy magnitude distribution in LW22103 shows a strong positive correlation with imminent strong events in the short term. However, the excessively large area of high-value zones may reduce pre-warning efficiency.
To quantitatively compare the performance of NPCE, seismic event frequency, and energy magnitude in predicting high-energy events, the confusion matrix method [
35] was used to analyse the precision
P, recall rate
R, and
F-score of the three normalised indicators across different pre-warning thresholds. In this research, the precision
P is defined as the ratio of the number of grids with strong seismic events that exceed the pre-warning indicator threshold to the total number of grids that exceed the relative pre-warning indicator threshold:
The recall rate
R is defined as the ratio of the number of strong seismic events exceeding the relative pre-warning parameter threshold to the total number of such events:
P reflects the pre-warning efficiency of each indicator for strong seismic events. A higher P indicates a smaller pre-warning area and thus higher pre-warning efficiency. R characterises the pre-warning accuracy of each indicator for strong seismic events, and a higher R corresponds to greater pre-warning accuracy.
Given that
P and
R are mutually constrained, the
F-Score was used to assess pre-warning performance:
where
β is a constant representing the relative importance of precision
P and recall rate
R. Since
P and
R are equally important for seismic hazards early warning,
β = 1.
To ensure a robust statistical basis for early-warning performance evaluation, the grid size was set to 50 m × 50 m, consistent with the spatial resolution of seismic location error analysis. The warning area was defined as the entire longwall panel. A seismic event was associated with a grid if its epicentre fell within the grid boundary. True positives (TP) were defined as grids exceeding the warning threshold that contained at least one subsequent high-energy event (>5 kJ). False positives (FP) were grids exceeding the threshold without subsequent high-energy events. False negatives (FN) were grids containing high-energy events that did not exceed the threshold. True negatives (TN) were grids without high-energy events and below the threshold.
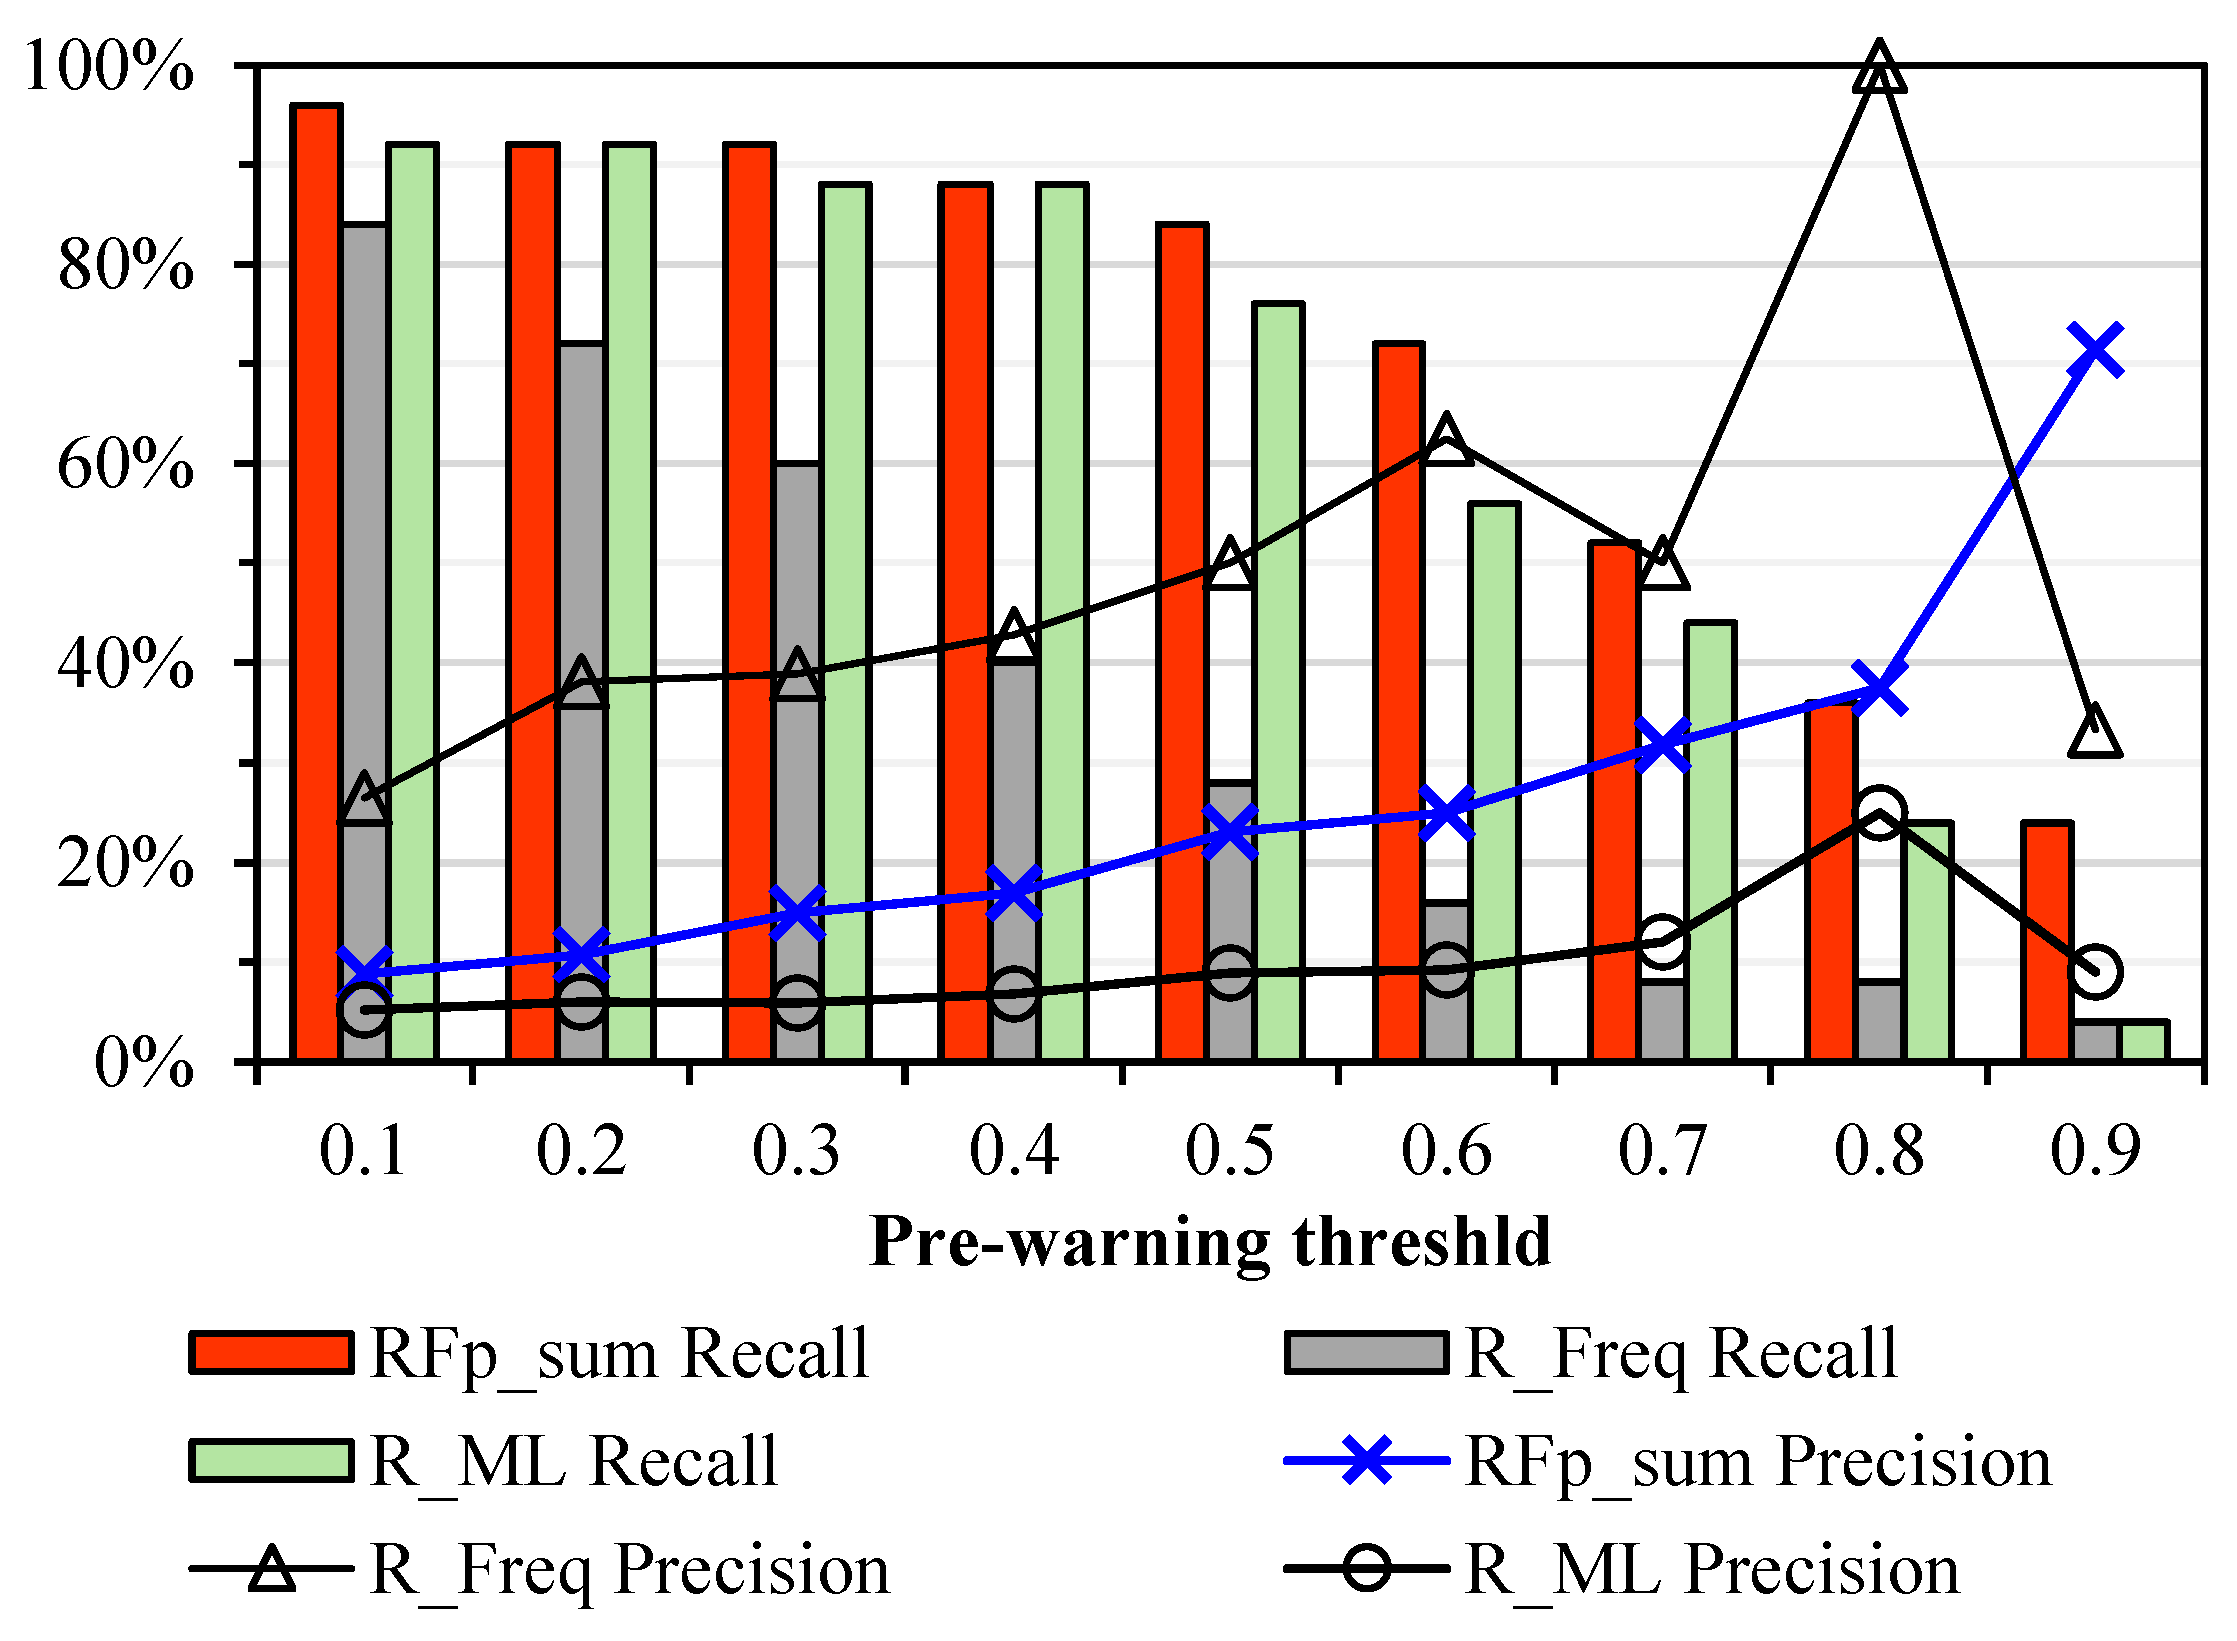
Figure 10 shows the pre-warning precision and recall rates of the normalised NPCE, seismic event frequency, and energy magnitude for strong seismic events under different pre-warning thresholds. In terms of recall rate, the
R-values of all three indicators gradually decrease as the pre-warning threshold increases. The
R-value of
is consistently higher than those of
and
across all pre-warning thresholds, and this advantage of
becomes increasingly pronounced with higher thresholds. This indicates that NPCE can significantly improve the accuracy of predicting strong seismic events compared to the two conventional indicators. In terms of precision rate, the
p-value of
increases gradually as the pre-warning threshold rises. For thresholds from 0.1 to 0.8, the
p-value of
is higher than that of
but lower than that of
. At a threshold of 0.9, however, the
p-value of
peaks at 0.71, making it the highest among the three indicators. Meanwhile, the
p-values of
and
drop sharply, falling to 0.33 and 0.09, respectively. These results demonstrate a strong positive correlation between NPCE and the probability of strong seismic event occurrence, with its high recall rate a prominent advantage. Although the event frequency boasts a high precision rate, its low recall rate leads to a significant increase in missed alarms. Conversely, the poor precision rate of energy magnitude makes it prone to generating a high number of false alarms.
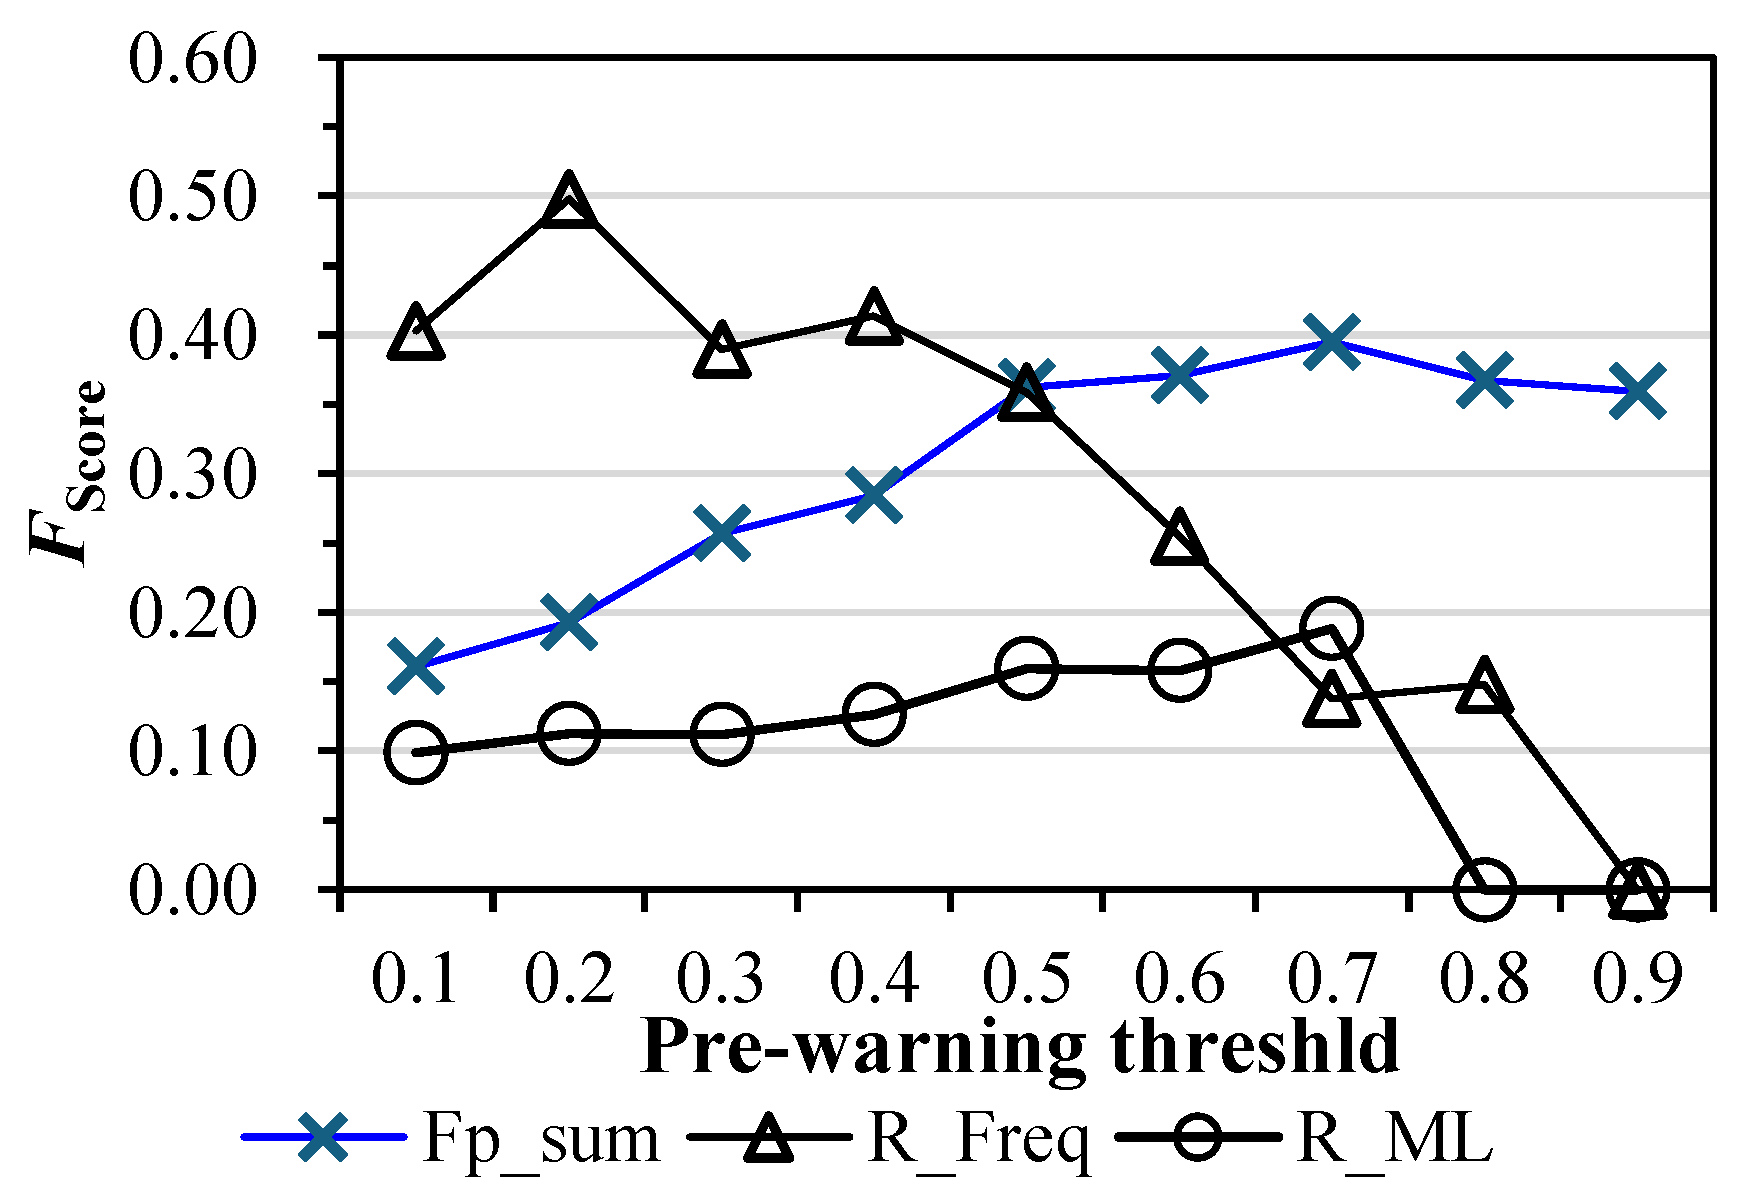
Figure 11 shows the F-score of the three normalised pre-warning indicators for strong seismic events across different pre-warning thresholds, calculated using Equation (12). At low warning thresholds (0.1–0.5), NPCE exhibits inferior overall performance compared with seismic frequency, driven by three key mechanisms. First, weak differentiation of fracture connectivity: low thresholds include nearly all micro-seismic events, most of which correspond to isolated, non-connected microcracks. NPCE is designed to quantify connected fracture networks, so it cannot effectively distinguish between trivial, scattered micro-events and early-stage connected fractures at low thresholds, leading to high false-positive rates. Second, amplified interference from location errors: at low thresholds, the probabilistic clustering calculation in NPCE is highly sensitive to minor deviations within error ellipses, which artificially inflate potential clustering probabilities for isolated events and reduce the reliability of hazard differentiation. Third, over-sensitivity to low-energy noise: NPCE counts potential clustered events regardless of event energy, so low-energy, non-hazardous micro-events dominate the index value at low thresholds, masking the true signal of hazard accumulation.
Quantitative comparison across the low-threshold range (0.1–0.5) confirms this performance gap. As shown in
Figure 10 and
Figure 11, at a threshold of 0.3, the F-score for seismic frequency reaches 0.39, whereas NPCE achieves only 0.26. At a threshold of 0.5, seismic frequency still maintains an F-score of 0.36, whereas NPCE rises to 0.36 (equal performance). In contrast, energy magnitude performs poorly throughout the low-threshold range, with an F-score below 0.12 at all thresholds ≤0.5, due to excessive false alarms from scattered low-energy events. These results confirm that seismic frequency is more suitable for preliminary hazard screening at low thresholds.
However, when the pre-warning threshold exceeds 0.5, the comprehensive pre-warning capability of remains consistently high, with its maximum F-score reaching 0.39. In contrast, the comprehensive pre-warning performance of drops sharply when the pre-warning threshold exceeds 0.5: its F-score is approximately 0.15 at a threshold of 0.8 and decreases to nearly 0 at a threshold of 0.9. This indicates that the pre-warning capability of is significantly weakened as the pre-warning threshold increases. Accordingly, the comprehensive pre-warning performance of NPCE is significantly superior to that of event frequency and energy magnitude at high pre-warning thresholds, and it better balances recall and precision for early warning of high-energy events. Meanwhile, since NPCE already achieves the maximum F-score of 0.39 at a pre-warning threshold of 0.7, this value can be set as the criterion for identifying seismic hazards.