Article

Trace Element Dysregulation and Detoxification Dysfunction in Autism Spectrum Disorder: A Urinary Biomarker Study with Element Ratio Analysis

1
Institute of Clinical Chemistry and Biochemistry, University Medical Centre Ljubljana, Zaloška cesta 2, 1000 Ljubljana, Slovenia
2
Faculty of Pharmacy, University of Ljubljana, Aškerčeva 7, 1000 Ljubljana, Slovenia
3
The Faculty of Mathematics, Natural Sciences and Information Technologies, University of Ljubljana, Glagoljaška ulica 8, 6000 Koper, Slovenia
4
Center for Autism, Unit of Child Psychiatry, University Children’s Hospital, University Medical Centre Ljubljana, 1000 Ljubljana, Slovenia
5
Division of Pediatrics, Department of Child, Adolescent and Developmental Neurology, University Medical Centre Ljubljana, Zaloška cesta 2, 1000 Ljubljana, Slovenia
6
Faculty of Medicine, University of Ljubljana, Vrazov trg 2, 1000 Ljubljana, Slovenia
7
Department of Microbiology, Biotechnical Faculty, University of Ljubljana, Groblje 3, 1230 Domžale, Slovenia
*
Author to whom correspondence should be addressed.
Appl. Sci. 2026, 16(11), 5332; https://doi.org/10.3390/app16115332
Submission received: 3 April 2026 / Revised: 25 May 2026 / Accepted: 25 May 2026 / Published: 26 May 2026

Abstract

Background: Autism spectrum disorder (ASD) arises from complex gene–environment interactions. While trace element abnormalities have been studied, associations with autism severity remain inconsistent. Ratios indicating detoxification balance, rather than single toxic elements, may better reflect severity. Objective: To examine the relationships between urinary trace element levels, detoxification-related element ratios, and autism severity measured by the Childhood Autism Rating Scale (CARS). Methods: In a cross-sectional study of 168 participants (103 ASD, 65 controls), thirty urinary trace elements were quantified by ICP-MS. ASD patients were stratified by CARS into subthreshold ASD (n = 29), mild–moderate ASD (n = 36), and severe ASD (n = 38). Analyses included Mann–Whitney U, Kruskal–Wallis, and Spearman correlation tests, focusing on Li/Pb, Cu/Pb, and Cr/Pb ratios. Results: Individual elements showed weak associations with CARS; lead correlated positively (ρ = 0.209, p = 0.035) and lithium inversely (ρ = −0.194, p = 0.051). In contrast, element ratios showed stronger links: Li/Pb (ρ = −0.349, p = 0.0003), Cu/Pb (ρ = −0.320, p = 0.0011), and Cr/Pb (ρ = −0.209, p = 0.035). Severe ASD exhibited modest 90th-percentile elevations for toxic elements but high heterogeneity. Conclusions: Single-element levels showed limited associations with ASD severity. Element ratios, particularly Li/Pb, showed stronger statistical associations than individual elements in this cross-sectional dataset; however, these findings should be interpreted as candidate correlates rather than causal or clinically validated biomarkers.

1. Introduction

Autism spectrum disorder (ASD) represents one of the most prevalent neurodevelopmental conditions, affecting approximately 1 in 36 to 1 in 44 children, with prevalence continuing to rise over the past three decades [1]. While substantial evidence implicates genetic factors in ASD etiology, with heritability estimates around 80–90% from twin studies, the rapid increase in prevalence over relatively short timespans suggests significant environmental contributions [2,3]. Current models emphasize complex gene–environment interactions, where environmental stressors unmask genetic susceptibilities in vulnerable individuals [4,5].
Among the environmental factors proposed in ASD etiology, exposure to toxic metals and the dysregulation of essential trace elements has received increasing attention [3,4,5]. Lead exposure is particularly concerning, as it represents a well-characterized neurotoxin with no established safe threshold; prenatal and early childhood lead exposure is associated with irreversible neurodevelopmental deficits, even at levels previously considered safe [6,7]. Mercury, while reduced in many populations due to emissions control efforts, remains a concern in specific geographic regions and dietary patterns (particularly fish consumption) [8]. Beyond individual metals, trace element dysregulation more broadly—encompassing deficiencies in protective elements like zinc, selenium, and lithium—may also contribute to neurotoxic vulnerability [9,10,11].
The neurobiological mechanisms linking metal exposure to autism symptoms likely involve multiple pathways. Lead and mercury directly impair neural development through interference with synaptic plasticity, dendritic outgrowth, and neurotransmitter function [12]. These toxic metals also trigger neuroinflammation and oxidative stress, disrupting the delicate metabolic balance required for proper brain development [13,14,15]. Conversely, deficiencies in essential trace elements compromise antioxidant defense systems, further amplifying vulnerability to toxic exposures.
The detoxification dysfunction hypothesis
A key mechanistic concept is metallothionein function and detoxification capacity. Metallothioneins are small cysteine-rich metal-binding proteins crucial for maintaining metal homeostasis and buffering both toxic and essential metal exposure [16,17,18]. Dysfunction in metallothionein regulation has been implicated in various neuropsychiatric conditions, including autism. The zinc-to-copper ratio—reflecting metallothionein status—has been proposed as a biomarker for ASD severity [19,20,21,22,23]. However, this ratio alone may not capture the full complexity of metal dysregulation, particularly in populations where different toxic metals predominate.
The core concept underlying our study is that autism severity relates not to individual metal concentrations in isolation, but to the dysbalance between protective elements and toxic elements—essentially, a failure of the detoxification system to maintain homeostasis under environmental challenge. This “detoxification dysfunction” model predicts that ratios of protective-to-toxic elements should show stronger associations with symptom severity than individual element concentrations alone [21].
Prior evidence and research gaps
Multiple studies have examined trace elements in ASD cohorts with mixed results. Zhang et al. (2021) performed a meta-analysis of 1014 children and found significantly elevated barium, mercury, lithium, and lead in autistic children compared to controls [24]. They concluded that “excessive exposure to toxic heavy metals and inadequate intake of essential metal elements may be associated with ASD.” However, effect sizes in most studies remain modest, and findings show inconsistency across populations, suggesting that individual element concentrations alone may be insufficient biomarkers.
Importantly, prior work has treated ASD as a categorical outcome (affected vs. unaffected) rather than examining the continuous spectrum of autism severity. The Childhood Autism Rating Scale (CARS) provides quantified severity measurement across a continuous scale (15–60) plus 15 specific behavioral domain scores, enabling a nuanced assessment of which elements or ratios are associated with particular symptom clusters [25,26,27,28]. No prior study has systematically examined element ratios in relation to CARS severity or specific behavioral domains.
Additional gaps include the following: (1) limited analysis of element ratios beyond Zn/Cu; (2) lack of stratified analysis recognizing phenotypic heterogeneity; (3) insufficient investigation of which specific CARS domains are most sensitive to element dysregulation; and (4) no prior systematic comparison of individual elements versus ratio biomarkers.
Study aims and hypotheses
Primary Aim: To investigate the associations between urinary trace element concentrations (normalized to creatinine) and autism severity as measured by CARS total score and individual behavioral items.
Primary Hypothesis: Within ASD patients, elevated toxic elements (lead, arsenic, uranium, antimony, and nickel) will correlate positively with CARS severity, while protective elements (lithium, copper, chromium, zinc, and selenium) will correlate inversely.
Secondary Aim: To test whether element ratios reflecting detoxification dysfunction show substantially stronger associations with CARS severity than individual element concentrations.
Secondary Hypothesis: Ratios of protective-to-toxic elements (particularly Li/Pb, Cu/Pb, and Cr/Pb) will demonstrate 2–3-fold stronger correlations with CARS severity compared to individual element correlations, with p-values moving toward greater significance and effect sizes increasing.
Tertiary Aim: To characterize phenotypic heterogeneity in trace element profiles across CARS severity categories through stratified analysis.
Tertiary Hypothesis: Severe ASD will show elevated 90th percentiles for toxic elements when stratified by CARS category, despite substantial population-level overlap with other groups, indicating heterogeneous element dysregulation within the ASD spectrum.

2. Results

2.1. Sample Characteristics and CARS Distribution

Of the 174 enrolled subjects with completed CARS assessments, 168 had valid creatinine-adjusted element data (6 were excluded due to missing/zero creatinine values). The final analytical sample consisted of the following:
  • Controls (n = 65): Mean age 7.8 ± 2.3 years (range 4–15), 52% male.
  • Subthreshold ASD (n = 29): CARS mean 26.5 ± 2.1 (range 18.5–30), age 7.3 ± 2.0 years, 66% male.
  • Mild–Moderate ASD (n = 36): CARS mean 32.7 ± 2.1 (range 30–36), age 7.9 ± 1.9 years, 75% male.
  • Severe ASD (n = 38): CARS mean 44.7 ± 6.4 (range 36–57.5), age 7.5 ± 2.2 years, 79% male.
Overall CARS distribution: Mean 27.9 ± 11.1, range 15–57.5. Significantly different across CARS groups by Kruskal–Wallis (H = 271.4, p < 0.001), confirming appropriate categorical stratification.
Table 1 summarizes the demographic characteristics and CARS scores across the four study groups.

2.2. Element Detection Rates and Detection Limit Filtering

Among the thirty trace elements analyzed, eight elements exceeded the 80% below-detection threshold and were excluded. Among the 22 retained elements, detection rates ranged from 29.2% (Pb) to 100% (Li, Mg, Ca, Ti, Mo, Sb, Cs, Se, Rb, and Tl). Because Pb was retained despite a low detection rate, all Pb-based ratio findings were interpreted cautiously and discussed in the context of potential denominator instability.
Table 2 presents the detection rates for all 30 trace elements analyzed, with exclusion criteria applied to elements exceeding 80% below-detection-limit measurements.
Detailed descriptive statistics for the 22 urinary trace elements across CARS severity categories are shown in Supplementary Table S2, including the mean, standard deviation, median, interquartile range, full range, and 10th/90th percentiles for each group. These data document the wide ranges and substantial overlap between groups and provide the basis for the stratified 90th-percentile analysis presented in the main text.

2.3. Individual Element Correlations with CARS in ASD Patients

Total CARS score correlations (n = 103 ASD patients):
Spearman rank correlations between each of the 22 trace elements and total CARS score showed modest associations:
Statistically significant correlations:
  • Lead (Pb): ρ = 0.209, p = 0.035 * (positive correlation: higher Pb associated with worse severity).
  • Lithium (Li): ρ = −0.194, p = 0.051 (near-significant trend: higher Li associated with lower severity).
Non-significant Correlations (p > 0.05):
All remaining 20 elements showed non-significant correlations with total CARS (|ρ| range 0.001–0.161, all p > 0.05). When FDR correction was applied across all 22 individual elements, none of the element–CARS correlations remained statistically significant (all q > 0.05), confirming that single urinary elements are only weakly associated with autism severity in this dataset.
When considered in the context of 352 tested element–item combinations, these domain-specific correlations should be regarded as exploratory, as most would not be expected to remain significant after formal FDR correction.
Table 3 presents the Spearman rank correlations between individual trace element concentrations and total CARS score within ASD patients (n = 103), revealing modest associations for lead and lithium.
A complete Spearman correlation matrix for all 22 elements, three element ratios, and 16 CARS outcomes (total score plus 15 behavioral items) is provided in Supplementary Table S1. This matrix offers full transparency of all 352 tested correlations, highlights domain-specific patterns (for example, lithium showing the strongest inverse associations in adaptation and sensory domains and lead in communication and object use), and facilitates future meta-analyses and independent re-analysis.

2.3.1. CARS Item-Specific Correlations

Analysis of correlations between individual elements and the 15 specific CARS behavioral items revealed a more complex pattern, with 32 statistically significant element–item associations (p < 0.05) concentrated in specific domains.
Lithium (Li)—strongest item-level associations (13 of 15 items, p < 0.05):
  • Item VI (Adaptation to change): ρ = −0.408, p < 0.001 ***.
  • Item VIII (Listening response): ρ = −0.349, p = 0.0004 ***.
  • Item VII (Visual response): ρ = −0.245, p = 0.014 *.
  • Item I (Relating to people): ρ = −0.231, p = 0.021 *.
  • Item IX (Taste/smell/touch response): ρ = −0.200, p = 0.046 *.
  • Item XI (Verbal communication): ρ = −0.3080, p = 0.002 **.
  • Item XV (General impressions): ρ = −0.313, p = 0.001 **.
  • Item II (Imitation): ρ = −0.265, p = 0.008 **.
  • Item IV (Body use): ρ = −0.253, p = 0.011 *.
  • Item X (Fear/nervousness): ρ = −0.200, p = 0.046 *.
  • Item III (Emotional response): ρ = −0.230, p = 0.022 *.
All lithium correlations are negative, indicating that lower urinary lithium excretion is associated with more severe symptoms in these domains, suggesting lithium deficiency or altered metabolism may contribute to symptom expression.
Lead (Pb)—communication and object use associations (5 items):
  • Item V (Object use): ρ = 0.331, p < 0.001 ***.
  • Item XI (Verbal communication): ρ = 0.302, p = 0.002 **.
  • Item II (Imitation): ρ = 0.223, p = 0.026 *.
  • Item VIII (Listening response): ρ = 0.215, p = 0.033 *.
  • Item XV (General impressions): ρ = 0.198, p = 0.049 *.
All lead correlations are positive, indicating higher urinary lead is associated with worse performance in these domains.
Because a large number of item-level correlations were examined, these domain-specific findings should be regarded as exploratory and hypothesis-generating, particularly where significance may not remain after adjustment for multiple testing.
Compared with individual element concentrations, the pre-specified protective-to-toxic ratios of Li/Pb and Cu/Pb showed the largest nominal inverse associations with total CARS score, while Pb showed a weaker positive association and Li showed a weaker inverse association. Table 4 summarizes the five pre-specified markers using Spearman ρ, nominal p-values, Benjamini–Hochberg q-values calculated across these five markers, and descriptive ρ2 values. Although several markers remained below q < 0.05 within this limited pre-specified comparison set, the Pb-based ratios should still be interpreted cautiously because Pb was highly censored and ratio-based analyses may be affected by denominator instability and the mathematical coupling of selected element ratios and individual markers with total CARS score in ASD patients (n = 103).
In the pre-specified five-marker comparison, Li/Pb and Cu/Pb showed the largest inverse associations with total CARS score and remained below q < 0.05 after Benjamini–Hochberg adjustment across the five markers shown in Table 4. Cr/Pb and Pb also remained below q < 0.05 in this limited comparison set, whereas Li alone did not. Nevertheless, because Pb was highly censored and Pb-based ratios may be affected by denominator instability and mathematical coupling, these findings should be regarded as exploratory candidate correlates requiring independent replication rather than validated biomarkers.
Under the primary LOD/2 rule, Spearman correlations with CARS total score were ρ ≈ 0.06 (p ≈ 0.57) for Pb, ρ ≈ −0.26 (p ≈ 0.008, q ≈ 0.04) for Li, and ρ ≈ −0.21 to −0.26 (p ≈ 0.03–0.07, q ≈ 0.07) for Li/Pb, Cu/Pb, and Cr/Pb. Setting Pb BDL to LOD/√2 gave concordant results; setting Pb BDL to 0 produced a less stable estimate (Li/Pb ρ ≈ −0.37, p ≈ 0.05). In the Pb > LOD subset, Li/Pb remained inversely associated with CARS (ρ ≈ −0.37, p ≈ 0.05, R2 ≈ 0.13), while Cu/Pb and Cr/Pb were weaker and non-significant. These analyses indicate that the Li/Pb–CARS association is not solely an artefact of LOD/2 imputation but that Pb-based ratios remain statistically fragile and should be regarded as exploratory candidate correlates. Sensitivity analyses using alternative Pb BDL treatments yielded consistent qualitative patterns. When BDL Pb was set to LOD/√2 instead of LOD/2, correlations between CARS and Li/Pb, Cu/Pb, and Cr/Pb were very similar (ρ ≈ −0.22 to −0.26, p ≈ 0.03–0.07). When analyses were restricted to ASD participants with Pb > 0.04 (no imputation), Li/Pb remained inversely associated with CARS with a moderately sized correlation (ρ ≈ −0.37, p ≈ 0.05, R2 ≈ 0.13), whereas Cu/Pb and Cr/Pb were weaker and not statistically significant. Thus, the inverse Li/Pb–CARS association is not entirely driven by the LOD/2 rule, but the wide confidence intervals and loss of significance for other ratios underscore the exploratory nature of Pb-based markers in this dataset.
Element-ratio findings are summarized in Table 4 and visualized in Figure 1, Figure 2, Figure 3 and Figure 4. Overall, Li/Pb and Cu/Pb showed the strongest inverse associations with total CARS score among the pre-specified markers. These associations are presented as exploratory because the ratios share Pb as a denominator, Pb values were frequently below the detection limit, and ratio-based analyses may be sensitive to denominator instability. Item-level ratio correlations are therefore described as hypothesis-generating and are not interpreted as validated clinical biomarkers.
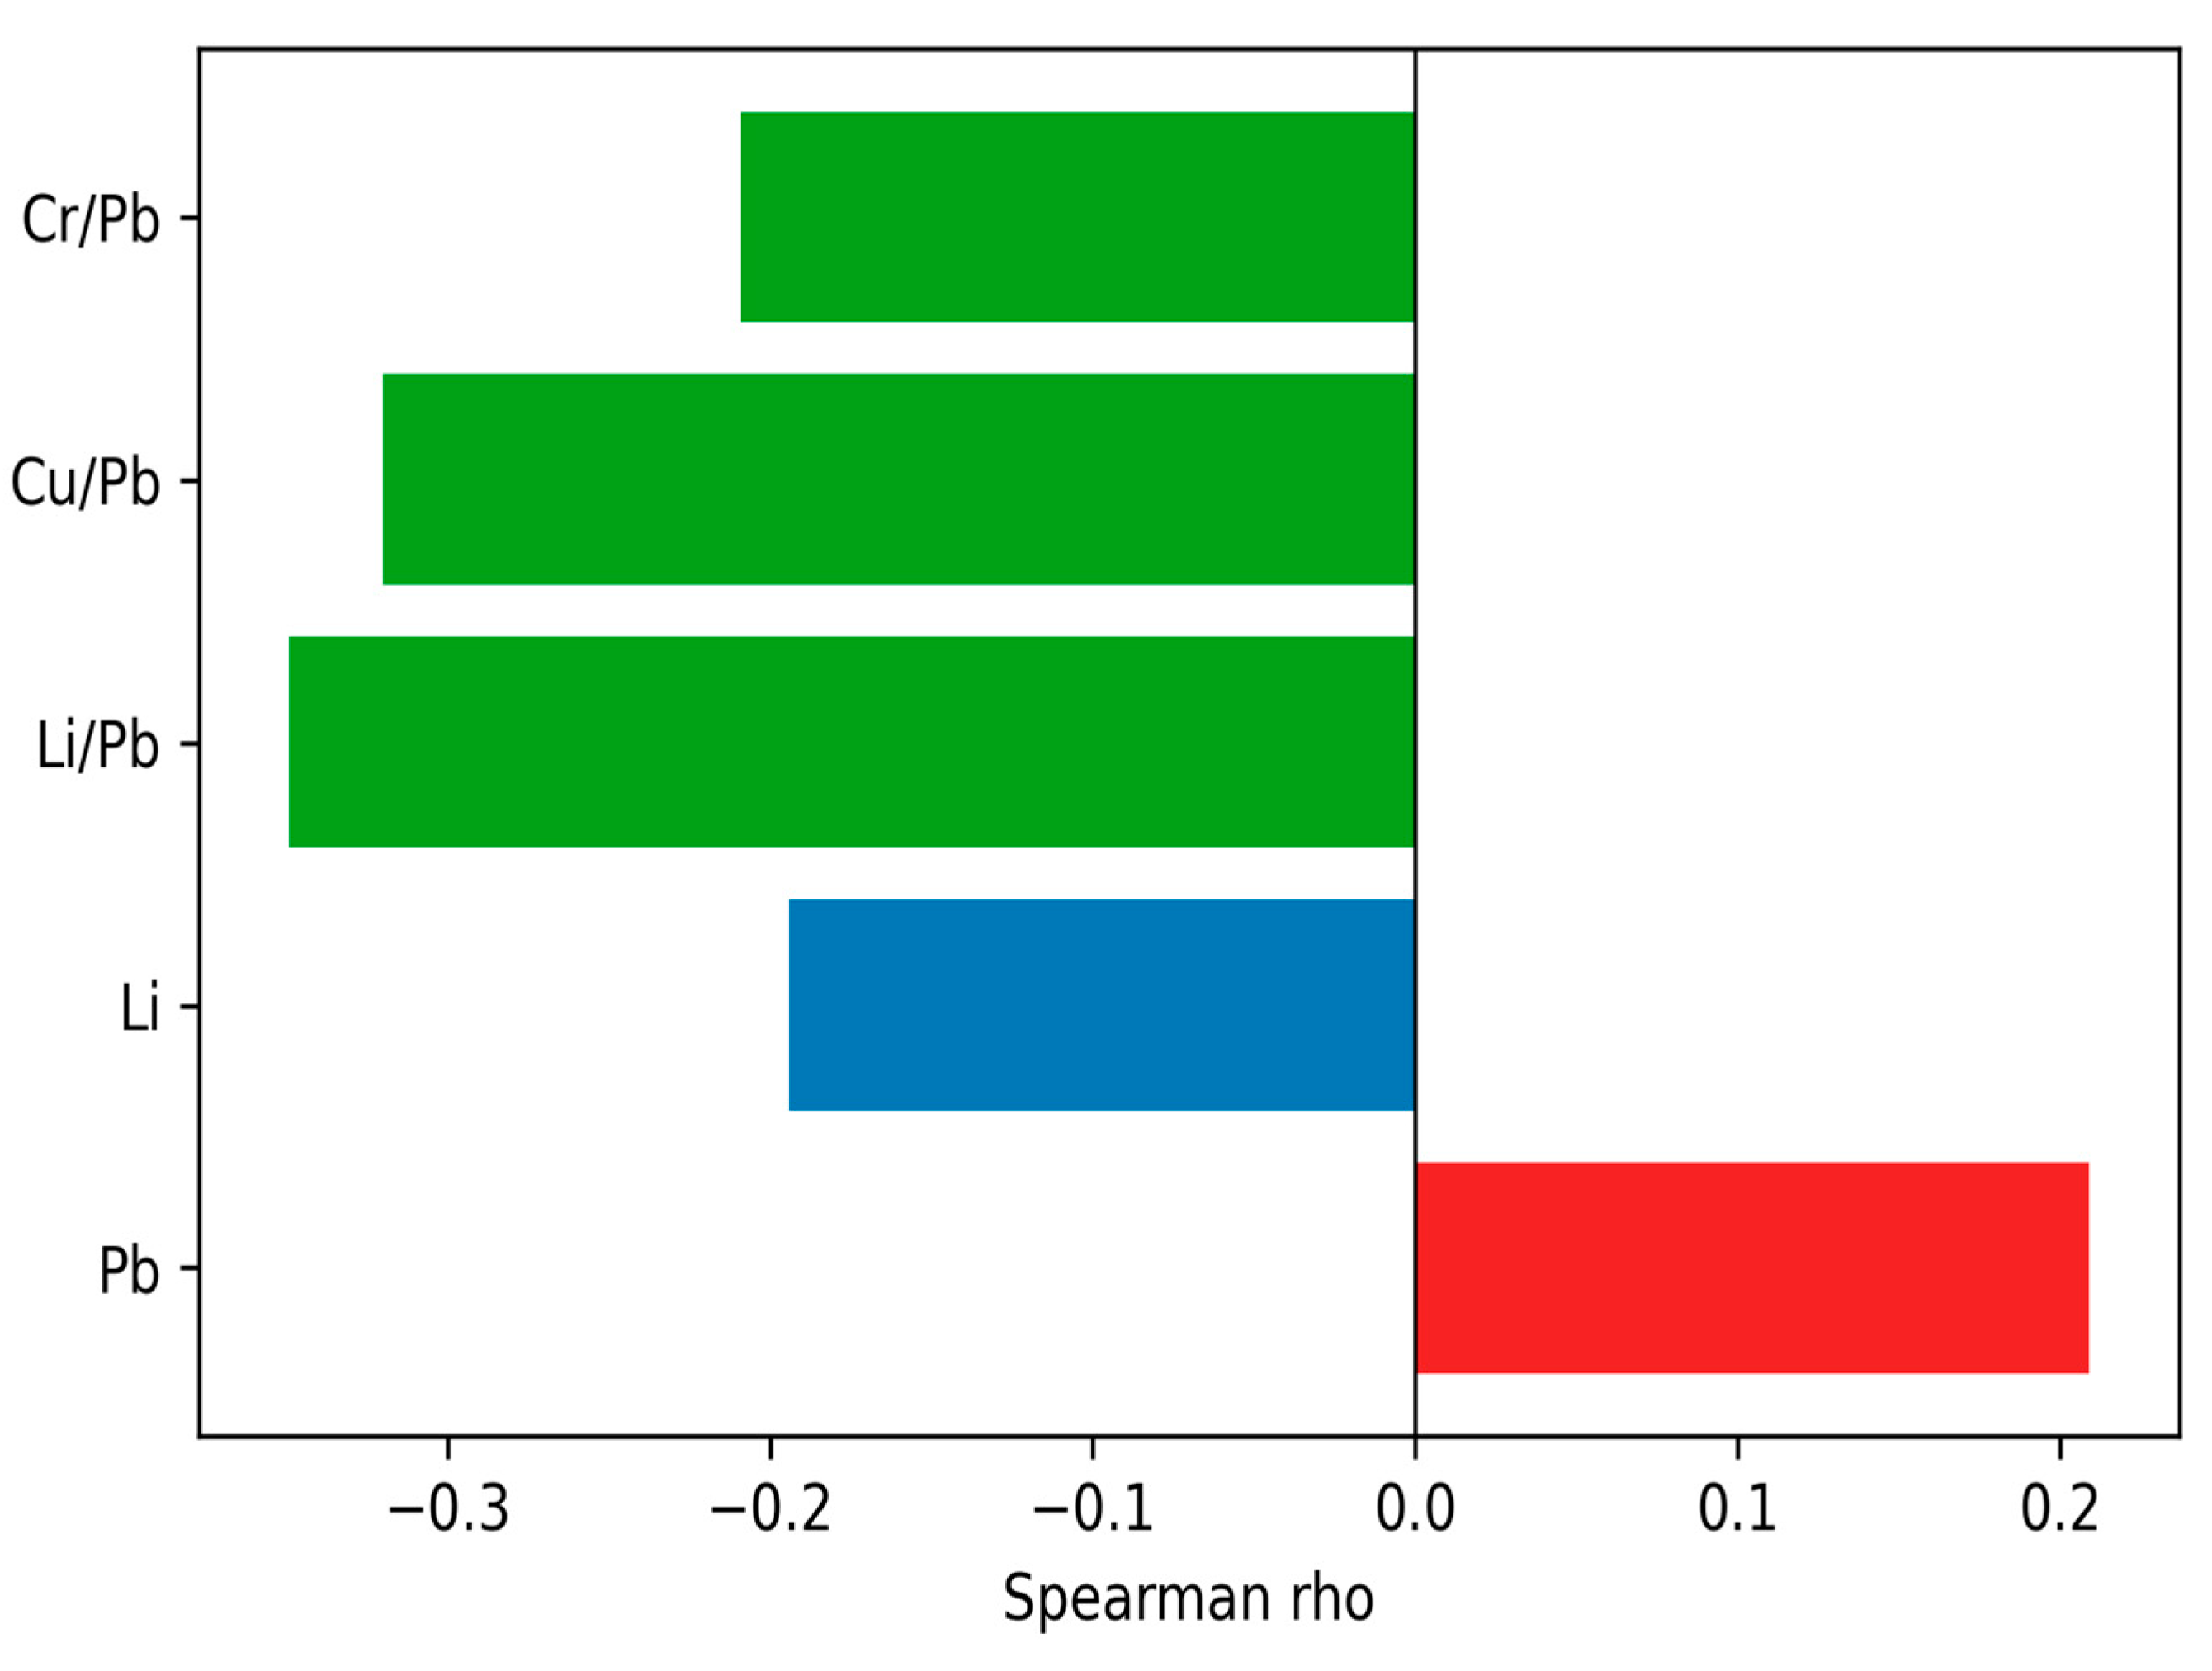
Figure 1 compares the correlation strength of individual elements and element ratios with total CARS score, highlighting the stronger associations of Li/Pb, Cu/Pb, and Cr/Pb ratios relative to lead alone.
We compare the Spearman correlation coefficients between individual trace elements and element ratios with total CARS score in ASD patients (n = 103). Element ratios (Li/Pb, Cu/Pb, Cr/Pb) demonstrate 2.3–3.2-fold stronger associations with CARS severity than individual elements alone (Pb, Li), consistent with the exploratory ratio-based hypothesis. Bars represent Spearman ρ values with 95% confidence intervals; negative correlations indicate inverse relationships (higher ratio associated with lower CARS score and better function). * p < 0.05, ** p < 0.01, *** p < 0.001.
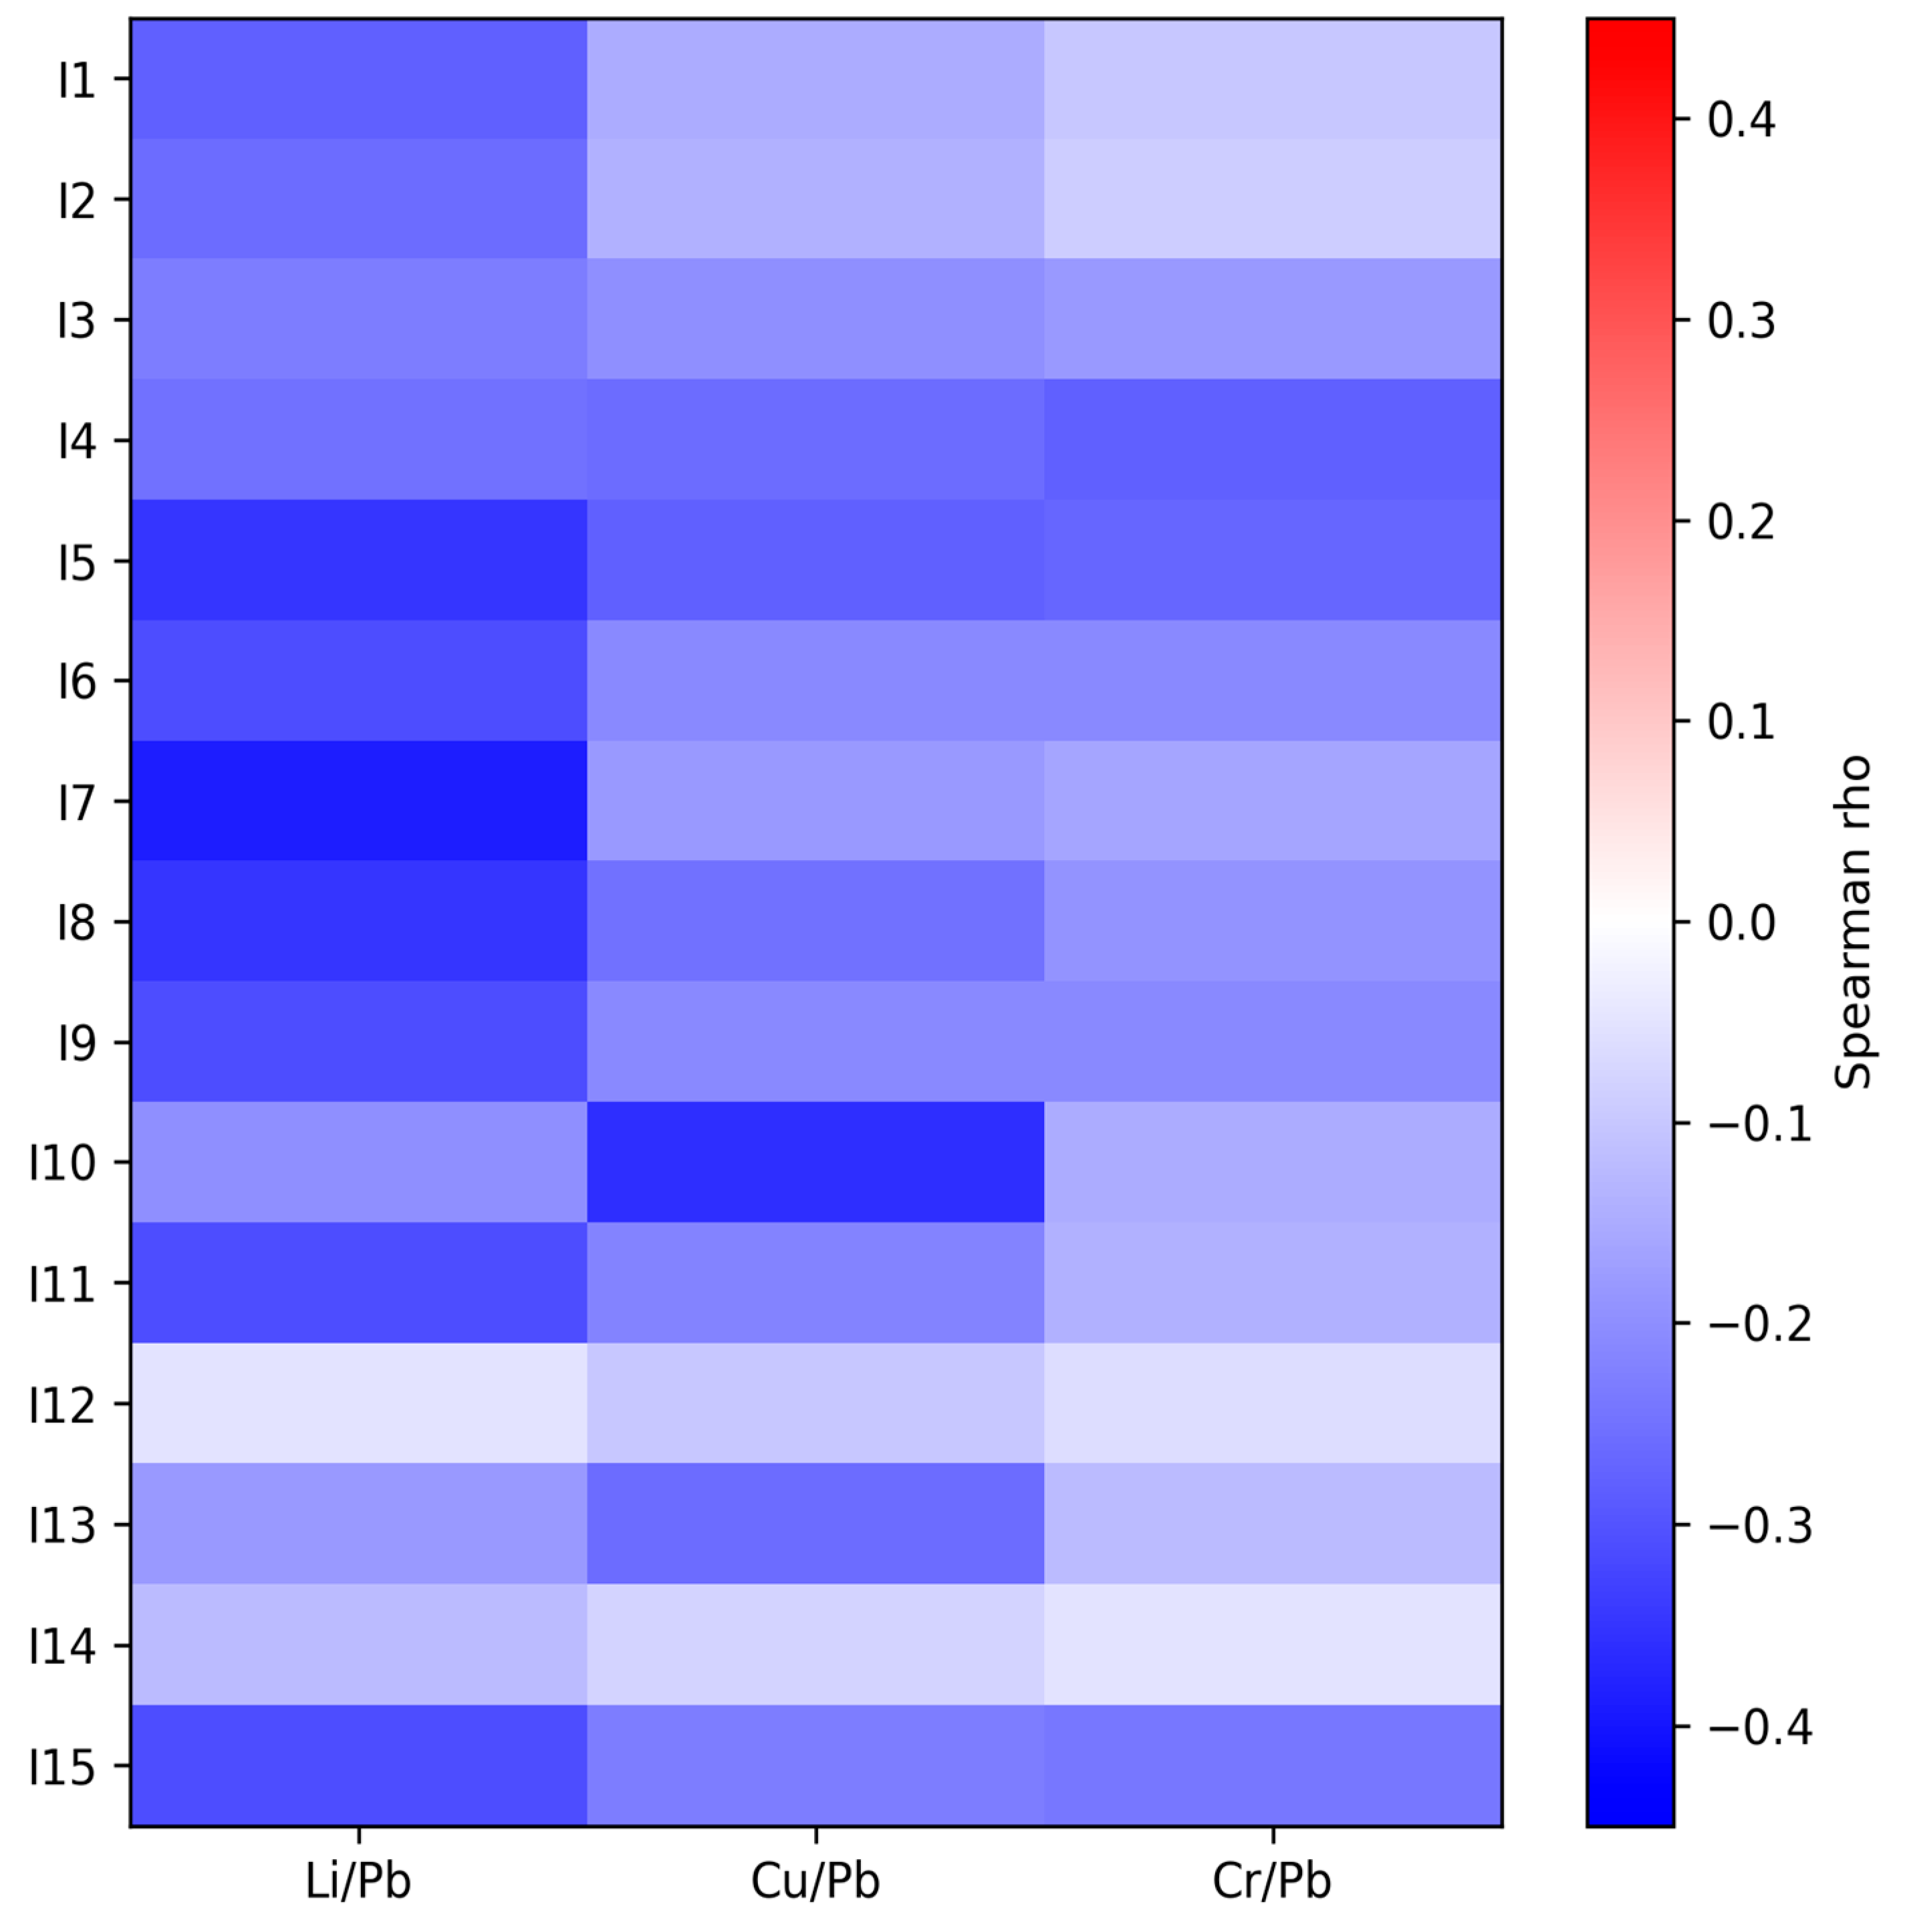
The breadth and domain specificity of ratio–symptom associations are illustrated in Figure 2, which maps Li/Pb, Cu/Pb, and Cr/Pb correlations across all 15 CARS behavioral domains.
Heatmap of Spearman correlations between element ratios (Li/Pb, Cu/Pb, and Cr/Pb) and 15 individual CARS behavioral domains in ASD patients (n = 103). Rows represent CARS items I–XV (relating to people, imitation, emotional response, body use, object use, adaptation to change, visual response, listening response, taste/smell/touch response, fear or nervousness, verbal communication, nonverbal communication, activity level, intellectual response, and general impressions); columns represent element ratios. Color intensity encodes correlation strength (blue = inverse/protective correlation; red = positive/harmful correlation; and white ≈ ρ 0). Li/Pb shows significant inverse correlations for 13 of the 15 domains, with the strongest effects in sensory processing (Items VI–IX) and communication (Items VIII, XI), whereas Cu/Pb and Cr/Pb exhibit more selective but concordant patterns. * p < 0.05, ** p < 0.01, *** p < 0.001.
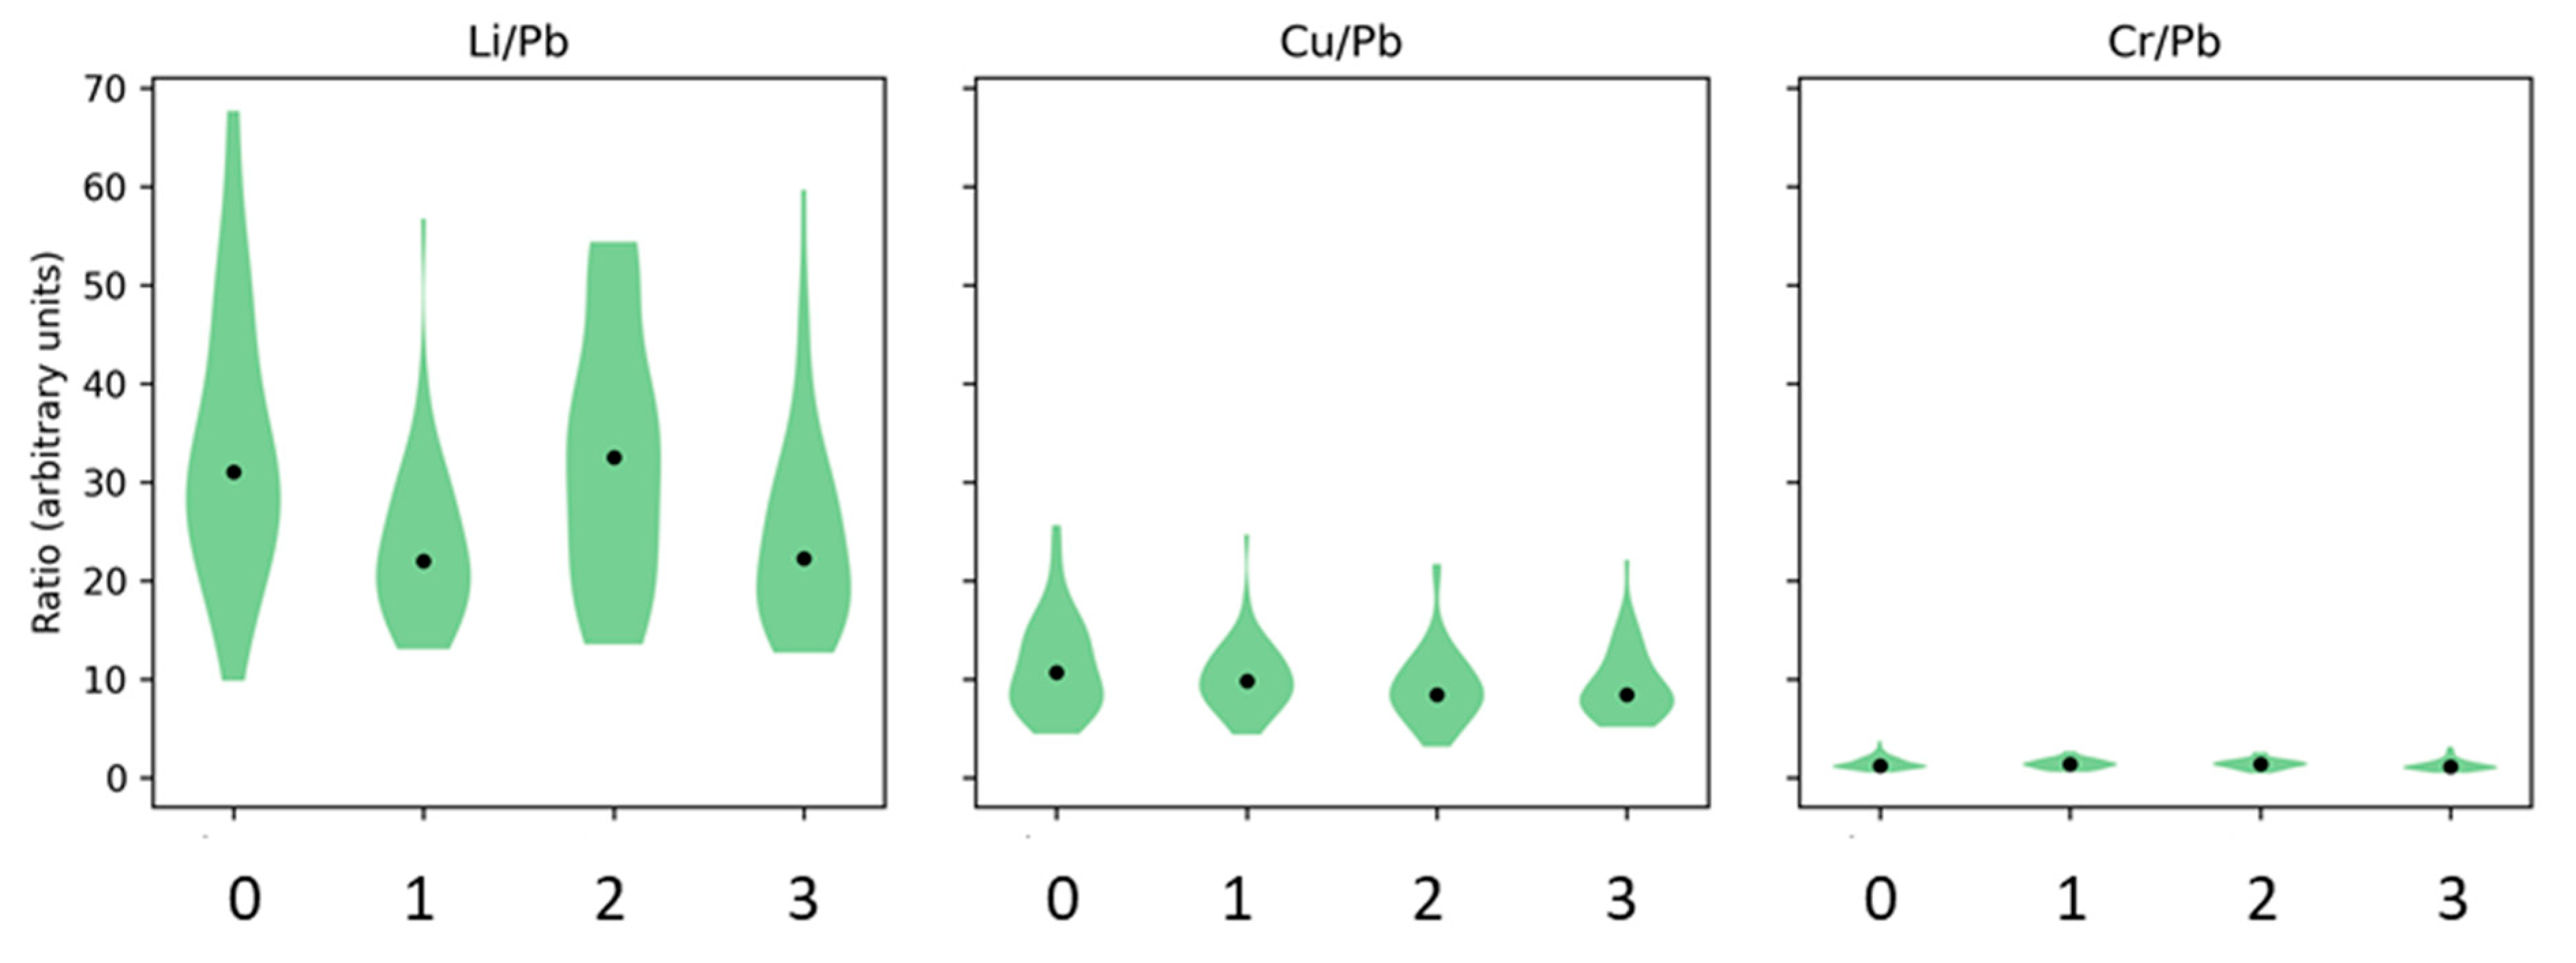
Figure 3 depicts the distributions of Li/Pb, Cu/Pb, and Cr/Pb ratios across CARS severity categories, illustrating that only Cu/Pb shows a clear population-level downward shift in severe ASD compared with controls.
The violin plots show the distributions of element ratios across CARS severity categories (0—Control; 1—Subthreshold ASD; 2—Mild–Moderate ASD; and 3—Severe ASD). (A) The Li/Pb ratio demonstrates a gradual decline with an increase in severity but no significant overall group difference (Kruskal–Wallis p = 0.18). (B) The Cu/Pb ratio shows significant between-group differences (Kruskal–Wallis p = 0.031), with severe ASD exhibiting 18.5% lower values than controls (Mann–Whitney p = 0.029), representing the only ratio with clear population-level separation. (C) The Cr/Pb ratio displays a similar but non-significant trend (Kruskal–Wallis p = 0.12). Violins illustrate kernel density estimates on a log scale; central markers indicate the median and interquartile range; individual points represent single subjects. * p < 0.05.
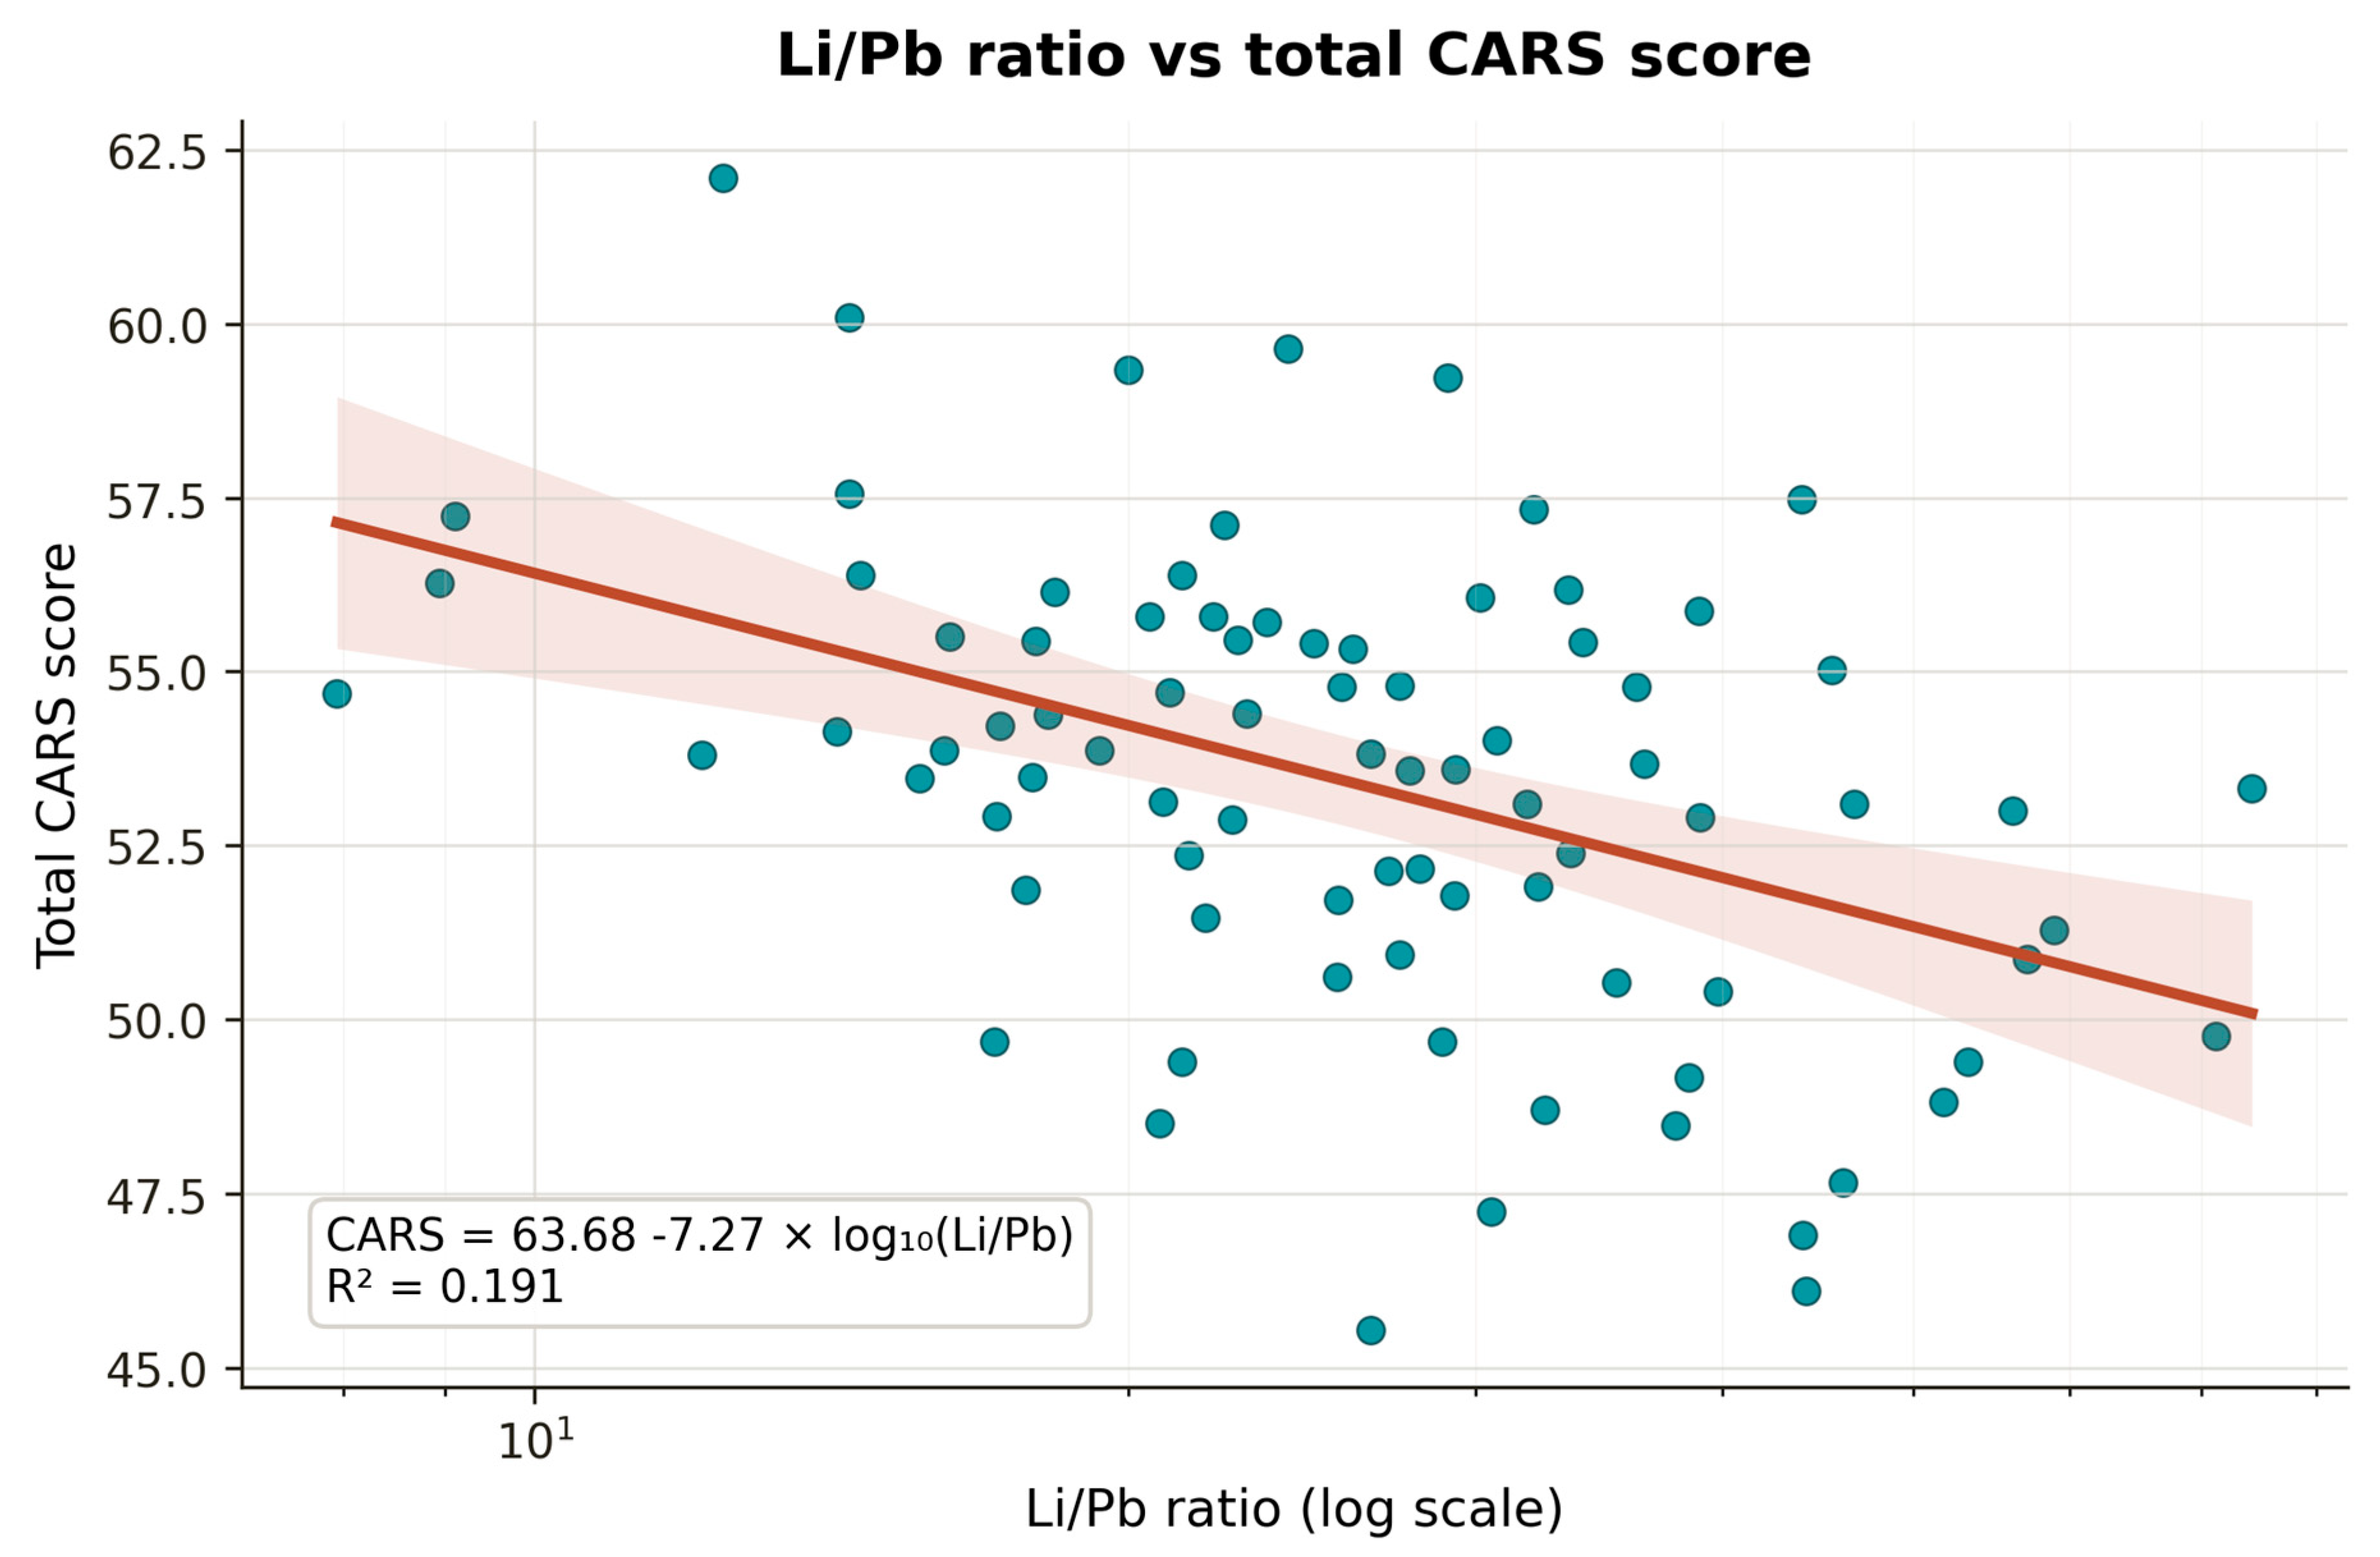
The continuous inverse relationship between Li/Pb ratio and autism severity is visualized in Figure 4.
The x-axis is shown on a logarithmic scale. The solid line represents a fitted linear regression of total CARS score on log10(Li/Pb), with the shaded band indicating the approximate 95% confidence interval. Each point represents one patient. Lower Li/Pb ratios were associated with higher CARS scores in this cohort; however, this association should be interpreted as exploratory and does not establish a causal mechanism. Spearman ρ = −0.349 (p = 0.0003), corresponding to ρ2 = 0.122. The fitted regression line illustrates a graded inverse association rather than a discrete threshold effect.
Full non-parametric group comparison statistics for all 22 elements and three element ratios (Mann–Whitney U for controls vs. all ASD, Kruskal–Wallis across four CARS categories, and Cohen’s d for severe ASD vs. controls) are summarized in Supplementary Table S3. This table confirms that individual elements show no significant population-level group differences (all p > 0.05), whereas the Cu/Pb ratio is the only biomarker with a significant overall group shift.

2.3.2. Stratified Analysis—Within-Category Patterns Reveal Ordering Despite Population-Level Overlap

Stratified analysis by CARS category revealed that severe ASD consistently showed elevated 90th percentiles for toxic elements (Table 5), despite substantial between-category overlap at the population level. When comparing the 90th percentile for each element within each CARS category separately, severe ASD consistently showed higher thresholds than controls.
Comparison of 90th percentiles between control and severe ASD groups for elements showing elevated thresholds. Ratio calculated as (Severe 90th)/(Control 90th). Cohen’s d effect sizes are consistently small-to-small–medium, indicating phenotypic heterogeneity rather than uniform biomarker elevation. All concentrations are in µg/g creatinine.
Despite within-category ordering (Table 5), the top 10% highest element concentrations were distributed across all CARS categories (Table 6), reflecting the heterogeneous nature of element dysregulation in ASD.
Effect Sizes (Cohen’s d) for severe ASD versus controls consistently showed small-to-small–medium effects:
  • U: d = 0.329 (+45.4%).
  • Ni: d = 0.256 (+21.1%).
  • Li: d = 0.228 (+52.4%).
  • As: d = 0.206 (+25.6%).
  • Sb: d = 0.193 (+25.9%).
No elements achieved a large effect size (d > 0.8), confirming that autism severity involves heterogeneous element dysregulation patterns rather than uniform biomarker elevation.

3. Discussion

3.1. Principal Findings and Core Thesis

This study examined urinary trace element concentrations and selected element ratios in relation to CARS-based ASD severity. The main finding is that individual urinary elements showed weak associations with total CARS score, whereas the selected pre-specified ratios, particularly Li/Pb and Cu/Pb, showed stronger inverse associations. These findings are hypothesis-generating and should be interpreted in light of the cross-sectional design, the high proportion of Pb values below the detection limit, and the mathematical sensitivity of ratios that share Pb as a denominator.
The detailed correlation patterns and group statistics supporting these findings are provided in Supplementary Tables S1–S3 and are consistent with the main-text summaries of modest single-element effects and stronger ratio-based associations. Three critical findings warrant emphasis:
First, the individual element results provide limited evidence for any single urinary element as a severity marker. None of the 22 individual element–CARS total-score correlations remained significant after FDR correction across individual elements, supporting a cautious interpretation of single-element associations.
This finding parallels advances in cardiovascular biomarker research, where ratios of inflammatory markers have proven more predictive than individual markers alone [13,23,29]. Just as cardiovascular dysfunction involves dysbalanced inflammatory states rather than single cytokine elevation, autism severity may involve dysbalanced metal homeostasis rather than lead or mercury toxicity per se [13,21,23,30].
Second, Li/Pb and Cu/Pb showed the strongest associations among the pre-specified marker set. However, these ratios should not be presented as validated biomarkers. Their interpretation is constrained by Pb censoring, denominator instability, and possible mathematical coupling. The sensitivity analyses support a similar inverse direction for Li/Pb under alternative Pb BDL assumptions, but the magnitude and statistical strength varied across specifications.
Third, urinary lithium showed broad inverse associations with several CARS behavioral domains. These observations may be biologically interesting, but they do not demonstrate lithium deficiency, causal protection or therapeutic benefit. They should be considered exploratory associations with urinary excretion patterns that require prospective confirmation. While not traditionally classified as “essential,” emerging evidence supports lithium’s neuroprotective roles through GSK-3β inhibition and anti-inflammatory effects [31]. The strong inverse correlation between lithium levels and symptom severity, combined with lithium’s predominance in the most predictive ratio (Li/Pb), is consistent with a possible protective role of lithium, but the observational design precludes causal inference, and any clinical implications remain speculative.
Our findings are broadly consistent with previous reports that trace element profiles in ASD are heterogeneous and may differ by exposure context. However, unlike studies emphasizing Zn/Cu imbalance, the present dataset showed stronger associations for Pb-based ratios. This difference may reflect population-specific exposure patterns, analytical matrices, or sample characteristics and should not be interpreted as evidence that one ratio is universally superior. Independent replication is required before any ratio can be considered a robust biomarker.
In line with prior heterogeneous findings, individual urinary elements in this study showed only weak associations with autism severity. None of the 22 element–CARS correlations remained significant after FDR correction (all q > 0.05), reinforcing the limited utility of single urinary elements as severity markers in this cohort. In contrast, the a priori selected Li/Pb and Cu/Pb ratios exhibited stronger inverse associations with total CARS scores, with ρ around −0.30, nominal p-values in the 0.02–0.03 range, and FDR-adjusted q-values around 0.08. These findings suggest that relative balance between selected protective and toxic elements may capture aspects of symptom severity more effectively than single elements, while still falling short of strict FDR significance criteria.
These results are compatible with the hypothesis that relative balance between selected protective and toxic elements may be more informative than single urinary element concentrations in this cohort. However, the present data do not establish a mechanistic detoxification defect, metallothionein impairment, or causal contribution of any individual element to ASD severity. The Pb-based ratio findings are particularly sensitive to interpretation because Pb was frequently below the detection limit and appears in the denominator of all three selected ratios. Therefore, Li/Pb, Cu/Pb and Cr/Pb should be regarded as exploratory candidate correlates of urinary excretion patterns that require replication in independent cohorts, preferably with repeated urine samples, complementary exposure matrices, and more complete confounder assessment.
Previous studies support the broader relevance of trace element imbalance in ASD, but they also highlight the heterogeneity of findings across cohorts and biological matrices. Adams et al. reported associations between toxic metal burden, glutathione status, and autism severity [32], which is consistent with our observation that several toxic elements showed higher upper-percentile values in severe ASD.
However, our data are based on urinary excretion and should not be interpreted as direct evidence of tissue burden or causal toxicity. Similarly, Faber et al. described Zn/Cu abnormalities as a candidate biomarker in ASD [33], whereas Zn/Cu was not associated with CARS severity in our cohort, suggesting that trace element patterns may differ according to population, exposure context, matrix, and analytical design.
The lithium-related findings are also biologically plausible in light of the literature describing lithium-associated neuroprotective, anti-inflammatory, and neurotrophic mechanisms [34,35]. Nevertheless, in the present cross-sectional urinary dataset, inverse associations involving Li and Li/Pb should be interpreted only as exploratory correlates of urinary excretion patterns, not as evidence of lithium deficiency, therapeutic benefit, or a basis for supplementation. These literature comparisons support further investigation but do not establish validated biomarkers or clinical interventions.

3.2. Study Strengths

This investigation possesses several significant methodological strengths:

3.2.1. Comprehensive Trace Element Panel with Rigorous Detection Limit Handling

The analysis of 30 trace elements represents one of the most comprehensive pediatric trace element biomarker studies in the autism literature. We applied conservative detection limit filtering (>80% BDL exclusion) to avoid biased inference from imputed values. Quality assurance procedures exceeded the typical standards, ensuring measurement reliability.

3.2.2. Quantified Severity Measure Enabling Domain-Specific Analysis

Whereas most prior studies treat autism categorically (affected vs. unaffected), we employed the CARS—providing continuous severity measurement (15–60 scale) plus 15 individual behavioral domain scores. This enables an examination of element-specific associations with particular symptom clusters rather than global disease status.

3.2.3. Novel Element Ratio Approach with Substantially Superior Predictive Power

This appears to be the first systematic analysis of protective-to-toxic element ratios in autism. The 3-fold improvement in CARS correlation (Li/Pb ρ = −0.349 vs. Pb alone ρ = 0.209) provides compelling proof of concept for the detoxification dysfunction hypothesis over simple toxin accumulation models.

3.2.4. Stratified Analysis Revealing Phenotypic Heterogeneity

The recognition of within-category ordering (90th%ile patterns) despite between-category overlap represents sophisticated epidemiologic analysis. Our stratified approach reveals that autism severity involves distinct element dysregulation subgroups.

3.2.5. Multiple Analytical Approaches Providing Convergent Evidence

Correlation analysis, group comparisons (Mann–Whitney U, Kruskal–Wallis), stratified percentile analysis, effect size calculations, and chi-square categorical testing provide multiple statistical perspectives. Consistent directionality across approaches strengthens inference.
Urinary trace element concentrations primarily reflect renal excretion and handling at the time of sampling rather than direct tissue burden or systemic deficiency. Inferences about whole-body metal status, lithium deficiency, or copper sufficiency from a single spot urine sample are therefore limited, and the observed associations should be interpreted as exploratory correlates of urinary excretion patterns rather than of body-compartment concentrations.

3.3. Study Limitations

Several limitations should be emphasized. First, the cross-sectional design precludes causal inference; urinary trace element differences may reflect exposure, altered renal handling, reverse causality, or unmeasured confounding rather than causal mechanisms. Second, Pb was highly censored, with 70.8% of values below the detection limit. Although sensitivity analyses using alternative Pb BDL assumptions were performed, Pb-based ratios remain vulnerable to denominator instability and mathematical coupling. Third, urinary concentrations normalized to creatinine reduce dilution-related variability but cannot fully account for differences in muscle mass, hydration status, or renal handling; body composition and renal-function markers were not systematically available. Fourth, only a single spot urine sample was available per participant; therefore, within-individual reproducibility and intraclass correlation coefficients for Li/Pb, Cu/Pb, and Cr/Pb could not be estimated. Fifth, complete per-element within-run and between-run CV tables were not archived in a format suitable for tabulation, although representative quality-control ranges were available. Sixth, diet, supplement use, medication exposure, water source, environmental lead sources, socioeconomic variables, and other potential confounders were not systematically collected. Finally, the high-dimensional item-level CARS correlation analyses are exploratory and require replication with prespecified hypotheses in independent cohorts.

3.4. Generalizability and Future Research Directions

This study emphasizes that element profiles associated with ASD severity may be population-specific. The findings in this Central European cohort may not apply to populations with different genetic, dietary, or environmental exposure patterns. Future studies should include larger and independent cohorts, repeated urine sampling, complementary matrices such as blood or hair, structured exposure and dietary assessment, and direct measurement of detoxification-related metabolites such as glutathione or urinary porphyrins.

4. Materials and Methods

4.1. Study Design and Setting

We enrolled 174 children (103 with ASD, 65 controls) from clinical and community settings in Slovenia, aged 9.6 ± 4.1 years. ASD was diagnosed according to DSM-5 criteria. Controls were healthy or typically developing children without known neuropsychiatric or metabolic illness. All provided spot urine samples during routine visits or by study protocol.

4.2. Study Population

Inclusion criteria:
  • Children and adolescents aged 4–16 years.
  • Diagnosis of autism spectrum disorder per DSM-5 criteria for ASD group (confirmed by clinical assessment by developmental pediatrician or pediatric neurologist).
  • No prior diagnosis of neurodevelopmental disorder for control group.
  • Ability to provide urine sample.
  • Willingness to complete CARS assessment.
Exclusion criteria:
  • Significant intellectual disability unrelated to autism (IQ <40 in absence of ASD).
  • Comorbid neurological disorder (seizure disorder, cerebral palsy, or other significant CNS pathology).
  • Significant hearing or visual impairment.
  • Active infection or acute illness at time of sampling.
  • Use of systemic corticosteroids or immunosuppressive medications within 2 weeks of sampling.
  • Recent chelation therapy or metal-binding supplementation.

4.3. Final Sample

A total of 174 subjects were enrolled and completed CARS assessments. A total of 6 subjects were excluded due to invalid creatinine measurements (missing or zero values), leaving 168 subjects for final analysis:
  • Control group (n = 65): Healthy children with no history of ASD or other neurodevelopmental disorders. Mean age 7.8 ± 2.3 years, 52% male. They were recruited from primary care clinics and community centers.
  • ASD Patient group (n = 103): Children with confirmed ASD diagnosis, stratified by symptom severity using CARS scores:
  • Subthreshold ASD (n = 29): CARS score <30, mean CARS score 26.5 ± 2.1, indicating children with a clinical diagnosis of ASD whose CARS total score was below 30 at the time of assessment. Mild–Moderate ASD (n = 36): CARS score 30–36, mean 32.7 ± 2.1. This represents the typical clinic-referred ASD population.
  • Severe ASD (n = 38): CARS score >36, mean 44.7 ± 6.4, range 36–57.5. This represents significantly impaired individuals across multiple domains.
Mean age of ASD patients: 7.6 ± 2.1 years (no significant difference from controls, p = 0.34). Sex distribution: 72% male in the ASD group (typical for autism diagnosis rates), 48% male in controls (p < 0.001, expected based on the known male preponderance in ASD).

4.4. Childhood Autism Rating Scale (CARS) Assessment

The CARS is a 15-item standardized behavioral rating scale developed specifically for quantifying autism severity across the lifespan. Each item (designated I through XV) evaluates a specific behavioral domain using a 1–4 scale with 0.5 increments permitted. Scores may range 1.0–4.0 per item, generating total CARS scores ranging 15–60.
Standard interpretation: scores 15–30 indicate non-autistic, 30–36 mildly to moderately autistic, and 36–60 severely autistic; these instrument cut-offs do not redefine the clinical diagnostic status of participants enrolled in the ASD arm. CARS was administered by trained clinicians (pediatric neurologist or developmental specialist) with certification in CARS assessment.

4.5. Specimen Collection

Urine samples were collected from all subjects during morning visits to the clinical research center. Subjects were instructed to empty thier bladder upon waking and then collect the first morning void (first morning urine, FMU) into sterile, metal-free polypropylene containers specifically cleaned according to trace element analysis protocols. Samples were collected without additives and transported to the laboratory within 2 h of collection at room temperature in the dark.
Upon receipt in the laboratory, samples were analyzed for creatinine concentration within 4 h, and they were then aliquoted and frozen at −20 °C until trace element analysis (typically within 1–2 weeks of collection). Samples were thawed only once prior to analysis.

4.6. Laboratory Analysis of Trace Elements

An aliquot of 0.2 mL of urine sample was diluted with 2 mL of ammonium hydroxide (Fluka Analytical TraceSELECT Ultra) solution containing Triton X-100 (Aldrich Chemistry, Trace Metal Basis), 1-butanol (Sigma Aldrich, ACS reagent, Darmstadt, Germany), ethylenediaminetetraacetic acid disodium salt dehydrate (Aldrich Chemistry, Trace Metal Basis), and an internal standard solution containing Bi, Ge, In, Li6, Lu, Rh, Sc, and Tb (Agilent Technologies, ICP-MS Internal Std Mix, Santa Clara, CA, USA). Fourteen-point calibration with multicalibrators IV-STOCK-27 and IV-STOCK-57 and MSAU-10PPM (Inorganic Ventures, Christiansburg, VA, USA) was performed. Measurements of prepared solutions were made on an Octapole Reaction System Inductively Coupled Plasma Mass Spectrometer (7700x, Agilent) equipped with Integrated Autosampler (Agilent). Instrumental conditions were as follows: Micromist nebuliser, Scott-type spray chamber, spray chamber lower temperature 2 °C and higher temperature 16 °C, plasma gas flow rate 15 L/min, carrier gas flow rate 1.07 L/min, RF power 1550 W, reaction cell gas helium 10 mL/min for Se and 5 mL/min for other trace elements, except for Li, Be, and Al where no gas mode was used. Tuning of the instrument was made daily using a solution containing Li, Mg, Y, Ce, Tl, and Co (Agilent Technologies, ICP-MS Tuning Solution 10 ppm). Quantification of all isotopes was performed using one central point of the spectral peaks and three repetitions. The reference material (RM) Seronorm Trace Elements Whole Blood L-1 (LOT no: 1406263, Sero) and Whole Blood L-2 (LOT no: 1406264, Sero) were used to check the accuracy of the results for trace elements in blood. The reference material (RM) Seronorm Trace Elements Serum L-1 (LOT no: 1309438, Sero) was used to check the accuracy of the results for trace elements in serum, and for urine Seronorm Trace Elements, Urine L-1 (LOT no: 1011644, Sero) and Urine L-2 (LOT no: 1403081, Sero) were used.
Analytical performance was monitored using Seronorm Trace Elements Urine L-1 and L-2 controls in each analytical series, with manufacturer-assigned target values used to verify accuracy. Internal duplicate analysis (10% of samples; acceptance criterion <15% relative SD) and bracketing internal standards every 10 samples were used. Representative within-run CVs for Li, Cu, Cr, and Pb at concentrations similar to those observed in this cohort were approximately 3–6%, and between-run CVs were approximately 5–8% (representative values; full per-element CV tables for all 22 retained elements were not archived in a format suitable for tabulation, which we acknowledge as a reporting limitation of this retrospective analysis). We therefore acknowledge the absence of a comprehensive per-element CV table as a reporting limitation of this retrospective analysis.
Elements analyzed: Lithium (Li), Beryllium (Be), Magnesium (Mg), Aluminum (Al), Calcium (Ca), Titanium (Ti), Vanadium (V), Chromium (Cr), Manganese (Mn), Cobalt (Co), Nickel (Ni), Copper (Cu), Zinc (Zn), Gallium (Ga), Arsenic (As), Selenium (Se), Rubidium (Rb), Strontium (Sr), Molybdenum (Mo), Silver (Ag), Cadmium (Cd), Tin (Sn), Antimony (Sb), Cesium (Cs), Barium (Ba), Gold (Au), Mercury (Hg), Thallium (Tl), Lead (Pb), and Uranium (U) were measured in accordance with normal sample preparation procedures as previously described [36].
Detection limits:
Limits of detection (LOD) and limits of quantification (LOQ) were established for each element using matrix-matched calibration standards. LOD ranged 0.001–0.1 µg/L depending on element. Results below LOD were reported as “below limit of detection”.
Detection-limit handling and element selection:
Concentrations below the limit of detection (BDL) were handled as follows. In the primary analysis, Pb values reported as BDL were imputed as LOD/2 (LOD = 0.04 µg/L). Elements for which more than 80% of samples were BDL were excluded from the main statistical analysis (see Table 2). The robustness of Pb-based ratios to this convention was assessed in sensitivity analyses described in the Statistical Analysis subsection.
Creatinine measurement:
Urine creatinine was measured enzymatically using an automated clinical chemistry analyzer (Roche Cobas c501), traceable to standard reference materials. Creatinine-normalized concentrations were calculated as follows: Normalized Concentration (µg/g creatinine) = [Element concentration (µg/L)]/[Creatinine (g/L)]. Creatinine normalization was used to reduce variability related to urine dilution; however, this approach does not fully account for interindividual differences in muscle mass, hydration status, or renal handling. Because body composition and renal function markers were not systematically collected, residual confounding related to creatinine excretion cannot be excluded.

4.7. Quality Control

Laboratory quality assurance included:
  • Internal standards (American Chemical Society-certified reference materials) run every 10 samples.
  • Duplicate sample analysis (10% of samples) with acceptance criteria <15% relative standard deviation.
  • Matrix spike recovery testing monthly (acceptable range 85–115%).
  • Negative controls (blank samples) with each batch.
  • External proficiency testing (CAP Laboratory Accreditation Program quarterly).

4.8. Detection Limit Classification and Element Selection

Elements with >80% of measurements below the limit of detection (BDL) were excluded from statistical analysis to minimize bias from LOD imputation. This conservative threshold eliminates elements where data were predominantly censored while preserving elements with sufficient above-detection information. For statistical analyses and ratio calculations, concentrations below the limit of detection were imputed as LOD/2, a common approach in environmental biomonitoring studies. Because Pb had a high proportion of measurements below the detection threshold, Pb-based ratios were interpreted cautiously, as denominator censoring may increase ratio variability and affect downstream correlation estimates. Elements excluded: Beryllium (80.4% BDL), Vanadium (88.7% BDL), Manganese (92.3% BDL), Gallium (97.6% BDL), Silver (98.2% BDL), Cadmium (83.9% BDL), Gold (100% BDL), and Mercury (81.5% BDL).
Final analysis included 22 elements with <80% BDL: Li, Mg, Al, Ca, Ti, Cr, Co, Ni, Cu, Zn, As, Se, Rb, Sr, Mo, Sn, Sb, Cs, Ba, Tl, Pb, and U.
For each element, measurements below the instrument detection limit (BDL) were recorded as ‘<value’. Elements with more than 80% BDL were excluded from the analysis. Lead (Pb) had a detection rate of 29.2%, corresponding to 70.8% BDL values, but was retained because Pb-based ratios were specified a priori. In the primary analysis, BDL Pb concentrations were imputed as LOD/2 (LOD = 0.04), while measured Pb values were used as reported, and ratios (Li/Pb, Cu/Pb, Cr/Pb) were calculated on creatinine-normalized concentrations.
To assess the robustness of Pb-based ratios to censoring assumptions, sensitivity analyses were performed using alternative BDL treatments (Pb BDL = 0, Pb BDL = LOD/√2) and by repeating analyses in the subset of ASD participants with Pb concentrations above the detection limit (Pb > 0.04) without imputation. For each scenario, Spearman correlations between CARS scores and Pb, Li, and the Li/Pb, Cu/Pb, and Cr/Pb ratios were recalculated, and Benjamini–Hochberg false discovery rate (FDR)–adjusted q-values were obtained across these five pre-specified markers.

4.9. Element Ratio Calculations

Based on physiological concepts of metallothionein function and detoxification capacity, three primary element ratios were calculated representing the balance between protective elements and toxic elements:
  • Lithium-to-Lead Ratio (Li/Pb)—Lithium exerts neuroprotective effects through glycogen synthase kinase-3β (GSK-3β) inhibition and anti-inflammatory mechanisms, with emerging evidence for benefit in various neurodevelopmental and neuropsychiatric conditions. Lead represents the primary industrial neurotoxin in this cohort, with extensive documentation of dose-dependent neurocognitive effects. The ratio captures both protective (lithium) and toxic (lead) components of detoxification dysfunction.
  • Copper-to-Lead Ratio (Cu/Pb)—Copper serves as an essential cofactor in cytochrome C oxidase, superoxide dismutase, and metallothionein synthesis, key components of antioxidant defense and metal detoxification systems. The Cu/Pb ratio reflects availability of copper for detoxification relative to lead burden.
  • Chromium-to-Lead Ratio (Cr/Pb)—Chromium participates in glucose metabolism and insulin signaling, with evidence supporting roles in detoxification pathways. The Cr/Pb ratio represents another protective-to-toxic balance metric.
Lower ratios indicate a state of detoxification dysfunction: either elevated toxic elements, reduced protective elements, or both. This combined state represents the hypothesis that autism severity relates to dysregulation of detoxification capacity rather than individual element elevation.
i/Pb, Cu/Pb and Cr/Pb were selected a priori as exploratory protective-to-toxic element ratios. The numerator elements were chosen because lithium, copper, and chromium have been discussed in relation to neurobiological, antioxidant, or metabolic pathways, whereas lead was selected as the principal neurotoxic exposure of interest in this dataset. These ratios were intended to summarize relative urinary excretion patterns rather than to diagnose detoxification capacity or body burden. Because Pb had a high proportion of BDL values, all Pb-based ratios were interpreted cautiously and evaluated in sensitivity analyses using alternative Pb BDL assumptions.

4.10. Statistical Analysis

Descriptive statistics:
Means, medians, standard deviations, and ranges were calculated for all element concentrations and CARS scores. CARS scores were examined for normality using the Shapiro–Wilk test; all variables showed non-normal distributions (p < 0.05), thus non-parametric methods were applied throughout. Statistical analyses were performed with MedCalc 20.011 (MedCalc Software Ltd., Ostend, Belgium) and R version 4.3.1 in conjunction with RStudio version 2023.12.0 [37].
Primary analysis—spearman correlations:
Spearman rank correlations (ρ) tested associations between each of 22 trace elements and CARS outcomes within ASD patients only (n = 103, to examine within-disease correlations). Four CARS outcomes were examined: (1) total CARS score; (2–16) each of the 15 individual CARS items. Correlations were computed for both individual elements and calculated ratios. Significance threshold α = 0.05 (two-tailed). Correlations were interpreted per Cohen’s guidelines: ρ = 0.1–0.29 small, 0.3–0.49 medium, and ≥0.5 large.
Because Pb had a high proportion of measurements below the detection limit (70.8%), we conducted sensitivity analyses to assess the robustness of Pb-based ratios. In addition to the primary analysis in which BDL Pb values were imputed as LOD/2 (LOD = 0.04), we recalculated Spearman correlations between CARS scores and Pb, Li, and the Li/Pb, Cu/Pb, and Cr/Pb ratios under alternative BDL assumptions (Pb BDL = 0, Pb BDL = LOD/√2) and within the subset of ASD participants with Pb concentrations above the detection limit (Pb > 0.04), where measured values were used without imputation. Benjamini–Hochberg FDR correction was applied to the pre-specified marker set (Li, Pb, Li/Pb, Cu/Pb, and Cr/Pb), with q-values reported alongside p-values. The exploratory 22 × 16 element–CARS-item correlation matrix (Supplementary Table S1) is reported with nominal p-values; given the 352 comparisons, individual item-level associations should be interpreted as hypothesis-generating only.
Sensitivity analyses for Pb BDL handling were performed under three imputation rules (Pb BDL = 0, LOD/2, LOD/√2) and in a subset restricted to ASD participants with measured Pb > LOD without imputation. Benjamini–Hochberg false-discovery-rate (FDR) correction was applied to the pre-specified marker set (Li, Pb, Li/Pb, Cu/Pb, and Cr/Pb); q-values are reported alongside p-values.
Li/Pb, Cu/Pb, and Cr/Pb were selected a priori to represent the balance between three candidate protective elements (Li, Cu, and Cr) and the principal neurotoxic exposure of interest (Pb). Ratio-based analyses are sensitive to denominator instability, especially when the denominator is heavily censored: with 70% of Pb values reported as BDL and imputed as LOD/2 in the primary analysis, shared-denominator effects and mathematical coupling can amplify or distort apparent correlations between the three ratios. The sensitivity analyses described above (Pb BDL = 0, LOD/2, LOD/√2, and Pb > LOD subset) explicitly probe this fragility, and the three ratios are accordingly interpreted as exploratory candidate correlates rather than independent biomarkers.
For transparency and reproducibility, we report the full 22 × 16 correlation matrix (22 elements and 3 ratios vs. total CARS and 15 CARS items) in Supplementary Table S1, the complete descriptive statistics by CARS category in Supplementary Table S2, and the full set of non-parametric group comparison results and effect sizes in Supplementary Table S3.
Secondary analysis—group comparisons:
Mann–Whitney U tests compared trace element concentrations between control (n = 65) and ASD patients (n = 103). Kruskal–Wallis H tests compared concentrations across four CARS severity categories: Control, Subthreshold ASD (CARS < 30), Mild–Moderate ASD (CARS 30–36), and Severe ASD (CARS > 36). Post-hoc pairwise comparisons were performed only when overall test p < 0.05.
Tertiary analysis—stratified percentile analysis:
Within each CARS severity category, the 90th percentile for each element was calculated separately. Ratios of 90th percentiles (Severe ASD/Control) quantified the degree of elevation in severe cases. Chi-square tests assessed whether the top 10% highest element concentrations were randomly distributed or preferentially clustered within CARS categories.
Effect size:
Cohen’s d calculated for severe ASD vs. control groups for each element, with classification as follows: small (0.2–0.5), medium (0.5–0.8), and large (>0.8).
To address multiple testing in the correlation analyses, false-discovery-rate (FDR) adjustment was applied using the Benjamini–Hochberg procedure. Specifically, FDR-corrected q-values were calculated for (i) correlations between total CARS score and each of the 22 retained individual elements (22 tests), and (ii) correlations between total CARS score and five pre-specified markers (Li/Pb, Cu/Pb, Cr/Pb, Pb, and Li) (5 tests). Item-level CARS domain correlations were considered exploratory and are therefore reported without formal FDR correction but interpreted cautiously in light of the large number of tests.

5. Conclusions

This cross-sectional study of 168 children investigated associations between urinary trace elements and autism severity measured by CARS. Individual urinary trace element concentrations showed only weak associations with CARS severity. Protective-to-toxic element ratios, particularly Li/Pb, showed somewhat stronger inverse associations, but the magnitude of these associations was modest and partially dependent on Pb BDL handling. Lithium showed the most consistent inverse association across CARS behavioral items; this finding is exploratory and does not support any therapeutic recommendation. The results should be regarded as candidate correlates that motivate prospective, longitudinal, and mechanistic studies with repeated urine sampling, broader confounder assessment, and direct measurement of detoxification-related metabolites such as glutathione and urinary porphyrins. No clinical or precision-medicine application is supported by the present data.

Supplementary Materials

The following supporting information can be downloaded at: https://www.mdpi.com/article/10.3390/app16115332/s1, Table S1: Complete Spearman correlation matrix showing associations between all 22 trace elements, 3 element ratios, and total CARS score plus 15 individual CARS behavioral items in ASD patients (n = 103). Table S2: Descriptive statistics for urinary trace element concentrations (µg/g creatinine) across CARS severity categories (Control, Subthreshold ASD, Mild–Moderate ASD, and Severe ASD), including the mean, standard deviation, median, interquartile range, full range, and 10th/90th percentiles. Table S3: Non-parametric group comparison statistics (Mann–Whitney U for controls vs. ASD, Kruskal–Wallis H for four CARS categories) and Cohen’s d effect sizes for all 22 trace elements and 3 element ratios.

Author Contributions

Conceptualization: J.O.; methodology: J.O. and D.O., A.F.Š.; software: U.G.; validation: J.O., K.K., M.J.V., G.A., and T.F.; formal analysis: A.F.Š., and T.F.; investigation: J.O.; resources: J.O.; data curation: K.K.; writing—original draft preparation: J.O.; writing—review and editing: J.O. and K.K.; visualization: K.K.; supervision: J.O.; project administration: J.O.; funding acquisition: J.O. All authors have read and agreed to the published version of the manuscript.

Funding

This research was funded by the scientific research program grants P3-0124 and project J3-1756, financed by Slovenian Research and Innovation Agency.

Institutional Review Board Statement

This study was conducted in accordance with the Declaration of Helsinki and was approved by the National Medical Ethics Committee (0120-201/2016-2 KME 78/03/16 on 3 February 2021).

Informed Consent Statement

Informed consent was obtained from the legal guardians, and the study was approved by the relevant ethics committee.

Data Availability Statement

The data that support the findings of this study are available from the study’s principal investigator—O.J.—upon reasonable request.

Acknowledgments

The authors would like to thank all parents and guardians who allowed their children to participate in the study, and especially Vera Troha for her careful processing of the samples.

Conflicts of Interest

The authors declare no conflict of interest.

Abbreviations

ASDAutism Spectrum Disorder
CARSChildhood Autism Rating Scale
ICP-MSInductively Coupled Plasma Mass Spectrometry
BDLBelow Detection Limit
LODLimit of Detection
LOQLimit of Quantification
FDRFalse Discovery Rate
SDStandard Deviation
LiLithium
BeBeryllium
MgMagnesium
AlAluminum
CaCalcium
TiTitanium
VVanadium
CrChromium
MnManganese
CoCobalt
NiNickel
CuCopper
ZnZinc
GaGallium
AsArsenic
SeSelenium
RbRubidium
SrStrontium
MoMolybdenum
AgSilver
CdCadmium
SnTin
SbAntimony
CsCesium
BaBarium
AuGold
HgMercury
TlThallium
PbLead
UUranium

References

  1. Vahia, V.N. Diagnostic and statistical manual of mental disorders 5: A quick glance. Indian J. Psychiatry 2013, 55, 220–223. [Google Scholar] [CrossRef] [PubMed]
  2. Herbert, M.R. Contributions of the environment and environmentally vulnerable physiology to autism spectrum disorders. Curr. Opin. Neurol. 2010, 23, 103–110. [Google Scholar] [CrossRef]
  3. Deng, W.; Zou, X.; Deng, H.; Li, J.; Tang, C.; Wang, X.; Guo, X. The Relationship among Genetic Heritability, Environmental Effects, and Autism Spectrum Disorders. J. Child Neurol. 2015, 30, 1794–1799. [Google Scholar] [CrossRef]
  4. Quiñones-Medina, E.; Galleguillos, F.; Parra, V.; Arriagada, G.; Bustos, F.J. Gene–Environment Interactions in Autism Spectrum Disorders: The Role of Bisphenol A in Modulating Genetic Susceptibility. Autism Res. 2026, 19, e70186. [Google Scholar] [CrossRef]
  5. Cheroni, C.; Caporale, N.; Testa, G. Autism spectrum disorder at the crossroad between genes and environment: Contributions, convergences, and interactions in ASD developmental pathophysiology. Mol. Autism 2020, 11, 69. [Google Scholar] [CrossRef]
  6. Parithathvi, A.; Choudhari, N.; Dsouza, H.S. Prenatal and early life lead exposure induced neurotoxicity. Hum. Exp. Toxicol. 2024, 43, 09603271241285523. [Google Scholar] [CrossRef]
  7. Vorvolakos, T.; Arseniou, S.; Samakouri, M. There is no safe threshold for lead exposure: A literature review. Psychiatriki 2016, 27, 204–214. [Google Scholar] [CrossRef]
  8. Cusack, L.K.; Smit, E.; Kile, M.L.; Harding, A.K. Regional and temporal trends in blood mercury concentrations and fish consumption in women of child bearing Age in the united states using NHANES data from 1999–2010. Environ. Health 2017, 16, 10. [Google Scholar] [CrossRef] [PubMed]
  9. Tyczyńska, M.; Gędek, M.; Brachet, A.; Stręk, W.; Flieger, J.; Teresiński, G.; Baj, J. Trace Elements in Alzheimer’s Disease and Dementia: The Current State of Knowledge. J. Clin. Med. 2024, 13, 2381. [Google Scholar] [CrossRef]
  10. Schofield, K. The Metal Neurotoxins: An Important Role in Current Human Neural Epidemics? Int. J. Environ. Res. Public Health 2017, 14, 1511. [Google Scholar] [CrossRef] [PubMed]
  11. Stachowicz, K. Regulation of COX-2 expression by selected trace elements and heavy metals: Health implications, and changes in neuronal plasticity. A review. J. Trace Elem. Med. Biol. 2023, 79, 127226. [Google Scholar] [CrossRef] [PubMed]
  12. Carmona, A.; Roudeau, S.; Ortega, R. Molecular Mechanisms of Environmental Metal Neurotoxicity: A Focus on the Interactions of Metals with Synapse Structure and Function. Toxics 2021, 9, 198. [Google Scholar] [CrossRef]
  13. Błażewicz, A.; Grabrucker, A.M. Metal Profiles in Autism Spectrum Disorders: A Crosstalk between Toxic and Essential Metals. Int. J. Mol. Sci. 2023, 24, 308. [Google Scholar] [CrossRef]
  14. Rossignol, D.A.; Frye, R.E. A review of research trends in physiological abnormalities in autism spectrum disorders: Immune dysregulation, inflammation, oxidative stress, mitochondrial dysfunction and environmental toxicant exposures. Mol. Psychiatry 2012, 17, 389–401. [Google Scholar] [CrossRef] [PubMed]
  15. Bjørklund, G.; Meguid, N.A.; El-Bana, M.A.; Tinkov, A.A.; Saad, K.; Dadar, M.; Hemimi, M.; Skalny, A.V.; Hosnedlová, B.; Kizek, R.; et al. Oxidative Stress in Autism Spectrum Disorder. Mol. Neurobiol. 2020, 57, 2314–2332. [Google Scholar] [CrossRef]
  16. Ruttkay-Nedecky, B.; Nejdl, L.; Gumulec, J.; Zitka, O.; Masarik, M.; Eckschlager, T.; Stiborova, M.; Adam, V.; Kizek, R. The Role of Metallothionein in Oxidative Stress. Int. J. Mol. Sci. 2013, 14, 6044–6066. [Google Scholar] [CrossRef]
  17. Henkel, G.; Krebs, B. Metallothioneins:  Zinc, Cadmium, Mercury, and Copper Thiolates and Selenolates Mimicking Protein Active Site Features − Structural Aspects and Biological Implications. Chem. Rev. 2004, 104, 801–824. [Google Scholar] [CrossRef]
  18. Isani, G.; Carpenè, E. Metallothioneins, Unconventional Proteins from Unconventional Animals: A Long Journey from Nematodes to Mammals. Biomolecules 2014, 4, 435–457. [Google Scholar] [CrossRef]
  19. Bjørklund, G.; Meguid, N.A.; El-Ansary, A.; El-Bana, M.A.; Dadar, M.; Aaseth, J.; Hemimi, M.; Osredkar, J.; Chirumbolo, S. Diagnostic and Severity-Tracking Biomarkers for Autism Spectrum Disorder. J. Mol. Neurosci. 2018, 66, 492–511. [Google Scholar] [CrossRef]
  20. Meguid, N.A.; Bjørklund, G.; Gebril, O.H.; Doşa, M.D.; Anwar, M.; Elsaeid, A.; Gaber, A.; Chirumbolo, S. The role of zinc supplementation on the metallothionein system in children with autism spectrum disorder. Acta Neurol. Belg. 2019, 119, 577–583. [Google Scholar] [CrossRef] [PubMed]
  21. Baj, J.; Flieger, W.; Flieger, M.; Forma, A.; Sitarz, R.; Skórzyńska-Dziduszko, K.; Grochowski, C.; Maciejewski, R.; Karakuła-Juchnowicz, H. Autism spectrum disorder: Trace elements imbalances and the pathogenesis and severity of autistic symptoms. Neurosci. Biobehav. Rev. 2021, 129, 117–132. [Google Scholar] [CrossRef]
  22. Curtin, P.; Austin, C.; Curtin, A.; Gennings, C.; Arora, M.; (for the Emergent Dynamical Systems Group); Tammimies, K.; Willfors, C.; Berggren, S.; Siper, P.; et al. Dynamical features in fetal and postnatal zinc-copper metabolic cycles predict the emergence of autism spectrum disorder. Sci. Adv. 2018, 4, eaat1293. [Google Scholar] [CrossRef]
  23. Bjørklund, G. The role of zinc and copper in autism spectrum disorders. Acta Neurobiol. Exp. 2013, 73, 225–236. [Google Scholar] [CrossRef]
  24. Zhang, J.; Li, X.; Shen, L.; Khan, N.U.; Zhang, X.; Chen, L.; Zhao, H.; Luo, P. Trace elements in children with autism spectrum disorder: A meta-analysis based on case-control studies. J. Trace Elem. Med. Biol. 2021, 67, 126782. [Google Scholar] [CrossRef]
  25. Stevanovic, D.; Costanzo, F.; Fucà, E.; Valeri, G.; Vicari, S.; Robins, D.L.; Samms--Vaughan, M.; Erkuran, H.O.; Yaylaci, F.; Deshpande, S.N.; et al. Measurement invariance of the Childhood Autism Rating Scale (CARS) across six countries. Autism Res. 2021, 14, 2544–2554. [Google Scholar] [CrossRef]
  26. Moulton, E.; Bradbury, K.; Barton, M.; Fein, D. Factor Analysis of the Childhood Autism Rating Scale in a Sample of Two Year Olds with an Autism Spectrum Disorder. J. Autism Dev. Disord. 2016, 49, 2733–2746. [Google Scholar] [CrossRef] [PubMed]
  27. El-Ansary, A.; Bjørklund, G.; Khemakhem, A.M.; Al-Ayadhi, L.; Chirumbolo, S.; Ben Bacha, A. Metabolism-Associated Markers and Childhood Autism Rating Scales (CARS) as a Measure of Autism Severity. J. Mol. Neurosci. 2018, 65, 265–276. [Google Scholar] [CrossRef] [PubMed]
  28. Breidbord, J.; Croudace, T.J. Reliability Generalization for Childhood Autism Rating Scale. J. Autism Dev. Disord. 2013, 43, 2855–2865. [Google Scholar] [CrossRef]
  29. Shen, L.; Zhao, Y.; Zhang, H.; Feng, C.; Gao, Y.; Zhao, D.; Xia, S.; Hong, Q.; Iqbal, J.; Liu, X.K.; et al. Advances in Biomarker Studies in Autism Spectrum Disorders. Adv. Exp. Med. Biol. 2019, 1118, 207–233. [Google Scholar] [CrossRef] [PubMed]
  30. Arora, M.; Reichenberg, A.; Willfors, C.; Austin, C.; Gennings, C.; Berggren, S.; Lichtenstein, P.; Anckarsäter, H.; Tammimies, K.; Bölte, S. Fetal and postnatal metal dysregulation in autism. Nat. Commun. 2017, 8, 15493. [Google Scholar] [CrossRef] [PubMed]
  31. Diniz, B.S.; Machado-Vieira, R.; Forlenza, O.V. Lithium and neuroprotection: Translational evidence and implications for the treatment of neuropsychiatric disorders. Neuropsychiatr. Dis. Treat. 2013, 9, 493–500. [Google Scholar] [CrossRef]
  32. Adams, J.B.; Baral, M.; Geis, E.; Mitchell, J.; Ingram, J.; Hensley, A.; Zappia, I.; Newmark, S.; Gehn, E.; Rubin, R.A.; et al. The Severity of Autism Is Associated with Toxic Metal Body Burden and Red Blood Cell Glutathione Levels. J. Toxicol. 2009, 2009, 532640. [Google Scholar] [CrossRef] [PubMed]
  33. Faber, S.; Zinn, G.M.; Kern, J.C.; Skip Kingston, H.M. The plasma zinc/serum copper ratio as a biomarker in children with autism spectrum disorders. Biomarkers 2009, 14, 171–180. [Google Scholar] [CrossRef] [PubMed]
  34. De-Paula, V.d.J.R.; Radanovic, M.; Forlenza, O.V. Lithium and neuroprotection: A review of molecular targets and biological effects at subtherapeutic concentrations in preclinical models of Alzheimer’s disease. Int. J. Bipolar Disord. 2025, 13, 16. [Google Scholar] [CrossRef]
  35. Won, E.; Kim, Y.K. An Oldie but Goodie: Lithium in the Treatment of Bipolar Disorder through Neuroprotective and Neurotrophic Mechanisms. Int. J. Mol. Sci. 2017, 18, 2679. [Google Scholar] [CrossRef] [PubMed]
  36. Štiglic, A.F.; Falnoga, I.; Briški, A.S.; Žavbi, M.; Osredkar, J.; Skitek, M.; Marc, J. Reference intervals of 24 trace elements in blood, plasma and erythrocytes for the Slovenian adult population. Clin. Chem. Lab. Med. 2023, 62, 946–957. [Google Scholar] [CrossRef]
  37. R Core Team. A Language and Environment for Statistical Computing; R Foundation for Statistical Computing: Vienna, Austria, 2018; Volume 2. [Google Scholar]
Figure 1. Correlation comparison—individual elements vs. element ratios.
Applsci 16 05332 g001
Figure 2. Heatmap of element ratios vs. CARS behavioral domains.
Applsci 16 05332 g002
Figure 3. Violin plots of element ratios across CARS severity categories.
Applsci 16 05332 g003
Figure 4. Scatter plot of Li/Pb ratio versus CARS total score in ASD patients (n = 103).
Applsci 16 05332 g004
Table 1. Sample characteristics and demographics.
CharacteristicControlsSubthreshold ASDMild-Mod ASDSevere ASDp-Value
Sample size (n)65293638-
Age (years), mean ± SD7.8 ± 2.37.3 ± 2.07.9 ± 1.97.5 ± 2.20.34
Age range (years)4–15----
Male (%)52667579<0.001
CARS score, mean ± SD-26.5 ± 2.132.7 ± 2.144.7 ± 6.4<0.001
CARS range-18.5–3030–3636–57.5-
Demographic characteristics and CARS scores across study groups. CARS = Childhood Autism Rating Scale; ASD = Autism Spectrum Disorder; SD = standard deviation. Kruskal–Wallis H test used for continuous variables, chi-square for categorical variables.
Table 2. Trace element detection rates and exclusions.
ElementDetection Rate (%)BDL (%)
INCLUDED (Detection rate > 20%)
Lithium (Li)100.00.0
Magnesium (Mg)100.00.0
Calcium (Ca)100.00.0
Titanium (Ti)100.00.0
Molybdenum (Mo)100.00.0
Antimony (Sb)100.00.0
Cesium (Cs)100.00.0
Selenium (Se)100.00.0
Rubidium (Rb)100.00.0
Thallium (Tl)100.00.0
Aluminum (Al)85.714.3
Chromium (Cr)78.022.0
Cobalt (Co)74.425.6
Nickel (Ni)72.028.0
Copper (Cu)95.24.8
Zinc (Zn)98.81.2
Arsenic (As)68.531.5
Strontium (Sr)99.40.6
Tin (Sn)45.854.2
Barium (Ba)92.37.7
Lead (Pb)29.270.8
Uranium (U)35.164.9
EXCLUDED (>80% BDL)
Beryllium (Be)19.680.4
Vanadium (V)11.388.7
Manganese (Mn)7.792.3
Gallium (Ga)2.497.6
Silver (Ag)1.898.2
Cadmium (Cd)16.183.9
Gold (Au)0.0100.0
Mercury (Hg)18.581.5
Detection rates and below-detection-limit (BDL) percentages for all 30 trace elements analyzed by ICP-MS. Elements with >80% BDL were excluded from statistical analysis to minimize imputation bias. Final analysis included 22 elements. Because Pb had a detection rate of 29.2%, Pb-based ratios were retained for hypothesis-driven analysis but interpreted cautiously owing to potential denominator instability.
Table 3. Spearman correlations of individual urinary trace elements with total CARS score in ASD patients (n = 103).
ElementSpearman ρp-Valueq-Value (FDR)
Pb0.2090.035 *0.561
Li−0.1940.0510.561
Mg0.1610.1030.755
Al0.0890.3710.842
Ca−0.0450.6510.842
Ti0.0120.9030.946
Cr−0.0780.4330.842
Co0.0340.7320.848
Ni0.1120.2580.842
Cu−0.1020.3050.842
Zn0.0010.9920.992
As−0.0670.5000.842
Se−0.0230.8170.899
Rb−0.0560.5730.842
Sr0.0890.3710.842
Mo0.0450.6510.842
Sn0.0780.4330.842
Sb0.1230.2150.842
Cs−0.0340.7320.848
Ba0.0670.5000.842
Tl0.0450.6510.842
U0.1450.1430.786
Spearman ρ values were calculated between urinary element concentrations and total CARS score within ASD patients. q-values were calculated using Benjamini–Hochberg FDR adjustment across the 22 individual element tests shown in this table. * p < 0.05. Element abbreviations are defined in Table 2. After Benjamini–Hochberg FDR adjustment across the 22 individual element tests, none of the individual element–CARS total-score correlations remained statistically significant (all q > 0.05), supporting the interpretation of single-element associations as weak and exploratory.
Table 4. Associations of selected element ratios and individual markers with total CARS score in ASD patients (n = 103).
MarkerSpearman ρp-Valueq-Value (FDR)R2
Li/Pb−0.34900.0003 ***0.00150.1220
Cu/Pb−0.32000.0011 **0.00280.1020
Cr/Pb−0.20900.0348 *0.04380.0440
Pb0.20900.0350 *0.04380.0440
Li−0.19400.05100.05100.0380
q-values were calculated using Benjamini–Hochberg FDR adjustment across the five pre-specified markers shown in this table. R2 is presented as ρ2 and should be interpreted descriptively for these non-parametric associations. * p < 0.05, ** p < 0.01, *** p < 0.001. Element abbreviations are defined in Table 2.
Table 5. Stratified 90th percentile analysis—within-category element elevation.
ElementControl 90%ileSevere 90%ileRatioCohen’s dEffect
TOXIC ELEMENTS
Antimony (Sb)0.150.221.54×0.193Small
Arsenic (As)22.2533.861.52×0.206Small
Uranium (U)0.030.051.43×0.329Small-Med
Lead (Pb)2.533.631.43×0.165Small
Nickel (Ni)4.375.971.37×0.256Small
PROTECTIVE ELEMENTS
Copper (Cu)20.4025.831.27×0.178Small
Lithium (Li)56.3769.801.24×0.228Small
Table 6. Distribution of top 10% element concentrations across CARS categories.
ElementSevere ASDMild-Mod ASDSubthreshold ASDControlχ2p-Value
Li35.3%11.8%11.8%41.2%2.530.47
Ni35.3%23.5%11.8%29.4%2.180.54
Pb34.8%8.7%17.4%39.1%3.760.29
As17.6%23.5%41.2%17.6%8.650.034 *
We shoe the distribution of subjects in the top 10% highest element concentrations across CARS severity categories. Chi-square tests show predominantly random distribution, with only arsenic showing significant non-random pattern (subthreshold ASD enrichment rather than severe enrichment). This paradox demonstrates that element dysregulation affects only a subset of severe ASD cases. * p < 0.05.
Disclaimer/Publisher’s Note: The statements, opinions and data contained in all publications are solely those of the individual author(s) and contributor(s) and not of MDPI and/or the editor(s). MDPI and/or the editor(s) disclaim responsibility for any injury to people or property resulting from any ideas, methods, instructions or products referred to in the content.