1. Introduction
Buried pipeline systems are important infrastructure used in many areas, primarily for transporting raw materials such as oil and natural gas, as well as for water transmission and energy transfer. The sustainability of buried pipelines is of great strategic and economic importance, especially for energy supply. In recent years, events such as global wars and pandemics have increased the importance of pipeline transportation due to sustainability issues in maritime transport. Therefore, the safety of buried pipeline systems in terms of design is of great importance. Reliable design of these systems is possible only by thoroughly evaluating the structural responses of the soil cover, surface loads, and backfill conditions on the pipe [
1].
A review of the literature reveals numerous studies on the material behavior of buried pipes and their deformation under load. The approach proposed by Marston and Anderson (1913) is considered one of the earliest theoretical models explaining soil–pipe interaction, and various analytical methods have been developed in the years that followed [
2,
3,
4,
5]. These theoretical approaches have contributed significantly to the understanding of pipeline behavior within soil. However, the classical soil–pipe interaction theories developed by Marston and Spangler are primarily based on assumptions of horizontal ground conditions, linear elastic soil behavior, plane strain, and the absence of slope-induced stress redistribution. These assumptions significantly limit their applicability to sloping ground, where asymmetric stress distributions, slope geometry effects, and complex failure mechanisms govern soil–pipe interaction behavior. Furthermore, most previous studies rely on conventional measurement techniques that cannot capture full-field deformation around the pipe, particularly in the presence of geogrid reinforcement. This limitation underscores the need for more detailed investigation of soil–pipe interaction mechanisms in geogrid-reinforced sloping ground using advanced measurement techniques such as PIV, as used in this study.
Most current studies on pipe–soil interaction assume horizontal soil [
6,
7,
8,
9]. However, due to land constraints and route requirements, foundations can be located on or near the slope. If the foundation is close to the slope crest, it significantly affects both the slope’s stability and the soil’s bearing capacity. Therefore, foundations resting on sloping soils exhibit lower bearing capacity than those on flat soil. The geometry of the slope, surcharge effects, and possible shear surfaces create a complex stress–strain behavior around the pipe [
10].
In studies of slope–pipe interaction, slope geometry and pipe location have been identified as the primary factors. Cocchetti et al. [
10,
11] investigated pipe–soil interaction during slope movements in sloping soils, using both numerical and analytical approaches. In their studies, the slope deformation algorithm, slope width, the intersection angle between the pipe and the slope, and pipe-placement geometry were considered the main factors affecting the pipe’s deformation behavior; it was shown that shear width, shear profile, pipe-friction angle, and the pipe’s position within the slope have a significant effect on the internal forces.
Tsatsis et al. [
12] investigated the structural performance of buried steel pipelines under rotational shear at the surface, showing that the pipes develop different damage modes under combined axial and bending effects and that slope geometry and elbow position increase the risk of damage. On the other hand, Li et al. [
13] developed a practical damage prediction method based on the relative stiffness parameter by defining different damage conditions in steel pipes that cross shallow translational landslides perpendicularly and thus developed practical design diagrams that allow prediction of pipe deformation and damage formation without requiring numerical modeling. Comparative studies on horizontal and sloping ground conditions are therefore important for evaluating pipeline behavior.
Zhang and Askarinejad [
14] conducted a study to estimate the ultimate external forces from slope failure acting on buried pipes at different locations within the slope. The study showed that slope stability increases the external forces on the pipe, affects the development of failure surfaces, and significantly changes the bearing capacity coefficient compared with horizontal soil conditions. Khan et al. [
15,
16] through both numerical and experimental studies, showed that buried pipes experience much larger displacements, stresses, and bending moments in sloping soils than in horizontal soils; thus, slope conditions are significantly more unfavorable for pipe behavior.
Various geosynthetic reinforcement elements are used to improve the performance of buried pipes. Geogrids, among the most important geosynthetic reinforcement materials, are widely used in reinforced soil, retaining walls, and slope stabilization for their advantages, including high strength, low cost, long-term performance, and ease of construction [
17]. Geogrid layers embedded in the soil act as tensile elements within the soil mass, improving load transfer, reducing local deformations, and distributing the stresses experienced by the pipe over a wider area. This effect is particularly evident in sloping soils, where deformations are oriented in a specific direction and failure surfaces are influenced by the slope topography [
18].
Studies on reinforcement have generally focused on buried pipes in horizontally layered soil conditions [
19,
20,
21,
22,
23,
24,
25]. Studies on geogrid reinforcement of buried pipes in sloping soil are quite limited. Corey et al. [
19] investigated pipe deformations, soil pressures, and strains on the pipe and geogrid layers of shallow-buried HDPE pipes and showed that adding geogrid layers significantly reduced longitudinal strains in the pipe walls. Bildik and Laman [
20] investigated the behavior of buried pipes in geogrid-reinforced soils and showed that different geogrid placements increased bearing capacity, reduced displacements, and significantly reduced stresses in the pipe.
El Naggar et al. [
21] investigated, both experimentally and numerically, the use of a bridging layer created by placing geogrid layers within granular fill to reduce pressure on buried infrastructure and improve the performance of fill structures. They showed that the bridging layer distributes pressure and provides greater protection to buried lines. Elshesheny et al. [
22] demonstrate that adding geogrid layers to a rigid pipe–soil system improves stress distribution, reduces deformation, and enhances load-carrying performance. Elshesheny et al. [
23] found that a geogrid layer helps reduce deformation at the soil surface. Elshesheny et al. [
24] show that varying embedment depths and geogrid layer arrangements significantly improve the performance of HDPE pipe systems under cyclic loading and decisively influence load transfer and strain behavior. Duan et al. [
25] showed that failure in the reinforced case develops more slowly, is smaller, and is more structurally stable than in the unreinforced condition.
Most existing studies in the literature focus on the bearing capacity-settlement behavior of soils, and studies aimed at determining the failure mechanism are quite limited. Although previous studies have investigated buried pipes in slopes and PIV-based geotechnical problems separately, studies combining full-field PIV analyses with buried pipe systems in reinforced sloping soils remain limited. However, PIV has been successfully applied to various geotechnical problems and has become a well-established measurement technique in the literature, enabling detailed monitoring of soil deformations. White et al. [
26] showed that digital image capture and PIV-based analysis provided much higher accuracy and reliability compared to traditional target markers and video methods.
In recent years, with the development of image-processing-based methods, the PIV technique has become widely used to reveal failure surfaces, slip zones, and deformation areas formed during pipe–soil interaction. Geo-PIV is a PIV/DIC-type method that calculates soil-particle displacement by tracking soil elements in images, does not require traditional target markers, produces many vectors, and provides accuracy close to laboratory measurements. Stanier et al. [
27] developed GeoPIV-RG, an advanced analysis method that enables high-precision determination of displacement and strain fields by monitoring the motion of specific regions in digital images. Xu et al. [
28] clearly revealed the failure mechanism of the fill behind the retaining wall, the slip deformation zones, the direction and magnitude of soil movement, and the distribution of soil pressure acting on the wall using PIV. Abdi et al. [
29] investigated soil deformation and particle displacement at the soil–geogrid interface and near the anchor element using particle image velocimetry (PIV).
While PIV has been widely and successfully applied in geotechnical model testing studies, including those of retaining walls, anchor plates, and geogrid pullout behavior [
26,
27,
28,
29], to the best of the authors’ knowledge, studies combining PIV-based full-field deformation analyses with geogrid-reinforced buried pipe systems in sloping soils have been reported only rarely in the available literature.
Despite the growing body of literature on buried pipes in slopes and on PIV-based geotechnical investigations, the combined effect of geogrid reinforcement configuration on the bearing capacity and failure mechanisms of buried pipe systems in sloping soils has not been previously investigated using full-field displacement measurement techniques. In particular, it remains unclear how geogrid placement depth and reinforcement length influence the development and extent of failure surfaces around the pipe, and whether the observed improvement in bearing capacity from load–settlement measurements corresponds to a reduction in the failure surface affecting the pipe. This study addresses these gaps by combining load–settlement analysis (BCR and SRF) with PIV-based full-field displacement and failure-surface analyses. The primary scientific contributions of this work are: (1) quantification of the effect of geogrid placement depth and length on the extent of failure surfaces developing around the buried pipe; (2) demonstration that shallow geogrid placement (Hg/B = 0.5) substantially restricts the failure surface and minimizes its impact on the pipe; and (3) elucidation of the mechanism underlying the anomalous settlement behavior observed at deeper geogrid placements (Hg/B = 1.5), where PIV revealed that the failure surface extends around the pipe despite the improvement in bearing capacity recorded by load–settlement measurements.
2. Experimental Studies
Within the scope of this study, small-scale model experiments were conducted in the laboratory to investigate the behavior of buried pipes. The experiments were carried out in a sandy soil medium, and details regarding the experimental setup are presented comprehensively below.
2.1. Test Setup
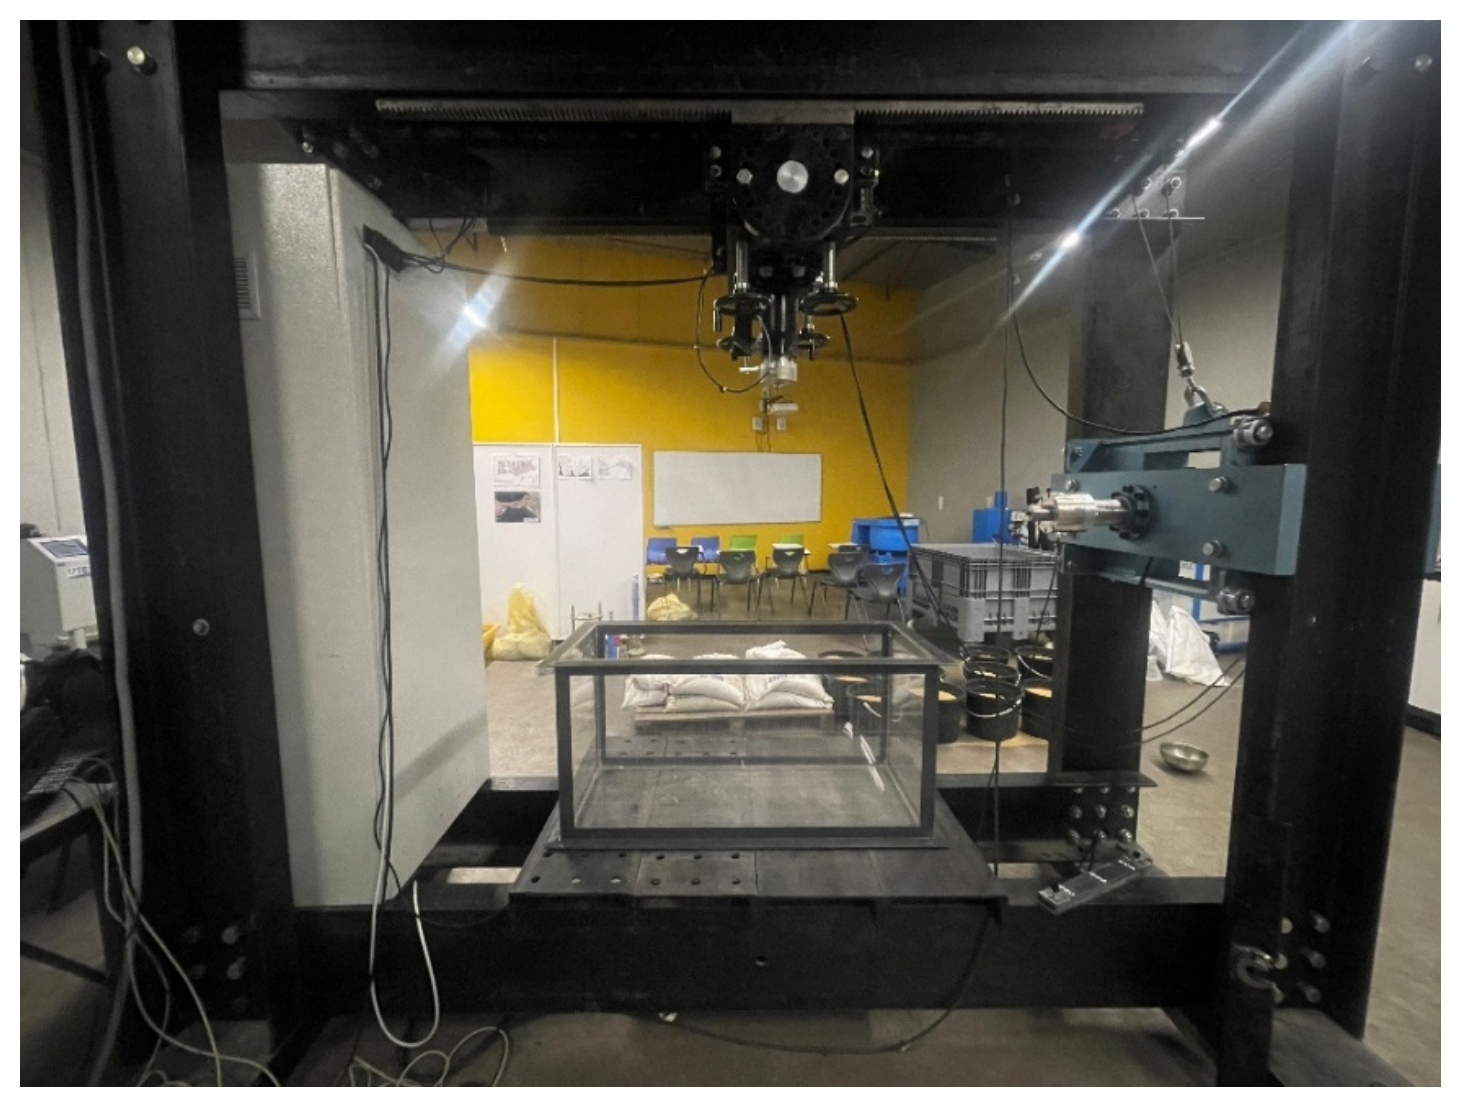
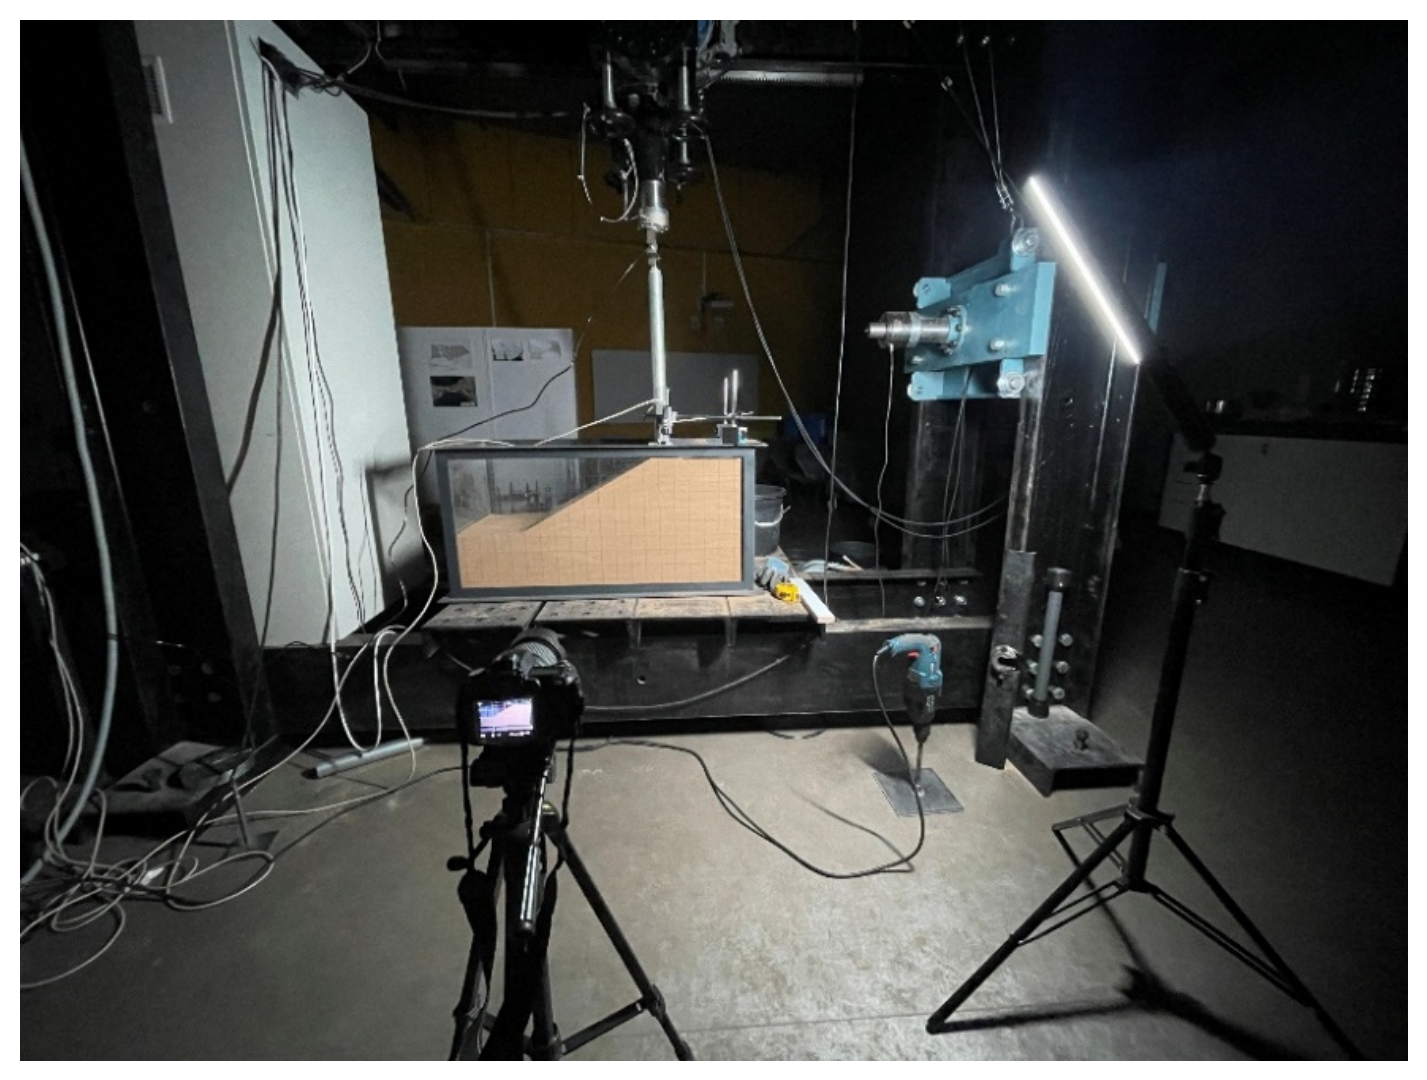
The experimental setup consists of a loading frame, a test box, a strip footing, displacement transducers, and a data acquisition unit. A general view of the loading assembly is presented in
Figure 1. The loading frame is fabricated from custom-made structural profiles and has a vertical loading capacity of 20 tons. A specially manufactured hydraulic piston is mounted on the frame to apply the vertical load; it is designed to precisely realize the loading conditions required for the experiments. The hydraulic piston can apply vertical loads with a precision ranging from 0.01 to 20.00 mm/min.
Laboratory studies were conducted within an experimental box designed to ensure plane-strain conditions. As illustrated in
Figure 1, the front, back, and side walls of the box were fabricated from Plexiglas. The dimensions of the experimental box are 100.0 cm in length, 40.0 cm in width, and 50.0 cm in depth. The suitability of these dimensions for minimizing boundary effects during the experiments was verified through numerical analyses conducted using PLAXIS 2D 2024 finite element software. Three sloped angles and two footing widths (B = 50 mm and B = 75 mm) were examined. Based on the commonly adopted criterion that the box width should be at least five times the footing width, a box width of 400 mm was used for the B = 50 mm footing in this study, corresponding to a ratio of 8B. This was considered sufficient to minimize the influence of lateral boundaries on the stress and deformation fields within the box. Plexiglas was selected for its high optical transmittance and its ability to minimize light refraction, thereby facilitating the acquisition of high-resolution images using the PIV method. The front face of the experimental box was marked with a 5 cm grid scale to serve a dual purpose: to enable accurate determination of weight–volume relationships during sand placement and to serve as a reference grid for the PIV analyses.
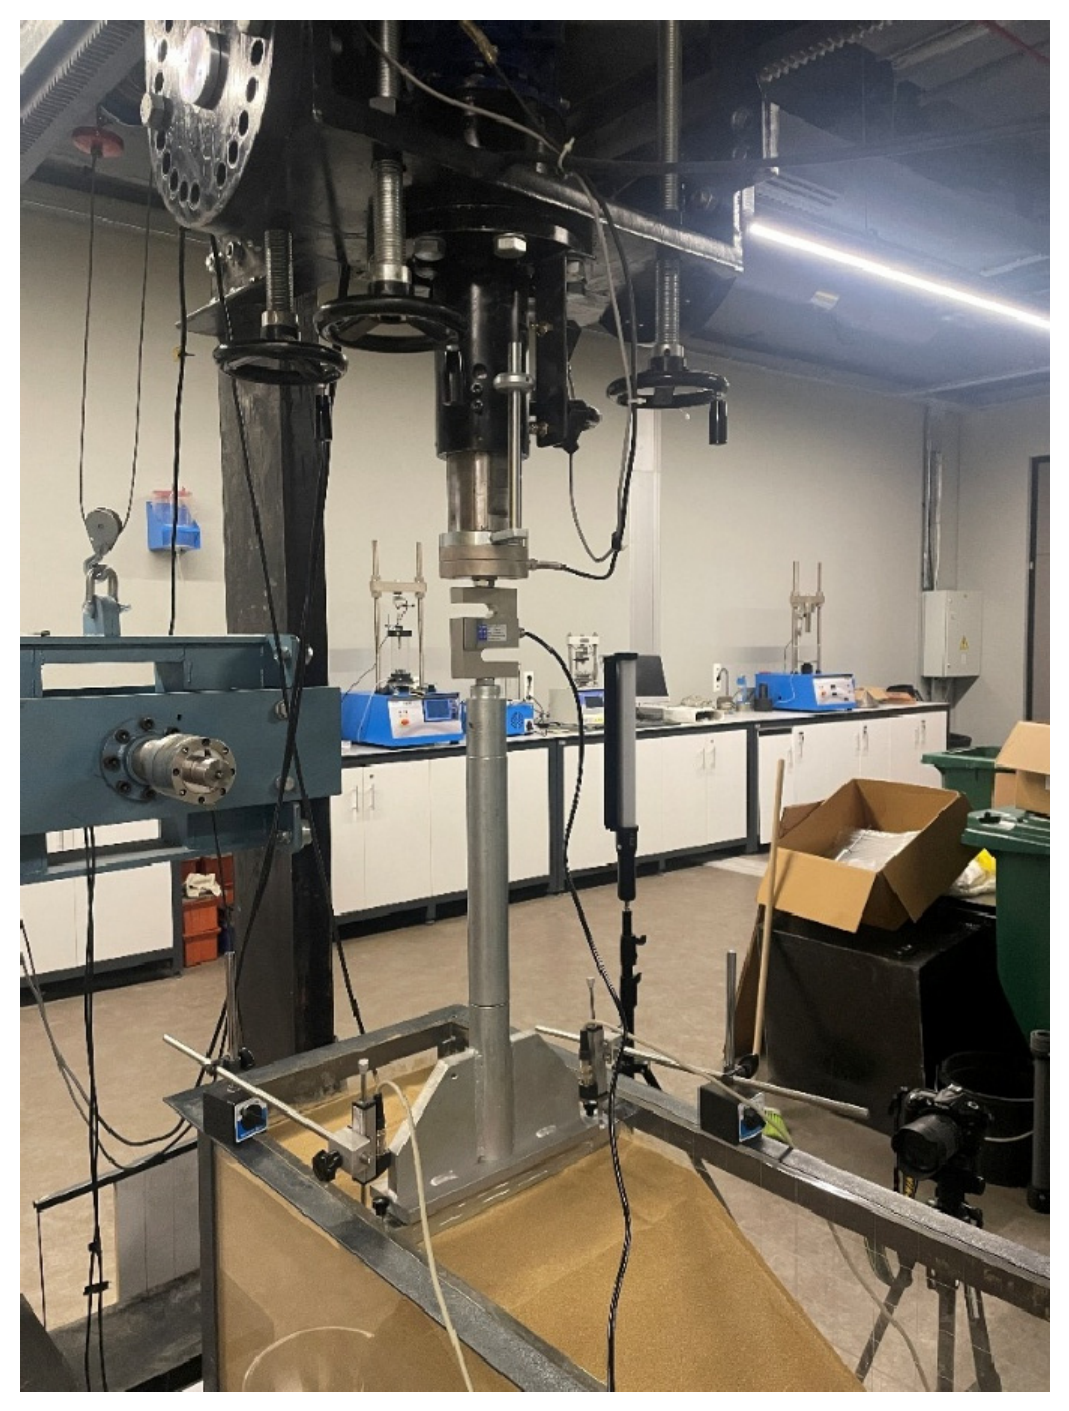
In the experiments, a strip footing fabricated from rigid steel was used to ensure uniform vertical load transfer to the soil. The strip footing measured 40.0 cm in length, 5.0 cm in width, and 2.0 cm in thickness (
Figure 2). To determine the vertical displacements of the footing during the experiments, two linear variable displacement transducers (LVDTs) with capacities of 100 mm and 150 mm were employed. Load values were measured with a digital load cell, and a TDG Testbox data logger was used to acquire the load and displacement data necessary to establish the load–displacement curves.
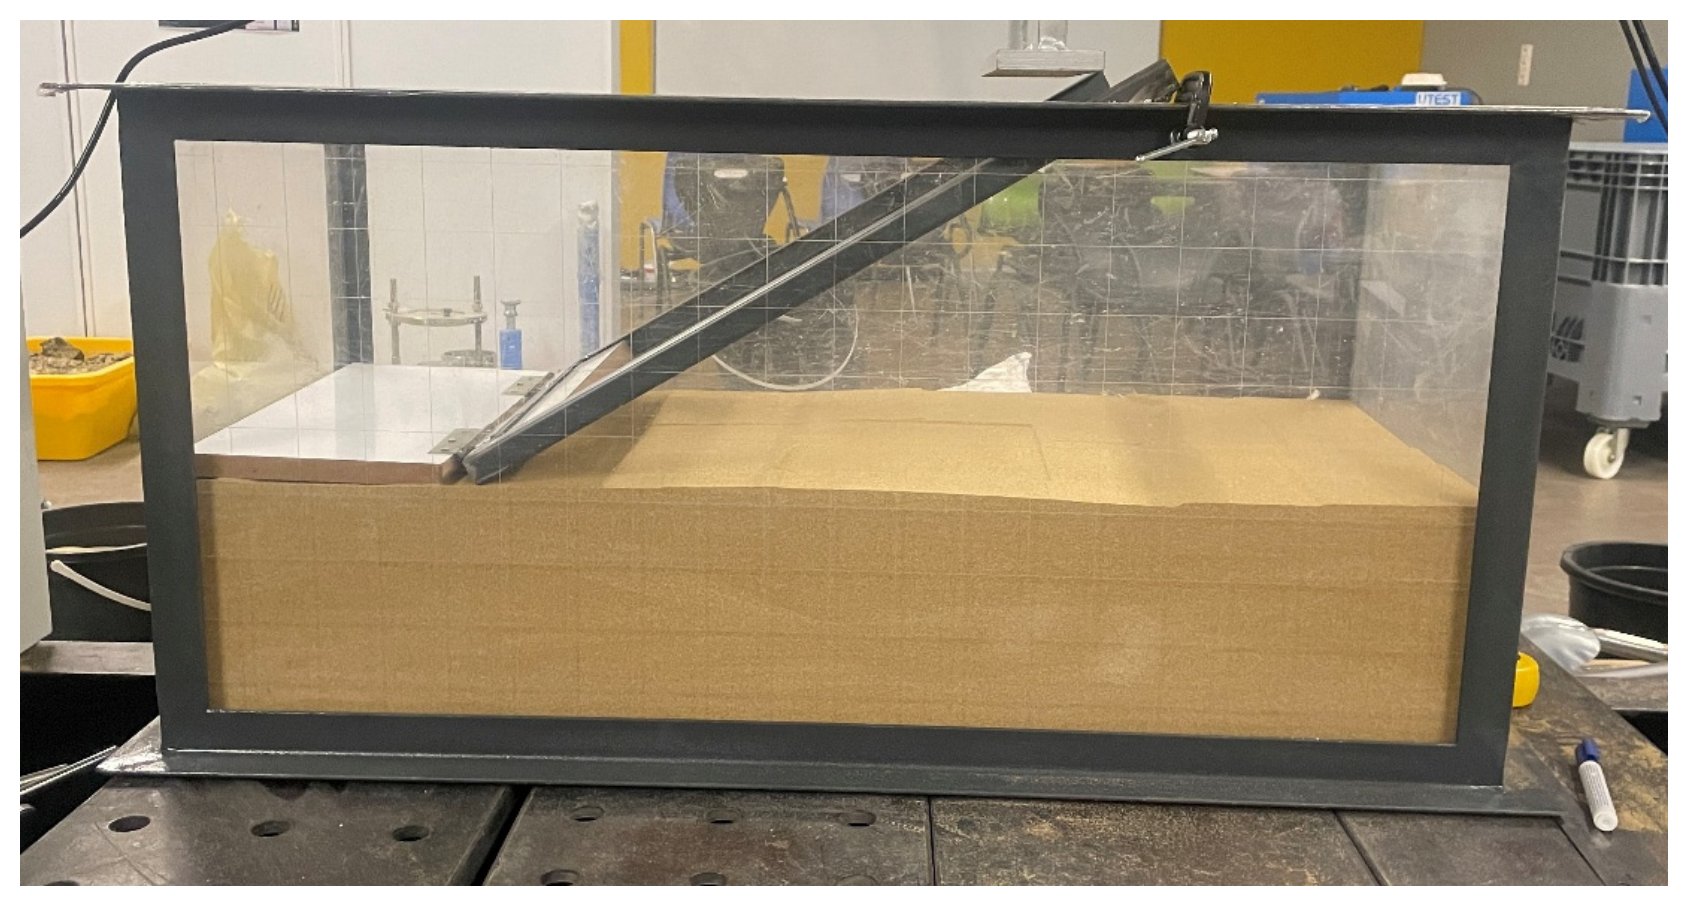
In the experiments, a specialized slope-preparation apparatus was used to create the slope geometry in a controlled, repeatable manner. Designed to preserve the slope geometry, the apparatus was held in a fixed position (
Figure 3). Before placing every 5 cm thick layer of sand, the apparatus was secured with white wooden guide plates; the sand was then spread and compacted along these plates. This ensured that the slope inclination was established accurately and consistently across all layers.
High-resolution images were acquired to analyze deformations in the foundation soil during the experiments. For this purpose, a Nikon D90 professional camera was positioned at a fixed distance from the experimental setup to ensure the accuracy of the analyses (
Figure 4). To improve image quality and provide homogeneous illumination, which is especially important for PIV analyses, a lighting system operating in sync with the camera was used. In the PIV analyses, the natural texture of the sand particles served as the tracer, eliminating the need for artificial seeding. Following the cross-correlation approach described by Brazhenko et al. [
30]. the images were divided into pixel subsets, and displacement vectors were determined by identifying the peak of the normalized cross-correlation coefficient between successive image pairs In this study, this process was implemented using the GeoPIV-RG software developed by Stanier et al. [
27]. The key PIV parameters and procedures adopted in this study are summarized in
Table 1.
2.2. Material Properties
Experiments were conducted on sandy soil. To determine the properties of the sand used in the experiments, sieve analysis, specific gravity determination, and determination of the maximum and minimum void ratios were performed in accordance with ASTM standards. Experiments to determine grain shape were also conducted. The properties of the sand are presented in
Table 2.
In the experiments, PVC pipes with a 50 mm diameter were used to determine the pipe–soil interaction. The properties of the pipe are presented in
Table 3. Experiments were also conducted on reinforced soil as part of this study. Geogrid was used as the reinforcement element, and its properties are presented in
Table 4.
2.3. Model Tests and Scale Considerations
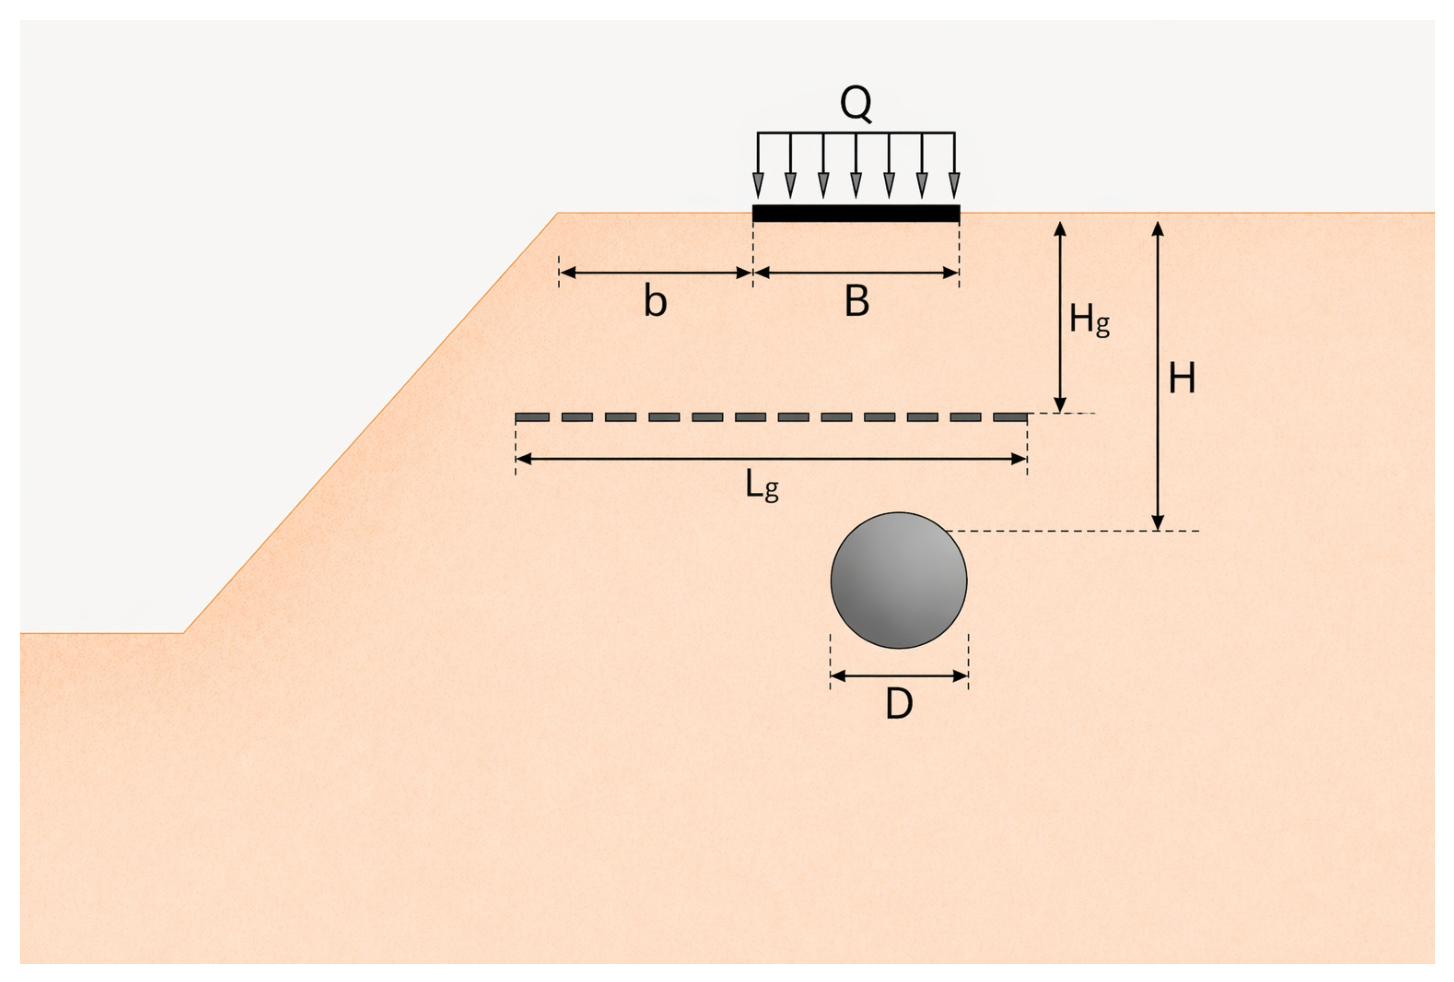
This study involved experiments to examine the behavior of pipes embedded in both reinforced and unreinforced sloping soil. During the experiments, the embedment depth was kept constant, and the pipe’s outer edge was aligned parallel to the slope crest. The pipe was placed near the slope crest at an embedment depth of H/D = 2, where H is the distance from the pipe to the soil surface, and D is the pipe diameter. The embedment depth ratio was selected based on preliminary experiments conducted as part of the broader doctoral research program. Experiments were performed under unreinforced conditions at different H/D ratios, and it was observed that H/D = 1 produced insufficient soil–pipe interaction, whereas H/D = 3 exhibited behaviors approaching that of the slope without a pipe. Therefore, H/D = 2 was identified as the most representative value for soil–pipe interaction behavior and was kept constant throughout all experiments. This value is also consistent with those adopted in existing experimental studies on buried pipes in sloping soils [
14,
31]. In addition, the strip footing was placed directly at the slope crest, corresponding to b/B = 0, where b is the horizontal distance from the footing centerline to the slope crest, and B is the footing width. The general configuration of the experimental setup and the geometric parameters of the model are schematically illustrated in
Figure 5. All experiments were conducted on a slope with an inclination angle of 30°. Before starting the experiment, the slope apparatus was placed in the test box, and the amount of sand to be used was determined using the scaled lines in the test box. The sand was then placed in the test box to the desired density. After reaching the level where the pipe would be placed, the pipe was positioned and secured with a special apparatus, and the box was then filled with sand. Then, strip footing and measurement systems (load cell, LVDTs, and PIV systems) were installed. The experiment was conducted, and data was collected using a datalogger. The same experimental procedure was performed for both unreinforced and reinforced soils. In all experiments, the relative density of the sandy soil was kept constant at D
r = 65%.
Seven model tests were carried out in this study. One test was performed without reinforcement to assess the effect of the geogrid. Subsequently, the geogrid reinforcement length was fixed at five times the foundation width (L
g/B = 5), while the geogrid layer was placed at three different depths (H
g/B = 0.5, 1.0, and 1.5). Here, H
g indicates the initial reinforcement depth, and B denotes the strip footing width. In the initial reinforcement-depth tests, the greatest increase in bearing capacity was observed at H
g/B = 0.5. In other tests, the initial reinforcement depth was fixed, and reinforcement lengths of L
g/B = 3, 5 and 7 were used to study the effect of reinforcement length. The experimental setup is detailed in
Table 5. The test condition with L
g/B = 5 and H
g/B = 0.5 was included in both test series as a common reference case to ensure consistency and allow direct comparison between the effects of reinforcement depth and length.
The results of the experiments were evaluated using dimensionless parameters. For this purpose, the dimensionless factors bearing capacity ratio (
BCR) and settlement reduction factor (
SRF) were used. These factors are presented in Equations (1) and (2).
Qreinforced = Ultimate Bearing Capacity in Reinforced Soil
Q
unreinforced = Ultimate Bearing Capacity in Unreinforced Soil
Sreinforced = Settlement in Reinforced Soil
Sunreinforced = Settlement in Unreinforced Soil
BCR is the ratio of the ultimate base pressure of the reinforced case to that of the unreinforced case, with the ultimate base pressure defined as the peak on the load–settlement curve. SRF is the ratio of the settlement ratio (s/B) of the reinforced case to that of the unreinforced case, both evaluated at the same base pressure level corresponding to the ultimate bearing capacity of the unreinforced condition (q = 10.63 kN/m2). The settlement ratio (s/B) is the footing settlement normalized by the footing width, expressed as a percentage.
Because the experiments were conducted as 1 g small-scale physical model tests, the results are intended primarily to provide a comparative assessment of how geogrid placement depth and reinforcement length affect the behavior of buried pipes in sloping ground, rather than direct prototype-scale predictions. Similar approaches are commonly used in geotechnical physical modeling studies to investigate soil–structure interaction mechanisms and deformation behavior under controlled laboratory conditions [
18,
20,
32]. To minimize scale-related effects, the experimental program was designed using dimensionless parameters, including H/D, b/B, H
g/B, L
g/B,
BCR, and
SRF. All experiments were performed under controlled conditions with the same pipe, geogrid, and soil properties, maintaining a constant relative density. Although complete similitude between the model and prototype, particularly regarding the stiffness and strength scaling of the pipe and geogrid materials, cannot be fully achieved in 1 g small-scale physical model tests, the adopted methodology enables reliable comparison of deformation mechanisms, displacement behavior, bearing capacity improvement, and settlement reduction among the tested configurations. Similar limitations and comparative evaluation approaches have also been reported in previous experimental and centrifuge modeling studies on reinforced soil systems and soil–structure interaction problems [
32,
33]. Several parameters may influence the quantitative transferability of the results to prototype scale, including pipe stiffness, pipe diameter, soil particle size relative to pipe diameter (D 50/D 0.005), geogrid aperture size relative to soil particle size, footing width, and embedment depth. These parameters were not explicitly scaled in the present study. Nevertheless, the use of dimensionless parameters helps reduce direct scale dependency, and the findings are primarily intended for mechanism interpretation and relative comparison among the tested configurations rather than direct prototype-scale design.
It is also acknowledged that scale effects may arise due to the ratio between sand grain size and model dimensions—known as the ‘particle size effect’. In the present study, D50/D = 0.26/50 ≈ 0.005, which significantly exceeds the commonly recommended minimum threshold of 30–50, indicating that grain-size scaling effects are unlikely to have a significant influence on the results. Nevertheless, the low stress levels inherent to 1 g tests may introduce differences compared to prototype conditions; however, the consistent use of the same materials and boundary conditions across all tests ensures reliable comparative assessment of the deformation mechanisms and reinforcement effects investigated.
Although the number of experimental configurations investigated in this study is limited, the primary objective of the experimental program was to investigate the deformation and failure mechanisms governing pipe–soil interaction in reinforced sloping ground using PIV-based full-field analyses, rather than to conduct extensive parametric optimization. Each experiment produced a series of high-resolution images throughout the loading process, enabling detailed evaluation of displacement evolution and failure surface development.
3. Results and Discussion
In this study, the effects of reinforcement (geogrid) placement depth and length in pipes embedded in reinforced-slope soil were investigated experimentally. Experimental results were evaluated using the bearing capacity ratio (BCR) and the settlement reduction factor (SRF), and failure mechanisms were determined and interpreted through PIV analyses. The results are presented below.
3.1. Effect of Geogrid Placement Depth (Hg/B)
In this series of experiments, conducted to investigate the effect of the initial reinforcement depth on a sloped soil surface, the geogrid length was kept constant at L
g/B = 5, and the geogrid was placed within the soil at various installation depths. The initial geogrid was positioned within the slope at H
g/B ratios of 0.5, 1.0, and 1.5. Throughout the experiments, the pipe embedment depth and soil relative density were held constant at H/D = 2 and D
r = 65%, respectively. During the loading phase, footing base pressure and settlement were measured, and the resulting data were converted into the dimensionless parameters
BCR and
SRF. The results from experiments investigating the effect of the initial geogrid depth are presented in
Table 6 as
BCR and
SRF values.
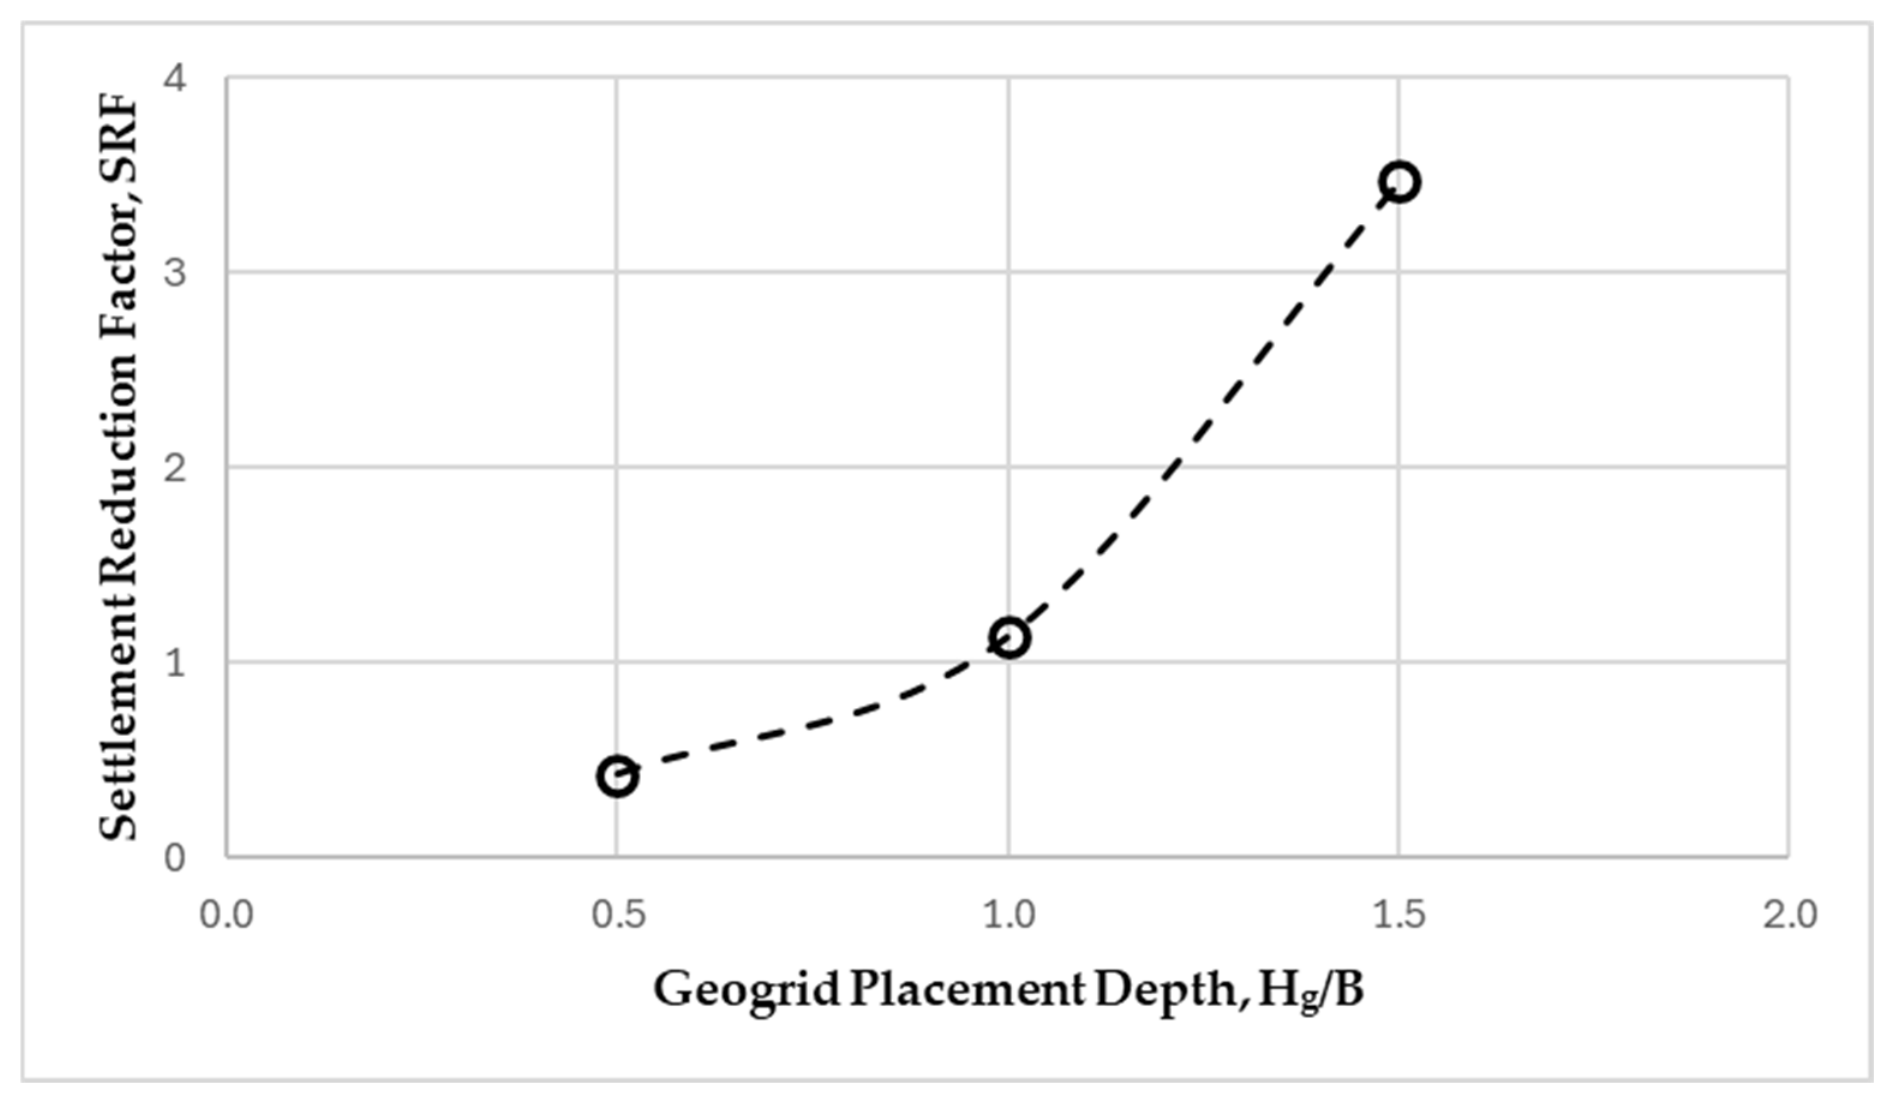
The relationship between the depth of the first geogrid layer and the
BCR is shown in
Figure 6, while the relationship between the depth of the first geogrid layer and the
SRF is shown in
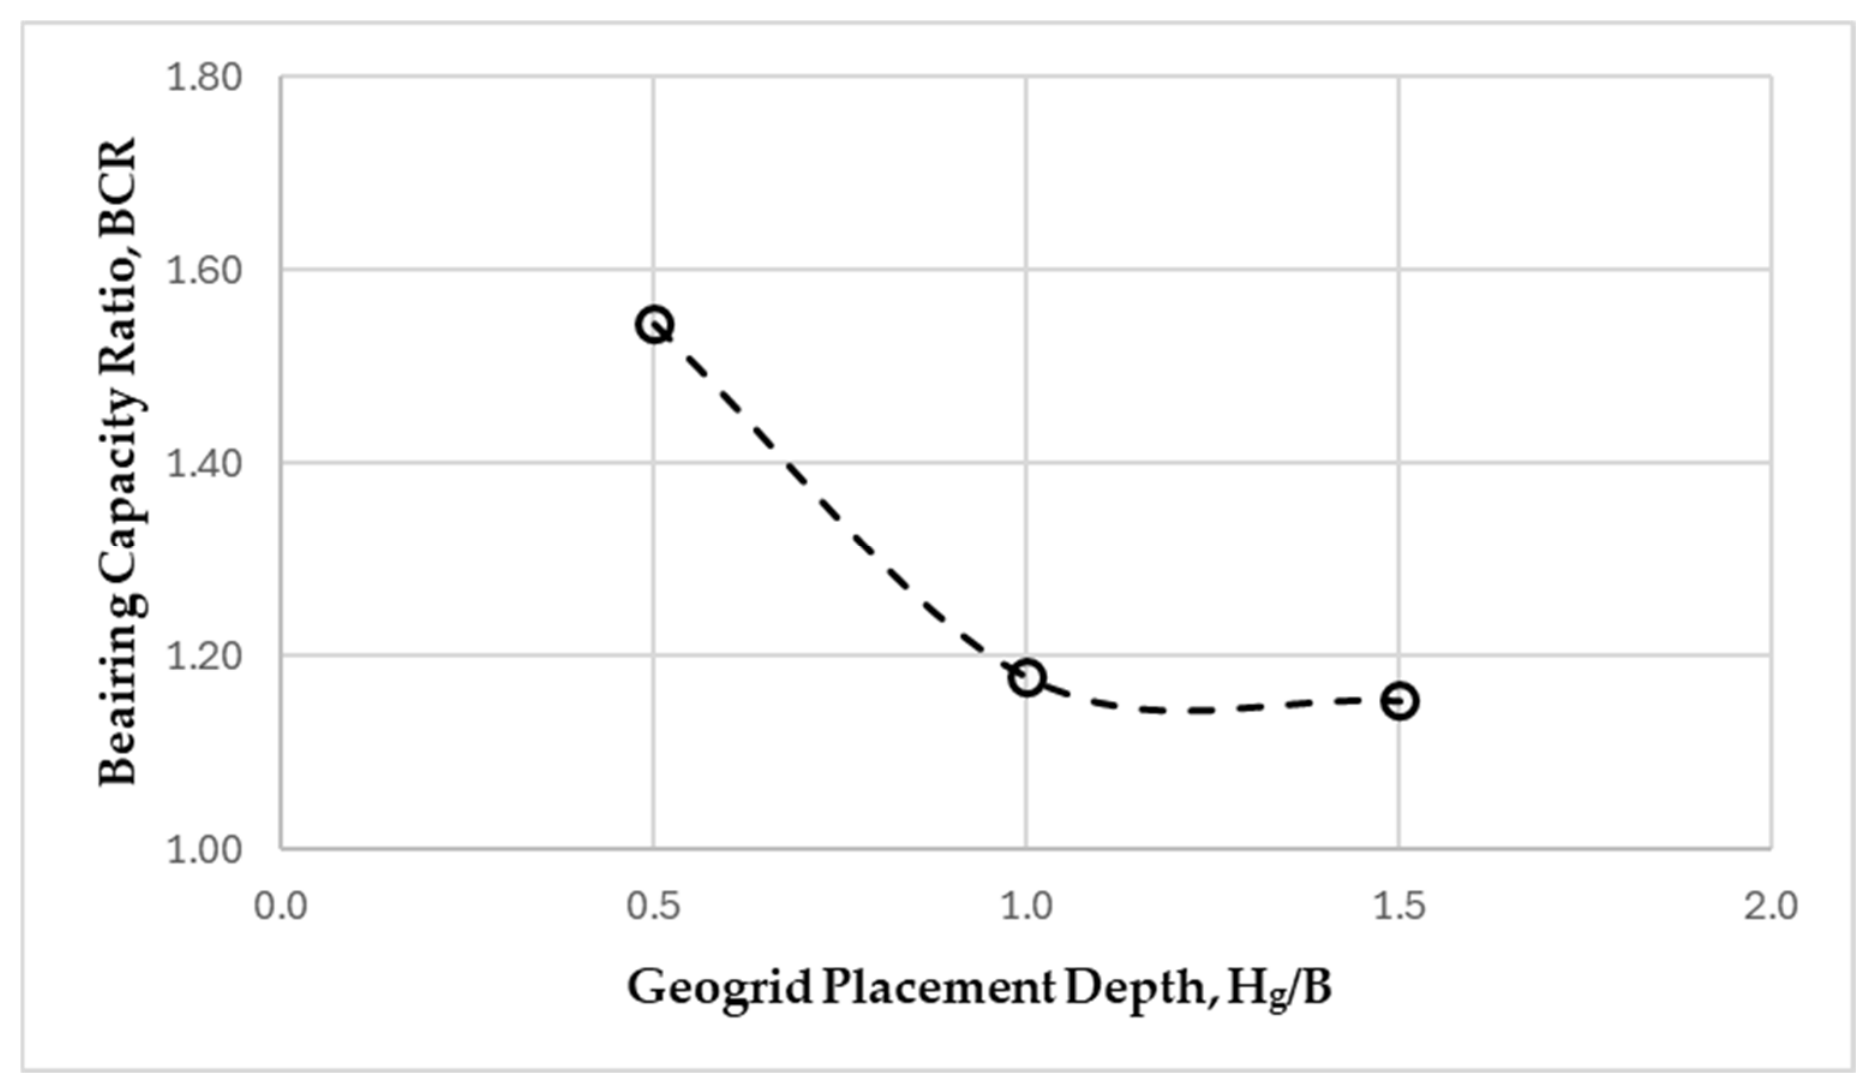
Figure 7. When the geogrid is placed at a depth of H
g/B = 0.50, the bearing capacity increases by 54% compared to the unreinforced case, and settlements decrease by 57%. As the embedment depth of the first geogrid layer increases, the gains in bearing capacity and reductions in settlement diminish relative to the H
g/B = 0.50 case. When the geogrid placement depth exceeds H
g/B = 0.50, vertical and horizontal soil displacements increase within the region between the foundation and the geogrid, leading to a reduction in bearing capacity. Consequently, a first geogrid embedment depth of H
g/B = 0.50 was identified as the most favorable value among the tested conditions. It should be noted that at a geogrid placement depth of H
g/B = 1.5, settlement values exceeded those of the unreinforced case despite the observed increase in bearing capacity.
The experimental results indicate that the Hg/B = 1.5 configuration increased the ultimate bearing capacity (BCR = 1.153) but also significantly raised the settlement ratio compared with the unreinforced case (s/B = 13.89% vs. 2.91%). This apparent paradox can be explained by the fact that BCR and SRF reflect fundamentally different stages of soil behavior. BCR is governed by the ultimate bearing capacity, whereas SRF is evaluated at a specific service load level; consequently, it is physically consistent for one criterion to improve while the other deteriorates.
At Hg/B = 1.5, the load–settlement response occurs in two distinct stages. In the first stage, before the geogrid engages, the soil between the foundation and the geogrid (approximately 1.5 B thick) deforms freely without geogrid support, accumulating irrecoverable settlement. In the second stage, the geogrid mobilizes tensile resistance and improves ultimate bearing capacity but cannot compensate for the settlement accumulated in the first stage. Furthermore, at this deeper placement, the proximity of the geogrid to the pipe crown may have altered the local stress transfer mechanism within the soil mass. This may have restricted the homogeneous distribution of stresses and potentially promoted localized stress redistribution around the pipe region. While the geogrid provided resistance against ultimate failure, it may have simultaneously contributed to differential deformation within the soil mass surrounding the pipe. The widening stress propagation cone beneath the foundation may extend the influence zone toward the pipe region at this depth, transferring additional stresses to the surrounding soil and further increasing deformations. The asymmetric stress distribution inherent to the 30° slope geometry exacerbates this behavior by orienting the stress cone toward the slope, a mechanism less likely to develop under horizontal ground conditions. As the geogrid moves away from the critical shear and stress propagation zone, the effectiveness of the geogrid–soil interlocking mechanism in controlling deformation diminishes, which is consistent with the existence of a most favorable reinforcement depth. The PIV-based failure surface contours further demonstrate that the extent of the failure surface increases with increasing geogrid placement depth and that at Hg/B = 1.5, the failure surface extends around the pipe—consistent with the anomalous settlement values recorded in this configuration.
3.2. Effect of Geogrid Length (Lg/B)
In this series of experiments, the effect of geogrid length was investigated by keeping the depth of the first reinforcement layer constant at H
g/B = 0.5 while varying the geogrid length. The geogrid length, L
g/B, was set to 3, 5, and 7 to assess its influence on bearing capacity and settlement. Throughout the experiments, the pipe embedment depth and soil relative density were kept constant at H/D = 2 and D
r = 65%, respectively. During the loading phase, foundation base pressure and settlement were measured, and the results were converted into dimensionless parameters
BCR and
SRF. The results of the experiments investigating the effect of geogrid length are presented in
Table 7 as
BCR and
SRF values.
The relationship between geogrid length and
BCR is presented in
Figure 8, while the relationship with
SRF is presented in
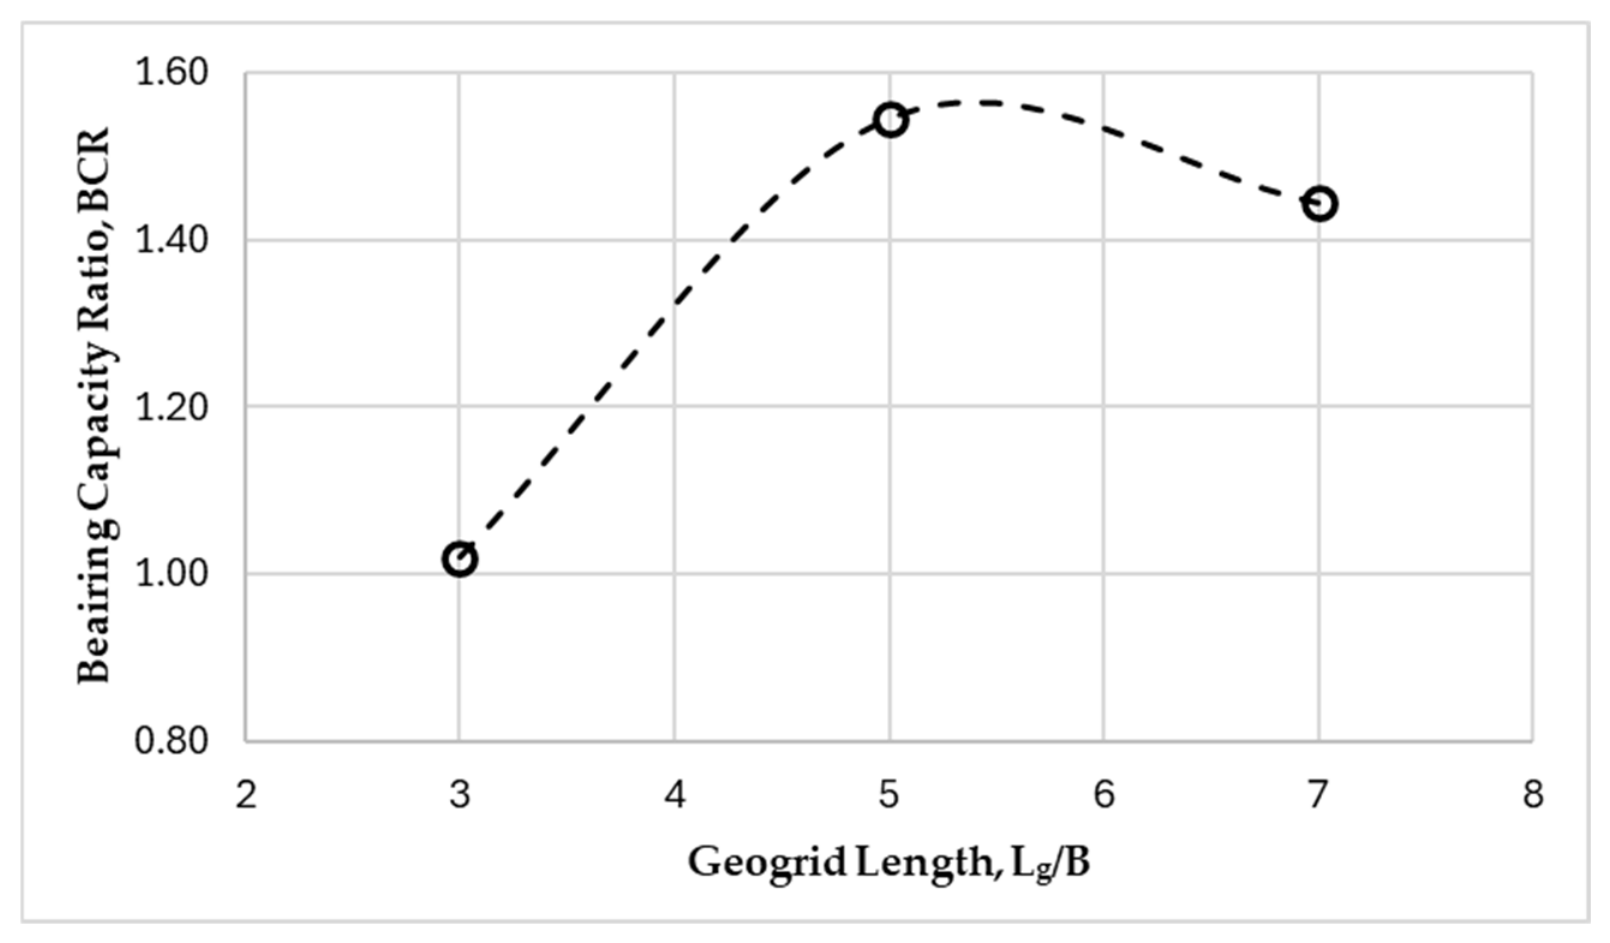
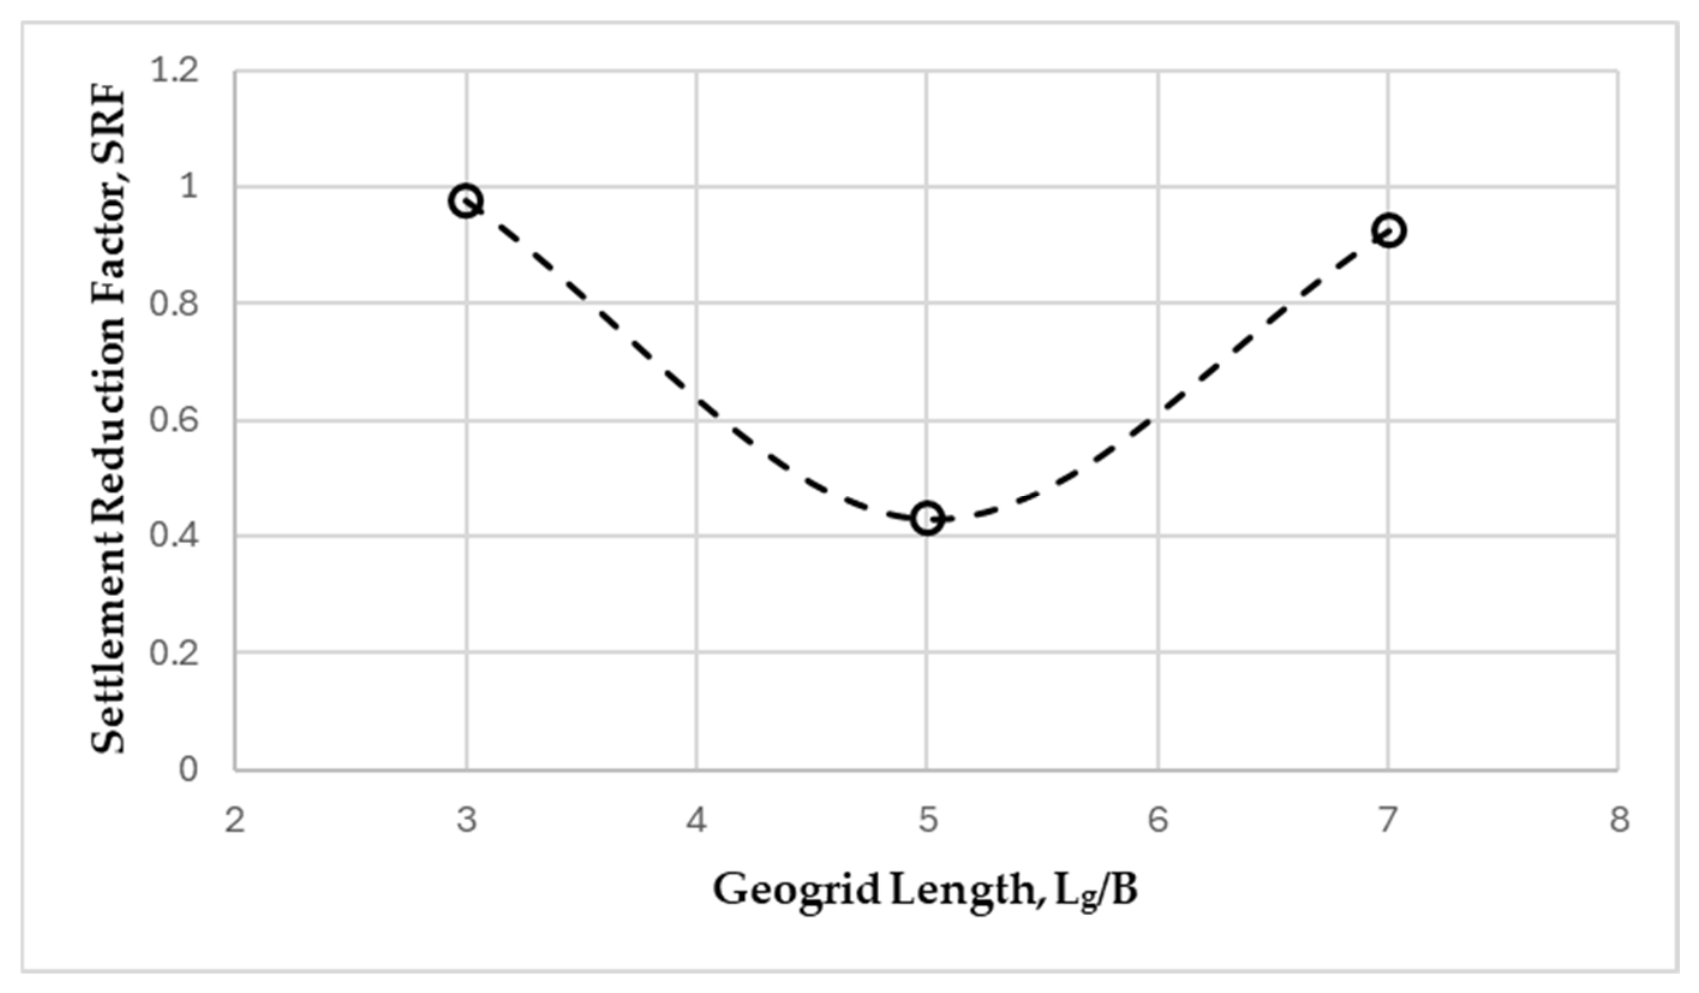
Figure 9. As the geogrid length increased from L
g/B = 3 to L
g/B = 5, the
BCR increased, while the
SRF decreased. However, during the transition from L
g/B = 5 to L
g/B = 7, the
BCR decreased, while the
SRF increased. Consequently, the best-performing condition under the present experimental conditions was achieved when the geogrid length was L
g/B = 5. Under this condition (where the geogrid length was L
g/B = 5), the bearing capacity increased by 54% compared to the unreinforced case, and settlements decreased by 57%.
The decrease in BCR and increase in SRF observed during the transition from Lg/B = 5 to Lg/B = 7 can be attributed to several mechanisms. As the geogrid length increases beyond the most favorable value among the tested conditions, the geogrid tip approaches the slope surface, where the available passive resistance zone diminishes due to the reduced soil mass on the slope side. Consequently, the geogrid cannot be effectively anchored, reducing its contribution to bearing capacity improvement. Furthermore, the extended geogrid length may promote localized stress redistribution rather than distribute deformations uniformly, thereby increasing settlement. This behavior is consistent with the existence of a most favorable reinforcement length under sloping ground conditions, beyond which additional reinforcement length results in reduced reinforcement efficiency.
3.3. Evaluation of Geogrid Configuration with PIV Analyses
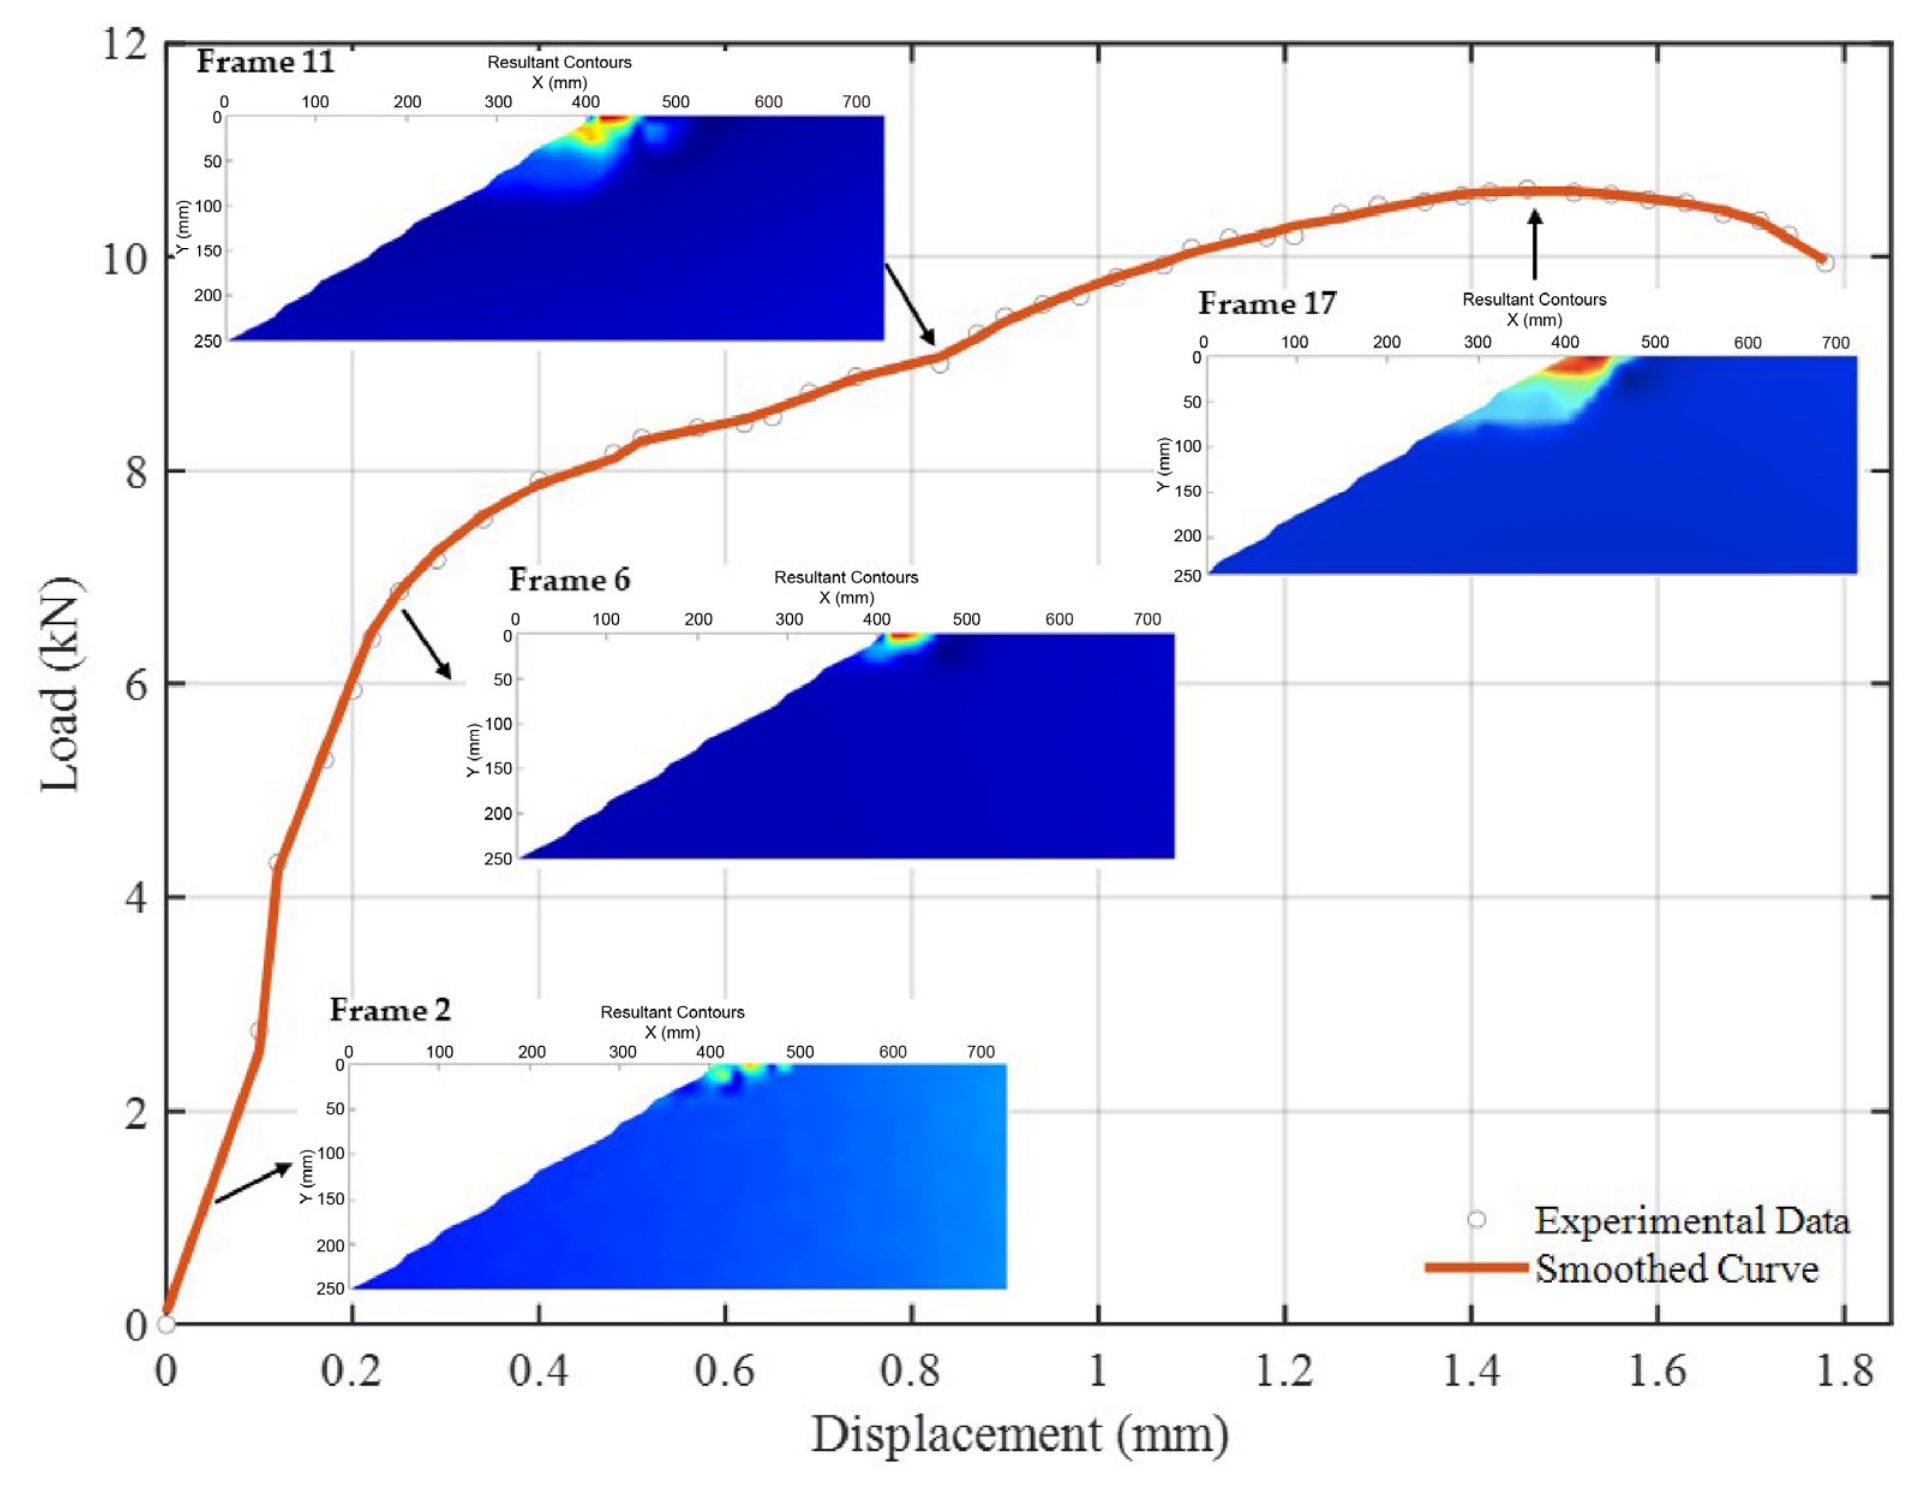
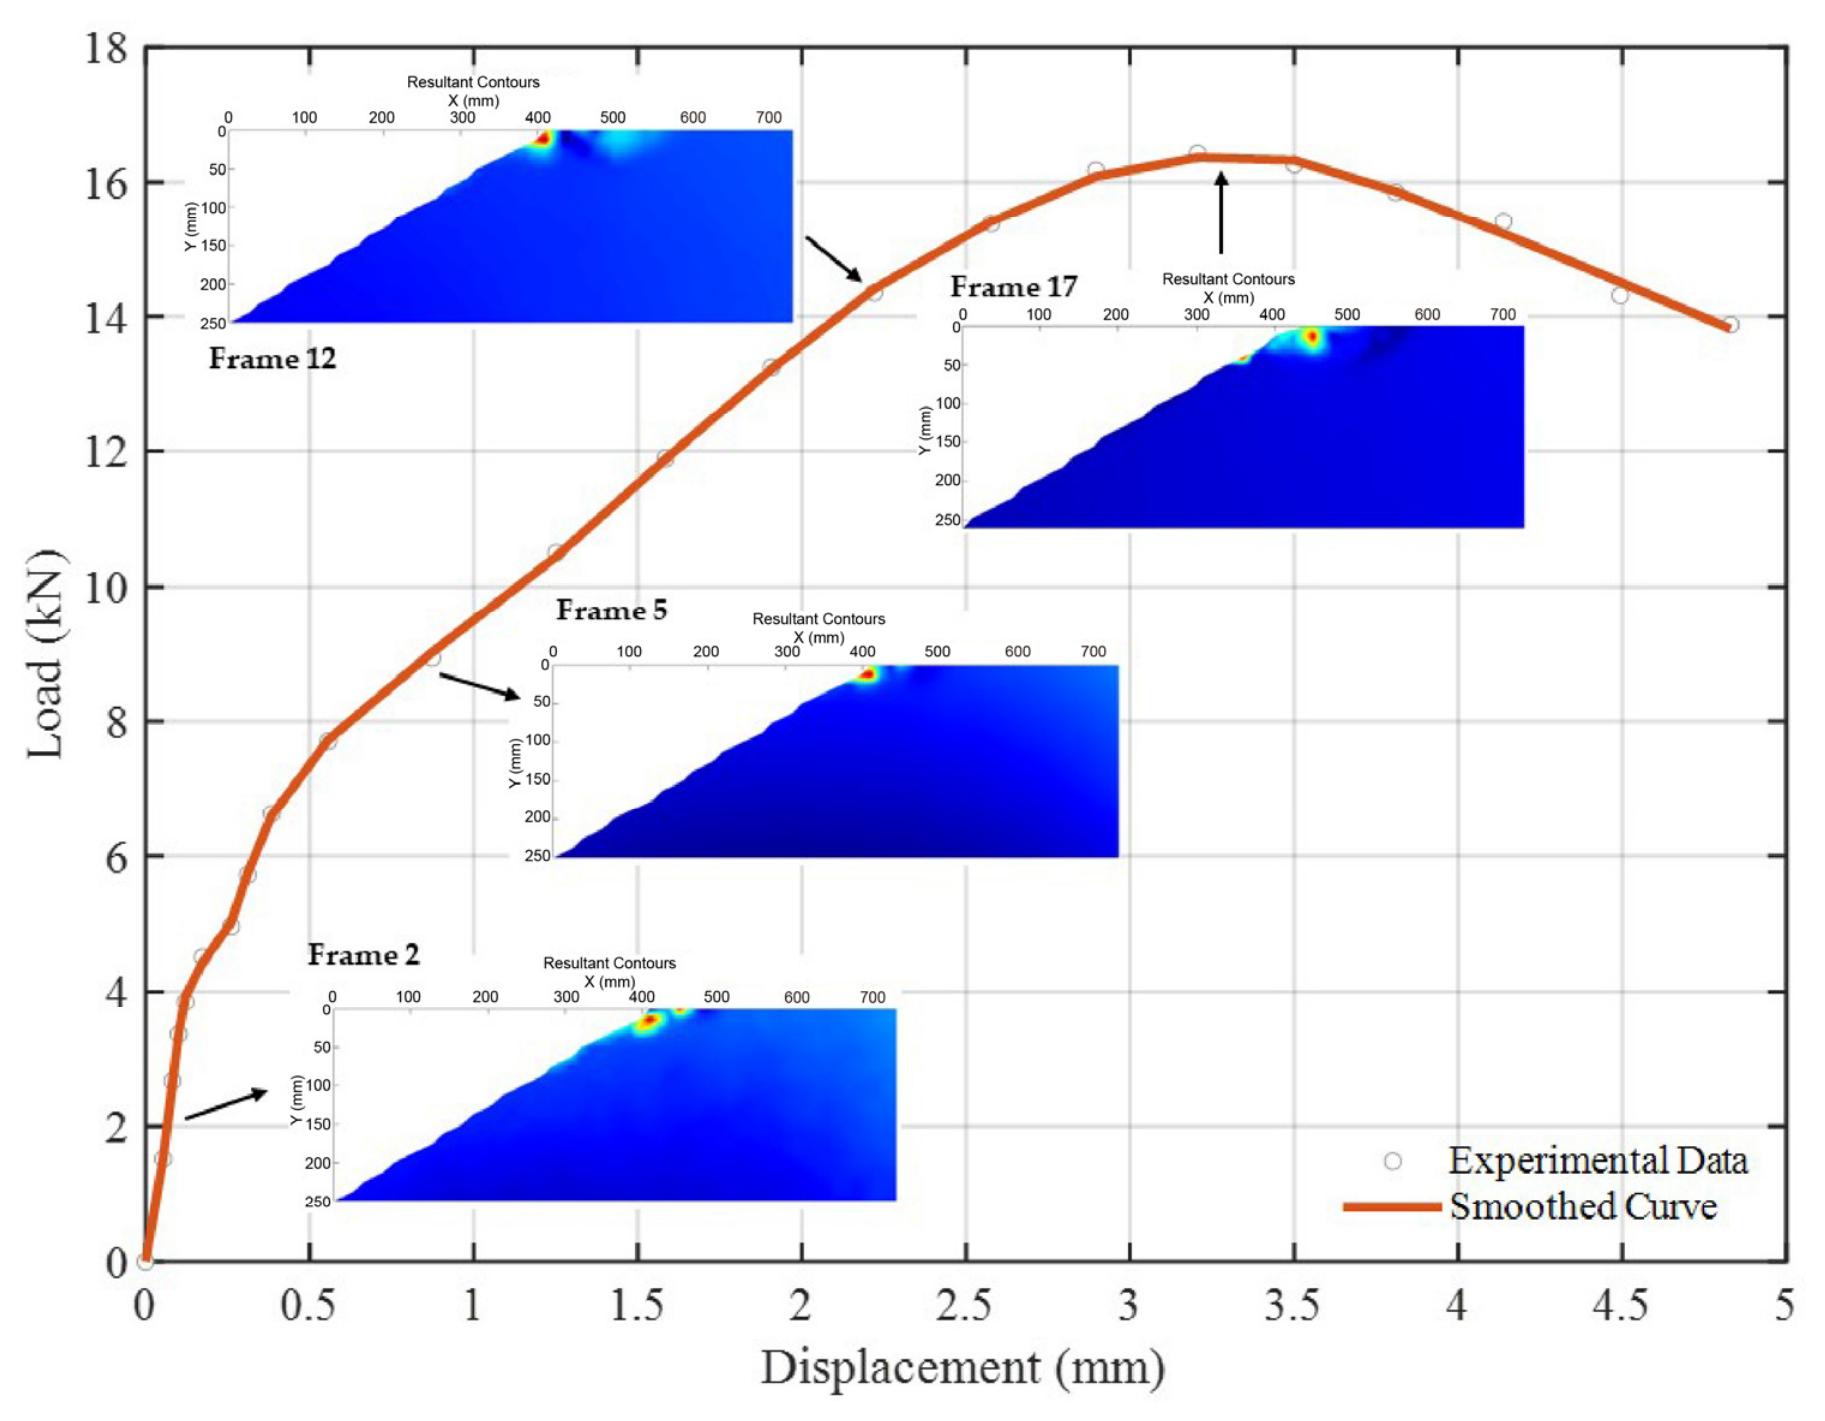
This section presents the PIV-based analysis of how geogrid configurations (specifically, the geogrid’s initial placement depth and length) affect pipes embedded in slopes. In addition to parameters such as bearing capacity and settlement, the study used Particle Image Velocimetry (PIV) to identify the failure surfaces developing within the slope and to assess their impact on the pipe. The PIV results were analyzed separately to assess the distinct effects of initial reinforcement depth and reinforcement length and were subsequently compared with the unreinforced condition. To illustrate the evolution of the displacement field during the loading process, PIV-based total displacement contours at four representative loading stages (early loading, intermediate, pre-failure, and failure) are presented for the unreinforced (T1) and best-performing reinforced (T2, H
g/B = 0.5, L
g/B = 5) cases in
Figure 10 and
Figure 11, respectively. These stages are indicated directly on the load–displacement curves to provide a clear reference for each loading condition. The results demonstrate that in the unreinforced case, the displacement field progressively expands from the slope crest towards the pipe as loading increases. In contrast, the best-performing reinforced case shows a significantly more limited displacement field throughout the entire loading process, confirming the effectiveness of geogrid reinforcement in controlling soil movement around the pipe.
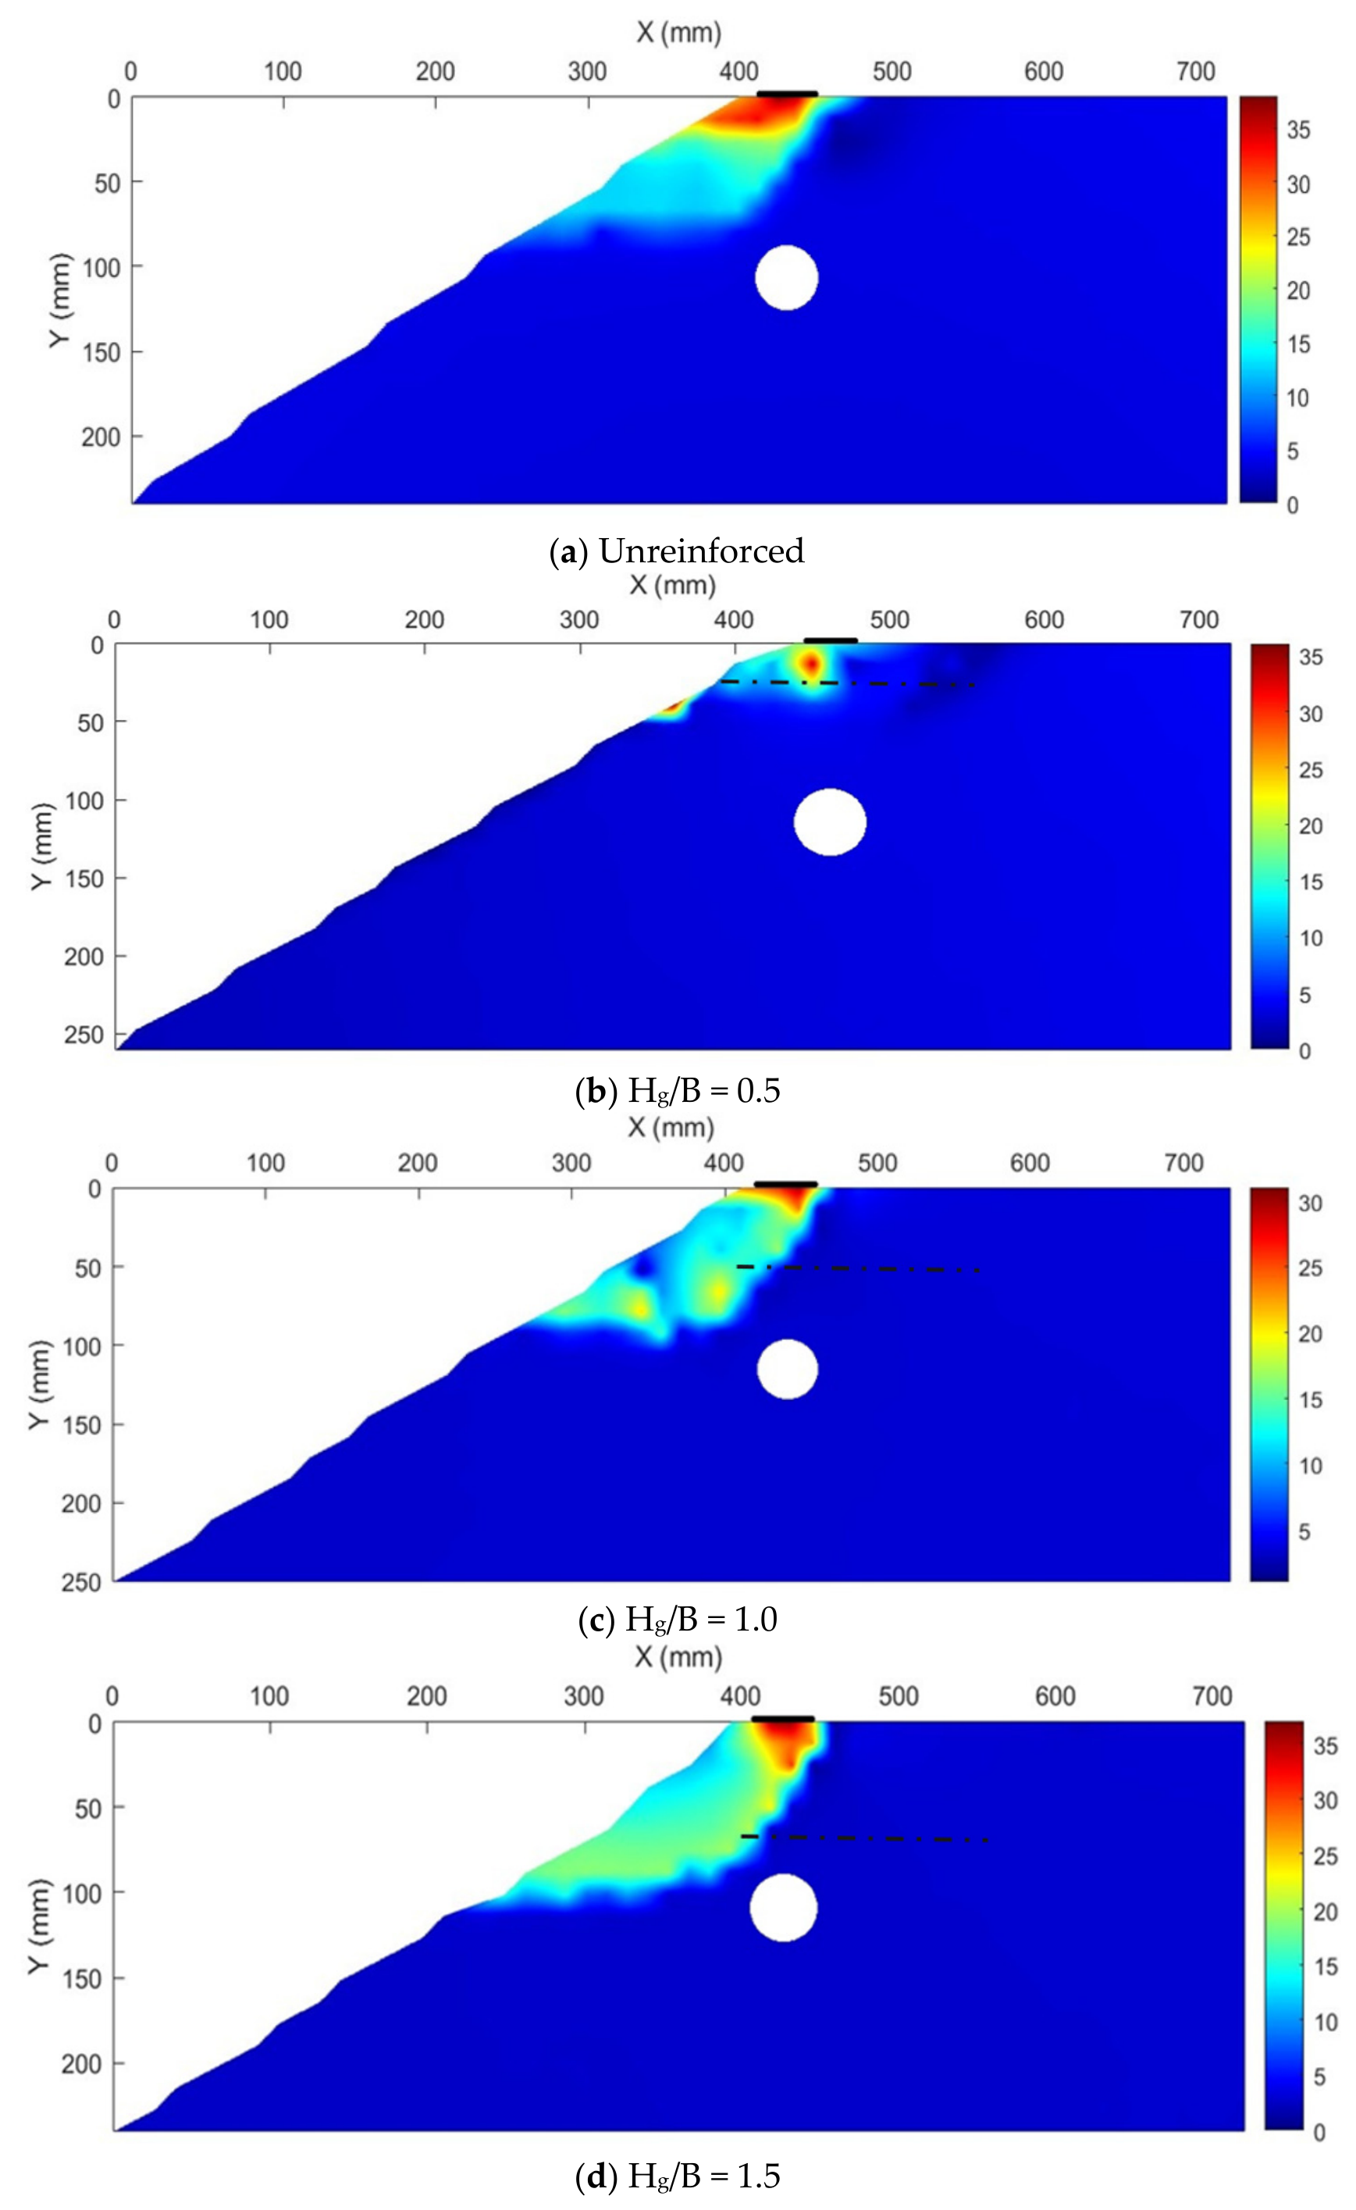
In experiments investigating the effect of the installation depth of the first geogrid layer, high-resolution photographs were captured throughout the loading process, and subsequent failure surfaces were identified using the GeoPIV-RG software. The validity of the PIV results was supported by the agreement between the observed deformation patterns and those reported in similar experimental studies on slope–pipe interaction systems [
34]. No quantitative displacement validation was performed; the PIV analyses were intended for comparative assessment of failure surface development across geogrid configurations rather than absolute displacement measurement. The resulting total displacement contours are presented in
Figure 12. An examination of the total displacement contours obtained from the PIV analyses reveals that, in the unreinforced case shown in
Figure 12a, distinct displacement zones emerged at the crest of the slope. When the first geogrid was positioned at a depth of H
g/B = 0.5, deformations occurred predominantly within the geogrid, limiting the deformation zone surrounding the pipe.
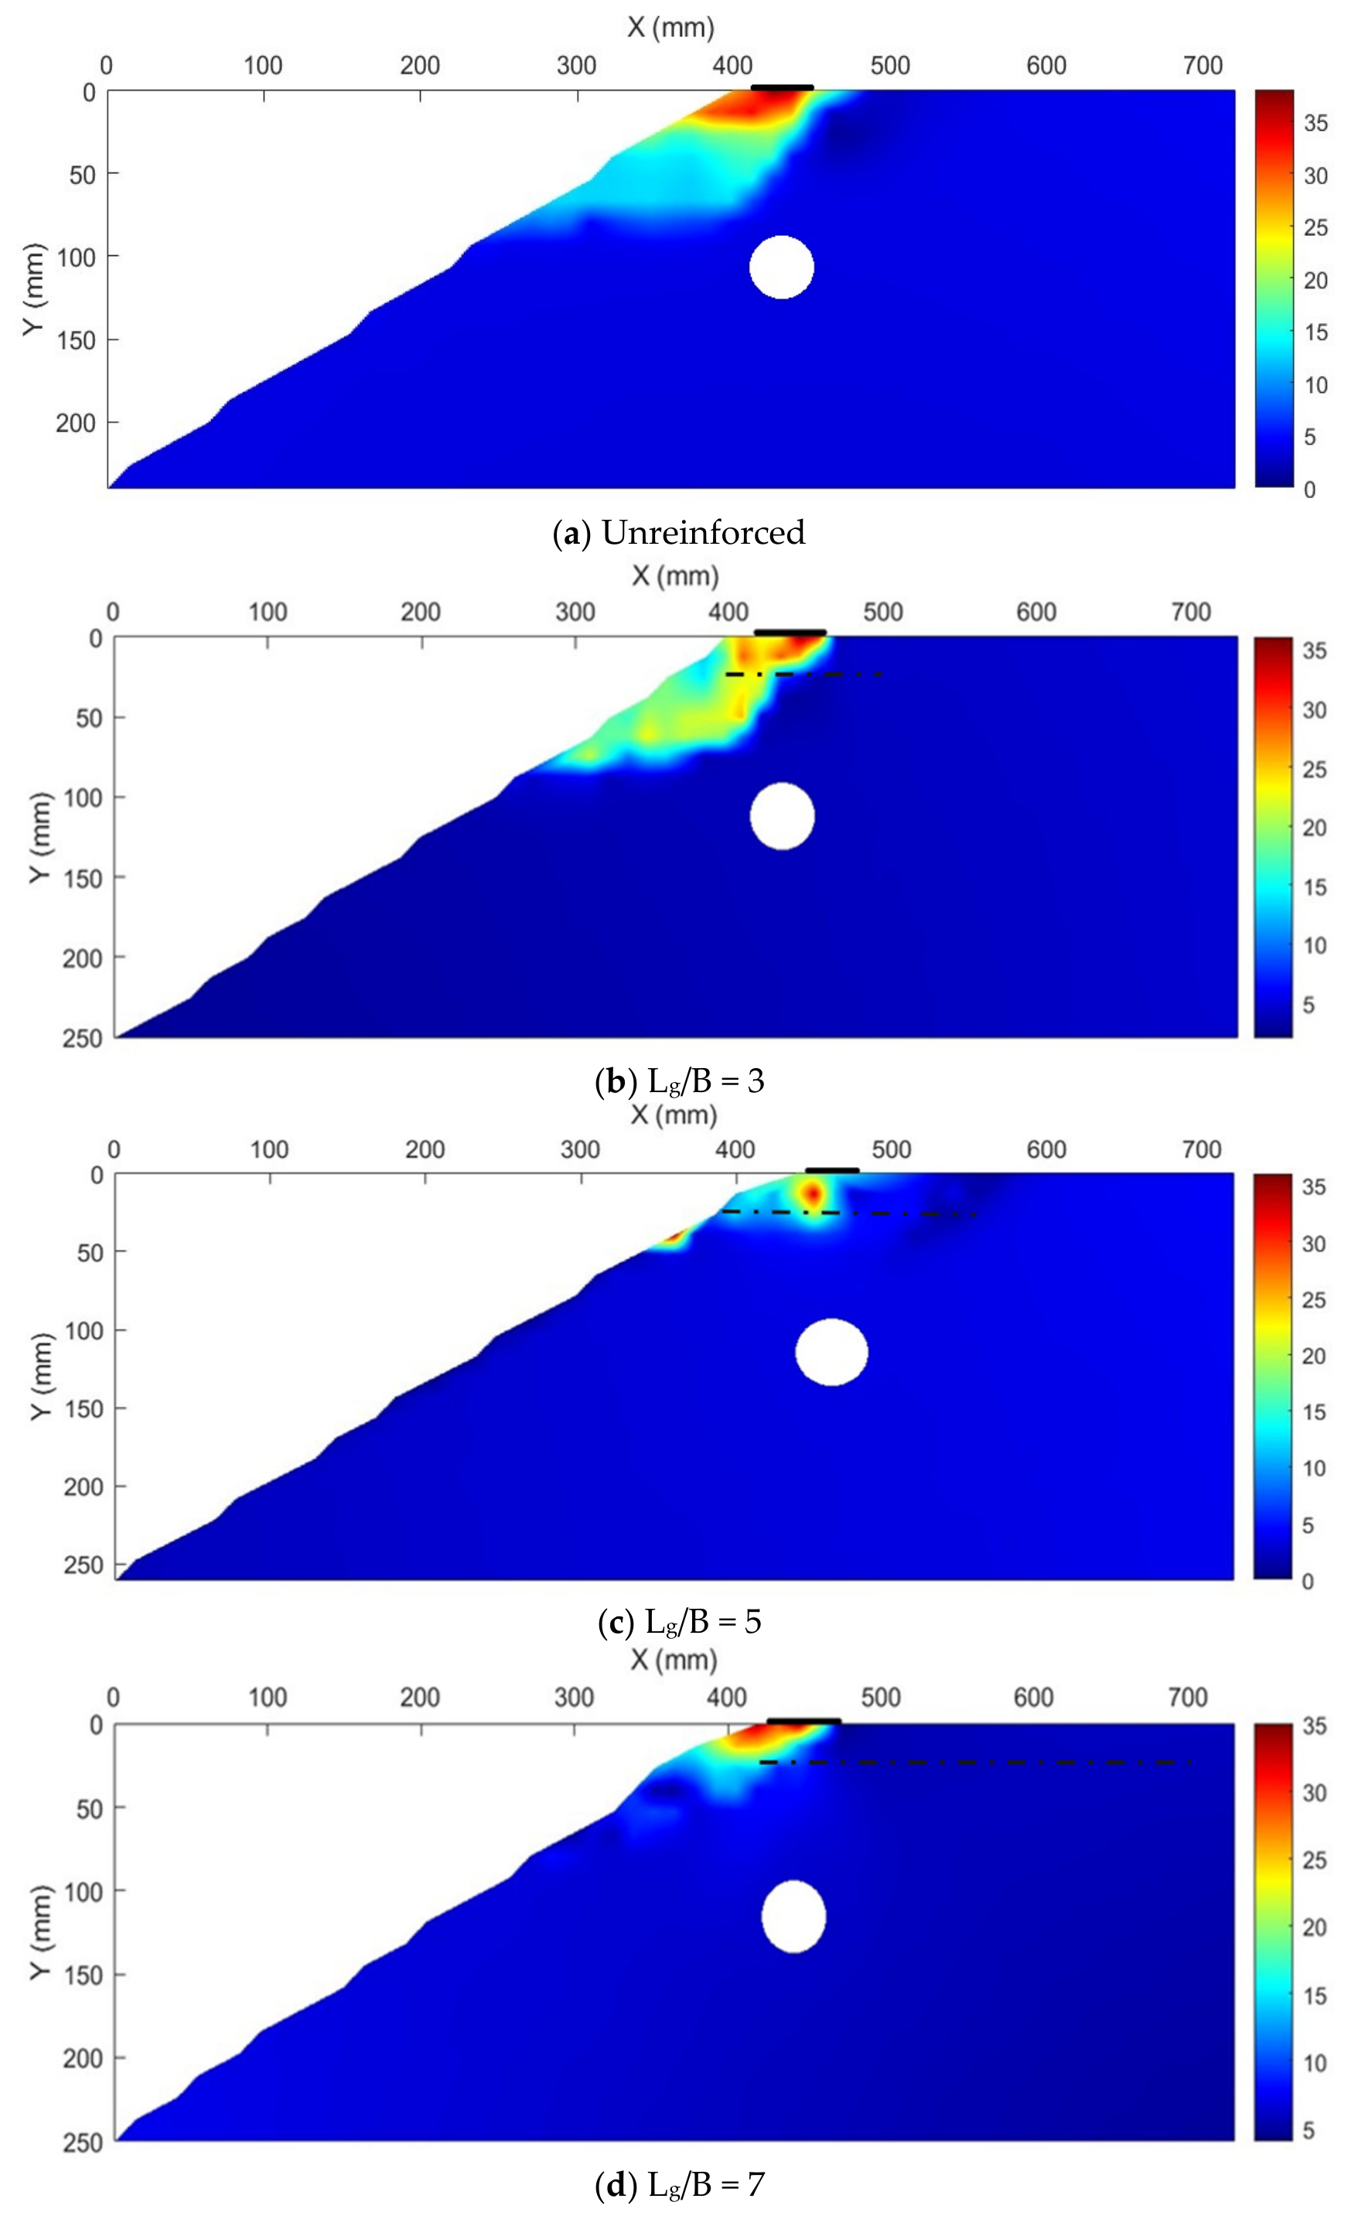
The total displacement contours obtained from the PIV analyses conducted in experiments investigating the effect of reinforcement length are presented in
Figure 13. These results are compared with the case of the unreinforced slope and are presented in
Figure 13a. An examination of the results reveals that the length of reinforcement directly influences the distribution of total displacement. It is observed that the condition with L
g/B = 5 corresponds to the scenario in which the resulting failure surfaces have the least impact on both the pipe and the slope.
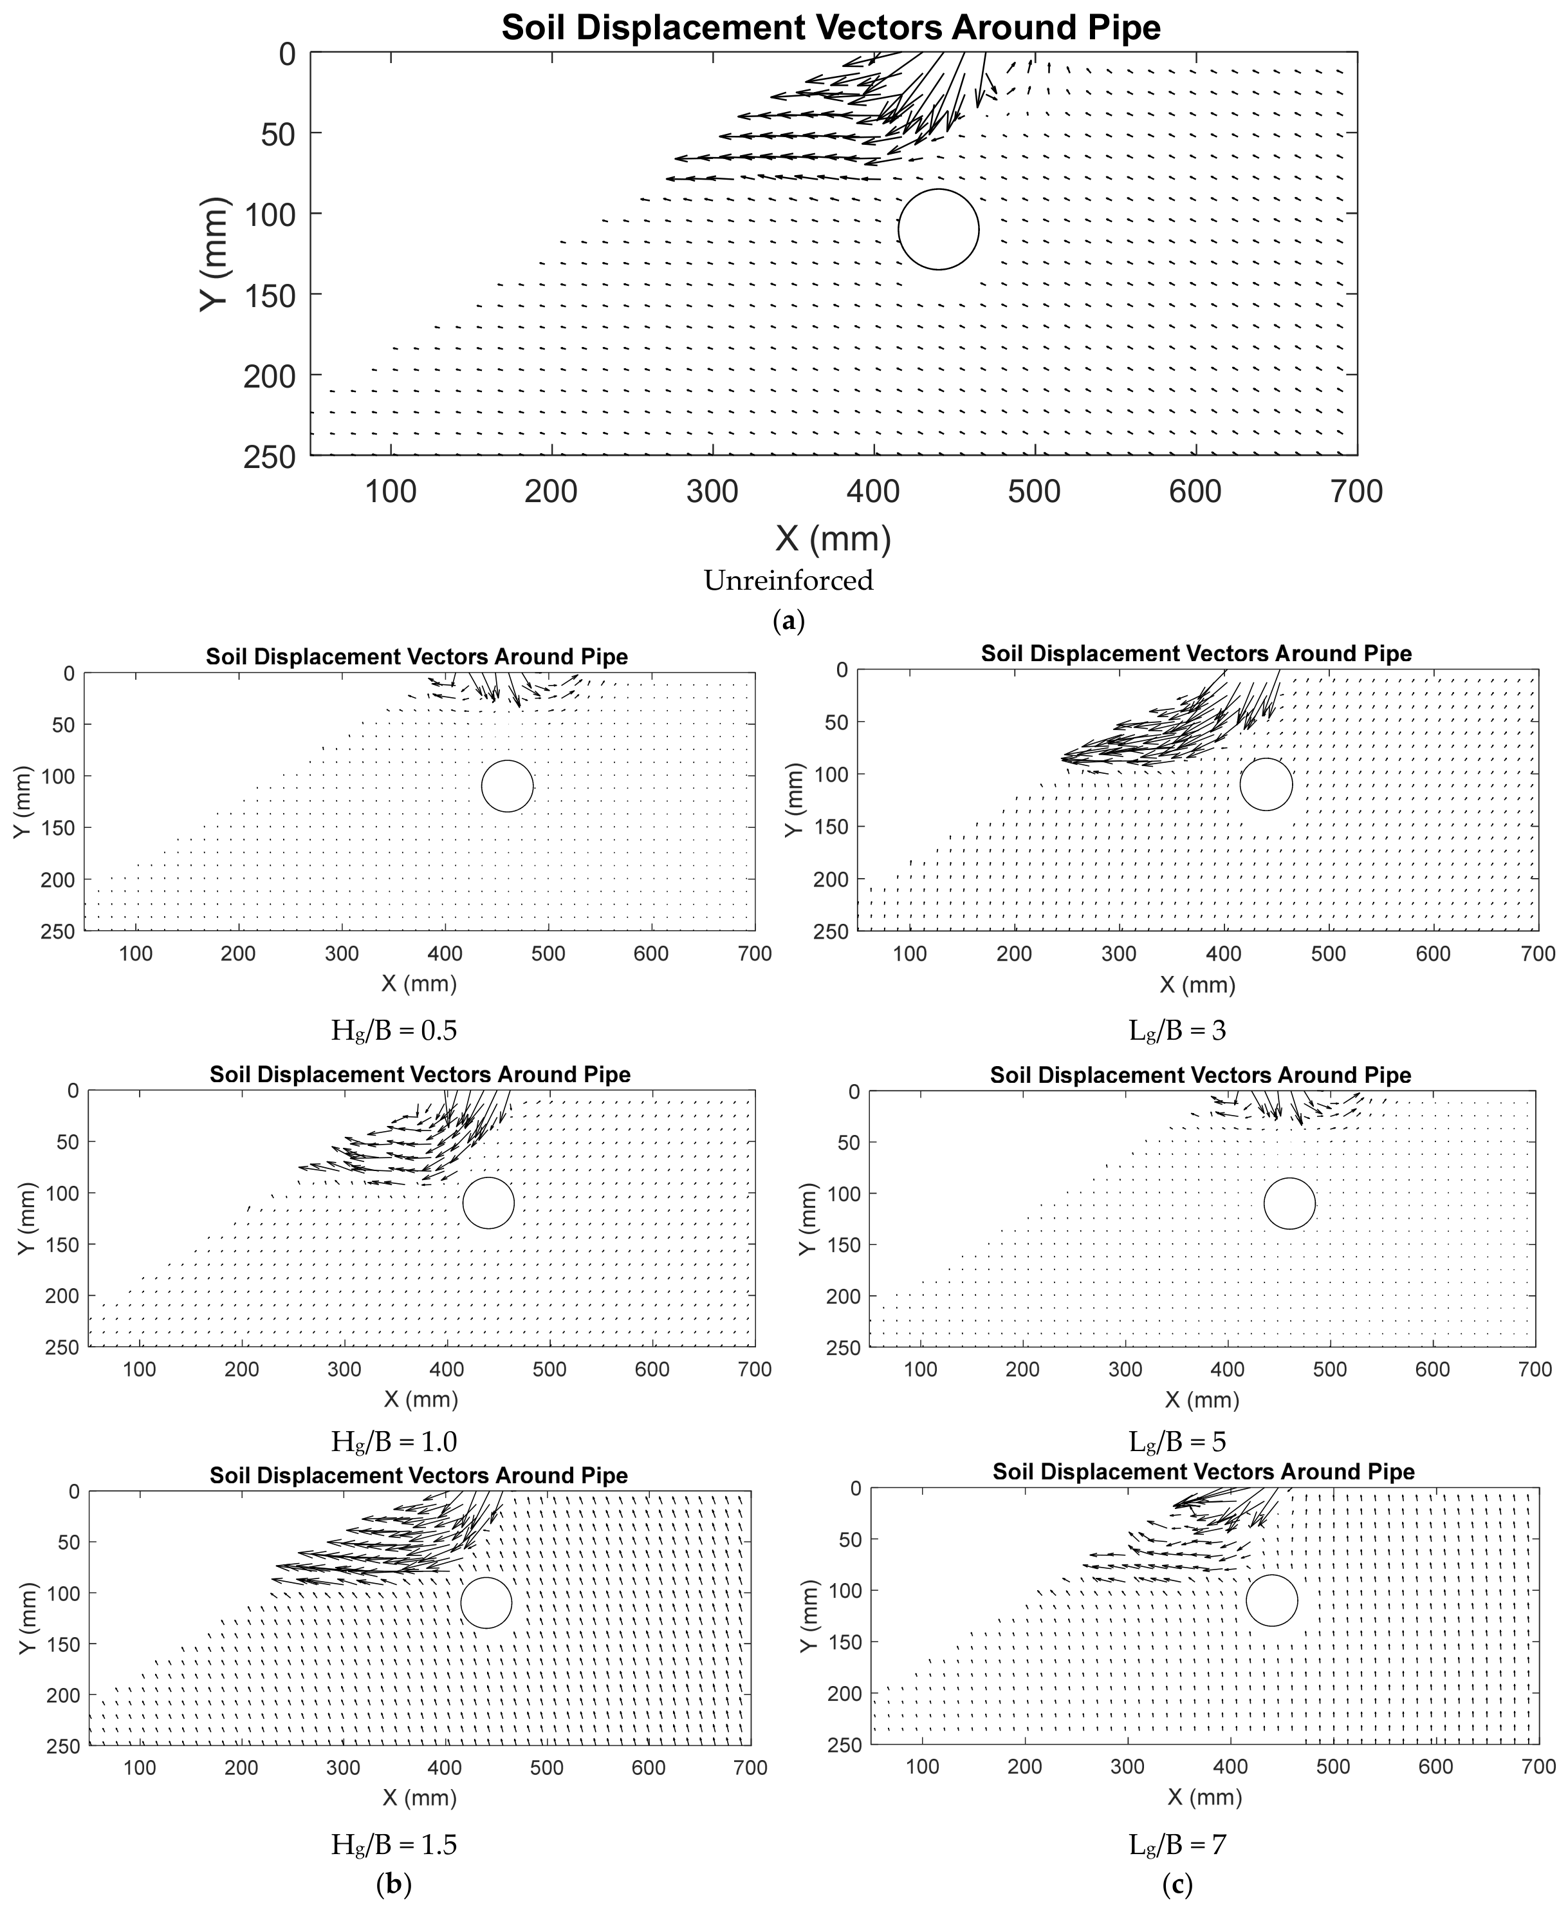
To further characterize the soil movement in the vicinity of the pipe, soil displacement vectors around the pipe at failure are presented in
Figure 14. The unreinforced condition is shown in
Figure 14a, while the vector plots for the geogrid placement depth series and the reinforcement length series are presented in
Figure 14b and
Figure 14c columns, respectively. In the unreinforced condition, large displacement vectors directed towards the slope surface were observed around the pipe, indicating significant soil movement and pipe exposure to failure. With the introduction of geogrid reinforcement at the best-performing configuration (H
g/B = 0.5, L
g/B = 5), the displacement vectors around the pipe were substantially reduced in magnitude, demonstrating the effectiveness of geogrid reinforcement in limiting soil movement around the pipe and protecting it from the effects of slope failure.
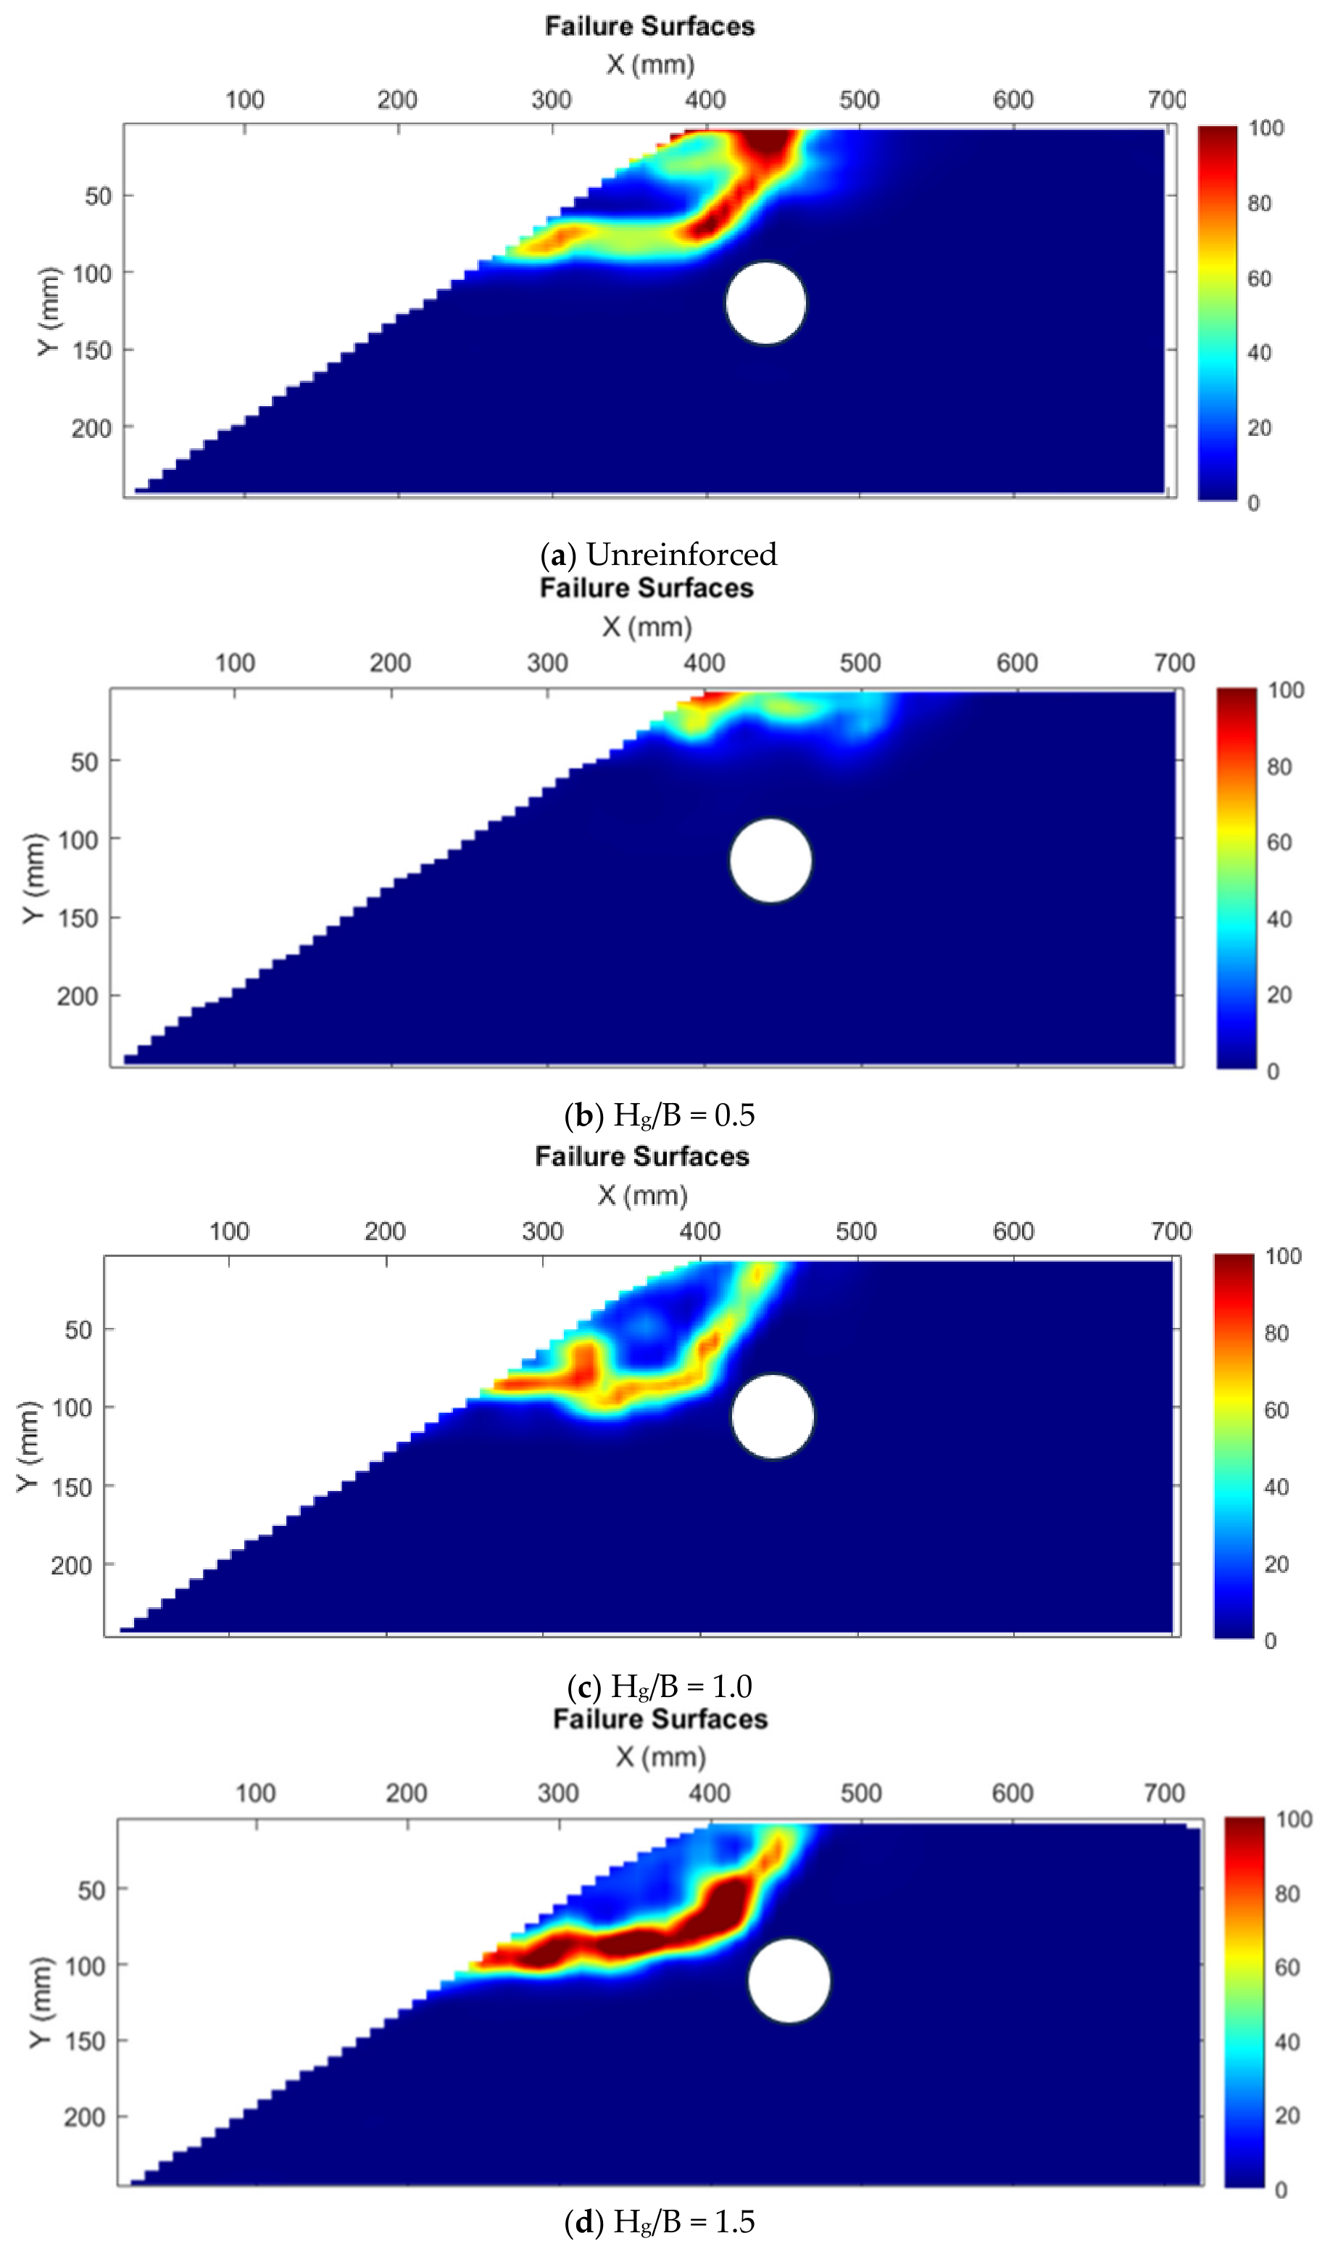
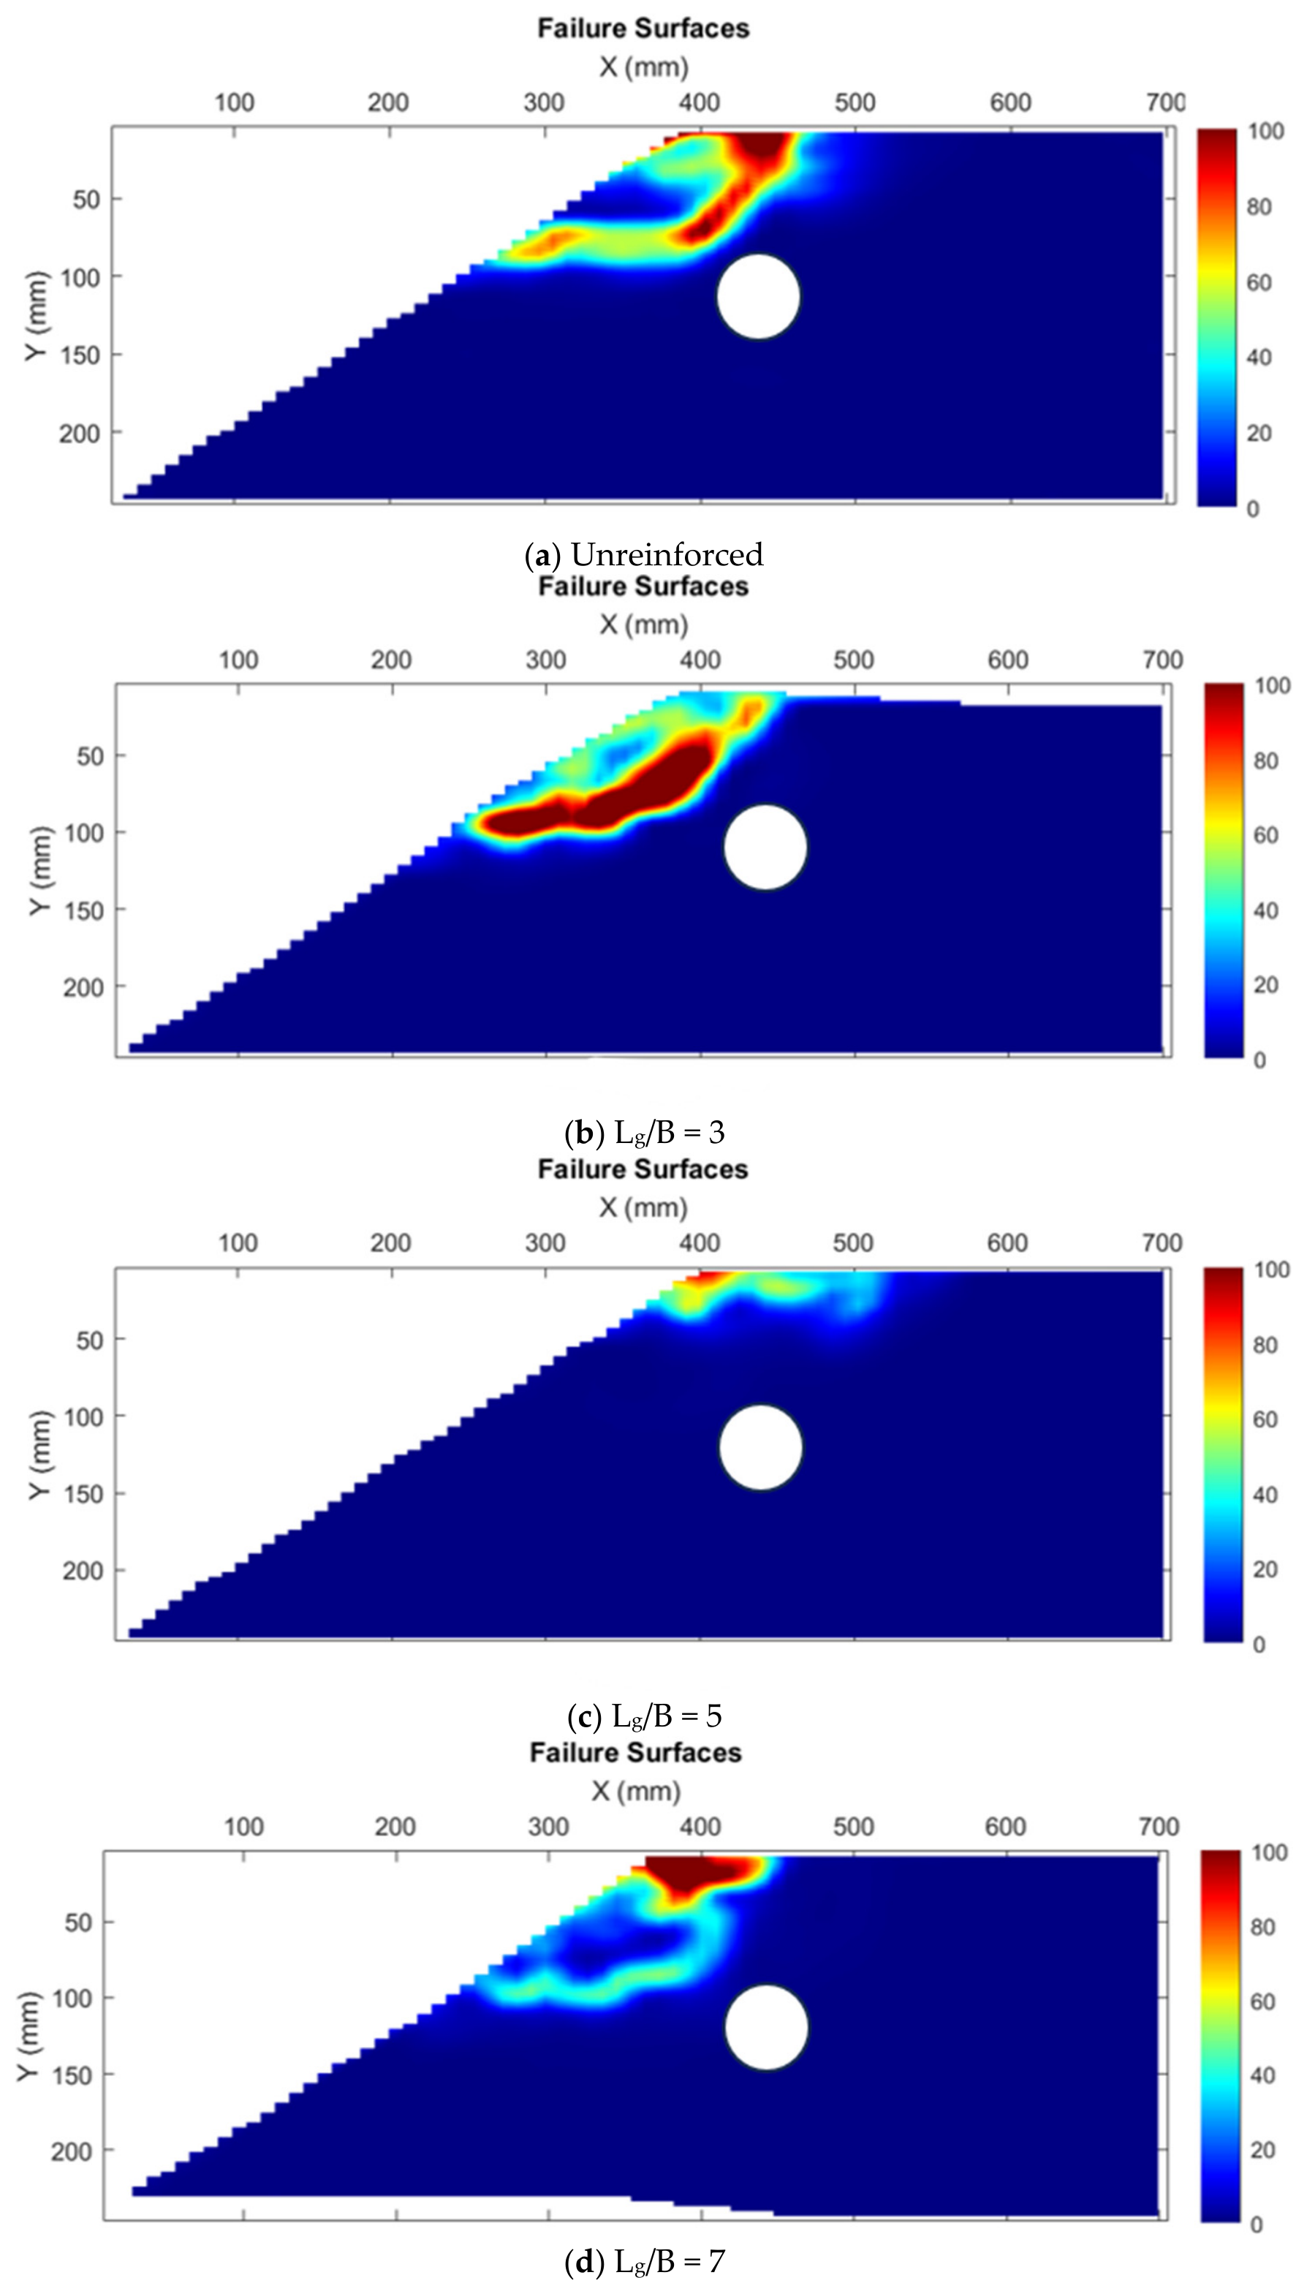
In addition to the soil displacement vectors around the pipe at failure, failure surfaces obtained from PIV analyses are presented in
Figure 15 and
Figure 16 for the geogrid placement depth and reinforcement length series, respectively. The failure surfaces were determined using the strain field outputs of the GeoPIV-RG software, which enable the identification of localized shear zones developing within the slope. The failure surfaces were identified based on the localization of high shear strain zones obtained from the GeoPIV-RG strain field outputs. The shear strain field contours produced by GeoPIV-RG enable direct visual identification of failure surfaces. Following the approach established by White et al. [
26] and implemented in GeoPIV-RG by Stanier et al. [
27], failure surfaces were identified by visually tracing the continuous bands of shear strain localization in the strain field contours. The concentration of shear strain naturally delineates the boundaries of the failure zone without the need for an arbitrary threshold value.
In the unreinforced condition, a well-defined failure surface extending from the slope crest through the pipe was observed, directly affecting the buried pipe. When the first geogrid was placed at a depth of Hg/B = 0.5, the failure surface was significantly reduced, and its effect on the pipe was minimized. As the geogrid placement depth increased beyond Hg/B = 0.5, the failure surfaces became more pronounced and extended further around the pipe, consistent with the trends observed in the total displacement contours.
Regarding the effect of reinforcement length, the unreinforced condition again produced a prominent failure surface directly affecting the pipe. At Lg/B = 3, the failure zone was observed to concentrate around the pipe and extend over a wide area. As the reinforcement length increased to Lg/B = 5, the failure surface was substantially reduced, confirming this as the most favorable reinforcement length among the tested conditions. At Lg/B = 7, the failure surface slightly increased compared to Lg/B = 5. These results demonstrate that geogrid reinforcement effectively alters the failure mechanism within the slope and reduces the impact of failure surfaces on the buried pipe.
The present findings are consistent with and extend previous studies on buried pipe behavior in slopes and geogrid-reinforced soils. Zhang and Askarinejad [
14] and Khan et al. [
15,
16,
31] demonstrated that slope conditions significantly increase external forces on buried pipes and alter the development of failure surfaces compared with horizontal ground. The present study extends these findings by incorporating geogrid reinforcement and PIV-based full-field displacement analysis, showing that geogrid reinforcement effectively restricts failure surface development and limits deformation near the pipe. Bildik and Laman [
20] showed that geogrid reinforcement improves bearing capacity and reduces settlement under horizontal ground conditions; the present study indicates that similar improvements are achievable in sloping ground and reveals that geogrid placement depth plays a critical role in controlling failure surface extent—a finding not obtainable from load–settlement measurements alone. Cocchetti et al. [
10,
11] identified slope geometry and pipe position as key factors in pipe–soil interaction, consistent with the failure mechanisms observed in the present study.
PIV-based failure surface and displacement vector analyses provided insight into the mechanisms underlying the load–settlement results that conventional measurements alone could not capture. In the unreinforced condition and at deeper geogrid placements, the failure surface extended from the slope crest toward and around the pipe region, influencing the surrounding soil deformation zone. The influence on the pipe was inferred from the extent and location of failure surfaces identified through PIV analysis. When the failure surface passes through or around the pipe, the deformation zone propagates toward the pipe region, increasing the likelihood of adverse pipe–soil interaction effects. Conversely, when the failure surface is restricted away from the pipe by geogrid reinforcement, the deformation zone remains more localized away from the pipe region, reducing the likelihood of adverse pipe–soil interaction effects. This approach allows qualitative assessment of the relative influence of failure surfaces on the pipe region based on the spatial relationship between the failure surface and the pipe location, without requiring direct instrumentation of the pipe. At the most favorable geogrid placement depth among the tested conditions (H
g/B = 0.5), the failure surface was substantially restricted, demonstrating that the improvement in
BCR and reduction in
SRF are closely associated with confining the failure zone away from the pipe. This finding highlights the added value of PIV over conventional load–settlement measurements: while
BCR and
SRF quantify the overall improvement in performance, PIV reveals the underlying failure mechanism and explains why certain configurations perform better than others. Furthermore, the anomalous
SRF value observed at H
g/B = 1.5, where settlement exceeded the unreinforced case despite the increase in bearing capacity, was interpreted through PIV analysis, which showed that the failure surface extended around the pipe when the geogrid was placed at greater depths. This result underscores the importance of combining full-field displacement measurements with conventional load–settlement analysis in experimental investigations of soil–pipe interaction. At failure, the unreinforced case exhibited a wider high-displacement zone than the best-performing reinforced case (H
g/B = 0.5, L
g/B = 5), as shown in
Figure 10 and
Figure 11. The failure surfaces and their propagation around the pipe region are quantitatively characterized by the PIV-based strain field contours presented in
Figure 15 and
Figure 16.
3.4. Limitations
The present study has several limitations that should be acknowledged. The experimental program was conducted under a fixed set of conditions, including a single slope angle (30°), the pipe embedment depth (H/D = 2), relative density (Dr = 65%), pipe diameter (D = 50 mm), and sand type. Only a limited number of geogrid arrangements were investigated in terms of placement depth and length. The findings are therefore valid within the range of parameters tested and should not be generalized as broadly applicable design recommendations. Furthermore, no repeated trials were performed, which prevents formal assessment of experimental repeatability. Direct mechanical measurements of pipe response, such as pipe strain, bending moment, and ovalization, were not included. The absence of repeated trials also limits statistical evaluation of the reported results. However, several procedural measures were implemented to minimize inter-test variability. Soil preparation was carried out by volumetrically calculating the required sand mass for each layer using the reference grid marked on the Plexiglas front face and weighing the corresponding mass to achieve the target dry unit weight; through this procedure, a relative density of approximately Dr = 65% was targeted consistently across all tests. Load and displacement data were obtained using a calibrated load cell and LVDTs, and the PIV camera was mounted on a tripod at a fixed distance and angle from the experimental setup, maintained consistently across all tests. Although these measures do not substitute for a formal repeatability assessment, they substantially support the comparative reliability of the reported results. Future studies are recommended to incorporate repeated trials, particularly for the critical reference configuration (Hg/B = 0.5, Lg/B = 5), to provide statistical bounds on the reported BCR and SRF values.