Review

HRV in Stress Monitoring by AI: A Scoping Review

by
Giovanna Zimatore
1,2,
Samuele Russo
1,3,4,
Maria Chiara Gallotta
5,*,
Giordano Passalacqua
6,
Victoria Zaborova
7,
Matteo Campanella
1,
Francesca Fiani
8,
Carlo Baldari
1,
Christian Napoli
8,9,10 and
Cristian Randieri
1,8
1
Department of Theoretical and Applied Sciences, eCampus University, 22060 Novedrate, Italy
2
Department of Life Sciences, Health, and Health Professions, Link Campus University, 00165 Rome, Italy
3
Department of Psychology, Sapienza University of Rome, 00185 Rome, Italy
4
Neuroimaging Laboratory, IRCCS Santa Lucia Foundation, 00179 Rome, Italy
5
Department of Physiology and Pharmacology “Vittorio Erspamer”, Sapienza University of Rome, 00185 Rome, Italy
6
Department of Medical-Surgical Sciences and Translational Medicine, Sapienza University of Rome, 00185 Rome, Italy
7
Institute of Clinical Medicine, Sechenov First Moscow State Medical University, 119991 Moscow, Russia
8
Department of Computer, Automation and Management Engineering, Sapienza University of Rome, 00185 Rome, Italy
9
Institute for Systems Analysis and Computer Science, Italian National Research Council, 00185 Rome, Italy
10
Department of Artificial Intelligence, Czestochowa University of Technology, 42201 Częstochowa, Poland
*
Author to whom correspondence should be addressed.
Appl. Sci. 2026, 16(1), 23; https://doi.org/10.3390/app16010023
Submission received: 31 October 2025 / Revised: 11 December 2025 / Accepted: 15 December 2025 / Published: 19 December 2025

Abstract

Despite the growing interest in physiological stress monitoring, an objective measure of stress is currently lacking, especially in clinical and rehabilitation contexts. With the emerging integration of artificial intelligence (AI) in data analytics, heart rate variability (HRV) has gained attention as an effective biomarker; however, the literature remains fragmented across disciplines, stress types, and methodological approaches. This scoping review aims to investigate how AI techniques are applied to HRV analysis for stress detection and prediction in adult populations. Although this review does not focus on a specific subtype of stress, its primary objective is to explore the current methodological state of the art as reported in the literature, without restrictions on stress typology. Following PRISMA-ScR guidelines, a systematic search was conducted across PubMed, Scopus, and Google Scholar for studies published between 2005 and 2025, using MeSH terms including “HRV”, “Rehabilitation”, “SCI” (for Spinal Cord Injury), “Stress”, “Sympathetic”, “Parasympathetic”, “Non-linear”, “Gamification”, “AI” and “Machine Learning”. Inclusion criteria targeted adult human populations and studies employing HRV features as input for AI and machine learning techniques for psychophysical stress assessment. Of the 566 records identified, 15 studies met the eligibility criteria. The reviewed studies exhibit substantial heterogeneity in terms of settings, populations, sensors, and algorithms with most employing supervised methods (e.g., random forest, support vector machine), alongside several applications of deep learning and explainable AI. Only one study focused specifically on physiological stress, none focused on SCI populations, and rehabilitation-related research was scarce, thereby underscoring important gaps in the current literature. Overall, HR variability analysis, especially when combined with artificial intelligence techniques, represents a promising approach for stress assessment; however, the field is methodologically fragmented and clinically underdeveloped in critical areas, underscoring the need for a multidisciplinary methodological framework.

1. Introduction

Stress represents a fundamental psychophysiological response, enabling individuals to cope with environmental demands, threats, or internal challenges such as acute emotional events, work-related pressures, physical illness, pain, or exposure to extreme environmental conditions [1] (see WHO definition, Appendix A.1). Stress may also arise during major life transitions (e.g., surgery, bereavement, or relocation), high-stakes decision-making, or in the presence of chronic conditions such as anxiety, depression, or spinal cord injury (SCI). From a temporal perspective, stress is commonly categorized into two main forms: acute stress, which arises as a short-term response to immediate stimuli and is typically transient in nature; and chronic stress, which persists over time and may become stable, often in the absence of an identifiable acute trigger. The detection and monitoring of stress can be approached through various methodologies, including standardized self-report questionnaires (see Appendix A.2, Appendix A.3 and Appendix A.4), molecular biomarkers (e.g., cortisol), and physiological indicators, such as heart rate variability (HRV), galvanic skin response (GSR), and respiratory patterns. These measures provide complementary insights into the subjective experience and biological impact of stress and can be integrated into multimodal assessment protocols in rehabilitation settings. In the context of rehabilitation, in fact, the management of stress and pain constitutes a significant clinical concern, as both factors directly influence recovery trajectories and overall patient well-being [2].
Given that many current studies stem from the need to address stress and pain in patients, such as in rehabilitation therapies and post-hospitalization treatment plans, we draw on a broad range of research, including studies involving populations with SCI [3], to highlight how integrated assessment approaches can enhance treatment efficacy.
The objective assessment of pain and stress remains an ongoing challenge, particularly in patients with impaired sensory or communicative abilities, such as individuals with SCI or after cardiac surgery. Limited performance progress is linked to the severity of psychological distress, depression, and hostility [4], highlighting the necessity of psychological assistance during cardiac rehabilitation programmes.
Effective assessment of stress should also encompass the individual’s mental state and overall well-being that are commonly assessed by validated self-report tools such as the Patient Health Questionnaire (PHQ-9) for depression assessment [5] (see Appendix A.2). Standardized questionnaires can accurately assess the individual’s mental state with the support of physiological data that can be prone to subjective bias, as respondents may provide false or imprecise responses [6].
The central aim of this scoping review is to explore how artificial intelligence (AI) techniques are applied to heart rate variability (HRV) analysis for stress detection and prediction in adult populations.

2. Background

2.1. Stress and HRV Physiology

A reliable indicator of the psychological stress response is HRV [2]. Psychological stress in healthy adults refers to the mental and emotional strain resulting from perceived challenges or threats in daily life, which can affect cognitive, emotional, and physiological functioning even in the absence of clinical disorders [7]. The review by Immanuel et al. [7] investigates how HRV can be used as a non-invasive physiological marker to detect changes in psychological stress levels in people who are otherwise physically healthy. The State-Trait Anxiety Inventory (STAI) is the most widely used stress assessment tool among the ten studies that Immanuel et al. [7] examined, concluding that validated HRV measures in various domains, in conjunction with standard stress induction and assessment techniques, could increase the validity of the results.

2.2. Stress and Autonomic Nervous System

In the last two decades, HRV [1,2] has emerged as a key indicator of autonomic nervous system (ANS) function, reflecting the balance between sympathetic and parasympathetic responses to stress [8]. The most frequently observed autonomic marker associated with stress is reduced parasympathetic activity, as indicated by this frequency-domain analysis of HRV. This pattern, which is typically characterized by a decrease in high-frequency (HF) power, reflecting vagal tone, and a relative increase in low-frequency (LF) power, often interpreted as a shift toward sympathetic dominance [1]. In this context, it would be particularly relevant to investigate populations with SCI, who often present impaired or diminished sympathetic nervous system function [3]. Exploring HRV dynamics in SCI subjects could provide novel insights into how autonomic dysregulation influences stress responses in the absence of typical sympathetic modulation.

2.3. HRV Analysis

Analyzing RR interval time series (the time between successive R-waves in electrocardiography (ECG), also called inter-beat intervals) can represent an asset for the understanding of HRV [2,7]. Several types of analysis can be applied to RR intervals, each offering different insights into ANS function and physiological stress responses [8,9].
A wide range of analytical methods are employed to study RR interval time series, including the time-domain method (e.g., standard deviation of normal beat-to-beat intervals (SDNN), root mean square of successive differences (RMSSD)), frequency-domain analysis (e.g., the measures low-frequency (LF), high-frequency HF, LF/HF ratio), and non-linear techniques (e.g., entropy metrics, Poincarè plots, Detrended Fluctuation Analysis (DFA), or Recurrence Quantification Analysis (RQA)), each offering complementary insights into ANS activity and physiological responses to stress. Specifically, non-linear analysis methods such as Poincarè geometry [9], DFA, or RQA [10] are gaining traction for their capacity to decode the dynamic complexity of HRV signals and even detect physiological states or thresholds across exercise protocols and clinical conditions [11,12]. In a previous study [13], the authors compared these most representative methods and showed the capability of RQA to extract hidden information from time series recorded from a complex non-linear system. RQA is a statistical, graphical, and analytical tool that has been effectively used in the study of non-linear dynamical systems by detecting useful precursors in a variety of fields, such as finance, seismic geology, and medicine [14,15]. RQA is a precise technique for characterizing physiological changes [12,15] and assessing the stochastic and chaotic dynamics of the physiological data (such as RR time series). RQA measures have been applied to multimodal data in order to identify emotions and detect real-life stress [16].
Specifically, regarding the two types of stress previously introduced, chronic stress may reduce the reactivity of HRV to acute stressors, suggesting a diminished capacity for flexible physiological adaptation. Baseline HRV, commonly quantified using time-domain indices such as RMSSD and SDNN, and frequency-domain indices such as HF and LF power, provides complementary insights into autonomic function. While RMSSD and HF primarily reflect parasympathetic modulation, SDNN and LF capture broader autonomic influences. Importantly, higher HRV is widely recognized as an indicator of physiological flexibility, health, and resilience, underscoring its utility as a biomarker in stress research.

2.4. AI Methods for HRV Analysis

In recent years, AI has seen a rise in employment in the medical field, with some common applications being in the diagnostic [17] and the therapeutic [18] fields. HRV analysis is among the many possible applications that have been explored, with several works focusing on the prediction of stress from HRV analysis supported by AI methods [19], but with many other possible applications, such as cardiovascular disease recognition [20], sports monitoring [21], and education [22]. In particular, AI-powered HRV processing is typically oriented towards the analysis of RR intervals or HRV descriptors derived from them with machine learning (ML) or deep learning (DL) architectures [20,23].
While ML methods are simpler algorithms, they also have a reduced computational complexity compared to DL solutions. DL methods are correlated with a higher accuracy compared to ML, but, given their structure (often built upon neural connections), they also require more advanced hardware at training time. This trade-off between computational requirements and accuracy is also accompanied by a reduced explainability of the employed methods, as neural networks require much less human supervision compared to ML solutions, while also being harder to inspect. For this reason, especially in the medical field, explainable AI is becoming a fundamental tool to understand the underlying mechanisms of models, allowing human supervisors to identify the fundamental variables that influence them [24].
As Haque et al. [19] confirm, most existing ML methods have already been tested in the field of stress prediction mediated through HRV analysis. Solutions such as support vector machine (SVM) [25], random forest (RF) [26], and multi-layer perceptron [27], which have confirmed themselves as excellent state-of-the-art ML algorithms in several applications, have also shown promise in HRV stress analysis. Similarly, some DL solutions, especially among neural networks, demonstrate equally interesting results in this field, with the main solutions being convolutional neural networks and recurrent neural networks [28]. This confirms a trend that is seen in most AI applications, where such solutions have been confirmed as universal high-level approaches for the analysis of different types of source data.
However, several more modern DL approaches are still severely understudied in HRV stress analysis, such as more advanced variations of convolutional neural networks [29] and transformers [30]. Those kinds of networks are much more complex compared to the commonly used ones, as they introduce attention mechanisms that increase the capability of the models to analyze data; however, as a downside, they also present much longer training and inference times, which typically make them unsuited to real-time applications. For this reason, future research should focus on models that can find a compromising balance between computational power and hardware requirements.

2.5. Towards a Personalized Therapeutic Management in SCI

In SCI rehabilitation, autonomic response monitoring is critical for assessing functional recovery and customizing therapeutic approaches, including physiotherapy, biofeedback, and cognitive-based relaxation protocols. Notably, changes in body, action, and spatial representations in SCI patients can deeply affect pain perception and rehabilitation outcomes, reinforcing the need for integrated strategies [31].
Motor imagery training is the mental rehearsal of motor actions, designed to enhance motor performance and neuroplasticity, particularly in rehabilitation settings, by engaging motor-related cortical areas without overt movement [32]; it has proven beneficial in promoting neural adaptation even in chronic, complete SCI, supporting the integration of cognitive methods with physiological monitoring to optimize clinical gains [33,34]. Meanwhile, AI-based systems can transform rehabilitation by enabling real-time stress classification, protocol adjustment, and highly personalized therapeutic management [35].

2.6. Real-Time Stress Monitoring

Since the widespread availability of accurate, low-cost wearable devices (such as rings, watches, or portable ECGs) has made continuous physiological monitoring feasible in non-clinical settings [36], the scope of objective stress and pain evaluation is quickly broadening [1]. Nonetheless, the clinical value of such data depends on rigorous methodology, and if long-term data is available (frequently spanning months), it will be possible to develop classification ML models to take advantage of wearable devices for both long-term and real-time health monitoring.
More recently, gamification has been introduced as a valuable application of game mechanics in non-game contexts, such as digital healthcare, with the aim of enhancing user engagement, motivation, and cognitive involvement. It has been shown that it can be applied to support chronic disease management, promote physical activity, and improve mental health; however, its long-term efficacy remains underexplored [37].
In this context, the central research question guiding this scoping review was:
“To what extent can RR interval time series be effectively utilized as physiological biomarkers for the objective assessment of stress within rehabilitation settings?” This review synthesizes research from the past two decades (2005–2025), with a specific emphasis on studies investigating the use of AI-based methods for the processing of RR time series as predictive markers of stress in adult populations.
Specifically, the scope of the review encompasses a range of relevant dimensions, including non-linear HRV metrics, AI-driven analytical systems, wearable technologies, gamification strategies, and neurocognitive correlates of stress, aiming to identify innovative and integrative approaches for personalized stress monitoring and management in the context of rehabilitation.
Despite the initial intent to focus specifically on rehabilitation settings, the literature revealed a limited number of studies directly addressing stress assessment in this context. This highlights the importance of conducting a scoping review to systematically map existing evidence, bridge disciplinary gaps, and guide future research toward targeted applications in rehabilitation.
In summary, this scoping review collates evidence-based AI modelling and assessment of stress, revealed through physiological measurements and psychological evaluation by means of ECG, electromyography (EMG), GSR, among others, as well as subjective psychometric tools [2]. Six guiding questions from the scoping review were structured according to the 5 W framework: What, Where, Who, When, and Why, complemented by How; the questions are introduced in par. 3.2 and the answers are reported in par. 3.5.

3. Materials and Methods

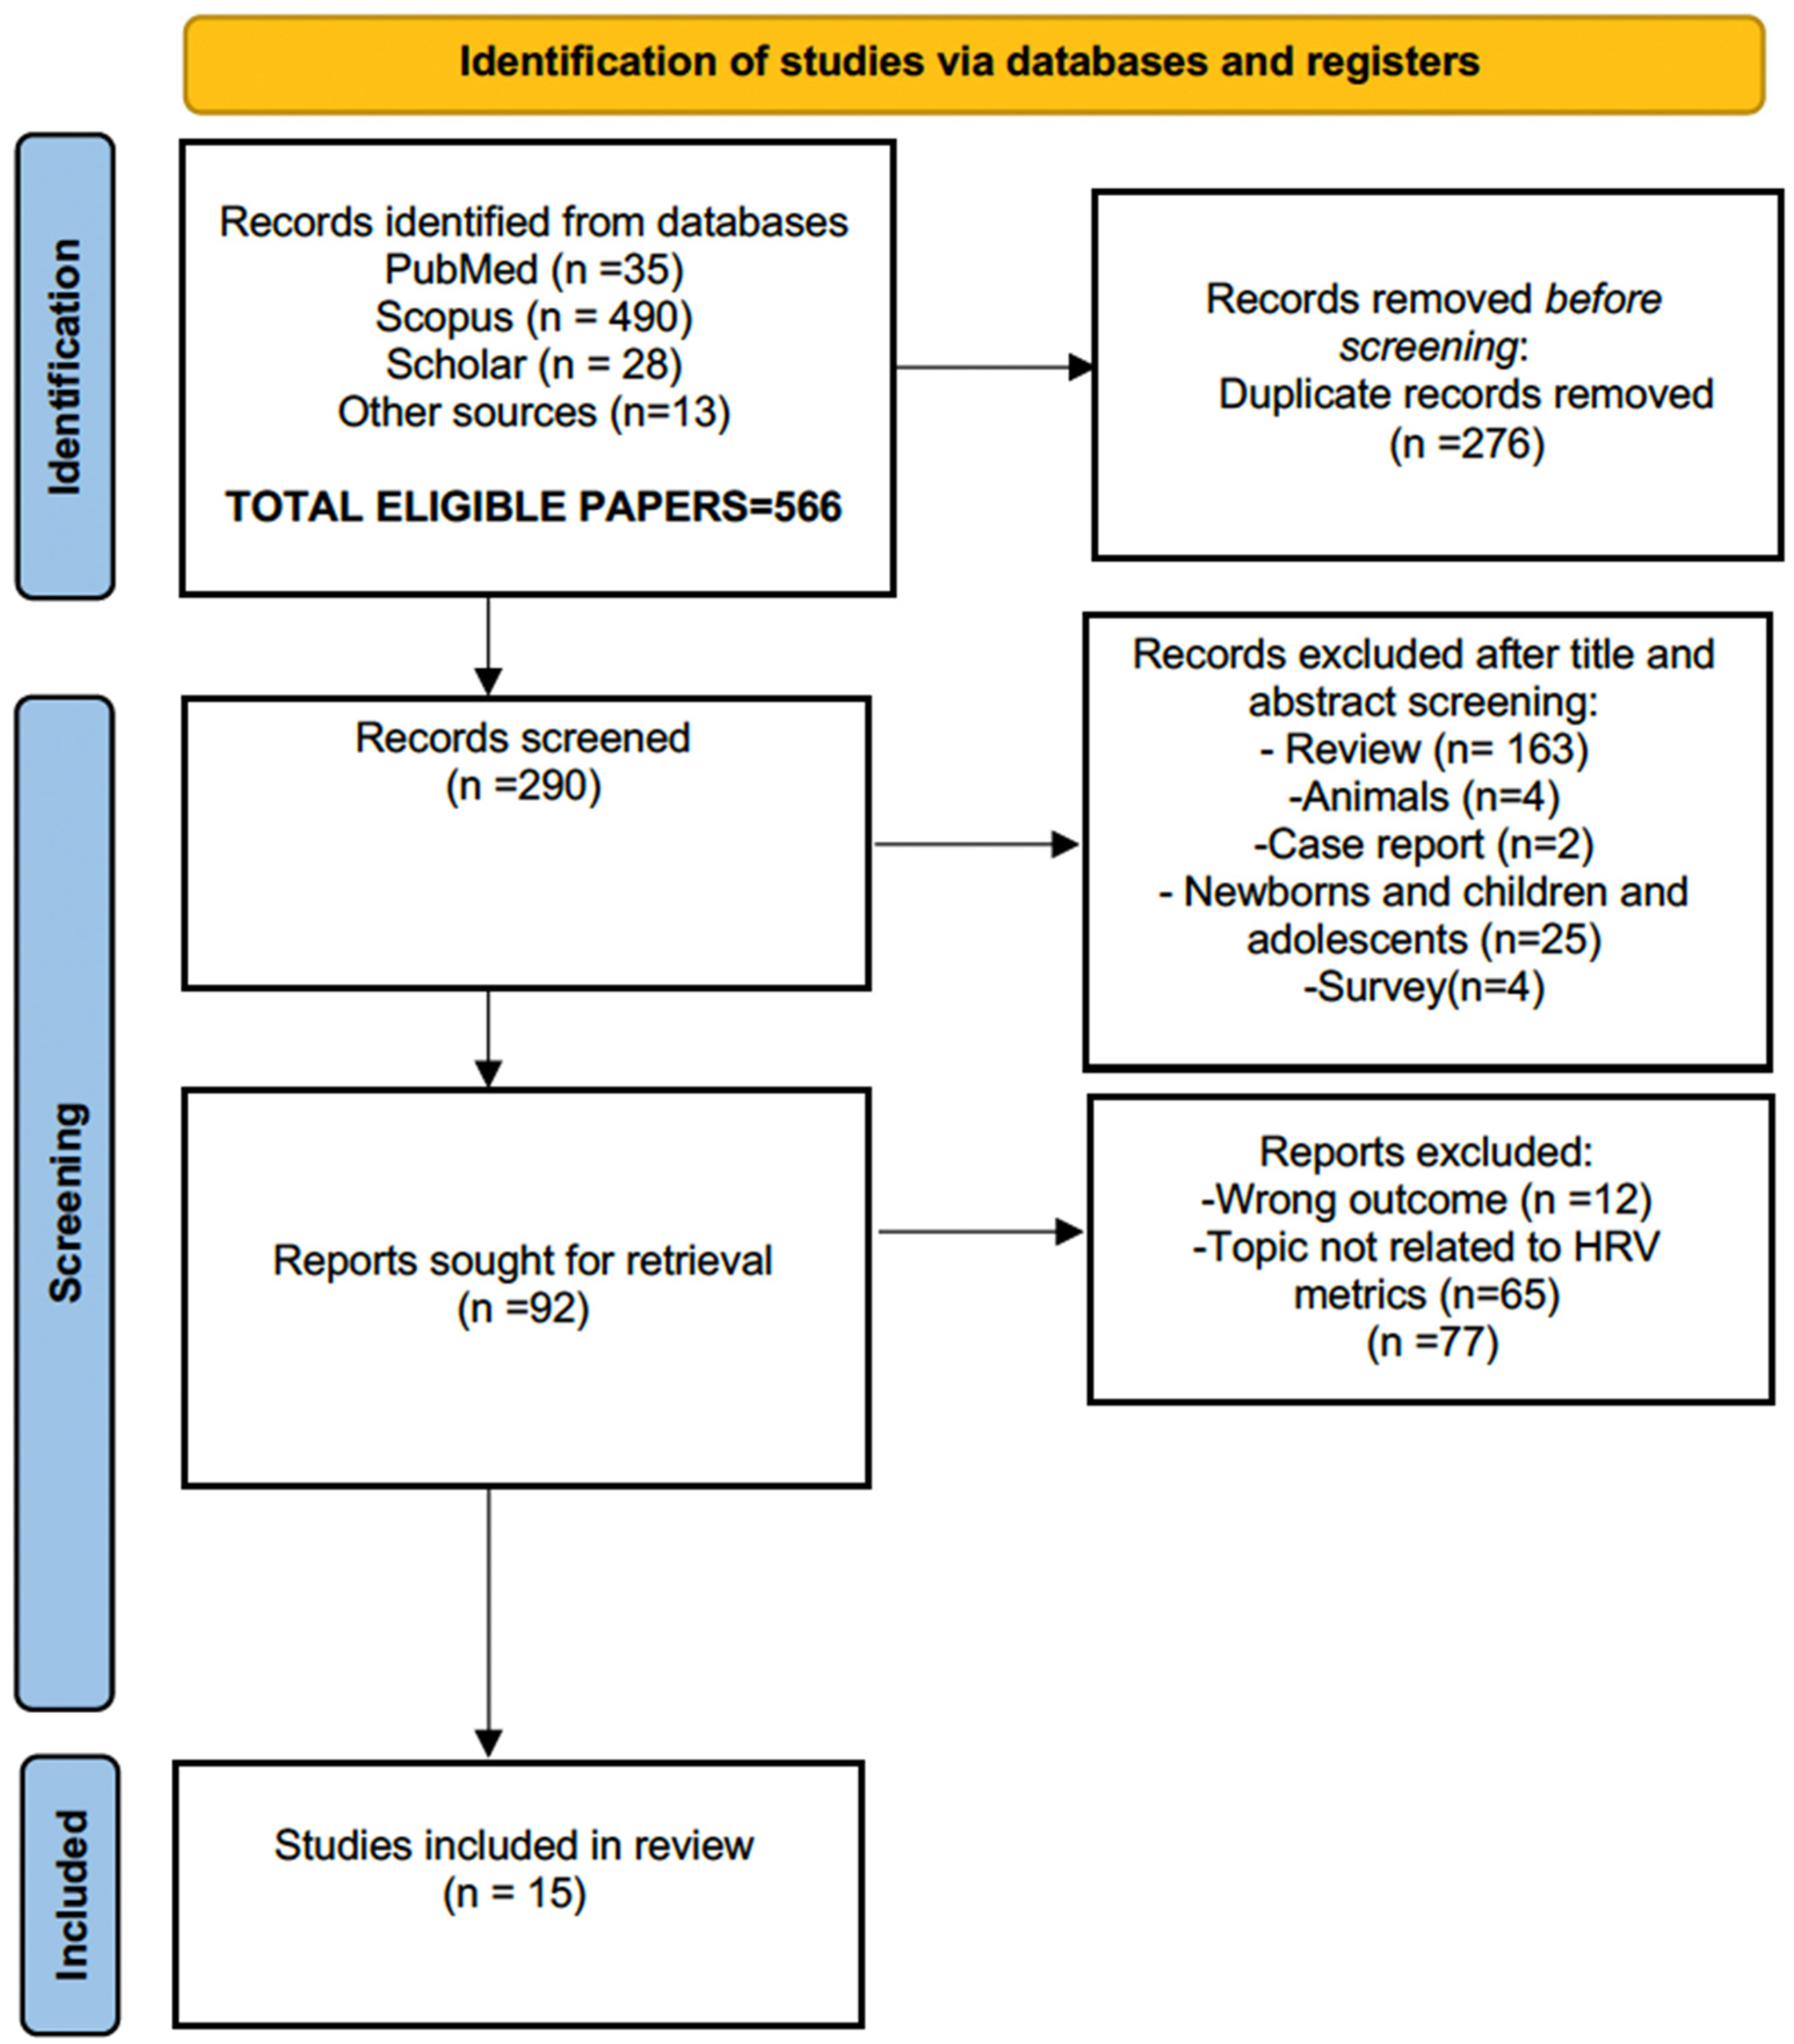
This review was guided by the PRISMA-ScR (Preferred Reporting Items for Systematic Reviews and Meta-Analyses) framework for Scoping Reviews. The international guidelines established by PRISMA2020 were followed (see Figure 1). To ensure a comprehensive answer to the research questions, all the included articles were thoroughly reviewed, and pertinent data were systematically extracted. The extracted data focused on study characteristics, types of interventions, clinical outcomes, and suggestions for future research. A narrative synthesis approach was utilized to summarize the findings and present them in alignment with the review objectives.

3.1. Search Strategy

With the above-mentioned aims, the following procedure was employed for the literature screening.
Queries were conducted via PubMed, Scopus, and Google Scholar databases for the time period of 2005–2025. The Mesh terms used were “HRV”, “Rehabilitation”, “SCI”, “Stress”, “Sympathetic”, “Parasympathetic”, “Non-linear”, “Gamification”, “AI”, and “Machine Learning”.
This scoping review was designed with the primary objective to explore how AI techniques are applied to HRV analysis for stress detection and prediction in adult populations, capturing the methodological diversity present in the current literature on HRV-based stress assessment, rather than seeking clinical homogeneity in terms of stress type or patient population. The inclusion criteria were therefore intentionally broad to allow for a comprehensive mapping of analytic strategies, signal processing approaches, and validation protocols across various contexts. Studies’ inclusion and exclusion criteria are reported in Table 1. Furthermore, broad MeSH terms related to rehabilitation and spinal cord injury (SCI) were intentionally included in the search strategy to maximize sensitivity and to systematically map potential research gaps at the intersection of HRV, artificial intelligence, and rehabilitation-related applications.
Two independent reviewers (G.P. and M.C.) screened and assessed the studies retrieved from the outcome evaluation phase, resolving any discrepancies through discussion or consultation with a third reviewer (G.Z.). The final number of eligible papers was 15, which are reported analytically in the Results.

3.2. A Specific Comparison

In the following two tables, we present a specific comparison of the literature search conducted under two distinct focuses: Table 2 summarizes the search outcomes related to correlations between stress, fatigue, and ANS functioning and Table 3 reports the results of a targeted search specifically addressing studies involving SCI, with the aim to compare the number of papers available in two different contexts. In the Supplementary Materials, we added the search strings.
The data presented in Table 2 highlight a considerable number of studies investigating the relationship between HRV, stress, and fatigue, particularly when using broad search terms. Scopus yielded the highest number of results, followed by PubMed, while Google Scholar showed very limited and unstructured output. Notably, there is growing interest in the topic, with a non-negligible number of publications appearing in 2024–2025, indicating ongoing research activity.
As deeply explained in the Results, studies focusing specifically on SCI and its relation to stress and autonomic function are markedly fewer. Although PubMed provided relatively rich data, especially regarding “SCI and Gamification”, Scopus returned limited results, and again, Google Scholar proved less informative due to a lack of filtering options.
These findings confirm a notable gap in the literature addressing objective stress assessment in SCI populations, reinforcing the relevance of mapping this research area.
In this scoping review, we screened the available literature with the aim of collecting data to answer the following six issues, which are fundamental for prevention strategies. These are the six guiding questions according to the 5 W framework: What, Where, Who, When, and Why, complemented by How.
The first four questions were used to describe the selected papers (as the results of the screening), while the remaining two were used to classify the papers (as the outcome of the scoping review). This format enhances clarity and academic rigour, making the logic behind each question more explicit and coherent for both results presentation and discussion:
(i)
What HRV features can be useful for monitoring stress levels?
(ii)
Where (in what settings) are stress and pain typically assessed (hospital, rehabilitation centre, physiotherapy and sport medicine centre, or sport academy)?
(iii)
Who and how many subjects are involved in the selected papers?
(iv)
When are subjects included? (What are the main conditions or diseases addressed in the study? Were healthy subjects also included?)
(v)
Why (and what are) the most commonly employed ML models that can assess stress?
(vi)
How do the models perform in assessing stress?

4. Results

The PRISMA flowchart process is reported in Figure 1.

4.1. Dominant Research Paradigm in a Multi-Stage Pipeline

In the field of HRV-based stress research, the dominant paradigm can be characterized as biomedical-computational, in which stress is operationalized as a physiological construct measurable through heart rate variability metrics. Most studies follow a consistent methodological pipeline: physiological signals are acquired via ECG or photoplethysmography (PPG) sensors to extract RR intervals, HRV parameters are computed, and machine learning or statistical models are applied for stress classification. This approach emphasizes standardization in data acquisition and feature extraction while leveraging computational techniques to translate physiological signals into predictive insights about stress states. By framing research within this paradigm, studies integrate both physiological measurement and data-driven modelling, reflecting the field’s prevailing strategy for quantifying and interpreting stress responses.
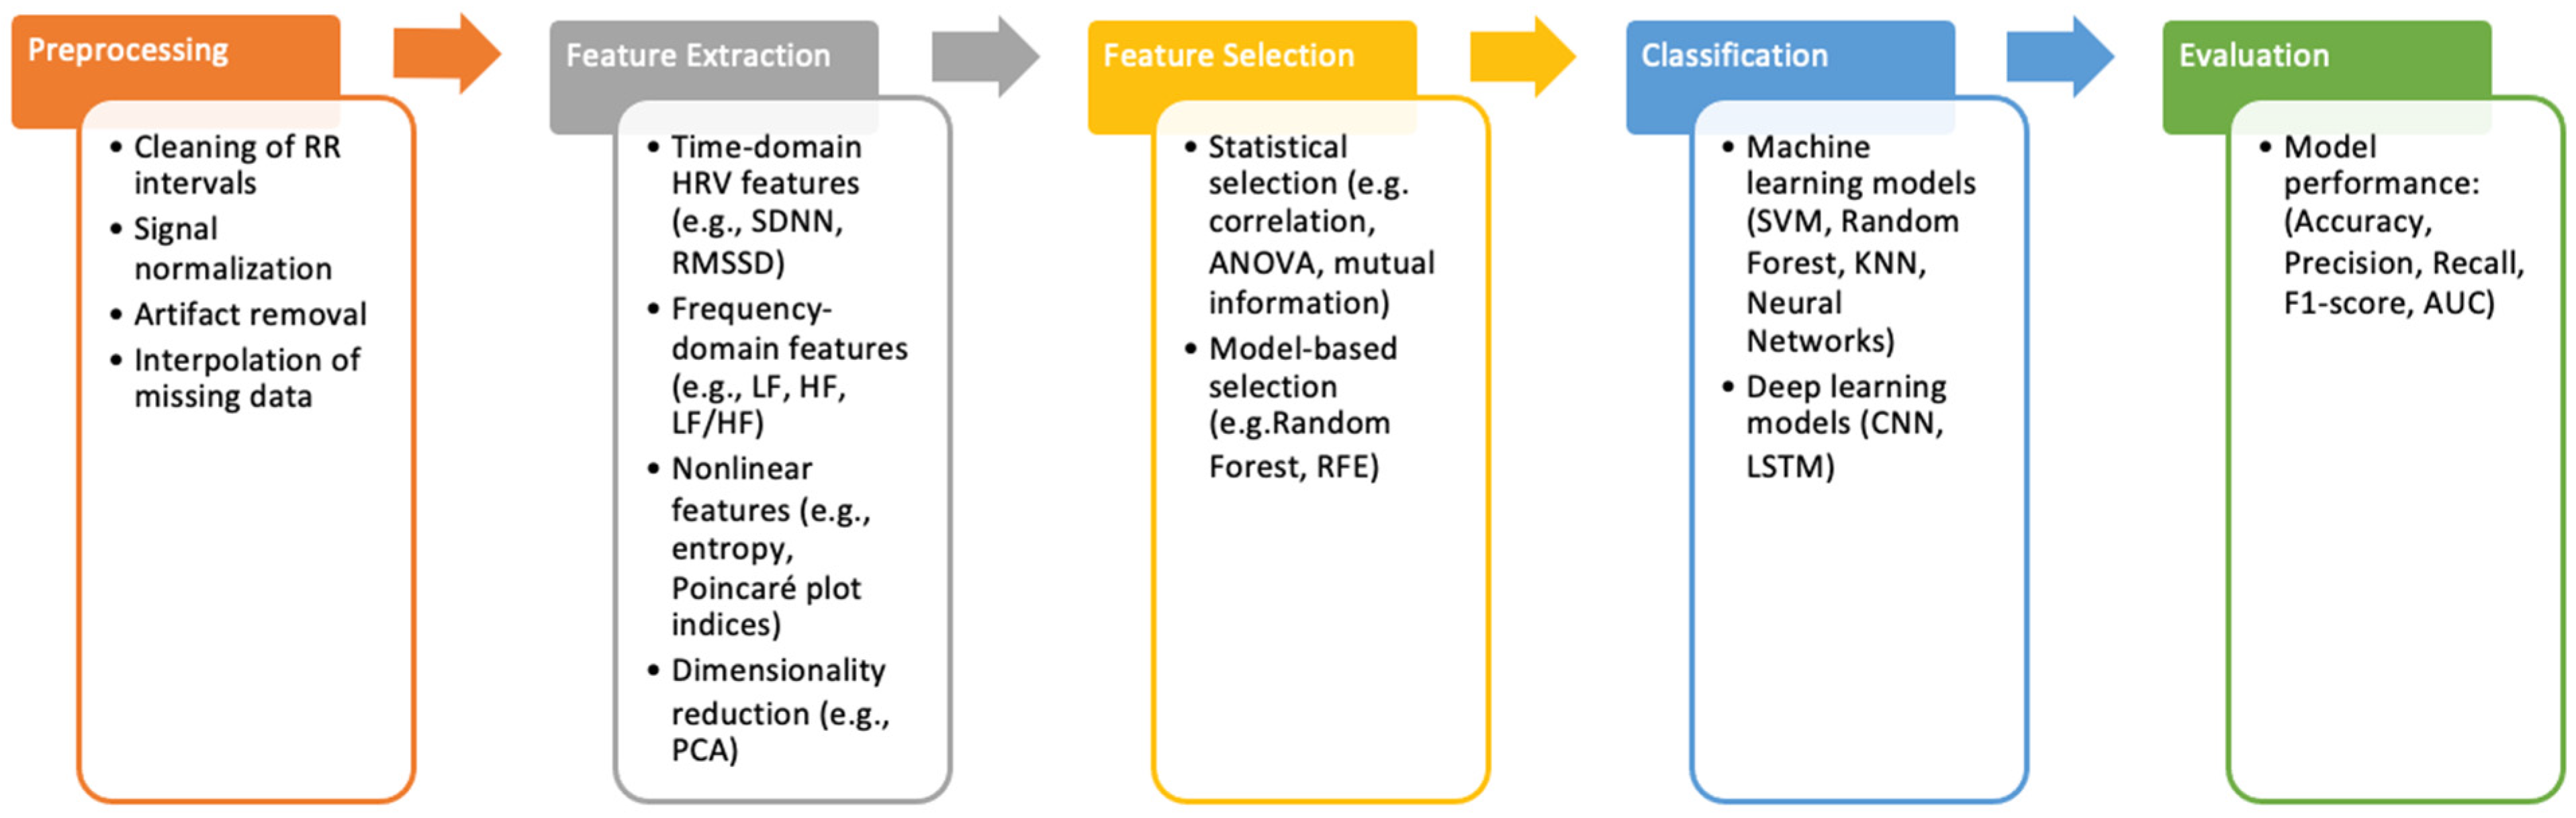
In summary, stress detection using HR sensors requires a multi-stage pipeline that usually includes, after signal acquisition: (I) pre-processing, (II) feature extraction, (III) feature selection, (IV) classification, and (V) model evaluation.
Figure 2 presents a block diagram outlining the procedural steps reported in the selected studies, alongside components that are either included in current approaches or may be considered for inclusion in future implementations.

4.2. Study Selection

Among the 15 studies included, 9 addressed psychological stress, one focused exclusively on physiological stress, and 5 combined both physiological and psychological aspects. The majority of papers investigated mixed stress conditions (acute and chronic). As reported in Table 4, the distribution of the 15 studies [26,38,39,40,41,42,43,44,45,46,47,48,49,50,51] according to stress type and condition provides a clearer overview of how stress models were operationalized across the included literature.
Therefore, the 15 studies were grouped according to the type of analytical approach and the machine learning algorithms employed, including supervised machine learning methods used for both classification and regression tasks. The resulting information is summarized in Table 5, Table 6 and Table 7.
Thirteen of the fifteen selected papers (87%) were published in the last 5 years; the sample sizes varied significantly, ranging from small-scale investigations with fewer than 20 individuals to large cohort studies exceeding 600 participants. Five of fifteen studies (30%) have used an existing database (DB). Of 1557 subjects included, 567 (36%) were healthy, 88 had cardiac or pulmonary problems (6%), 88 had psychological disorders, including depression and panic attacks (6%), 15 had metabolic syndrome (1%), 5 had unspecified health problems (<1%) and the remaining 794 had no health status specified (51%), respectively.
All studies reported using HRV features for stress detection. Among these, 30% used ECG-based RR interval acquisition, 20% employed wrist sensors, 1 of 15 used a chest belt sensor, while 20% used PPG, respectively. In two studies, multi-sensor wearable devices were employed; 5 of 15 studies (30%) classified stress using RF methods, and 3 of 15 studies (20%) used SVM methods.
ML performance can be evaluated using the following metrics: accuracy, precision, recall, F1 score, confusion matrix, area under the curve (AUC), and Matthew’s correlation coefficient (MCC) (see more details in Appendix B). ML methods report a variable accuracy from 56% to 92%. Specifically, 4 studies reported high model performance (≥90% accuracy or consistently strong across multiple metrics) and 3 studies reported moderate model performance (70–80% accuracy). Finally, of the 15 studies included, 4 (27%) studies were conducted in the EU, 2 (13%) in Korea, the USA, and China, and 1 in Brazil, Singapore, Turkey, Canada, and Iran.
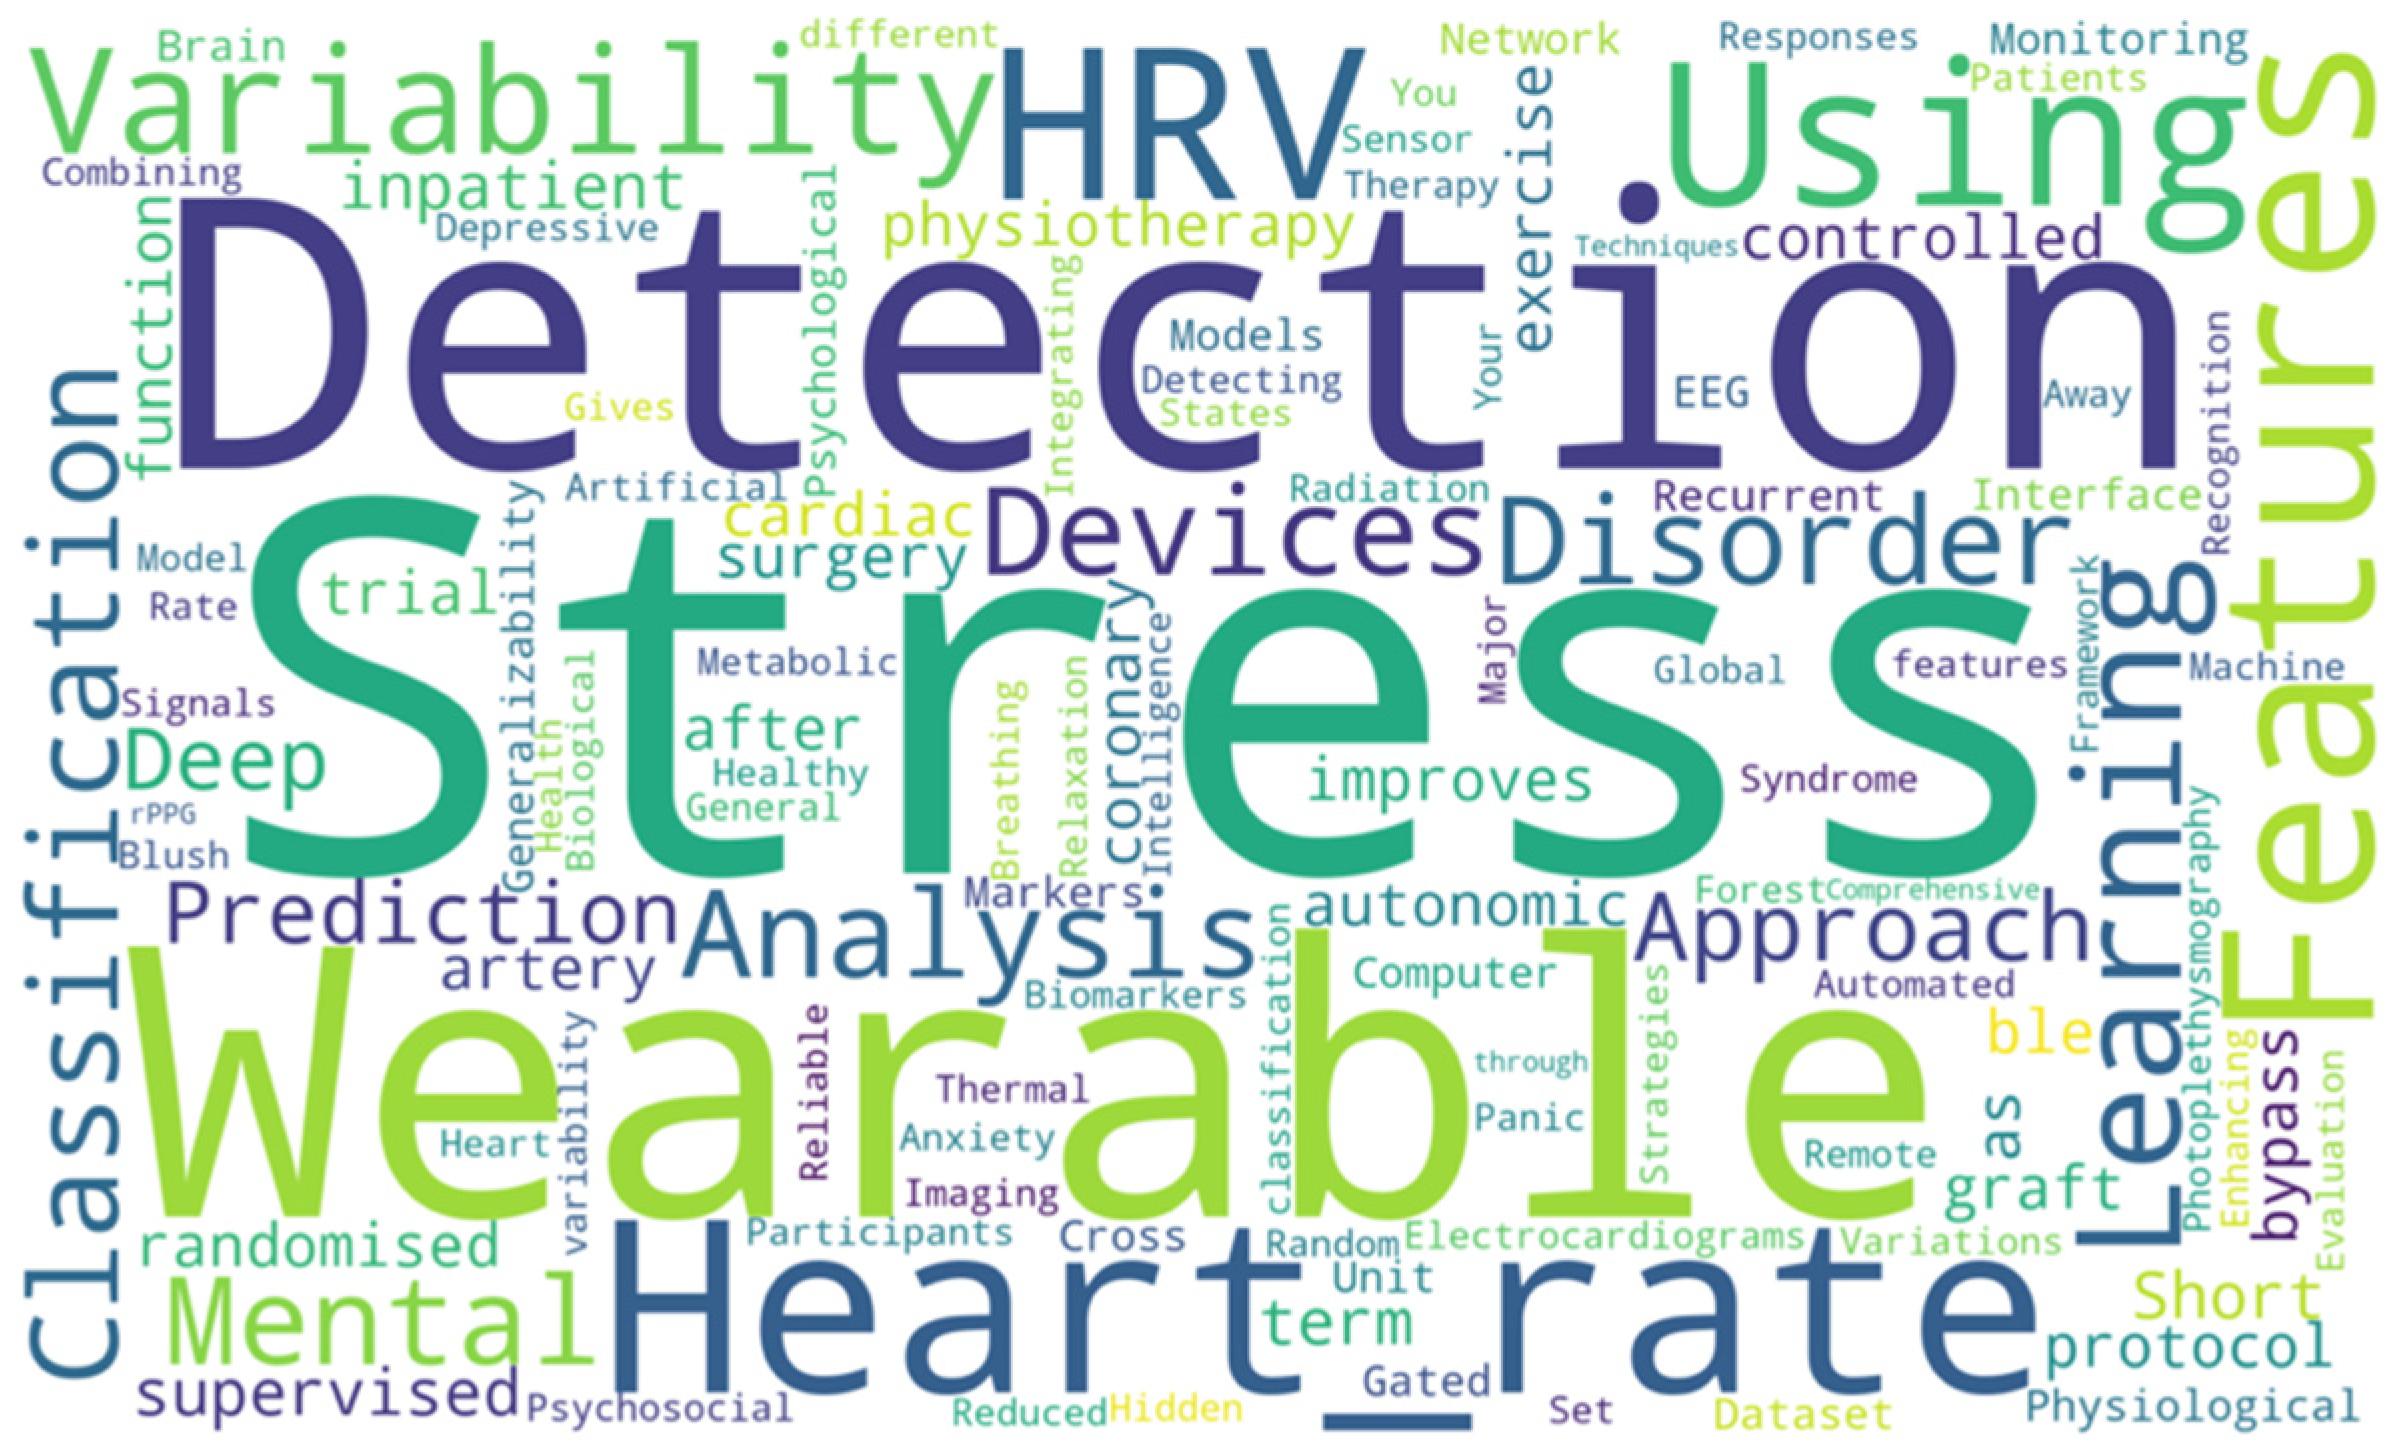
A word frequency analysis of the titles of the selected articles revealed clear trends in current research on physiological stress monitoring (Figure 3). The term “Stress” was the most frequently occurring word (11/118), highlighting the central focus of these studies. Closely following were terms such as “Detection” (6/118), “Features” (5/118), “Variability,” and “Wearable” (4/118), reflecting a strong emphasis on the technological and analytical dimensions of stress assessment.
The frequent occurrence of “Heart rate” (used here to represent the phrase “Heart rate” treated as a single term) underscored the pivotal role of HRV in non-invasive stress assessment. Additionally, terms like “Classification”, “Devices”, and “Learning” (3/221) suggested a growing integration of ML approaches and wearable technology in this domain.
This lexical pattern indicates that contemporary research is increasingly oriented toward automated, sensor-based methods for stress recognition, often leveraging physiological signals processed through advanced computational models. Such insights inform the scope of emerging methodologies and guide the framing of inclusion criteria and research questions in the context of this scoping review.

4.3. Supervised Physiotherapy Exercise

The study by Mendes et al. [38] serves as an initial investigation into the effect of physiological stress on cardiac autonomous regulation (CAR), specifically examining HRV variations during physiotherapy following coronary artery bypass grafting (CABG). Participants in this study were allocated into two groups: the exercise group (EG), which undertook prescribed physical activities including stair climbing, and the usual care group (UCG), which engaged exclusively in respiratory exercises. HR and RR intervals were recorded throughout the exercise sessions using the Polar S810i telemetry system (Polar, Kempele). Then, HRV was extracted and analyzed using linear methods, in the time and frequency domains, and non-linear methods, specifically detrended fluctuation analysis. The results of the experiment showed that EG patients had higher HRV parasympathetic measurements, whereas UCG patients showed lower RR intervals. These results confirmed that physical exercise improves CAR compared to standard physiotherapy protocols, leading to lower HR over time (64.9 bpm in EG against 69.0 bpm in UCG). Regarding RMSSD, HF, and SD1, indices commonly considered markers of parasympathetic activity [2], all were higher in the EG (RMSSD: 11.6; HF: 43.2 and SD1: 16.2) compared to the UCG (RMSSD:14.5; HF: 37.8 and SD1: 10.0). This increase in parasympathetic activity is associated with a reduced risk of subsequent cardiac pathologies, such as arrhythmias. This finding is further supported by the other parameters analyzed by the authors, including LF, LF/HF ratio, standard deviation of RR (STD RR), and SD2. While this study presents a comprehensive analysis of the effects of physical rehabilitation on HRV, the authors acknowledge certain limitations, primarily related to the non-real-time HR recordings and the limited generalizability of the findings to patients beyond those undergoing CABG. Moreover, considering the publication year of this article (2009), numerous advanced techniques for HRV analysis have since been developed.
The findings of Ritsert et al. [39] contributed to the development of objective, automated methods for anxiety assessment and monitoring of psychological stress states using portable and wearable devices. The authors observed significant changes in both HRV and breathing rate variability (BRV) (for more details, see Appendix C) between anxiety-induced and non-anxiety-induced states, where BRV is analogous to HRV, but instead of analyzing beat-to-beat fluctuations of the heart, BRV examines the cycle-to-cycle fluctuations in respiration. Participants were shown eight video clips, ranging from one to fifteen minutes in duration, which alternated between anxiety-provoking and neutral content. Mean HR (MHR), standard deviation of HR (SD), and SDNN showed lower values in anxiety-induced states. Contrary to expectations, MHR decreased in anxiety-induced states, showing an inverse relationship between HR and HRV indices. The study [9] demonstrated that ECG and respiration signals effectively measure stress-induced changes in ANS activity, providing a foundation for real-time anxiety detection using wearable devices.

4.4. ML for HRV Stress Analysis

In recent years, ML has emerged as one of the principal methodologies for the analysis of HRV. ML is a class of approaches that includes several possible solutions to tackle the problem of HRV analysis, especially for what concerns the automatic classification of stress levels.
One of the main studies on the use of HRV for stress analysis is that of Dalmeida et al. [40], which investigates its application in assessing drivers’ psychological and physiological stress. In particular, the authors compared several ML approaches for classifying stress levels using features extracted from both direct HRV measurements and ECG-derived data. To this end, they created a dataset comprising data from two sources: an ECG dataset provided by Massachusetts Institute of Technology (MIT), and a custom dataset collected from four subjects using an Apple Watch. In both cases, RR intervals were measured and used to extract HRV features. The authors then performed feature selection to discard all irrelevant samples through Pearson’s correlation, recursive feature elimination (RFE), and the extra tree classifier to ensure only data relevant to RR analysis was included in the study. The resulting dataset was then used to test several ML algorithms for stress level classification. In particular, the authors tested the main solutions: k-nearest neighbour, SVM, multilayer perceptron, RF, and gradient boosting. All approaches were compared to the naïve Bayes classification using the area under the receiver operator characteristic curve (AUROC), F1-score, and recall. The approaches that showed the best results were RF (AUROC: 0.85; F1-score: 0.81; recall: 0.78) and gradient boosting (AUROC: 0.85; F1-score: 0.80; recall: 0.79), with the multilayer perceptron having slightly better performance in F1-score (0.81) but lower performance for the other metrics. The authors also showed a statistical significance analysis between the models and the baseline naïve Bayes, highlighting the importance of hyperparameter tuning during the training of the models. The experiments were also replicated on a modified version of the dataset adjusted to simulate data recorded from wearable devices, such as the one used by the authors to record the new data with the Apple Watch. Under these conditions, the best classifier on average is the multilayer perceptron, with the best value in F1-score similar to the unmodified case (0.80), while the best values for AUROC and recall are measured for RF (0.77) and SVM (0.74), respectively. However, these two models showed suboptimal results for the other metrics, confirming the multilayer perceptron as the overall best approach. All reported metrics excluded standard deviation. Finally, a test of the multilayer perceptron on real test data recorded via Apple Watch showed that the model was able to correctly classify relaxation with a 79% probability and stress with a 71% probability. While the performance would benefit from improvements and a more varied scale of stress would be needed, this work still configures itself as one of the first studies on the use of ML to analyze stress levels and is therefore an important baseline for future research.
Following this study, numerous investigations have examined HRV as a parameter for psychological stress classification, among which is the work of Benchekroun et al. [41]. The authors proposed two ML models, logistic regression and RF, to test the classification capabilities of ML on HRV measurements obtained from various sensors. To perform this comparison, the authors selected two different datasets. The first one was the multi-modal stress dataset (MMSD), where the stress was manually induced by performing stressful mental activities, and only HRV measurements extracted from ECG were analyzed. The second one was the University of Waterloo Stress Dataset (UWS), which measured stress in daily life through a wristband and directly recorded HRV. HRV was derived from RR intervals. The data were discarded and pre-processed based on beat rate, data loss percentage, and data imputation, and then revised based on time and frequency domain analysis. The two algorithms were tested on the datasets in two configurations, independent analysis and cross-dataset analysis, with the chosen metrics being precision, recall, F1-score, specificity, and AUROC (mentioned in their work as ROC AUC). In the independent analysis case, logistic regression performed better for all metrics on the MMSD, while RF performed better for all metrics on the UWS dataset, with results slightly better on average for the RF on the UWS. In the dataset cross-analysis, RF performed better than logistic regression on all metrics except the specificity, which was much lower (0.41 against 0.62 for logistic regression). This result confirmed RF as an excellent method, as already mentioned in the study by Dalmeida et al. [40], while cementing the possibility of using ML in binary stress classification tasks from RR interval markers, even in varied layouts of stress inductors and recording sensors. However, the authors failed to treat the task as a multi-class problem, confirming the need for further research in the employment of ML in stress classification.
Following the same line of research, the study by Premchand et al. [42] tackled the problem of analyzing psychological stress using multimodal measurements taken from ECG and EEG signals and automatically analyzed by a Brain–Computer Interface (BCI). The experimenters manually induced stress in the participants via a series of cognitive tasks, namely the Cognitive Vigilance Task (CVT) and Multi-Modal Integration Task (MMIT), and recorded EEG and ECG signals during the experiments. HRV was measured from ECG signals through RR intervals, which were pre-processed to remove outliers and perform interpolation to eliminate null values. EEG signals were processed via feature extraction through power spectral density to extract linear data (bands). Non-linear data, i.e., sample entropy, fractal dimension, and Hjorth parameters, were also extracted. To evaluate the features for the classification of stress, an SVM was used, with one model for the CVT task and one for the MMIT one. The SVM was tested to measure the accuracy of both EEG decoding and HRV decoding on both tasks, with a better accuracy on MMIT for EEG decoding (81%) and on CVT for HRV decoding (62.1%), with the best configuration of the SVM in each case (two blocks for MMIT and one block for CVT). While this approach showed good results on EEG features, which is a slightly more understudied field compared to ECG analysis for stress, the results of the HRV analysis were not particularly outstanding. The authors also noted, however, that the method used to pre-process signals hindered the variability of the dataset, therefore potentially leading to overfitting.
Byun et al. [43] proposed a system to analyze psychological stress in major depressive disorder (MDD) and panic disorder (PD) patients, expanding the possibility of monitoring stress also in psychiatric patients. Stress was induced through a mental arithmetic test, with ECG signals recorded during both the mental task and relaxation periods. The experimenters then analyzed RR intervals to extract HRV features, both in the time domain (six features: RRI mean, SDNN, RMSSD, pNN50, TRI, and TINN) and in the frequency domain (seven features: LogVLF, LogLF, LogHF, LogTot, HFnu, LFnu, and LF/HF). They also extracted six non-linear features (ApEn, SampEn, α1, α2, SD1, and SD2). The features were then used as input for both an RF and a multilayer perceptron classifier to predict the stress level and compare the obtained results. The metrics used for the comparison were accuracy, F1-score, precision, recall, and AUC. Regarding the RF case, the authors tested the model through separate training on the three classes (MDD, PD, and control group) and through combined training, employing under-sampling techniques and the complete dataset. The best result was obtained using the combined data model, with 0.70 overall accuracy and a slightly better accuracy on the control group, which showed the best performance under all metrics.
The authors also analyzed feature importance through Shapley Additive exPlanations (SHAP), which showed the main three features were long-range correlations (α2), approximate entropy (ApEn), and RR intervals. A second test on scaled HRV features, obtained by normalizing data over time, showed that not only did performance significantly improve, obtaining an overall accuracy of 0.94, but SHAP values also highlighted RR intervals as the most significant feature instead. The same test was performed with a multilayer perceptron, obtaining 0.69 overall accuracy in the unscaled case and 0.93 in the scaled case, confirming the results previously obtained. The main limitation noted by the authors was the small sample of participants who were under medication. Moreover, they noted there were newer methods that could be employed, such as neural networks. Nonetheless, the results showed promise in the application of stress analysis even in the psychological field.
Dahal et al. [26] proposed a method to effectively classify both psychological and physiological stress by using a reduced number of HRV features selected through minimum redundancy maximum relevance (mRMR). The idea was to use HRV measurements from wearable devices to extract eight features (HR_SQRT, pNN25, samples, MEAN_RR, HR, MEAN_RR_SQRT, MEAN_RR_LOG, and MEDIAN_RR), which were then used to train an RF algorithm on the cloud using a distributed computing approach. The model performed locally only at inference time to produce a stress label. The model was tested on two benchmark datasets: Smart Reasoning for Well-being at Home and at Work (SWELL) and Multimodal Dataset for Wearable Stress and Affect Detection (WESAD), which differed in labelling and in stress-inducing conditions. To standardize labels, the authors combined the two datasets in order to produce a simple binary classification between stress and no-stress conditions, while for the recordings, only chest ECG recordings were used from both datasets to extract HRV features. The eight features selected through mRMR were identified with greedy search among the features with the highest correlation with the target and lowest correlation with each other. The features were then used to train an RF classifier, with the authors testing several hyperparameters (maximum depth, minimum samples split, and number of estimators) to find the optimal combination. For validation, they used K-fold cross-validation with K = 15 to lower the prediction error compared to the preferred value K = 10. The evaluation of the method through accuracy, recall, prediction, and F1-score was performed both singularly on the datasets and on their merged versions, with almost perfect accuracy on both the SWELL and the WESAD datasets (more than 99%), with the selected HRV features depending on the model but with five of them being shared between the two models and three of them directly correlated with RR intervals (MEAN_RR_SQRT, MEAN_RR_LOG, and MEDIAN_RR). For the combined model, this result was also confirmed, with a 99.5% accuracy and three HRV features correlated with RR intervals (MEAN_REL_RR, KURT_REL_RR, and MEDIAN_REL_RR_LOG). The main concern highlighted by the authors is the possibility of overfitting, combined with the low generalization capabilities of a method that seemed to be tied to the dataset in the HRV feature extraction, which raised some doubts about the efficacy of this solution. However, further tests on broader samples of the population could consolidate a method that was particularly interesting due to its simplicity and capability to be applied to devices with low computational capabilities.

4.5. Neural Network Solutions

Following the increasing application of ML in HRV-based stress analysis, some studies have also investigated the use of neural network approaches to address this task. One of the most relevant studies is that by Zhong et al. [44], which aimed to develop a model utilizing ECG data to identify psychological stress in participants across different conditions. The recordings were performed through a t-shirt with embedded ECG electrodes and a signal processing module for three-lead ECG recordings. The authors created a dataset by asking subjects to perform three actions, which involve walking, jumping, and picking up objects in a virtual reality environment while wearing the t-shirt. HRV was extracted from RR intervals in the recorded ECG, followed by analysis of the time and frequency domains to extract features. The features extracted through the pre-processing step were then used to train a multi-layer Gated Recurrent Unit (GRU) with a multi-class classifier. The method has been tested with different combinations of analyzed features to test the best configuration to improve the classification, with the best results obtained when all extracted features were used during the training of the network. The network was trained for 80 epochs to avoid overfitting, obtaining a 0.73 accuracy on the validation set (obtained on the average of three iterations of the validation step at 80 epochs). The algorithm has been compared with other ML techniques, namely k-nearest neighbour, XBoost, multilayer perceptron, one-dimensional convolutional neural network, and the proposed model with one, two, or three GRU blocks. The authors’ model outperformed the other algorithms with any number of blocks, with the best result obtained by a small margin on the configuration with two blocks (0.78). The authors also tested several combinations of GRU and layers of the GRU blocks, with the best results obtained with 256 units and five blocks. They also presented an overview of the classification confusion matrix, showing that most classes had a prediction accuracy of >0.81 except for class 1, which had only 0.56 prediction accuracy, with most misclassifications occurring in class 4. This study represented a significant advancement toward the multi-class classification of stress levels, which was previously lacking, as exemplified by previously analyzed works; however, it still presents limitations in classification accuracy, as evidenced by the substantial prediction error observed for class 1.
Another study exploring the application of neural networks for stress classification is that by Akbulut et al. [45], which presented a multivariate classification system for patients with metabolic syndrome (MES). To induce psychological stress, subjects were asked to watch a video while both ECG signals and other biological markers were recorded. In particular, ECG signals were analyzed to extract RR intervals and subsequently HRV. Features were extracted both in the time and frequency domains and non-linearly. The features (both from the ECG and from the other biomarkers), which are reduced in dimension through principal component analysis, were used as input to a feed-forward neural network (FFNN). The network had two hidden layers with sigmoid activation functions and gradient descent weight update, and a single linear output, which outputs a stress score. After the FFNN, a simple rule-based classifier analyzed the obtained score and classified it into four classes. The resulting accuracy of the model was 0.92 for MES patients and 0.89 for the control group on average, with the best classification results obtained in the no stress class (label 0), followed by the moderate stress class (label 2). The total reported accuracy was 90.5%. Concerning the AUC, the best results were obtained in the moderate stress class (label 2, 0.98), while the worst were in the low stress class (label 1, 0.89). The main limitations of the study were the high percentage of subjects with heart diseases (37.5%), which could interfere with the results of the experiment, and the simplicity of the considered network. However, given the good results obtained by the authors, this study easily serves as a baseline for future neural network approaches, especially for multimodal stress analysis. Additionally, it is worthwhile to conduct additional research on high-level feature design and feature space applicability reduction to multidimensional wearable sensors, such as referable methods for wearable-based human activity recognition (HAR). First, by adding physiological signals other than ECG, including EEG and electrodermal activity (EDA), or by extracting more useful features from ECG signals, the classification model could receive additional information, improving the performance of stress classification. Second, in order to increase the classification accuracy of psychological stress, we should also highlight the importance of an adequate sample size, given the necessity to cope with the natural variance in psychological data.
Bahameish et al. [46] similarly used binary classification models on the SWELL and WESAD datasets to recognize physiological and psychological stress and relaxation through HRV parameters. They focused on the performance improvement of supervised learning algorithms by creating solid ML classifiers that reduced overfitting, too optimistic performance estimates, and improved generalizability over small datasets. Six common supervised ML algorithms were compared: logistic regression, decision trees (DT), k-nearest neighbours (KNN), naïve Bayes (NB), RF, and SVM. To account for the limits of small datasets, the authors incorporated recommended practices for reliable ML algorithms with restricted datasets, namely non-overlapping segmentation and the selection of the most relevant features for classification through feature selection with analysis of variance (ANOVA). RR interval features, in particular mean RR, were selected as features for the classifier, together with SDNN. The tests with this setup obtained the best results with RF, achieving an accuracy of 61.2% and an F1 score of 56.2% for stress vs. neutral, and an accuracy of 85.5% and an F1 score of 89.2% for stress vs. relax [46]. Bahameish et al. [46], however, mentioned some limitations in the stability of the model and the possible independence of the selected features from stress.
The study of Coutts et al. [47] employed a temporal analysis using long short-term memory (LSTM) networks to estimate not only psychological stress levels, but also correlated states of anxiety and depression. The data were recorded from two different trials, the first one with 68 participants and the second one with 584 participants, for a total of 652 participants. The trials differed in questionnaire frequency, but they both consisted of questionnaire assignments while wearing an HRV wristband during daily life. The authors extracted from the recorded HRV twelve features both in time and frequency domains (mean RR, STD RR, STD 24 h, mean, mean 24 h STD, RMSSD, PNN50, ULF, VLF, LF, HF, total power frequency, and L/H ratio), among which mean RR and STD RR confirmed the correlation of HRV stress analysis with RR intervals. The authors then performed binary classification of subjective psycho-physical measures (perceived stress, short STAI, DASS: stress, DASS: anxiety, DASS: depression, sleep quality, loss of appetite, stomach discomfort, diarrhea, cold or headache, and alcohol consumption) through LSTMs. The results showed that classification improved for frequency domain data with pre-trained LSTMs, with the best results obtained from night-time measurements, with an accuracy ranging from 63.8% for perceived stress to 85.0% for loss of appetite. However, time domain data caused a reduction in accuracy compared to the pre-trained models, showing a possible limitation of this approach in the analysis of HRV features.
The study demonstrated that classification accuracy could reach up to 83% with five-minute HRV windows, showing promising results for real-time psychological status tracking via wearable technology. This contribution supported the integration of ML with physiological signals to monitor mental health.

4.6. ECG Alternative

While Sections from 4.3 to 4.5 grouped studies according to their training methodologies, the studies included in this section were categorized based on their data collection strategies or validation frameworks, which did not align with the criteria used in the previous sections. This grouping was introduced to ensure a comprehensive representation of the literature and to highlight methodological approaches that, although relevant, follow a different organizational logic.
The study by Liu et al. [48] presented a different approach to psychological stress analysis by providing a solution to extract HRV from remote photoplethysmography (r-PPG). In this research, stress was induced through questionnaires, followed by the viewing of a video to induce moral elevation. The experimenters recorded r-PPG through RGB videos and thermal videos, and ECG during the whole process. The authors then processed the videos concurrently in order to extract HR from the blood volume pulse, measured from changes in colour intensities. From the HR, authors then extracted a series of HRV measures, both in the time (RMSSD, SDNN, and pNN50) and the frequency (LF and HF) domains. The results were statistically compared with the measures extracted from the reference ECG for validation, achieving statistical significance with p < 0.001 for all metrics, thereby confirming the validity of this approach compared with standard analysis. To predict stress, two different ML models, SVM and RF, were tested and compared using either r-PPG, thermal imaging, or early fusion of the two modes by performing multimodal analysis of the combined features. The authors also tested late fusion of the two modes by performing separate predictions on the two models and then combining the results with a DT algorithm. The metrics used to evaluate the performance of the approaches were accuracy and F1-score, with the best results obtained both for stress and for moral elevation with the RF with an early fusion algorithm, which achieved 0.88 accuracy and 0.91 F1-score for stress and 0.83 accuracy and 0.85 F1-score for moral elevation. For cognitive stress, SVM with early fusion performed slightly better than DT with late fusion (0.83 SVM accuracy, 0.81 DT accuracy), while for moral elevation, DT performed much better instead (0.64 SVM accuracy, 0.75 DT accuracy). Regarding feature importance analysis, changes in HR and HRV measures between the first and the last 2 min showed significant differences only for cognitive stress. SHAP analysis further showed that SDNN and RMSSD were the most influential metrics for both SVM and RF models in detecting cognitive stress using r-PPG signals, while pNN50 was the most relevant feature for both models in the classification of moral elevation using r-PPG. SDNN was the most relevant feature for the early fusion approach. While this study presented very interesting results, especially for what concerns the extraction of HRV from images, the authors noted several limitations, such as noisy r-PPG measurements, thermal imaging not being particularly refined, and only a fraction of the possible multimodal approaches for r-PPG and thermal imaging having been tested.
In laboratory stress research, mood surveys and physiological arousal measurements are commonly employed to assess stress levels. Tutunji et al. [49] reported that combining a wearable biosensor with minimally invasive mood evaluation may be the most effective way to detect physiological stress in healthy and clinical populations, making it more feasible than using full ecological momentary assessment (EMA) batteries. The authors recruited 83 healthy subjects (first-year bachelor’s students in medical or biomedical science majors from Radboud Health in the Netherlands, 51 F/32 M) who underwent two weeks of EMA: one control week and one stress-inducing week. The stress-inducing week, aimed at generating psychological stress, consisted of an examination week for university students.
During the day, they received six surveys a day, which were used to assess their stress levels. The authors then used RF to test the ability of models to classify which week the questionnaire belonged to. The models were then estimated, especially in generalizability, through Leave-One-Beep-Out (LOBO) and Leave-One-Subject-Out (LOSO) methods. The results obtained by the authors showed that the classifier had better performances on individual data (LOBO) rather than on group data (LOSO), with a combined error rate—defined as the ratio of the number of wrong predictions to the total number of predictions—of 29.87% for LOBO, compared to the much higher 42.22% for LOSO. However, the authors noted that their approach did not demonstrate correlations over long-term mental health, nor were the signal recordings stable in case of noisier real-life situations.
Finally, the study by Moridani et al. [50] explored a solution to ANS activity recognition through ECG to classify the presence or the absence of psychological and physiological stress. The authors tested several ML approaches (KNN, MLP, SVM, and CNN) on a custom dataset of 20 students who were subjected to both physical and mental stress, with the data recorded by portable devices. The dataset was analyzed to extract several HRV features, namely SDNN, mean HR, STD HR, RMSSD, NN50, pNN50, and DFA features, which were used to train the aforementioned binary classifiers over cognitive and emotional stress. The best results were obtained by the CNN classifier for both types of stress, with 98% accuracy for cognitive stress and 94.5% accuracy for emotional stress, while the authors also proved the relation between HRV features and stress conditions, confirming the results obtained by other authors, despite the limited number of subjects on which the classifiers were tested.
The study by Jeong et al. [51] successfully predicted the psychological and physiological stress scores of patients undergoing radiation therapy and demonstrated a correlation between stress and respiratory irregularity using AI and biological signals, specifically HRV derived from PPG data. Over 90% of patients experienced stress during radiation therapy, with the highest stress score observed at 85.71%. AI models, particularly the LSTM model, demonstrated high accuracy in predicting stress. LSTM achieved an accuracy of 84.6% for stress classification, while GPT4.0 showed strong performance in feature classification with diverse patient data. Stress was significantly correlated with phase irregularity in respiratory patterns during treatment, suggesting that stress impacts treatment accuracy. Male patients exhibited higher stress scores overall, with an increasing trend during treatment, while female patients showed a decreasing trend. The study highlighted the potential of stress prediction tools to identify patients needing psychological support, thereby improving radiation therapy precision and outcomes.
Table 5. The 15 selected papers after the filtering process. NA implies that the data were not available.
Par.nStatus (Country)Sample Size (F/M)Sensors
(References
Measure)
Project, Method/
Classifier Algorithms
Model
Performance
Authors
(First Name)
Publication Year
3.11CABG
(Brazil)
47 (11 F/36 M)RR by Polar S810i telemetry system, (SD1 and SD2, LF/HF)supervised physiotherapy exercise/HRV measures comparison, regression0.3 < R2 < 0.5Mendes [38]2009
2Healthy (Canada)DB: 19
(5 F/14 M)
MP45,
BIOPAC System
HRV, BRV
comparison
NARitsert [39]2022
3.23Healthy
(UK)
4 + DB: 27 PhysioNet databaseECG by Apple Watch, Polar H7 (RR intervals, SDNN, RMSSD); EMG, GSRKNN, SVM, MLP, RF, GBRecall (80–81%)
F1-score (78–79%)
Dalmeida [40]2021
4Healthy and unhealthy subjects
(EU)
DB: MMSD
74 (38 F/36 M) + UWS dataset:
27 (8 F/19 M)
Empatica E4: ECG, EMG, PPG, EDA, DASS/STAI-S, SUDSLR, RFF1-score (MMSD: 71%, UWS: 75%, cross: 63%)Benchekroun [41]2023
5Healthy
(Singapore)
40BCI, EEG by headband, ECG by chest beltSVMAccuracy (MMIT EEG: 81%, MMIT HRV: 56%)Premchand [42]2024
6Major depressive disorder and panic disorder
(Korea)
147:
41 MDD (30 F/11 M)
47 PD
(30 F/17 M)
59 HC
(36 F/23 M)
HRV (mRR, SDNN, RMSSD, pNN50, TRI, TINN, VLF, LF/HF, ApEn, SampEn, DFA)RF, MLPAccuracy (70%)Byun [43]2025
7NA
(USA)
DB 37:
22 SWELL
15 WESAD
mRMRHRV, RFAccuracy (99.5%)Dahal [26]2023
3.38Healthy
(China)
127: 80 + 47 MECG T-shirts (mRR, ApEn, SD1/SD2, SDNN, HFn, LFn, LF/HF)GRU networkAccuracy (73%)Zhong [44]2022
9Metabolic Syndrome, CVD and Healthy
(Turkey)
30
(19 F/11 M)
ECG, GSR, body temperature, SpO2, glucose level, and blood pressure, HRV (NN50, pNN50, SDNN, RMSSD, mRR, SD1/SD2, and HRV triangular index features, LF, HF, LF/HF)PCA + FFNN + classifierAccuracy
(Metabolic Syndrome: 92%, control: 89%)
Akbulut [45]2020
10NA (USA)38 + DB 40:
25 SWELL
15 WESAD
HRV (mRR, SDNN, RMSSD, HF, SD2)RF, KNN, SVM, LR, RF, NBAccuracy (stress vs. neutral state: 53–61%)
stress vs. relax (F1-score: 86.3%)
Bahameish [46]2024
11General mental health (UK)652 (463 F/189 M)Biobeam wrist/questionnaire
HRV from wearable wristbands
Deep Learning (LSTM)Accuracy: 73–83%Coutts [47]2020
3.412NA
(China)
104 (82 F/22 M)HRV (RMSSD, SDNN, pNN50, HF, LF, LF/HF, r-PPG)HRV, SVM, RFAccuracy (cognitive stress: 87%, moral elevation: 83%)Liu [48]2024
13Healthy

(Netherlands)
83 (51 F/32 M)Empatica E4 wristband/EMA and EPA survey, HR, Skin conductance, Temperature, Movementlinear mixed effect, RF modelsError rate:
LOBO:
EMA: 33.45%, EPA: 36.11%, combin.: 29.87% LOSO:
EMA: 45.85%, EPA: 48.42%, combin.: 42.44%
Tutunji [49]2018
14Healthy (Iran)20 (6 F/14 M)ECG from a portable wristCNNAverage classification rate cognitive stress: 98%
Emotional stress: 94.5%
Moridani [50]2020
15Lung
Cancer
(Korea)
41 (14 F/27 M)HR from PPG, Respiratory irregularityDT, RF, SVM, LSTM,LSTM/type7 accuracy: 84.6%Jeong [51]2024
CABG, coronary artery bypass grafting; GSR, galvanic skin response; GP, gradient boosting; SWELL, Smart Reasoning for Well-being at Home and at Work; WESAD, Multimodal Dataset for Wearable Stress and Affect Detection; r-PPG, remote photoplethysmography; SVM, support vector machine; RF, random forest; LR, logistic regression; DT, decision tree; NB, naïve Bayes; EMA, ecological momentary assessments; EPA, ecological physiological assessments; TSTT, Trier Social Stress Test; LOBO, Leave-One-Beep-Out; LOSO, Leave-One-Subject-Out.

4.7. Answers to the Research Questions

Based on the 15 selected papers, the answers to the 6 research questions are presented as follows:
(i) What HRV features can be useful for monitoring stress levels?
Table 6 summarizes the linear and non-linear HRV features, explained in the previous section, used in the analyzed works.
Table 6. Summary table of the employed HRV features.
FeatureReferencesNumber/Total
LinearRMSSD[38,39,40,41,42,45,46,47,48,50,51]11/15
HF[26,38,39,41,44,45,46,47,51]9/15
SDNN[39,40,41,42,44,45,46,48,51]9/15
pNN50[40,41,42,45,47,48,50,51]8/15
LF/HF ratio [38,39,44,45,47,51]6/15
LF[38,39,41,44,45,47]6/15
HR[26,40,41,49,51]5/15
Mean HR[39,41,42,50]4/15
Mean RR[26,44,46,47]4/15
VLF[26,40,41,47]4/15
NN50[41,45,50]3/15
STD RR[38,47]2/15
Non-LinearSD2[38,41,45]3/15
SD1[38,41,45]3/15
SD1/SD2[41,44,45]3/15
ApEn[43,44]2/15
α2[43,50]2/15
SampEn[26,43]2/15
In Table 6, if no feature importance method was used, we included as relevant features those that the authors reported to show observed variation between the control group and the stress group. If authors do not explicitly select the most important features, we report the first three. Features that have been used only once have not been reported for brevity. Regarding the feature importance methods employed to determine each feature’s relevance, the selected works employed Pearson’s correlation (1/15) [40], RFE (1/15) [40], Extra Trees Classifier (1/15) [40], SHAP (2/15) [43,48], mRMR (1/15) [26], ANOVA (1/15) [46], Spearman’s rank-order correlation (1/15) [46], t-test (1/15) [48]. Most works do not use feature importance methods (10/15) [38,39,41,42,44,45,47,49,50,51].
These results show that feature importance methods are not commonly used and that most approaches rely simply on the features, which are well-known to be the most informative [2]. Even if the lack of explainability could subject feature selection to human bias, feature importance (when assessed) generally agrees with human evaluations. The result of our analysis shows that HRV features such as RMSSD, HF, LF, the LF/HF ratio, SDNN, and pNN50 were the most extracted to quantify stress-related changes. RMSSD reflects parasympathetic activity and is highly sensitive to short-term HRV changes. SDNN reflects overall autonomic variability, including both sympathetic and parasympathetic influences. This effectively confirms the importance of parasympathetic activity in the analysis of stress and how this activity can correctly be identified by AI methods.
Another important finding is the limited use of non-linear HRV features: only 2–3 out of the 15 included studies employed them, despite substantial evidence indicating that non-linear metrics are among the most sensitive indicators of subtle changes in RR interval dynamics [11,12,13,14,15].
(ii) Where (in what settings) are stress and pain typically assessed?
The studies spanned multiple application domains as clinical settings: hospitals and rehabilitation centres (e.g., Mendes et al. [38], Byun et al. [43] studied the stress in psychiatric conditions (e.g., depression, panic disorder); research laboratories: controlled experiments to induce or detect stress (e.g., Bahameish et al. [46], Dahal et al. [26]) and in non-clinical setting: general health, wearable validation, and sport medicine-related applications (e.g., Coutts et al. [47], Akbulut et al. [45]).
(iii) Who (and how many) subjects are involved in the selected papers?
The number of subjects involved ranged from 20 (Moridani, [50]) to 652 (Coutts, [47]). All the included subjects were adults (age 18+ years). As shown in Table 5, column 4, samples are often unbalanced, with most bigger datasets biased towards women and most smaller datasets biased towards men. This is often correlated with the type of setting of the study, with most studies revolving around mental health and metabolic disorders showing an imbalance towards female subjects (such as [43,45] and [47]), whereas physical-centred works are more often with more male subjects (such as [38] and [44]). A correlation has been found between the number of subjects and the performance of the analyzed models, with bigger datasets often displaying slightly lower metrics. This is a natural consequence of the increased complexity of the task and the reduced risk of overfitting for machine learning methods.
(iv) When are subjects included? (What are the main conditions or diseases addressed in the study? Were healthy subjects also included?)
Disorders mentioned were cardiovascular diseases [38], cancer [51], mental health conditions [43], spinal cord injury, and metabolic syndrome [46]. Healthy participants were often used as a baseline for comparison, for model training and validation (e.g., [41,43,45]), and in laboratory stress-induced experiments (e.g., [46,48,50]).
Due to the absence of a consensus on the definition of stress, we also collected in Appendix D, the definitions of stress as reported in the text of the 15 analyzed works. The heterogeneity of the definition of stress found in the studies shows that the WHO definition of stress (Appendix A.1) is the most general and comprehensive, as it covers all possible meanings of stress while highlighting the impact of stress on the body. For the sake of clarity, we divided the stress into two types: psychological and physiological stress, and a prominence of the first over the second one was found (see Table 4 and Table 7, and Appendix D). As reported in Results, the analysis of the type of stress and the induction protocol used confirms the heterogeneity of stress and the induction protocols used. The most common protocols include mental arithmetic (e.g., [42,43]), daily life situations (such as work or driving (e.g., [40,49]), and watching videos (e.g., [45,48]).
This confirms that HRV could be an excellent biomarker of stress both in cases where stress is a tangible, physical reaction to fatigue (as physiological stress, acute or chronic) and in cases where instead, the perceived stress correlates with anxiety and mental fatigue (as psychological stress, acute or chronic ) and different types of stress require distinct assessment approaches (see Appendix D).
(v) Why (and what are) the most employed ML models that can assess stress?
Most models were used for classification tasks, distinguishing between stress/non-stress states or identifying psychological conditions. The most common models were ML: random forest (e.g., [48,49,51]); support vector machines [40,46,48,51]; and deep learning approaches, including GRU [44] and other deep neural network (DNN) architectures [47,51]. The most common validation strategy is accuracy, which is employed in 10 out of 15 works and is therefore considered the preferred metric, followed by other predictive performance measures such as F1-score [41,46,48], precision and recall [40,46], and error rate [49].
In the analyzed studies, model performance was primarily assessed using quantitative evaluation metrics. The most commonly reported performance metric was accuracy, employed to measure the proportion of correct classifications between stress and non-stress states. However, relying solely on accuracy may not fully capture model robustness, especially in the presence of class imbalance. To address this, several works also reported discrimination metrics such as the area under the receiver operating characteristic curve (AUC) [43,46], which provides a more comprehensive assessment of classification performance. In addition, cross-validation methods (e.g., k-fold or leave-one-out validation) [51] were used as validation strategies to ensure model generalizability and mitigate overfitting.
(vi) How do the models perform in assessing stress?
Multimodal approaches (e.g., combining HRV with EEG or r-PPG, and surveys) generally yielded better performance (e.g., [41,48,49]). It must be noted that, while multimodal approaches are favourable due to the introduction of several complementary methods for stress analysis, which consequently increases model accuracy, integrating multiple sensors increases system complexity, which may, in turn, heighten the risk of signal artefacts or calibration errors if not properly synchronized and validated. Physiological sensors [37], in fact, are subject to a series of issues such as impedance caused by sweat, missing data, and external noise, and while most signals can be reconstructed via imputation or denoising, it is still preferable to reduce to a minimum the number of employed sensors or increase the quality of the sensors [40,43,44,45,49]. At the same time, surveys [5,42,45,46,47,48] are subject to bias as they are subjective, self-assessed measurements, and are therefore less reliable compared to sensors, while still informative for the evaluation of psychological stress.
A summary was reported in Table 7.
Table 7. Summary table: different types of stress ((I) physiological; (II) psychological stress), and the settings in the 15 selected papers in the same order as reported in paragraphs 3.1 (supervised physiotherapy exercise); 3.2 (ML for HRV stress analysis); 3.3 (neural network solutions); and 3.4 (ECG alternative); * same datasets.
Stress type:
I Physiological, II Psychological
Authors (First Name)Ref.Where (Setting)Who (Population)Par.
IMendes[38]Hospital/RehabilitationPost-CABG patients3.1
II (Anxiety)Ritsert[39]LaboratoryHealthy adults3.1
II (Mental)Byun[43]Clinical/PsychiatryPatients with MDD, Panic Disorder3.2
IIPremchand[41]LaboratoryHealthy adults3.2
IIAkbulut[45]Clinical settingMetabolic syndrome patients3.3
II (Mental/General)Coutts[47]Wearable/Real-lifeGeneral adult population3.3
II Zhong[44]Experimental/WearableHealthy adults3.3
II (Mental)Liu[48]LaboratoryHealthy adults3.4
II (Mental)Tutunji[49]NaturalisticUniversity students3.4
I and II (General)Dahal[26]Wearable devicesGeneral adult population3.2
I and II (General/Mental)Benchekroun[42]Dataset-based *Mixed populations3.2
I and IIDalmeida[40]Wearable/Real-lifeHealthy adults3.2
I and IIBahameish[46]Dataset-based *Not specified3.3
I and IIJeong[51]Clinical (radiation therapy)Cancer patients3.4
I and IIMoridani[50]Dataset-basedHealthy adults3.4
HRV analysis emerges as a versatile tool for characterizing different stress contexts: it captures immediate autonomic reactivity in acute stress, reflects allostatic load in chronic stress, monitors fatigue and recovery in physiological stress, and provides insights into emotional and cognitive regulation in psychological stress. As summarized in Table 4 and Table 7, among the fifteen studies included in this review, the majority investigated psychological stress (n = 9), while only one study focused exclusively on physiological stress, and five examined both physiological and psychological components. Most studies addressed mixed stress conditions, encompassing both acute and chronic dimensions. Overall, these findings indicate that current research predominantly targets psychological and combined stress models, whereas investigations centred solely on physiological stress remain limited. This imbalance highlights a gap in the literature and underscores the need for further research specifically addressing physiological stress responses in controlled or clinical settings.

5. Discussion

The primary objective of our work was to determine whether HRV can serve as a physiological biomarker of stress in adult populations. The evidence synthesized across the included studies supports this conclusion, showing that HRV can capture autonomic dysregulation associated with different stress models. This is further reinforced by clinically relevant applications in other critical events, such as the work by Calderón-Juarez et al. [52] on autonomic dysreflexia, where HRV changes anticipate acute autonomic crises.
The second objective of the review was to map how AI and machine learning techniques have been applied to enhance the predictive potential of HRV in stress assessment. However, establishing a clear hierarchy of “best-performing” AI models is not feasible within this scoping framework due to the substantial heterogeneity across studies in terms of datasets, sample sizes, experimental conditions, stress paradigms, sensor modalities, feature sets, and model validation approaches. Despite this variability, all included studies present sound methodological foundations, and together they offer researchers a broad landscape from which to identify the models and HRV feature sets most suitable for their own experimental or clinical context.
A final point of reflection concerns the typology of HRV features, particularly the distinction between linear and non-linear measures. Non-linear HRV metrics have already been demonstrated in other fields [12,13] to have a superior ability to capture fine-grained dynamical structures of autonomic regulation that may not be detectable through linear approaches alone. The reviewed literature confirms that this distinction is also relevant in stress research, where non-linear features often contribute meaningful predictive information.
Taken together, these elements clarify the purpose of the review: not to rank AI models, but to provide a methodological and conceptual map showing (i) that HRV is a viable biomarker of stress, (ii) that AI techniques can further amplify its predictive value, and (iii) that future studies will benefit from harmonized protocols enabling more robust comparative analyses.
This scoping review aims to explore how AI techniques are applied to HRV analysis for stress detection and prediction in adult populations, mapping the current evidence base, identifying gaps in the literature, and guiding future research directions in the application of physiological signal analysis, particularly HRV, for stress detection across various clinical and non-clinical environments. This highlights a gap in the literature and suggests the need for further investigation into physiological stress responses in controlled or clinical settings.
Affective computing is a promising field of study within computer science and AI that focuses on designing systems and devices that can recognize, interpret, process, and simulate human emotions [53].
The selected studies implement several best practices to address methodological limitations, such as feature selection and validation strategies.
On the other hand, the limited size and the noticeable specificity of many datasets generally used for the current studies in affective computing and healthcare research move us to prudence while developing ML algorithms to avoid biased models and misrepresented results. Therefore, some researchers deal with serious limitations and, at times, risk using irrelevant features, overlapping data, redundant segmentation, and other artefacts to boost their dataset size in the presence of class imbalance [54].
Moreover, there is still widespread use of measuring tools and metrics for psychometric properties and variables that lack validation or standardization, leaving such measures as study-dependent, ad hoc scales without uniformity, thus making it difficult to compare the literature in a consistent manner [5].

5.1. Gamification and Rehabilitation

An area of potential future development concerns the systematic exploration of the relationship between gamification and rehabilitation. Gamification and distractive coping are two psychological strategies that have been studied for their ability to reduce stress, anxiety, and pain [55]. In psychology, distractive coping refers to the use of mental or physical activities that shift attention away from a stressful or painful experience. This can include listening to music, playing games, solving puzzles, or engaging in movement or breathing exercises. The goal is to reduce the emotional and physiological impact of stressors by redirecting focus toward a more neutral or pleasant stimulus. Gamification, on the other hand, is the use of elements from games, such as points, levels, achievements, or interactive feedback, applied in non-game contexts like health or rehabilitation [56].
When used in psychological interventions, gamification increases motivation and emotional involvement, which can improve adherence to treatment and support cognitive reframing of discomfort or fear. In clinical settings, these approaches are often integrated into cognitive-behavioural therapies, relaxation protocols, or mobile health applications [57]. They have been shown to help patients manage chronic stress and anxiety, especially when traditional methods are not fully effective. For example, in chronic pain conditions, gamified tasks can promote positive engagement while reducing the perception of pain intensity, and distractive coping can decrease ruminative thinking and autonomic arousal. These mechanisms, while primarily psychological, are also reflected in physiological changes such as reduced HR, increased HRV, and improved emotional regulation, which are key indicators of resilience and recovery in rehabilitation contexts. In this context, listening to music can be profitably used to reduce the HR and consequently have a favourable effect on stress [58]. Specifically, it was observed that music may have a minor impact on a healthy person’s HR, but it can be more effective in patients with reduced variability or in healthy individuals under certain conditions, like stress [58] or ageing [59]. Some research [58] has demonstrated controversial effects of music listening on the ANS when examined noninvasively using HRV analysis. Inconsistent results may be due to differences in musical stimuli, emotional content, receiver preferences, and methodological heterogeneity [58,60].
Although the use of gamification in healthcare settings is still in a relatively early stage, available evidence indicates that the integration of game elements can promote engagement, motivation, and therapeutic continuity, factors particularly relevant in neurological rehabilitation pathways, often characterized by repetitive and prolonged exercises over time [55,56]. For example, in the context of chronic pain management, the Pain-Mentor application has demonstrated high acceptability by expert professionals, who have recognized its potential to facilitate learning and the adoption of coping techniques through gamified mechanisms [57]. In line with these findings, it has been hypothesized that the adoption of gamification in cognitive training protocols, such as attentional bias modification therapy (ABMT), can counteract the reduction in adherence due to the monotonous nature of the activities, promoting greater participation by patients with chronic pain [61]. Furthermore, the use of immersive gamified environments based on virtual reality has shown encouraging preliminary results in improving the perceived effectiveness of rehabilitation activities and their adherence to evidence-based clinical practices [62]. This evidence, although still limited, suggests that gamification may constitute a promising complementary approach in neurorehabilitation, with potential benefits in terms of neuroplasticity, personalization of interventions, and transfer of skills into daily life. However, future studies are needed to systematically explore this intersection, evaluating its effectiveness in specific neurological populations and identifying the most relevant motivational dynamics for optimizing rehabilitation outcomes.

5.2. Limitations of the Study and Future Directions

As is typical of scoping review methodology, no formal appraisal of the methodological quality of included studies was conducted. Therefore, the findings reflected the range and scope of available literature, but not necessarily its rigour or risk of bias.
Only studies published in English were included, which may have led to the exclusion of relevant data published in other languages, potentially introducing language bias. Our search strategy was initially designed to prioritize biomedical and interdisciplinary sources and consequently relied on PubMed, Scopus, and Google Scholar; as a result, studies indexed exclusively in technical databases or in grey literature sources may not have been captured. The inclusion of engineering-oriented databases, such as IEEE Xplore or ACM Digital Library, would have further strengthened the completeness of the search, particularly given the relevance of AI and signal processing research in these venues. Our search was also restricted to studies published between January 2005 and January 2025, and relevant work outside this range may not have been included. The included studies displayed substantial heterogeneity in terms of populations, methods, settings, and outcomes, making synthesis challenging and limiting the generalizability of the findings. Although inclusion criteria were predefined, screening and study selection were subject to two reviewers’ interpretation, which might have introduced selection bias. Due to the descriptive and exploratory nature of a scoping review, the results did not aim to provide pooled effect sizes or statistical comparisons but rather structured descriptive statistics.
Another limitation of this review concerned the heterogeneity of stress types represented across the included studies, ranging from clinical and physiological stress to experimentally induced acute psychological stress (as described in Table 7 and in Appendix D). This variability complicates direct comparisons and reduces the generalizability of specific findings; however, it also reflects the limited number of studies applying HRV and AI to stress assessment. Future work may benefit from stress-type-specific reviews (e.g., HRV and psychological stress only) to enhance comparability and clinical relevance. Our search strategy and use of broad terms were, in fact, consistent with previously published scoping reviews in the rehabilitation field, such as the work by Facciorusso et al. [63] on muscle synergies in upper limb stroke rehabilitation, which similarly employed comprehensive MeSH terms to map methodological gaps and emerging research directions.

6. Conclusions

RR time series can be leveraged to analyze heart rate variability (HRV) and identify physiological biomarkers for the objective assessment of stress in rehabilitation.
This scoping review highlights how HRV analysis represents a promising tool for stress monitoring, particularly through features such as RMSSD, SDNN, LF/HF ratio, and pNN50, which reflect autonomic nervous system activity in response to stressors. HRV was primarily measured using wearable devices across clinical (e.g., hospitals, rehabilitation centres), experimental (e.g., laboratory settings), and non-clinical contexts (e.g., general health, sports medicine). However, a marked heterogeneity was observed in terms of application settings and participant populations. Among the 15 selected studies, participants included both healthy individuals (36%) and patients with cardiovascular, metabolic, or mental health conditions (12% in total), while in 51% of the cases, the health status was unspecified. Sample sizes ranged from 20 to 652 participants, and only one-third of the studies relied on existing datasets.
Notably, the review identified a significant gap in the current literature: the complete absence of studies focused specifically on individuals with SCI. This represents a clear opportunity for future research in this population. Other gaps found in the literature are the scarcity of works on physiological stress, the limited size of most employed datasets, and the absence of standardized measurements and tools.
From a methodological perspective, the most used machine learning models for stress classification were random forests and support vector machines, while deep learning approaches (e.g., GRUs, other DNNs) were less frequent but showed promising results. Model performance varied considerably (accuracy ranging from 56% to 92%), with higher performance generally reported in multimodal approaches that integrated physiological data with subjective measures.
The reviewed literature highlights a growing convergence between physiological signal analysis and AI-based models for objective stress and pain assessment in rehabilitation contexts. Despite promising findings, particularly in HRV-based stress prediction using wearable devices, there remains a clear need for standardized protocols and validation across diverse populations, especially those with complex conditions such as SCI.
Closing this gap will depend on coordinated multidisciplinary work and the adoption of more sophisticated AI-enabled non-linear analyses to reliably distinguish stress, pain, and fatigue, physiological constructs that currently lack validated objective measures, particularly within rehabilitation frameworks employing gamification.

Supplementary Materials

The following supporting information can be downloaded at: https://www.mdpi.com/article/10.3390/app16010023/s1, Table S1: PRISMA 2020 Checklist. Reference [72] is cited in the supplementary materials.

Author Contributions

Conceptualization, G.Z., C.R., M.C.G. and C.N.; methodology, C.R., S.R., G.Z., M.C.G. and C.N.; data curation, G.P., V.Z., F.F. and M.C.; writing, original draft preparation, S.R., G.Z., C.R., M.C.G. and C.N.; writing, review and editing, V.Z.; G.Z. and C.R.; supervision, C.B., G.Z. and C.R. All authors have read and agreed to the published version of the manuscript.

Funding

This research received no external funding.

Institutional Review Board Statement

Not applicable.

Data Availability Statement

Not applicable.

Conflicts of Interest

The authors declare no conflicts of interest.

Abbreviations

HRVHeart rate variability
RQARecurrence quantification analysis
NNNormal beat-to-beat
mRMRMinimum redundancy maximum relevance
RMSSDRoot mean square of successive differences
SDNNStandard deviation of NN intervals
NN50Number of pairs of successive NN intervals that differ by more than 50 ms
pNN50Percentage of successive NN intervals that differ by more than 50 ms
CABGCoronary artery bypass grafting
GSRgalvanic skin response
SWELLSmart Reasoning for Well-being at Home and at Work
WESADMultimodal Dataset for Wearable Stress and Affect Detection
SVMSupport vector machine
RFRandom forest
RFERecursive feature elimination
FFNNFeed-forward neural network
KNNK-nearest neighbours
EMAEcological momentary assessments
GRUGated recurrent units
BRVBreath rate variability
EDAElectrodermal activity
SHAPShapley additive explanations
ApEnApproximate entropy
α2Long-range correlations

Appendix A

Appendix A.1. Definition of “Stress” by WHO

“Stress can be defined as a state of worry or mental tension caused by a difficult situation. Stress is a natural human response that prompts us to address challenges and threats in our lives. Everyone experiences stress to some degree. The way we respond to stress, however, makes a big difference to our overall well-being.” [64]
Questionnaires to Assess the Subjective Experience of Stress

Appendix A.2. Patient Health Questionnaire (PHQ-9) for Depression Assessment [5]

Depressive symptoms of patients are assessed through the 9-item Patient Health Questionnaire (PHQ-9), used to evaluate stress factors such as quality of sleep, loss of appetite and loss of interest in daily activities. It is a self-reported questionnaire with a 4-point scale of the daily impact of stress factors (0: not at all; 3: nearly every day) over the two weeks preceding the administration, with a final 4-point scale evaluation of the impact of depressive conditions on life quality (0: not difficult at all; 3: extremely difficult.

Appendix A.3. General Health Questionnaire

Psychological distress and perceived well-being were measured using the 12-item General Health Questionnaire (GHQ-12) [65]. It is a self-report questionnaire about symptoms that happened in the two weeks before administration, with a 4-point Likert scale (0: more than usual; 3: much less than usual).

Appendix A.4. Rating of Perceived Exertion (RPE)

RPE is an index used for assessing an individual’s perception of the physical demands of an activity [66]. The most widely used RPE measure is the “Borg scale,” a psychophysical, category scale with ratings ranging from 6 (no exertion at all) to 20 (maximal exertion). The Borg and CR10 measures have shown reliability and validity in healthy, clinical, and athletic adult populations, whereas the OMNI-RPE has shown greater reliability and validity with pediatric groups [67,68].

Appendix A.5. Akbulut et al. [45] Questionnaire

Which mood do you generally feel? (depressed, anxious, emotional, happy, unhappy)
  • Have you seen any of these video clips before? (yes/no)
  • Did you close your eyes during the demonstration? (yes/no)
  • Which emotion did you feel when watching the videos? How would you rate this feeling on a scale from 1 (lowest) to 10 (highest)?

Appendix B

Appendix B.1. Confusion Matrix, Accuracy, Precision, Recall, and F1 Score

The confusion matrix is a fundamental tool in evaluating the performance of classification models. It provides a structured representation of the relationship between predicted and actual labels, thereby allowing researchers to identify not only the overall accuracy of a model but also the specific types of errors it produces. Consequently, it serves as a critical instrument for assessing the reliability and validity of predictive systems.
Table A1. Confusion matrix and prediction.
Confusion MatrixPREDICTED
ACTUALTPFN
FPTN
TP (True Positives): Number of correctly classified samples belonging to a certain class.
  • FP (False Positives): Number of samples misclassified as a certain class when they belong to other classes.
  • TN (True Negatives): Number of correctly classified samples in other classes.
  • FN (False Negatives): Number of samples belonging to a certain class that were misclassified as other classes.
Based on the previous definitions, the evaluation metrics considered for the model are as follows:
Accuracy (ACC) measures the proportion of correct classifications relative to the total.
A C C   =   T P   +   T N T P   +   F P   +   T N   +   F N
Precision indicates the percentage of true positives out of all positive predictions.
Precision   =   T P T P   +   F P
Recall measures the model’s ability to correctly identify samples of a specific class.
Recall   =   T P T P   +   F N
The F1 score is the harmonic mean of precision and recall, providing a balanced measure of the model’s performance.
F 1   =   2     Precision     Recall Precision + Recall
The average of these metrics across different classes is calculated to obtain an overall evaluation of the model’s performance.

Appendix B.2. Area Under the Curve (AUC), Area Under the ROC Curve

The area under the curve (AUC) is a widely used metric for assessing the performance of classification models, particularly in the context of binary outcomes. Derived from the receiver operating characteristic (ROC) curve, the AUC quantifies the model’s ability to discriminate between positive and negative classes across all possible decision thresholds. An AUC value of 1.0 indicates perfect discrimination, whereas a value of 0.5 reflects random performance. As such, the AUC provides a threshold-independent measure of model effectiveness and is often preferred when evaluating classifiers in domains where class imbalance or varying misclassification costs are present.

Appendix B.3. Matthew’s Correlation Coefficient (MCC)

MCC is a statistical measure used to evaluate the quality of binary classifications. Unlike accuracy, it works well even when the classes are imbalanced (e.g., many more negatives than positives).
M C C   =   T P     TN     FP     FN ( TP   +   FP ) ( TP   +   FN ) ( TN   +   FP ) ( TN   +   FN )
  • 1: Perfect prediction (all samples correctly classified).
  • 0: Random prediction (no better than chance).
  • −1: Total disagreement between prediction and observation (completely wrong classification) [69].

Appendix C

Breathing Heart Variability (BRV)

BRV is a non-invasive method for determining changes in blood volume in the blood vessels. Photoplethysmography has gained popularity as a way to extract physiological measures like SpO2 and HR. Breathing can have an impact on the photoplethysmogram signal, which modifies its amplitude, intensity, and frequency by causing respiratory sinus arrhythmia [70]. BRV is analogous to HRV, but instead of analyzing beat-to-beat fluctuations of the heart, BRV examines the cycle-to-cycle fluctuations in respiration [71]. The key distinction is that, in contrast to HRV, which is triggered involuntarily, BRV is both deliberately and involuntarily controlled.

Appendix D

Table A2. Summary table of the definitions of stress, the types of stress (I physiological, II psychological), and the stress induction protocol in the 15 included works. Italics were used to enlighten relevant words.
Authors
(First Name)
Stress Definition Reported in the TextStress TypeStress Induction Protocol
Mendes [38]Physiotherapy exercises to induce heart fatigue IShort-term supervised inpatient physiotherapy exercise protocol
Ritsert [39]Psychological condition related to mental health diseases, particularly depression and anxiety disordersIIAnxiety-inducing vs. non-anxiety-inducing video vision
Dalmeida [40]Biological and psychological response to a combination of external or internal stressorsI and IIDriving (periods of rest, highway driving, and city driving), custom: stressful condition after an 8 h work shift.
Benchekroun [41]The reaction people have when faced with demands and pressures bigger than their ability to handleIIMMSD: Stroop Colour Word Test and mental arithmetic, UWS: no induction
Premchand [42]High-pressure environments with high cognitive loadingIICognitive Vigilance Task and Multimodal Integration Task
Byun [43]Affects the ANS, responsible for regulating physiological responses to external stimuliIIMental arithmetic test
Dahal [26]Any form of change that causes physical, emotional, or psychological pressure (WHO definition) and named “Global.”I and IIWESAD: Trier Social Stress Test, SWELL: assigned tasks with interruption and time pressure
Zhong [44]Appears when one’s ability cannot match the requirements of the external environmentIIVirtual reality scenarios
Akbulut [45]Causes negative mental states like depression and anxiety, which adversely affect the quality of life of individuals IIWatching a video and walking
Bahameish [46] Internal bodily feeling that influences mental health and well-beingI and IIWESAD: Trier Social Stress Test, SWELL: assigned tasks with interruption and time pressure
Custom dataset: N-back task and paced breathing
Coutts [47]Psychological factor affecting mental health and cardiac functionIIUndergraduate or postgraduate level exam
Liu [48]Mental exertion which significantly taxes cognitive resources and affects prefrontal cortical functions and HR fluctuationsIIViewing a short film on firefighters’ sacrifice
Tutunji [49]Physiological response to environmental or psychological stressors triggersI and IIUniversity examination week
Moridani [50]Nervous tension that has an effect on all functions of the human body I and IIWalking and jogging on a treadmill, counting backward by sevens, Stroop
Test, watching a horror movie clip
Jeong [51]Triggers the sympathetic nervous system and leads to physiological changes such as increased heart rate (HR), blood pressure, breathing rate, and muscle stiffnessI and IIRadiation therapy
For each work, we have also highlighted the type of stress induced in the work (physiological vs. psychological) with the indication of how stress levels have been measured and the induction protocol used to generate stress in patients.

References

  1. Kim, H.G.; Cheon, E.J.; Bai, D.S.; Lee, Y.H.; Koo, B.H. Stress and heart rate variability: A meta-analysis and review of the literature. Psychiatry Investig. 2018, 15, 235–245. [Google Scholar] [CrossRef] [Scilit]
  2. Shaffer, F.; Ginsberg, J.P. An overview of heart rate variability metrics and norms. Front. Public Health 2017, 5, 258. [Google Scholar] [CrossRef] [Scilit]
  3. Vučković, A.; Jarjees, M.; Abul Hasan, M.; Fraser, M. Central neuropathic pain in paraplegia alters movement related potentials. Clin. Neurophysiol. 2018, 129, 1669–1679. [Google Scholar] [CrossRef] [Scilit]
  4. Ricci, M.; Pozzi, G.; Caraglia, N.; Chieffo, D.P.R.; Polese, D.; Galiuto, L. Psychological Distress Affects Performance during Exercise-Based Cardiac Rehabilitation. Life 2024, 14, 236. [Google Scholar] [CrossRef] [Scilit] [PubMed]
  5. Kroenke, K.; Spitzer, R.L.; Williams, J.B. The PHQ-9: Validity of a brief depression severity measure. J. Gen. Intern. Med. 2001, 16, 606–613. [Google Scholar] [CrossRef] [Scilit] [PubMed]
  6. Demetriou, C.; Ozer, B.U.; Essau, C.A. Self-Report Questionnaires. In The Encyclopedia of Clinical Psychology; John Wiley and Sons: Hoboken, NJ, USA, 2015; pp. 1–6. [Google Scholar]
  7. Immanuel, S.; Teferra, M.N.; Baumert, M.; Bidargaddi, N. Heart Rate Variability for Evaluating Psychological Stress Changes in Healthy Adults: A Scoping Review. Neuropsychobiology 2023, 82, 187–202. [Google Scholar] [CrossRef] [Scilit]
  8. Voss, A.; Schulz, S.; Schroeder, R.; Baumert, M.; Caminal, P. Methods derived from nonlinear dynamics for analysing heart rate variability. Philos. Trans. R. Soc. A 2009, 367, 277–296. [Google Scholar] [CrossRef] [Scilit]
  9. Mourot, L.; Bouhaddi, M.; Perrey, S.; Cappelle, S.; Henriet, M.T.; Wolf, J.P.; Rouillon, J.D.; Regnard, J. Decrease in heart rate variability with overtraining: Assessment by the Poincaré plot analysis. Clin. Physiol. Funct. Imaging 2004, 24, 10–18. [Google Scholar] [CrossRef] [Scilit]
  10. Marwan, N.; Romano, M.C.; Thiel, M.; Kurths, J. Recurrence plots for the analysis of complex systems. Phys. Rep. 2007, 438, 5–6, 237–329. [Google Scholar] [CrossRef] [Scilit]
  11. Acharya, U.R.; Joseph, K.P.; Kannathal, N.; Lim, C.M.; Suri, J.S. Heart rate variability: A review. Med. Bio. Eng. Comput. 2006, 44, 1031–1051. [Google Scholar] [CrossRef] [Scilit]
  12. Zimatore, G.; Serantoni, C.; Gallotta, M.C.; Guidetti, L.; Maulucci, G.; De Spirito, M. Automatic Detection of Aerobic Threshold through Recurrence Quantification Analysis of Heart Rate Time Series. Int. J. Environ. Res. Public Health 2023, 20, 1998. [Google Scholar] [CrossRef] [Scilit]
  13. Zimatore, G.; Gallotta, M.C.; Campanella, M.; Skarzynski, P.H.; Maulucci, G.; Serantoni, C.; De Spirito, M.; Curz, D.; Guidetti, L.; Baldari, C.; et al. Detecting Metabolic Thresholds from Nonlinear Analysis of Heart Rate Time Series: A Review. Int. J. Environ. Res. Public Health 2022, 19, 12719. [Google Scholar] [CrossRef] [Scilit]
  14. Zimatore, G.; Fetoni, A.R.; Paludetti, G.; Cavagnaro, M.; Podda, M.V.; Troiani, D. Post-Processing Analysis of Transient-Evoked Otoacoustic Emissions to Detect 4 kHz-Notch Hearing Impairment—A Pilot Study. Med. Sci. Monit. 2011, 17, MT41–MT49. [Google Scholar] [CrossRef] [Scilit] [PubMed]
  15. Marwan, N.; Wessel, N.; Meyerfeldt, U.; Schirdewan, A.; Kurths, J. Recurrence-plot-based measures of complexity and their application to heart-rate-variability data. Phys. Rev. E 2002, 66, 026702. [Google Scholar] [CrossRef] [Scilit]
  16. Torres-Valencia, C.; Alvarez-Lòpez, M.; Orozco-Gutiérrez, A. SVM-based feature selection methods for emotion recognition from multimodal data. J. Multimodal User 2017, 11, 9–23. [Google Scholar] [CrossRef] [Scilit]
  17. Tu, T.; Schaekermann, M.; Palepu, A.; Saab, K.; Freyberg, J.; Tanno, R.; Wang, A.; Li, B.; Amin, M.; Cheng, Y.; et al. Towards Conversational Diagnostic Artificial Intelligence. Nature 2025, 642, 442–450. [Google Scholar] [CrossRef] [Scilit]
  18. Russo, S.; Fiani, F.; Napoli, C. Remote Eye Movement Desensitization and Reprocessing Treatment of Long-COVID- and Post-COVID-Related Traumatic Disorders: An Innovative Approach. Brain Sci. 2024, 14, 1212. [Google Scholar] [CrossRef] [Scilit] [PubMed]
  19. Haque, Y.; Zawad, R.S.; Rony, C.S.A.; Al Banna, H.; Ghosh, T.; Kaiser, M.S.; Mahmud, M. State-of-the-Art of Stress Prediction from Heart Rate Variability Using Artificial Intelligence. Cogn. Comput. 2024, 16, 455–481. [Google Scholar] [CrossRef] [Scilit]
  20. Shah, B.; Kunal, S.; Bansal, A.; Jain, J.; Poundrik, S.; Shetty, M.K.; Gupta, M.D. Heart Rate Variability as a Marker of Cardiovascular Dysautonomia in Post-COVID-19 Syndrome Using Artificial Intelligence. Indian Pacing Electrophysiol. J. 2022, 22, 70–76. [Google Scholar] [CrossRef] [Scilit]
  21. Espinosa, H.; Mears, A.; Stamm, A.; Ohgi, Y.; Coniglio, C. Wearable Sensor Technology in Sports Monitoring. Sports Eng. 2025, 28, 4. [Google Scholar] [CrossRef] [Scilit]
  22. Ciolacu, M.I.; Svasta, P. Education 4.0: AI Empowers Smart Blended Learning Process with Biofeedback. In Proceedings of the 2021 IEEE Global Engineering Education Conference (EDUCON), Vienna, Austria, 21–23 April 2021; IEEE: New York, NY, USA, 2021; pp. 1443–1448. [Google Scholar]
  23. Lyu, T.; Ye, M.; Yuan, M.; Chen, H.; Han, S.; Yu, L.; Li, C. Assessment of the Long RR Intervals Using Convolutional Neural Networks in Single-Lead Long-Term Holter Electrocardiogram Recordings. Sci. Rep. 2025, 15, 11912. [Google Scholar] [CrossRef] [Scilit] [PubMed]
  24. Chaddad, A.; Peng, J.; Xu, J.; Bouridane, A. Survey of Explainable AI Techniques in Healthcare. Sensors 2023, 23, 634. [Google Scholar] [CrossRef] [Scilit]
  25. Kang, M.; Shin, S.; Zhang, G.; Jung, J.; Kim, Y.T. Mental Stress Classification Based on a Support Vector Machine and Naive Bayes Using Electrocardiogram Signals. Sensors 2021, 21, 7916. [Google Scholar] [CrossRef] [Scilit]
  26. Dahal, K.; Bogue-Jimenez, B.; Doblas, A. Global Stress Detection Framework Combining a Reduced Set of HRV Features and Random Forest Model. Sensors 2023, 23, 5220. [Google Scholar] [CrossRef] [Scilit]
  27. Mortensen, J.A.; Mollov, M.E.; Chatterjee, A.; Ghose, D.; Li, F. Multi-class stress detection through heart rate variability: A deep neural network based study. IEEE Access 2023, 11, 57470–57480. [Google Scholar] [CrossRef] [Scilit]
  28. Kang, M.; Shin, S.; Jung, J.; Kim, Y.T. Classification of Mental Stress Using CNN-LSTM Algorithms with Electrocardiogram Signals. J. Healthc. Eng. 2021, 2021, 9951905. [Google Scholar] [CrossRef] [Scilit] [PubMed]
  29. Mou, L.; Zhou, C.; Zhao, P.; Nakisa, B.; Rastgoo, M.N.; Jain, R.; Gao, W. Driver Stress Detection via Multimodal Fusion Using Attention-Based CNN-LSTM. Expert Syst. Appl. 2021, 173, 114693. [Google Scholar] [CrossRef] [Scilit]
  30. Tang, S. Classification of Heart Rate Variability (HRV) Based on Attention Mechanism of Transformer Model. In World Congress in Computer Science, Computer Engineering & Applied Computing; Springer: Cham, Switzerland, 2024; pp. 99–107. [Google Scholar]
  31. Scandola, M. Body, Action, and Space Representations in People Affected by Spinal Cord Injuries. In Diagnosis and Treatment of Spinal Cord Injury; Academic Press: Cambridge, MA, USA, 2022; pp. 27–39. [Google Scholar]
  32. Thomschewski, A.; Ströhlein, A.; Langthaler, P.B.; Höller, Y. Imagine there is no plegia. Mental motor imagery difficulties in patients with traumatic spinal cord injury. Front. Neurosci. 2017, 11, 689. [Google Scholar] [CrossRef] [Scilit]
  33. Kim, K.H.; Jeong, J.H.; Ko, M.J.; Lee, B.-J. Using Artificial Intelligence in the Comprehensive Management of Spinal Cord Injury. Korean J. Neurotrauma 2024, 20, 215. [Google Scholar] [CrossRef] [Scilit]
  34. Cramer, S.C.; Orr, E.L.R.; Cohen, M.J.; Lacourse, M.G. Effects of motor imagery training after chronic, complete spinal cord injury. Exp. Brain Res. 2007, 117, 233–242. [Google Scholar] [CrossRef] [Scilit] [PubMed]
  35. Sardi, L.; Idri, A.; Fernández-Alemán, J.L. A systematic review of gamification in e-Health. J. Biomed. Inform. 2017, 71, 31–48. [Google Scholar] [CrossRef] [Scilit] [PubMed]
  36. Velmovitsky, P.E.; Alencar, P.; Leatherdale, S.T.; Cowan, D.; Morita, P.P. Using Apple Watch ECG Data for Heart Rate Variability Monitoring and Stress Prediction: A Pilot Study. Front. Digit. Health 2022, 4, 1058826. [Google Scholar] [CrossRef] [Scilit] [PubMed]
  37. Jerath, R.; Syam, M.; Ahmed, S. The Future of Stress Management: Integration of Smartwatches and HRV Technology. Sensors 2023, 23, 7314. [Google Scholar] [CrossRef] [Scilit]
  38. Mendes, R.G.; Simões, R.P.; Costa, F.D.S.M.; Pantoni, C.B.F.; Di Thommazo, L.; Luzzi, S.; Borghi-Silva, A. Short-term supervised inpatient physiotherapy exercise protocol improves cardiac autonomic function after coronary artery bypass graft surgery—A randomised controlled trial. Disabil. Rehabil. 2010, 32, 1320–1327. [Google Scholar] [CrossRef] [Scilit]
  39. Ritsert, F.; Elgendi, M.; Galli, V.; Menon, C. Heart and Breathing Rate Variations as Biomarkers for Anxiety Detection. Bioengineering 2022, 9, 711. [Google Scholar] [CrossRef] [Scilit] [PubMed] [PubMed Central]
  40. Dalmeida, K.M.; Masala, G.L. HRV Features as Viable Physiological Markers for Stress Detection Using Wearable Devices. Sensors 2021, 21, 2873. [Google Scholar] [CrossRef] [Scilit] [PubMed]
  41. Benchekroun, M.; Velmovitsky, P.E.; Istrate, D.; Zalc, V.; Morita, P.P.; Lenne, D. Cross Dataset Analysis for Generalizability of HRV-Based Stress Detection Models. Sensors 2023, 23, 1807. [Google Scholar] [CrossRef] [Scilit]
  42. Premchand, B.; Liang, L.; Phua, K.S.; Zhang, Z.; Wang, C.; Guo, L.; Ang, J.; Koh, J.; Yong, X.; Ang, K.K. Wearable EEG-Based Brain-Computer Interface for Stress Monitoring. NeuroSci 2024, 5, 407–428. [Google Scholar] [CrossRef] [Scilit]
  43. Byun, S.; Kim, A.Y.; Shin, M.S.; Jeon, H.J.; Cho, C.H. Automated Classification of Stress and Relaxation Responses in Major Depressive Disorder, Panic Disorder, and Healthy Participants via Heart Rate Variability. Front. Psychiatry 2025, 15, 2024. [Google Scholar] [CrossRef] [Scilit]
  44. Zhong, J.; Liu, Y.; Cheng, X.; Cai, L.; Cui, W.; Hai, D. Gated Recurrent Unit Network for Psychological Stress Classification Using Electrocardiograms from Wearable Devices. Sensors 2022, 22, 8664. [Google Scholar] [CrossRef] [Scilit]
  45. Akbulut, F.P.; Ikitimur, B.; Akan, A. Wearable Sensor-Based Evaluation of Psychosocial Stress in Patients with Metabolic Syndrome. Artif. Intell. Med. 2020, 104, 101824. [Google Scholar] [CrossRef] [Scilit] [PubMed]
  46. Bahameish, M.; Stockman, T.; Requena Carrión, J. Strategies for Reliable Stress Recognition: A Machine Learning Approach Using Heart Rate Variability Features. Sensors 2024, 24, 3210. [Google Scholar] [CrossRef] [Scilit]
  47. Coutts, L.V.; Plans, D.; Brown, A.W.; Collomosse, J. Deep Learning with Wearable Based Heart Rate Variability for Prediction of Mental and General Health. J. Biomed. Inform. 2020, 112, 103610. [Google Scholar] [CrossRef] [Scilit]
  48. Liu, I.; Liu, F.; Zhong, Q.; Ma, F.; Ni, S. Your Blush Gives You Away: Detecting Hidden Mental States with Remote Photoplethysmography and Thermal Imaging. PeerJ Comput. Sci. 2024, 10, e1912. [Google Scholar] [CrossRef] [Scilit]
  49. Tutunji, R.; Kogias, N.; Kapteijns, B.; Krentz, M.; Krause, F.; Vassena, E.; Hermans, E. Detecting Prolonged Stress in Real Life Using Wearable Biosensors and Ecological Momentary Assessments: Naturalistic Experimental Study. J. Med. Internet. Res. 2023, 25, e39995. [Google Scholar] [CrossRef] [Scilit]
  50. Moridani, M.K.; Mahabadi, Z.; Javadi, N. Heart rate variability features for different stress classification. Bratisl. Lek. Listy. 2020, 121, 619–627. [Google Scholar] [CrossRef] [Scilit] [PubMed]
  51. Jeong, S.; Pyo, H.; Park, W.; Han, Y. The Prediction of Stress in Radiation Therapy: Integrating Artificial Intelligence with Biological Signals. Cancers 2024, 6, 1964. [Google Scholar] [CrossRef] [Scilit] [PubMed]
  52. Calderón-Juárez, M.; Miller, T.; Samejima, S.; Shackleton, C.; Malik, R.N.; Sachdeva, R.; Dorey, T.W.; Krassioukov, A.V. Heart rate variability-based prediction of autonomic dysreflexia after spinal cord injury. J. Neurotrauma 2024, 41, 1172–1180. [Google Scholar] [CrossRef] [Scilit]
  53. Russo, S.; Tibermacine, I.E.; Randieri, C.; Rabehi, A.; Alharbi, A.H.; El-kenawy, E.S.M.; Napoli, C. Exploiting Facial Emotion Recognition System for Ambient Assisted Living Technologies Triggered by Interpreting the User’s Emotional State. Front. Neurosci. 2023, 19, 1622194. [Google Scholar] [CrossRef] [Scilit]
  54. Dell’Olmo, P.V.; Kuznetsov, O.; Frontoni, E.; Arnesano, M.; Napoli, C.; Randieri, C. Dataset Dependency in CNN-Based Copy-Move Forgery Detection: A Multi-Dataset Comparative Analysis. Mach. Learn. Knowl. Extr. 2025, 7, 54. [Google Scholar] [CrossRef] [Scilit]
  55. Vermeir, J.F.; White, M.J.; Johnson, D.; Van Ryckeghem, D.M.L. Gamified Web-Delivered Attentional Bias Modification Training for Adults with Chronic Pain: Protocol for a Randomized, Double-Blind, Placebo-Controlled Trial. JMIR Res. Protoc. 2022, 11, e32359. [Google Scholar] [CrossRef] [Scilit]
  56. Tabak, M.; Cabrita, M.; Schüler, T.; Thomas, A. “Dinner Is Ready!”: Virtual Reality Assisted Training for Chronic Pain Rehabilitation. In Proceedings of the Extended Abstracts Publication of the Annual Symposium on Computer-Human Interaction in Play, Amsterdam, The Netherlands, 15–18 October 2017; ACM: New York, NY, USA, 2017; pp. 283–289. [Google Scholar]
  57. Marshedi, A.; Wills, G.; Ranchhod, A. Gamifying Self-Management of Chronic Illnesses: A Mixed-Methods Study. JMIR Serious Games 2016, 4, e5943. [Google Scholar]
  58. Raglio, A.; Bellandi, D.; Gianotti, M.; Zanacchi, E.; Gnesi, M.; Monti, M.C.; Montomoli, C.; Vico, F.; Imbriani, C.; Giorgi, I.; et al. Daily Music Listening to Reduce Work-Related Stress: A Randomized Controlled Pilot Trial. J. Public Health 2020, 42, e81–e87. [Google Scholar] [CrossRef] [Scilit] [PubMed]
  59. Goswami, N. Falls and Fall-Prevention in Older Persons: Geriatrics Meets Spaceflight! Front. Physiol. 2017, 8, 603. [Google Scholar] [CrossRef] [Scilit]
  60. Da Silva, S.A.; Guida, H.L.; Dos Santos Antonio, A.M.; de Abreu, L.C.; Monteiro, C.B.; Ferreira, C.; Ribeiro, V.F.; Barnabe, V.; Silva, S.B.; Fonseca, F.L.; et al. Acute Auditory Stimulation with Different Styles of Music Influences Cardiac Autonomic Regulation in Men. Int. Cardiovasc. Res. J. 2014, 8, 105–110. [Google Scholar]
  61. Calderone, A.; Latella, D.; Bonanno, M.; Calabrò, R.S. Towards Transforming Neurorehabilitation: The Impact of Artificial Intelligence on Diagnosis and Treatment of Neurological Disorders. Biomedicines 2024, 12, 2415. [Google Scholar] [CrossRef] [Scilit]
  62. Abulrob, M.A.; Mesraoua, B. Harnessing Artificial Intelligence for the Diagnosis and Treatment of Neurological Emergencies: A Comprehensive Review of Recent Advances and Future Directions. Front. Neurol. 2024, 15, 1485799. [Google Scholar] [CrossRef] [Scilit]
  63. Facciorusso, S.; Guanziroli, E.; Brambilla, C.; Spina, S.; Giraud, M.; Molinari Tosatti, L.; Santamato, A.; Molteni, F.; Scano, A. Muscle synergies in upper limb stroke rehabilitation: A scoping review. Eur. J. Phys. Rehabil. Med. 2024, 60, 767–792. [Google Scholar] [CrossRef] [Scilit]
  64. Available online: https://www.who.int/news-room/questions-and-answers/item/stress (accessed on 11 May 2025).
  65. Salzmann, S.; Salzmann-Djufri, M.; Wilhelm, M.; Euteneuer, F. Psychological Preparation for Cardiac Surgery. Curr. Cardiol. Rep. 2020, 22, 172. [Google Scholar] [CrossRef] [Scilit] [PubMed]
  66. Ritchie, C. Rating of perceived exertion (RPE). J. Physiother. 2012, 58, 62. [Google Scholar] [CrossRef] [Scilit] [PubMed]
  67. Roemmich, J.N.; Barkley, J.E.; Epstein, L.H.; Lobarinas, C.L.; White, T.M.; Foster, J.H. Validity of PCERT and OMNI walk/run ratings of perceived exertion. Med. Sci. Sports Exerc. 2006, 38, 1014–1019. [Google Scholar] [CrossRef] [Scilit] [PubMed]
  68. Gallotta, M.C.; Bonavolontà, V.; Zimatore, G.; Iazzoni, S.; Guidetti, L.; Baldari, C. Effects of open (racket) and closed (running) skill sports practice on children’s attentional performance. Open Sports Sci. J. 2020, 13, 105–113. [Google Scholar] [CrossRef] [Scilit]
  69. Foody, G.M. Challenges in the real world use of classification accuracy metrics: From recall and precision to the Matthews correlation coefficient. PLoS ONE 2023, 18, e0291908. [Google Scholar] [CrossRef] [Scilit] [PubMed]
  70. Meredith, D.J.; Clifton, D.; Charlton, P.; Brooks, J.; Pugh, C.W.; Tarassenko, L. Photoplethysmographic derivation of respiratory rate: A review of relevant physiology. J. Med. Eng. Technol. 2012, 36, 1–7. [Google Scholar] [CrossRef] [Scilit]
  71. Soni, R.; Muniyandi, M. Breath Rate Variability: A Novel Measure to Study the Meditation Effects. Int. J. Yoga 2019, 12, 45–54. [Google Scholar] [CrossRef] [Scilit]
  72. Page, M.J.; McKenzie, J.E.; Bossuyt, P.M.; Boutron, I.; Hoffmann, T.C.; Mulrow, C.D.; Shamseer, L.; Tetzlaff, J.M.; Akl, E.A.; Brennan, S.E.; et al. The PRISMA 2020 statement: an updated guideline for reporting systematic reviews. BMJ 2021, 372, n71. [Google Scholar] [CrossRef] [Scilit]
Figure 1. Flow diagram of literature search, according to PRISMA criteria (http://www.prisma-statement.org/, accessed 10 January 2025), with the steps followed in the manuscript selection procedure. After the application of the selection criteria, the initial 566 manuscripts were reduced to 15.
Applsci 16 00023 g001
Figure 2. Typical processing pipeline from RR time-series preprocessing to model performance evaluation, including feature extraction (time-, frequency-, non-linear-domain metrics, and dimensionality reduction via PCA), feature selection, machine learning classification, and performance assessment (accuracy, precision, recall, F1-score, and AUC); see Abbreviations and Appendix B.
Applsci 16 00023 g002
Figure 3. Word cloud of the 15 article titles generated using WordCloud library in the Python 3.13, word size reflects term frequency and color is used for visual differentiation.
Applsci 16 00023 g003
Table 1. Selection’s criteria.
Inclusion Criteria
  • Article type: original study, journal article, scientific article
  • Article scope: article reports the use of HRV analysis to assess stress (and/or pain) during rehabilitation (AI and gamification approach)
  • Participants: human, adults (>18 ys)
  • Area of application: articles that conducted research in the field of rehabilitation and health
  • Language: English
  • Publication period: the last 20 years
Exclusion criteria
  • Article type: opinion, commentary, letter to the editor, or conference paper
  • Article scope: not related to HRV metrics
  • Participants: animals, newborns, children, and adolescents
  • Area of application: not related to rehabilitation and health
  • Language: not in English
  • Publication period: published >20 years ago
Table 2. Specific search on stress. Please note that the Google Scholar engine does not make any distinction between articles and reviews.
DatabaseSearch Query
“HRV and Stress and Fatigue”“HRV and Non-Linear and Sympathetic”
ArticleReview2024–2025ArticleReview2024–2025
PubMed1271791
Scopus18715211501310
Google scholar420
TOTAL ^ (400)2212217911
^ without considering Google Scholar. Query outcomes from the 3 search engines (articles or reviews). Shaded cells refer to results from 2024–2025 only.
Table 3. Specific search on spinal cord injury (SCI). Please note that the Google Scholar engine does not make any distinction between articles and reviews.
DatabaseSearch Query
HRV, Stress, and SCIRecovery, Sympathetic, and SCISCI and Gamification
ArticleReview2024–2025ArticleReview2024–2025ArticleReview2024–2025
PubMed196411141861838
Scopus70138613861
Google scholar811 6490 1760
TOTAL ^ (249)325692214839
^ without considering Google Scholar. Query outcomes from the 3 search engines (articles or reviews). Shaded cells refer to the total number of manuscripts in 2024–2025, per database.
Table 4. The distribution of the 15 studies according to stress type and condition.
Stress TypeAcuteChronicChronic and AcuteN
Physiological [38]1
Psychological[45][39,43][41,42,44,47,48,49]9
Physiological/Psychological[26] [40,46,50,51]5
Total number of papers (N)221115
Note: only [26] was cited in the Introduction, as it provides general conceptual relevance to the background of this review.
Disclaimer/Publisher’s Note: The statements, opinions and data contained in all publications are solely those of the individual author(s) and contributor(s) and not of MDPI and/or the editor(s). MDPI and/or the editor(s) disclaim responsibility for any injury to people or property resulting from any ideas, methods, instructions or products referred to in the content.