Abstract
A central challenge in tight fault-depression reservoirs is understanding how three-dimensional fracture structures control gas storage and flow. This study introduces a data-driven, geologically informed framework that integrates structural-mechanical coupling to decipher fracture networks within the Shahezi Formation. Our model, based on rock failure criteria, achieves quantitative fracture prediction across one-dimensional to three-dimensional scales. This capability overcomes the limitations inherent in single-method approaches for tight, fracture-dominated reservoirs. By synthesizing sedimentary facies-controlled reservoir modeling, sweet-spot inversion, and geo-engineering integration, we establish a predictive system for accurate reservoir assessment. The continental clastic Shahezi Formation is typified by secondary fractures. This study utilizes leverage small-scale data (core, thin section, log) to quantify key parameters (fracture density, aperture), enabling a systematic analysis of fracture typology, heterogeneity, and controls. Building on this foundation, and spatially constrained by large-scale datasets (seismic interpretation, stress-field simulations), we developed a robust fracture development model for deep tight reservoirs. Stress-field modeling delineated fracture-prone zones, where a discrete fracture network (DFN) model was built to characterize 3D fracture geometry and connectivity. Integrating simulated fracture size and aperture-derived permeability allowed us to quantify fracture contribution to total permeability, ultimately mapping favorable targets. The results identify favorable zones primarily in the western sector of the study area, forming an NS-trending, belt-like distribution. They are mainly concentrated around the wells Changshen-4, Changshen-40, and Changshen-41. This distribution is clearly controlled by the Qianshenzijing Fault.
1. Introduction
The Shenzijing subsag within the Shahezi Formation demonstrates a distinct near-source accumulation pattern [1]. Consequently, identifying the faults and fractures that connect source rocks to fracture-developed reservoirs is critical for constraining gas accumulation [2,3]. They exert a dual influence on the reservoir: enhancing permeability and connectivity in tight rock [4], while mineralized or asphalt-filled fractures can act as barriers, compartmentalizing flow [5]. Consequently, the spatial distribution, genetic analysis, and quantitative attributes of fractures directly determine reservoir performance, representing a key challenge in developing deep, tight-gas resources [6,7,8]. Decades of research have evolved from early qualitative descriptions to current quantitative characterization and predictive modeling [9,10,11,12,13]. Modern natural-fracture analysis falls into two domains: identification and prediction. (1) Fracture identification. This involves techniques to observe, measure, and characterize existing fractures. ① Direct characterization. Methods that visually identify fractures via physical exposure or high-resolution imaging, including outcrops, core observations, computed tomography (CT), and nuclear magnetic resonance (NMR) imaging [14,15,16]. ② Computational interpretation. Techniques inferring fractures from geophysical data, including specialized logging techniques, conventional logging measurements, and micro-seismic monitoring [17,18]. ③ Engineering diagnostics. Using dynamic field data, including water-injection dynamics analysis, well-test interpretation, pressure-transient analysis, and tracer-based diagnostics to interpret fracture properties [19]. (2) Fracture prediction. Predictive methods follow two main approaches: ① Statistics-based approaches. Simulating discrete fracture geometry using statistical rules, including stochastic and fractal models [20,21,22]. ② Based on principles of tectonic stress-field analysis, seismic attribute analysis, or edge-detection methods. These approaches capture the integrated effect of multiple fractures within a given volume. But cannot delineate the spatial state of a single fracture, including tectonic stress-field computation and seismic-based fracture prediction [23,24,25].
However, conventional approaches remain insufficient for fully characterizing both spatial attributes and fracture properties. Traditional fracture-identification techniques can delineate fractures at discrete points but provide limited insight into their impact on spatial extent and fluid flow [26]. Fracture-prediction methods better constrain lateral and vertical distributions. Yet they fail to capture critical details like fracture intersections, individual geometry, and connectivity information essential for evaluating deep, ultra-tight reservoirs [27,28]. To rigorously evaluate the exploration potential of the Shahezi Formation in the Shenzijing subsag, we integrated multi-data combining core observations, image logs, outcrop analysis, and stress-field modeling. This approach enabled us to establish a robust fracture development model and delineate the spatial distribution of fractures. We further investigated the role of these fractures in controlling gas migration and accumulation. Based on the stress-constrained domain, we constructed a three-dimensional discrete fracture network (DFN) model that explicitly represents individual fractures’ orientation, length, and connectivity. By coupling deterministic and stochastic modeling approaches, this integrated methodology overcomes the limitations of conventional approaches, achieves high-resolution characterization of fracture architecture, and refines the prediction of effective fracture distribution [29,30].
2. Geological Setting
The Songliao Basin evolved through a two-phase tectonic history: Middle-Late Jurassic to Early Cretaceous fault subsidence, succeeded by Early Cretaceous post-rift depression [31]. In the southern part of its central depression, the Changling Fault Depression displays a complex tectonic fabric defined by NNE-trending and NS-trending faults. The Qian’an, Qianshenzijing, and Heidimiao Faults act as the master boundary structures, controlling the depression’s stratigraphic architecture and fault geometry [32,33]. The Shenzijing subsag, situated in the central sag belt, constitutes a structurally focused depocenter essential for hydrocarbon accumulation and fracture system development (Figure 1).
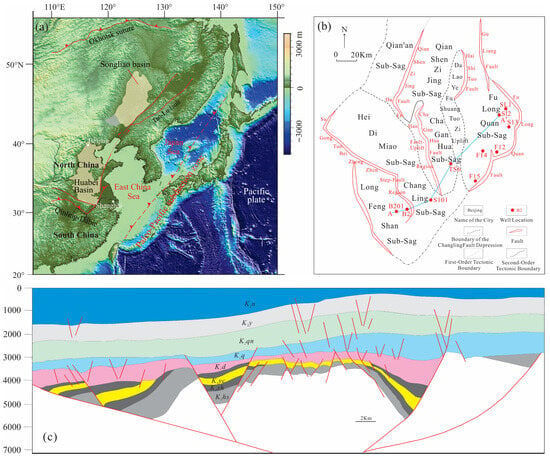
Figure 1.
(a) Topographic map of the northeastern Asian margin, showing the location of the study area (modified from [34]). (b) Tectonic division map of the Songliao Basin. (c) Cross-section of the Changling Fault Depression, showing the distribution of Cretaceous strata.
The Shahezi Formation developed during a major rifting episode, with its evolution governed by tectonic activity and fault segmentation. During this interval, oblique NNW-trending subduction of the Izanagi Plate slowed, while lithospheric delamination triggered crustal relaxation and extension. This process produced normal faults that branched from basement shear zones. The resulting fault steps governed the rise in deep-seated, NNW-trending and NNE-trending shear strike-slip systems and facilitated the establishment of a semi-deep lacustrine environment [35,36,37,38]. Subsequent extension later propagated the rift system. Under a dominant NNW-trending stress field, rift-bounding faults, especially segments oblique to the principal stress direction, controlled the depocenter location. This structural configuration favored deposition of lacustrine dark mudstones and coal seams, which also acted as local seals (Figure 2). Concurrently, the Sunwu-Shuangliao Fault zone showed high activity: the central block was uplifted, while SSE-trending extension formed NNE-trending grabens on both flanks. By the late rifting stage, the Shahezi Formation was confined to local zones within the rift. These zones are mainly located at structural bends where controlling faults change from NNW-trending to NNE-trending. Specifically, these bends are identified as right-stepping, right-lateral restraining bends. Both main rift faults and compression-related secondary faults acted as pathways linking hydrocarbon generation centers to structural traps. Compressional inversion further enhanced trap formation and tectonic fractures, improving conditions for gas accumulation [39]. A deeper understanding of the precise control of strike-slip fault systems on basin filling and their coupling with the regional geodynamic framework plays a crucial role in this study [40].
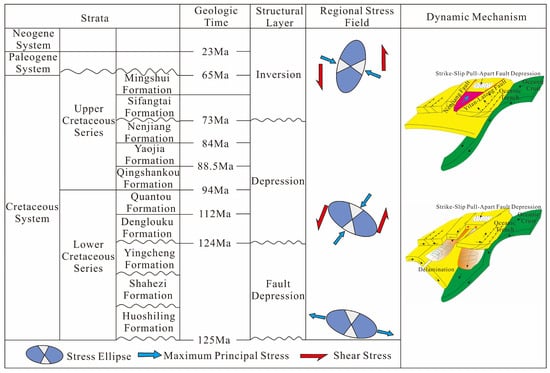
Figure 2.
Fracture development sequence in the target interval of the Changling Fault Depression.
During deposition of the Shahezi Formation, abundant sediments were supplied from the margins of fault depressions. This sediment supply sustained the development of braided-river deltas and fan deltas along the faulted and sagged edges. These coarse-clastic systems grade progressively into fine-grained littoral-shallow lake to semi-deep lake facies toward the depocenter. These finer facies consist predominantly of gray to dark-gray sandstones, siltstones, and silty mudstones. Collectively, the formation records a lacustrine depositional system [41,42]. Sha-1 Member represents a semi-deep lacustrine fan-delta to lake bottom-fan complex, whereas Sha-2 and Sha-3 Members comprise a more stable semi-deep lacustrine fan-delta system. Lithologically, the lower Sha-1 consists of uneven interbeds. These interbeds are dominated by gray to dark-gray mudstone, tuffaceous mudstone, and gray tuffaceous sandstone and siltstone. Locally, thin coal seams are developed within this interval. The middle Sha-2 Member features variably thick interbeds of tuffaceous conglomerate, gray coarse sandstone, and siltstone. The upper Sha-3 Member consists of alternating gray-black to black mudstone and gray siltstone to silty mudstone (Figure 3). The distribution of high-quality reservoir units is strongly controlled by these depositional facies. Consequently, predicted sweet spots represent critical targets for hydrocarbon exploration.
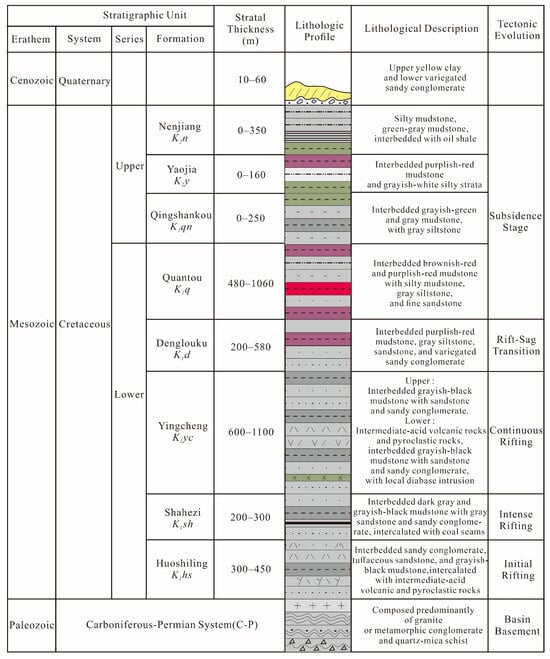
Figure 3.
Changling Fault Depression composite stratigraphic column.
3. Analysis of Fracture Development in the Shahezi Formation
Fracture characterization within the Shahezi Formation was conducted using data from wells Changshen-17, Changshen-39, Changshen-40, and Changshen-41. Among these wells, Changshen-39 intersected all three stratigraphic members of the Shahezi Formation. However, Changshen-40 and Changshen-41 penetrated only the Sha-2 and Sha-3 Members. Fracture abundance is notably lower in wells Changshen-40 and Changshen-41. In the deep Changling Fault Depression, Sha-1 and Sha-3 Members contain black mudstones, indicating high-quality source rocks. However, the Sha-2 Member contains mainly dark-gray mudstones, indicating medium-quality source rock. This geochemical stratification aligns with observed multi-layer gas shows in mud-logging data. Statistical analyses reveal that secondary fractures are most prevalent within the tight sandstones of the Sha-2 Member. Formed during late diagenesis, these fractures are particularly well-developed in well Changshen-39, which exhibits both tectonic and bedding-parallel detachment fractures (Figure 4). Tectonic fractures, resulting from regional stress field fluctuations, are characterized by large apertures, extensive propagation, and strong directional preference. They frequently show mineral infill and display clear cross-cutting and truncation relationships. In contrast, bedding-parallel detachment fractures primarily form in mudstone-rich intervals, especially within interbedded sandstone–mudstone sequences. Under tectonic loading, competent sandstone layers undergo slip along weaker mudstone interfaces, generating relatively wide detachment fractures that are commonly filled with white vein minerals.
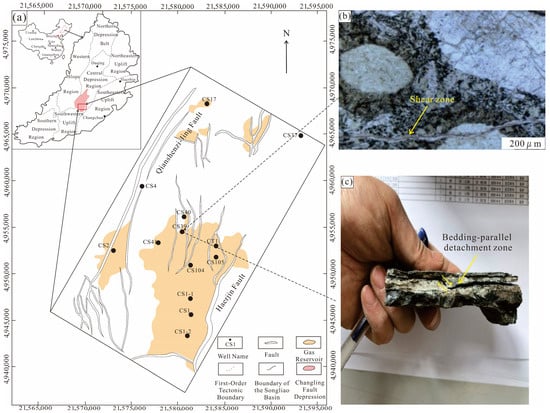
Figure 4.
(a) Boundary of the Shenzijing subsag, Changling Fault Depression (modified from Jilin Oilfield Exploration and Development Research Institute, 2020). (b) Shear fractures. (c) Bedding-parallel detachment fractures. The sample information originates from China.
3.1. Parameters for Fracture Characterization
Core observations show that fracture lengths range from 3 to 45 cm. Among all samples, 41.3% contain fractures measuring between 5 and 10 cm in length. Fracture apertures are predominantly small to medium in scale, with larger fractures being relatively uncommon. Notably, fractures with apertures narrower than 0.5 mm account for 53.4% of the total (Figure 5). Overall, fractures are predominantly moderate to short in length.
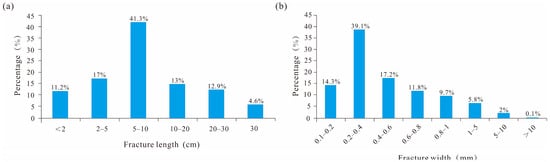
Figure 5.
Shahezi Formation fracture properties. (a) Fracture length. (b) Fracture width.
Core-based observations across the entire Shenzijing subsag indicate that the major fractures are fully filled (78%). Partially filled and unfilled fractures account for 15% and 7%, respectively. Calcite veins constitute the dominant filling material, accounting for approximately 83% of all filled fractures (Figure 6). In addition, a secondary type of dark filling identified in the core as asphaltic material is present. It is smearable, stains the hands, is relatively soft, and exhibits a distinct sheen on slick surfaces.
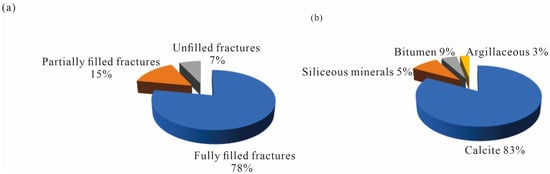
Figure 6.
Shahezi Formation fracture properties. (a) Fracture infilling condition (b) Proportion of fracture fillings.
Mineral infilling reduces fracture pore volume and diminishes their effectiveness as fluid pathways. Unfilled fractures exhibit the most favorable storage and permeability characteristics. Therefore, they constitute the most productive reservoir spaces. Partially filled fractures retain limited flow and storage capacity. In contrast, fully filled fractures are completely occluded by mineral precipitates. As a result, they no longer provide effective porosity or permeability. Core observations show that blast-induced fractures remain unfilled, yet their interiors are predominantly occluded by highly compact silicic minerals. Because these minerals solidified from a molten state, the fracture-fill is as dense as the surrounding matrix, leaving the fractures effectively closed with little potential to act as open conduits. Mud-filled fractures typically form either at or near ancient erosional surfaces or beneath unconformities, where later fluid percolation introduced fine-grained material into the fracture voids. Multiple generations of fracture development and mineralization are visible within the fill textures. Earlier fractures are overprinted and sealed by later mineral phases. This indicates that at least two distinct tectonic events influenced fracture formation in the Shenzijing subsag. Each event was accompanied by a corresponding episode of fluid migration and mineral precipitation (Figure 7).
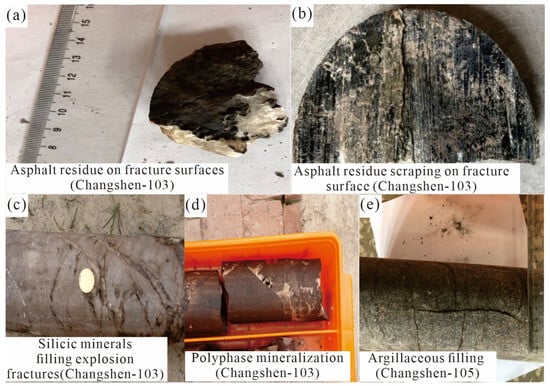
Figure 7.
Different fracture-filling materials in the Shenzijing subsag. (a) Asphalt residue on fracture surface, well Changshen-103. (b) Asphalt residue scraping on the fracture surface, well Changshen-39. (c) Silicic minerals filling explosion fractures, well Changshen-103. (d) Polyphase mineralization, well Changshen-103. (e) Argillaceous filling, well Changshen-105. The sample information originates from China.
Imaging log interpretation indicates a dominant fracture trend in the Shahezi Formation. The fractures are oriented along NNE-trending and NEE-trending. This interpretation is based on a near north-south compressional stress regime. In the Shenzijing, high-angle fractures are dominant, oblique fractures are secondary, and low-angle fractures are minimally developed. Orientations show three distinct azimuthal modes, with dips concentrated at 45–85° and a principal mode at 65–75°. The azimuth data are well characterized by a triple-nested normal distribution. To enable robust fracture modeling, the dip-angle data were statistically analyzed and transformed into the following normalized distribution in Equation (1):
where WNd (θ,δ) represents a single-set normal distribution; (θ) is the mean azimuth angle of the fracture set; (δ) is the standard deviation of the azimuth angle, defining the dispersion of the distribution [43,44,45]. In Figure 8, the red curve shows pronounced peaks corresponding to (10°, 8), (72°, 20.1), and (82°, 12.8).
WNd (θ,δ) = 0.59WN (72°, 20.1) + 0.1WN (10°, 8) + 0.31WN (82°, 12.8)
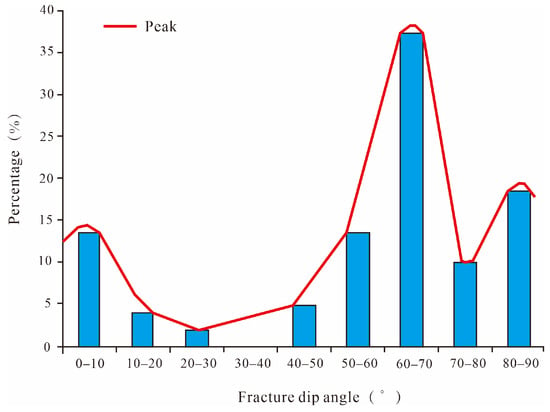
Figure 8.
Classification of fracture dip angles.
Based on core observation and statistical analysis, the fracture linear density (LFd) of the Shahezi Formation was calculated using the expression in Equation (2)
where (Nf) is the total number of fractures within a core interval of length (LB) units: fractures/m. Statistically, the Sha-2 Member exhibits a significantly higher fracture density in wells Changshen-39 and Changshen-40. This density contrasts with the lower values observed in the other members (Table 1).
LfD = Nf/LB

Table 1.
Fracture line density statistics in the Shahezi Formation.
Conventional core-based methods often underestimate fracture density, introducing data bias. This occurs because fracture spacing usually exceeds core diameter, and cores from high-angle fracture zones are frequently fragile and fragmented. This leads to systematic data bias. To accurately predict fracture intensity within the main productive intervals, we applied a vertical centroid-dimension statistical method. This method was specifically used on fracture data from sandstone sub-members II, III, IV, and V of the Sha-2 Member in wells Changshen-39 and Changshen-40 [46]. The calculation is expressed in Equation (3):
where N(r) denotes the average number of fractures within a circular area of radius r (dimensionless); (r) is the radius of the sampling circle (dimensionless); (a) represents the correlation dimension (dimensionless), describing the spatial heterogeneity of fracture distribution; and (c) is a dimensionless constant. Analytical results from well Changshen-39 show that sand group II has the highest fracture density, with N(r) = 1.4993, and sand group with N(r) = 1.1962. Sand group III shows moderate development, with N(r) = 0.8745. Sand group IV displays the lowest fracture intensity with N(r) = 0.6381. In well Changshen-40, sand group IV shows the most intensive fracturing, N(r) = 1.1983. It is followed by sand group II, with N(r) = 0.6147. Fractures in sand groups III and V are nearly absent, with N(r) ≈ 0 (Figure 9). Overall, sand group II of the Shahezi Formation represents the dominant fracture-bearing interval. Fracture development is primarily controlled by lithological variations, and the analytical results are highly consistent with image-log-derived fracture statistics.
N(r) = cra
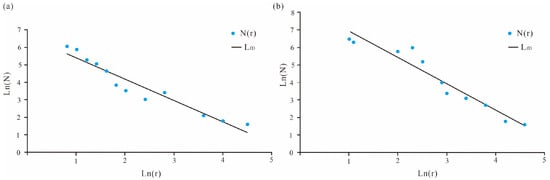
Figure 9.
Dimensional statistics of core centroids. (a) Sand group V, Sha-2 Member, well Changshen-40. (b) Sand group II, Sha-2 Member, well Changshen-39.
3.2. Fracture Heterogeneity
Fracture heterogeneity was characterized by integrating cored intervals from key wells with fracture-sensitive log responses. We established quantitative relationships between log variation and fracture density. These relationships were used to define fracture identification thresholds. The thresholds were then normalized and applied to non-cored intervals. The Shahezi Formation comprises interbedded sandstone and mudstone, with the relatively ductile mudstone layers exerting a primary lithological control on fracture development. Overall fracture intensity shows a gradual decrease. However, this trend is further modulated by local lithological composition and bedding architecture. The combined effect results in a heterogeneous fracture network. Within the relatively uniform tectonic setting of the study area, lithological variability is the dominant factor controlling fracture heterogeneity.
3.2.1. Spatial Variation
Sha-3 Member: The Shahezi Formation exhibits a mudstone-to-sandstone thickness ratio of approximately 3–4, which strongly suppresses fracture development (Table 2). Measured fracture densities reflect this control. Densities decline systematically across the wells. Changshen-39 has 0.024 fractures/m. Changshen-41 has 0.012 fractures/m. Changshen-40 has 0.00754 fractures/m. This trend correlates inversely with the mudstone-to-sandstone ratio. The ratio increases from 3.07 in Changshen-39 to 3.466 in Changshen-41 and to 4.0 in Changshen-40.
Table 2.
Mudstone-to-sandstone thickness ratio in the Shahezi Formation.
Sha-1 Member: Fractures are even scarcer, exemplified by a density of only 0.019 fractures/m in well Changshen-39. This limited fracturing results from the pronounced dominance of mudstone, which attains a thickness roughly four times that of intercalated sandstone layers.
Sha-2 Member: Fracture development in the Shahezi Formation exhibits a pronounced lithologic control. Specifically, fracture density shows a strong positive correlation with the sand-to-mud ratio. In well Changshen-39, the sand-to-mud ratio is 1.335. This ratio is lower than that in well Changshen-40, which is 1.9898. This indicates that sandstone is more extensively developed in Changshen-39. Correspondingly, fracture densities differ between the wells. Changshen-39 has a density of 0.045 fractures/m, while Changshen-40 has 0.036 fractures/m. To further elucidate the degree of fracture development in the Sha-2 Member of the Shahezi Formation, a detailed statistical analysis was conducted on the primary reservoir interval. This analysis focused on fractures within sand groups II-V. The results reveal the following: ① In sand group II, fractures in well Changshen-39 are markedly more developed than those in well Changshen-40. The maximum fracture penetration depth reaches 4.7 m in well Changshen-39. In contrast, it is only 2.4 m in the well Changshen-40. This difference indicates that variations in the sand-to-mud ratio directly govern fracture propagation depth. ② In Changshen-39, fracture density reaches 0.18 fractures/m, with a maximum penetration depth of 3.1 m. The fractured conglomeratic interval is 12.71 m thick, demonstrating a considerable scale of fracture development. Laterally, however, fractures exhibit low continuity across sand bodies. In contrast, Changshen-40 lacks laterally continuous thick sandstone layers. Its thickest continuous sand body is only 6 m, interbedded with mudstone layers that impede vertical fracture propagation. This indicates a key prerequisite: thick, laterally continuous sand bodies are necessary for large-scale fracture development. Conversely, mudstone interbeds act as mechanical barriers. These barriers inhibit fracture extension. ③ In sand groups IV and V, a contrasting fracture development pattern is observed between the two wells. In sand group IV, fractures are poorly developed in the well Changshen-39. In the same group, fractures are better developed in well Changshen-40. Conversely, in sand group V, fractures are well developed in Changshen-39. In this group, fractures are sparse in Changshen-40. This pattern reflects an inter-well inversion in fracture development. In group IV, the sandstone thickness is limited in Changshen-39. In this interval, the sand-to-mud ratio is 1.85, and the fracture density is 0.063 fractures/m. This limited thickness restricts fracture formation. In contrast, Changshen-40 has a lower sand-to-mud ratio of 1.4 and a lower fracture density of 0.044 fractures/m. The thickest single sand layer in Changshen-40 reaches only 7.56 m. In sand group V, however, the maximum single-fracture penetration depth in Changshen-39 is 1.6 m. The corresponding single sand layer thickness is 13.26 m. In comparison, Changshen-40 shows a penetration depth of only 0.74 m (Figure 10).
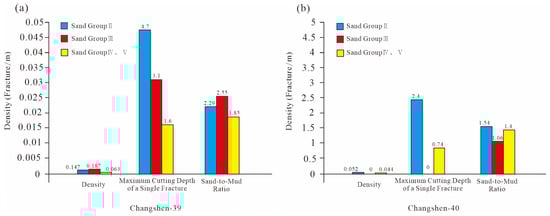
Figure 10.
Comparative analysis of sand groups in the Sha-2 Member of the Shahezi Formation. (a) Spatial variation at well Changshen-39. (b) Spatial variation at well Changshen-40.
3.2.2. Vertical Variation
Sha-3 Member: The stratigraphic column is dominated by mudstone with subordinate sandstone, defining a mechanically weak lithologic profile. In well Changshen-40, mudstone dominates within a sandstone-mudstone interbedding. In this well, fracture density is near zero, and image logs detect no fracture sinusoids. Changshen-41 only reached the upper Sha-3 Member. It also has high mudstone content, with mudstone thickness 4.5 times greater than sandstone. In well Changshen-41, fracture density is merely 0.00754 fractures/m. Minor fractures are restricted to a 5 m thin, fine-grained sandstone interval. The absence of significant fracturing in both wells corresponds to a lack of observable hydrocarbon shows. In well Changshen-39, sandstone and mudstone thicknesses are comparable. In this well, fracture density remains low, at 0.024 fractures/m. Fracture development is locally confined to a 7 m thick fine sandstone unit. Again, the limited fracture network aligns with near-absent hydrocarbon indications.
Sha-2 Member: The sandstone units display strong lateral continuity and enhanced fracturing, with direct hydrocarbon shows observed in tuffaceous sandstone intervals. This corresponds to a marked increase in gas-bearing and sub-gas-bearing layers and a concomitant decrease in dry intervals. In well Changshen-40, fractures are better developed within the relatively continuous sand groups II and IV, yielding a fracture density of 0.036 fractures/m. Log interpretation confirms a sharp rise in gas-bearing and sub-gas-bearing layers and a significant reduction in dry intervals. In well Changshen-39, fracture density reaches 0.045 fractures/m, significantly higher than in the Sha-3 Member. Although the formation is thicker overall, fractures concentrate mainly in tuffaceous sandstones. These sandstones consistently show local hydrocarbon indications. In the Sha-1 Member of the well Changshen-39, lithology is mudstone-dominated. The cumulative mudstone-to-sandstone thickness ratio is 3.73. This ratio defines a mechanically weak formation. Consequently, fracture density remains exceptionally low, averaging only 0.023 fractures/m (Figure 11).
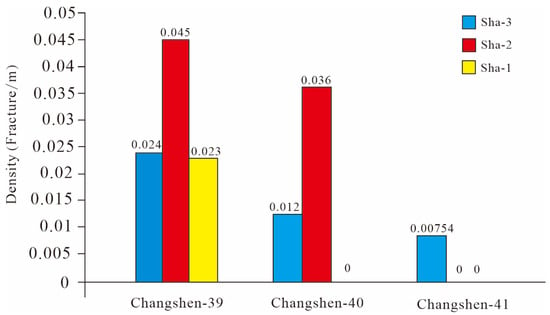
Figure 11.
Comparative analysis of vertical heterogeneity of the Shahezi Formation.
3.3. Principal Controlling Factors of Fracture Development
Analysis of fracture networks reveals substantial heterogeneity in density and orientation, even within a single structural block. This spatial variability produces strong contrasts in reservoir permeability and porosity. This increases exploration uncertainty and raises development risks. It also adds to the inherent scientific complexity of fractured hydrocarbon systems. Despite this complexity, fracture Formation follows deterministic controls including tectonic stress, lithology, and burial depth. Accurate fracture characterization, therefore, requires systematic evaluation of these factors. Resolving the dominant mechanisms that govern fracture development is crucial. This resolution provides the foundation for constructing predictive discrete fracture network (DFN) models. These models must be consistent with known geological drivers. Fracture layer thickness relationship. Mechanical stratification exerts a fundamental control on fracture formation and spatial distribution [4]. Analysis of oblique and bed-terminated fractures in well Changshen-39 reveals that thick sandstone units in the Sha-2 Member act as mechanically rigid beams. These competent layers largely resist plastic flow from adjacent mudstones, restricting strain accommodation along bedding planes. Under tectonic loading, such rigid intervals preferentially undergo internal brittle failure, promoting the development of through-going fracture systems. In contrast, thin sandstone beds tend to deform plastically in a layer-parallel manner, dissipating strain without significant fracturing. Together, these findings support an inverse correlation between fracture density and bed thickness: thicker units foster fewer, but larger and more penetrating fractures (Figure 12).
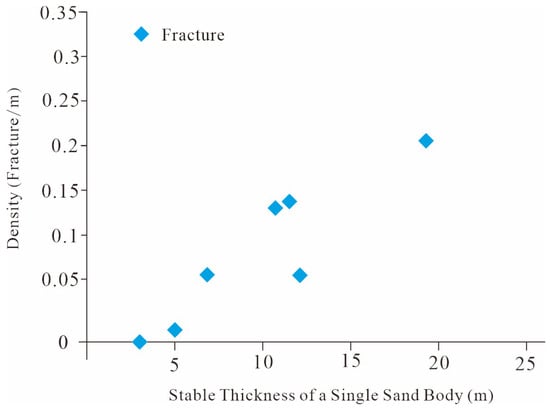
Figure 12.
Relationship between fracture density and stable individual sand body thickness in the Shahezi Formation of well Changshen-39.
Influence of major deep faults. In extensional regimes, faults act as primary architects of fracture networks. Fault-synchronous shear fractures develop at the same time as fault slip. Under the regional stress field, they form conjugate fracture sets. These sets are oriented both parallel and oblique to the fault plane. Although they occur at relatively low densities, these fractures exhibit pronounced lateral continuity. They also show significant vertical penetration. The scale of this continuity and penetration correlates directly with fault displacement. Furthermore, these fractures record the regional tectonic stress signature, enabling paleo-stress reconstruction. Fault disturbance fractures form in response to stress perturbations around active faults. They display variable geometries, including both shear and extensional modes, within localized stress fields linked to fault movement. Typically, these fractures are characterized by high spatial densities but restricted dimensions, ranging from centimeters to decimeters in length. They delineate the fault damage zone and substantially enhance reservoir permeability. Both fracture types are fundamentally controlled by extensional faulting (Figure 13). Together, they exert dual controls on fluid behavior. Fault-synchronous conjugate sets form localized fluid conduits. In contrast, dense disturbance fractures enhance reservoir anisotropy.
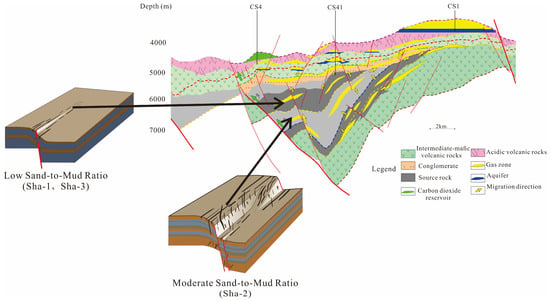
Figure 13.
Fracture development in the Shahezi Formation is jointly controlled by faulting and the sand-to-mud ratio.
4. Discrete Fracture Network Modeling Within Tectonic Stress Field Constraints
Tectonic stress fields exhibit continuous yet systematically varying distributions, and tectonic deformation is widely recognized as the primary control on fracture development [4]. The Shahezi Formation is dominated by mudstone. During the late depositional stage of the Yingcheng Formation, escape-related compressional stresses were active. At that time, the Shahezi Formation readily developed bedding-parallel detachment fractures along lithologic interfaces. This detachment effectively released tectonic stress. As a result, the formation of new fractures was inhibited. Consequently, only the extensional tectonic phase was considered in the stress-distribution modeling for the Shahezi Formation. During the early tectonic evolution of the Shenzijing subsag, mantle upwelling established an extensional stress regime favorable for tensile fracturing. To decipher the fracture evolution from a stress-field perspective, we numerically simulated the regional tectonic stress. This simulation delineates the spatial domain of fracture development. It also identifies the mechanical boundaries that control fracture propagation. Constructing high-resolution, stress-constrained 3D geological models has become a powerful approach. This approach accurately captures reservoir heterogeneity. It also enhances hydrocarbon recovery. In this study, we integrate fracture observations, paleo-stress inversion, and stochastic discrete fracture network (DFN) modeling to build a 3D fracture model [47]. This model resolves the geometry and connectivity of fractures in space. It provides a predictive framework. This framework helps us understand reservoir anisotropy and guides optimized extraction strategies.
4.1. Numerical Simulation of Tectonic Stress Field
4.1.1. Mathematical Model Construction
The finite element method discretizes a continuous elastic medium into a finite set of elements. It couples displacement, strain, and stress through the governing equations of equilibrium, geometric, and constitutive. Computationally, a global stiffness matrix is assembled and solved to obtain the nodal displacement field. Strains are then derived from displacements through geometric relationships, and stresses are subsequently calculated via constitutive laws. This sequential framework provides a complete numerical description of the mechanical behavior of rock masses.
- (1)
- Static Equilibrium Equations
Under mechanical equilibrium, the internal stress state within a body subjected to external forces varies spatially. At an arbitrary point in the domain, we consider an infinitesimal hexahedral element. Its stress field is described by six independent components: , , , , , . Correspondingly, the external force F applied to the element can be resolved into orthogonal components , , and . According to classical continuum mechanics, the loaded body must remain in equilibrium. At every material point, the stress components must satisfy force-balance relations that match the applied external loads. These equilibrium equations link the boundary conditions to the internal stress distribution. They describe how stress is distributed within each elemental volume of the medium. The calculation is expressed in Equation (4):
, , and represent the normal stresses acting along the x, y, and z-axes, respectively. In contrast, , , and correspond to the shear stresses acting on planes oriented normal to the xy, yz, and xz-directions. All stress components are expressed in Pa. Correspondingly, , , and designate the Cartesian components of the external point force, with units of N.
- (2)
- Geometric Equations
When external forces act on the target lithological unit, material points within the structural layer undergo displacements. Because rigid-body translation does not contribute to deformation, only deformational displacements are considered here. Under applied stresses, if a spherical rock volume is distorted into an ellipsoidal shape, an interior point M is displaced to M′. The displacement vector MM′ can be decomposed into three orthogonal components u, v, and w along the x, y, and z-axes, respectively. As the displacement field varies spatially within the rock mass, each displacement component is a continuous function of spatial coordinates. The calculation is expressed in Equation (5):
where u, v, and w denote the displacement components along the x, y, and z-axes, respectively. Their magnitudes carry dimensions consistent with the spatial scale of the system under investigation.
u = u(x, y, z) v = v(x, y, z) w = w(x, y, z)
In three-dimensional space, the normal strains , , and at a given point within a stressed rock mass represents the linear deformation. These deformations occur along the x, y, and z-axes, respectively. The changes in the right angles formed by three mutually orthogonal edges passing through point M with respect to the x, y, and z-axes define the shear strains , , and These shear strains are expressed in Equation (6).
, , and represent the dimensionless normal strains in the x, y, and z-axes, respectively. , , and denote the dimensionless shear strains on the xy, yz, and xz-directions planes.
The equilibrium equations govern the displacement field within the rock mass. However, they do not directly quantify the magnitude or spatial concentration of deformation. In contrast, the geometric equations establish an explicit, quantitative relationship between displacement and strain components. This provides a rigorous description of the deformation state in the rock mass.
- (3)
- Constitutive Equations
In rock mechanics, stress and strain are linked by a well-defined and quantifiable constitutive relationship. For example, in fracture experiments on dense limestone, Ladanyi and Archambault [48] demonstrated that rocks accumulate strain energy from external work during the elastic stage. Once the applied load is removed, this stored energy is completely released, and the rock fully recovers its original geometry. In this regime, stress and strain exhibit a linear one-to-one correspondence. This relationship is described by the constitutive relation given in Equation (7).
where denotes the Young’s modulus (Pa), and represents the Poisson’s ratio (dimensionless).
4.1.2. Geological Model Construction
The goal of this study is to reconstruct the tectonic stress evolution in the Shenzijing subsag. We used ABAQUS software (Version 6.1.4) to build a fault-matrix finite element model (FEM). Due to computational limits and simulation complexity, we simplified the Shahezi Formation’s top structural geometry. Despite this simplification, we kept the key geometric features needed to accurately represent the tectonic framework. We focused the simulation on a representative structural block rather than the full basin. The model preserves two key geological domains: wall rock and fault zones. This reduces structural complexity while retaining critical features such as stress concentrations near structural highs, fault intersections, and fold systems. Secondary structures, such as the Haerjin Fault nose, were simplified to enhance computational tractability. Iterative refinements were then guided by the results of the initial simulations. The model geometry was built from seismic interpretations of the Shenzijing subsag. The geological domain was defined as a 35 km × 43 km rectangular area, covering 1512.8 km2. Its vertical extent was constrained by the burial depth of the Shahezi Formation. The framework incorporates 31 near-NS-trending, 12 NNE-trending, and 1 near-EW-trending major faults. These faults capture the principal tectonic lineaments that control regional stress patterns.
4.1.3. Mechanical Model Construction
The geological model defines the spatial architecture of the study area, whereas the mechanical model forms the computational core for stress field simulation. The simulation covers the entire Shenzijing subsag, where direct in situ mechanical measurements are unavailable. Therefore, we derived mechanical parameters by integrating laboratory triaxial test data with stratigraphic and structural constraints. Rock mechanical properties for different stratigraphic and structural units were assigned using weighted averaging and geological analogy (Table 3). The complex geology was simplified into mechanically homogeneous blocks. A hybrid meshing strategy, combining manual control with automated generation, was applied to preserve key geometries. Quadrilateral elements (S4R) were adopted to balance accuracy and computational cost. This resulted in a high-resolution finite element grid comprising 72,153 elements and 98,954 nodes (Figure 14). Fault zones were explicitly represented as distinct material domains. Customized mechanical properties were assigned to ensure the simulated stress field realistically represents in situ mechanical behavior.
Table 3.
Material parameter values for the physical model of the Shenzijing subsag.
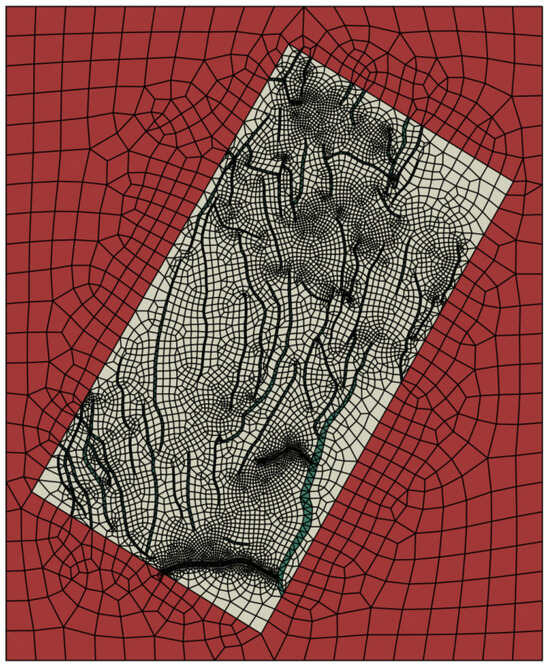
Figure 14.
Grid model of Shenzijing subsag.
The Shahezi Formation functions primarily as a mudstone-dominated hydrocarbon source sequence with subordinate sandstone interbeds. During late Yingcheng Formation deposition [40,41], expulsion-driven compression promoted the development of bedding-parallel detachment fractures along lithological interfaces. These fractures effectively dissipated tectonic stress, preventing its concentration in sandstone units and suppressing the formation of intralayer tensile fractures. The observed fracture systems in the Shahezi Formation largely reflect tectonic inheritance from major pre-existing basement faults in the Shenzijing area. In particular, the extensional reactivation of underlying Sha-2 Member faults, whose scale and activity directly controlled fracture intensity, played a key role. Accordingly, numerical simulation of the Shahezijing Formation targeted the extensional stress regime during the Sha-2 Member phase. The mesh was optimized to reduce computational cost while maintaining accurate boundary condition implementation. In the early-stage model (model V) representing Shenzijing subsag evolution, a near EW-trending extensional stress gradient was applied. Displacement constraints were imposed on the base and on the NW-trending, NE-trending, and SW-trending boundaries along the x, y, and z-axes Trial simulations reproduced regionally observed deformation patterns. This confirms that the modeled early extensional stress distribution closely corresponds to the actual fracture formation mechanisms (Table 4, Figure 15).
Table 4.
Selection of boundary conditions for the structural model of the Shenzijing subsag.
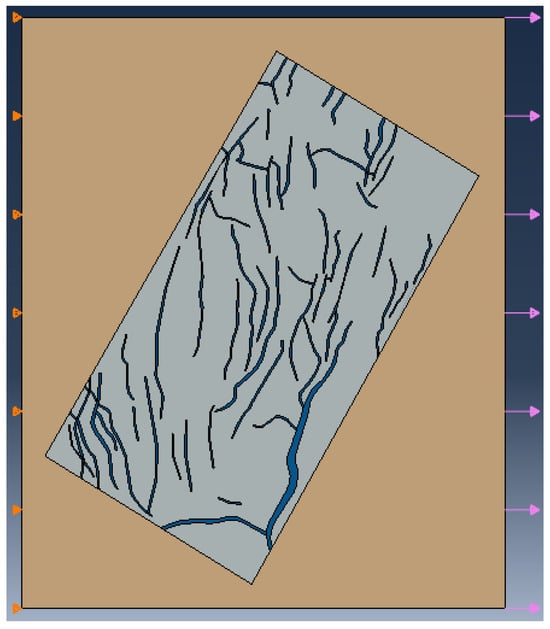
Figure 15.
Early-stage extensional boundary conditions.
4.2. Analysis of Finite Element Simulation Results
Simulation results indicate that during the Sha-2 Member extensional phase, the maximum principal stress was concentrated in the northwestern study area, particularly between wells Changshen-2, Changshen-4, and Changshen-17, and extended southeastward along the pre-Shenzijing major fault toward wells Changshen-41, Changshen-39, and Changshen-40, reaching peak values of 42.17 MPa. Intermediate stress levels averaging 24.49 MPa were distributed around wells Changshen-1, Changshen-104, and Changshen-105, while low-stress zones developed along the northern and southern margins. Local stress concentrations are evident at the tips of NS-trending faults south of well Changshen-2, as well as near fault intersections and flexures such as the Haerjin Fault (Figure 16). The overall NE-trending distribution of the maximum principal stress is partially segmented by EW-trending structural trends. From south to north, stress magnitudes alternate in a low-high-low-high-low-high sequence, revealing pronounced spatial heterogeneity. These patterns demonstrate that high-stress zones align closely with fault orientations, yet fracture development depends not only on stress concentration but also on sand-body thickness. Accurate fracture prediction, therefore, requires integrating stress field simulations with stratigraphic architecture analysis. Simulation results indicate that during the Sha-2 Member extensional phase, the maximum principal stress was concentrated in the northwestern study area, particularly between wells Changshen-2, Changshen-4, and Changshen-17. The stress extended southeastward along the pre-Shenzijing major fault toward wells Changshen-41, Changshen-39, and Changshen-40, reaching peak values of 42.17 MPa. Intermediate stress levels, averaging 24.49 MPa, were distributed around wells Changshen-1, Changshen-104, and Changshen-105. Low-stress zones developed along the northern and southern margins. Local stress concentrations are evident at the tips of NS-trending faults south of well Changshen-2. They are also observed near fault intersections and flexures, such as the Haerjin Fault (Figure 16). The overall NE-trending distribution of the maximum principal stress is partially segmented by EW-trending structural trends. From south to north, stress magnitudes alternate in a low-high-low-high-low-high sequence, revealing pronounced spatial heterogeneity. These patterns demonstrate that high-stress zones align closely with fault orientations. Fracture development, however, depends not only on stress concentration but also on sand-body thickness. Accurate fracture prediction, therefore, requires integrating stress field simulations with stratigraphic architecture analysis.
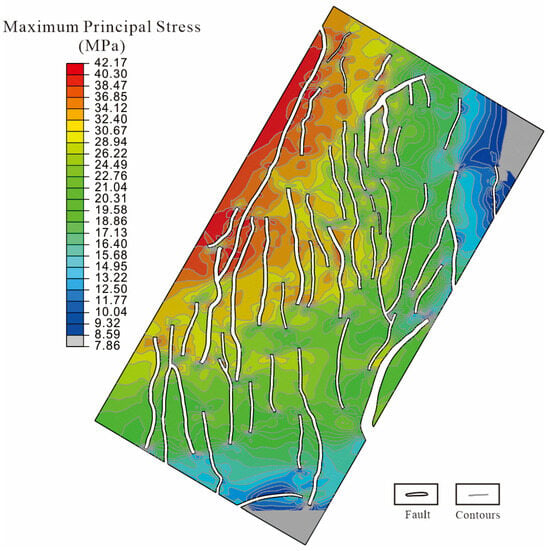
Figure 16.
Maximum principal stress during the extensional phase of the Shahezi Formation.
4.3. Delineating Fracture Development Zones Based on Tectonic Stress Field Analysis
- (1)
- Determination of Rock Failure Threshold
Based on core samples from well Changshen-39, we performed an integrated mechanical analysis of the Shahezi Formation. This analysis combined triaxial rock testing with mechanical twinning and crystal dislocation studies. These experiments provided key rock strength parameters, including tensile and shear strength. Some data scatter was observed, attributable to sampling depth variations within correlative stratigraphic intervals and differences in experimental protocols (Table 5). The results reveal a systematic depth-dependent strengthening trend. Both tensile and shear strength increase with burial, reflecting progressively enhanced rock stiffness. We integrated experimental data with stratigraphic depth and prior constraints. Based on this, the tensile strength of the Shahezi Formation during fault-controlled extension was estimated to be approximately 34.12 MPa.
Table 5.
Rock failure strength of different lithostratigraphic intervals in the Shenzijing subsag.
- (2)
- Determination of Fracture Development Extent
The development of tensile fractures in the Sha-2 Member of the Shahezi Formation is strongly influenced by the pre-Shenzijing Fault, which exerts pronounced structural control. Numerical and structural analyses reveal an extensive tensile fracture zone with significantly elevated intensity, reaching a maximum tensile failure ratio of 1.438. Spatially, fracture intensity in the Sha-2 Member exhibits a clear distribution pattern. Vertically, the high-intensity tensile zone extends southward from the area north of well Changshen-2 through well Changshen-4. Laterally, fracture intensity increases notably west of well Changshen-40, reaching values of 1.2. Additional localized zones with tensile failure ratios exceeding 1.0 occur south of well Changshen-2 and southwest of well Changshen-104, forming narrow EW-trending fracture corridors (Figure 17). In contrast, the eastern margin of the study area along the Changshen-37, Changshen-105, and Changshen-1-1 well trajectories appears largely unaffected by pre-Shenzijing Fault activity. The southern sector also shows limited tensile fracturing, likely due to stress field perturbations induced by EW-trending secondary structures that locally inhibited fracture propagation.
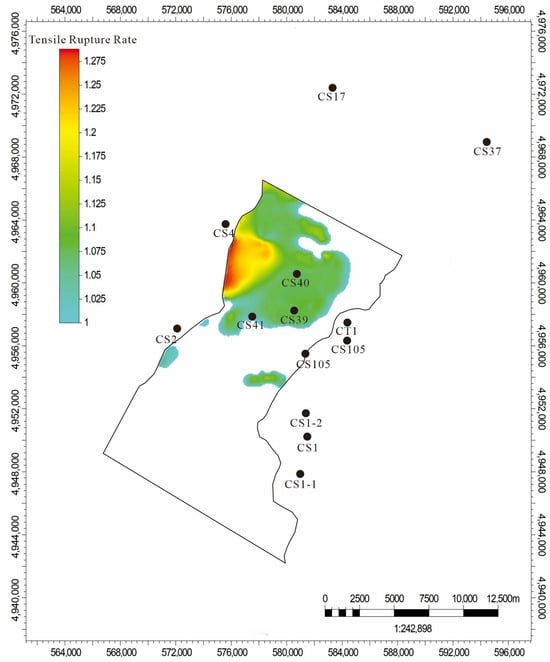
Figure 17.
Rift-related extensional phase of the Shahezi Formation.
4.4. Development of a Discrete Fracture Network Model Within Stress Field-Delineated Fracture Zones
4.4.1. Fracture Attribute Analysis
In three-dimensional rock masses, natural fractures form irregular polygonal networks with finite apertures [49]. Integrating outcrop analogs with borehole image logs offers the most realistic representation of their 3D spatial architecture [50]. To balance computational efficiency and reliability, fracture orientations were represented as pole vectors, which are the normals to fracture planes. This approach streamlined numerical workflows during statistical processing. Each fracture in the model is defined by its spatial centroid (x, y, z) and assigned geometric and directional attributes, including orientation and size. Natural fracture systems influenced by multi-phase tectonic evolution and anisotropic stress typically exhibit multimodal distributions, reflecting the overprinting of successive structural regimes over geologic time.
Previous analyses show that fractures in the study area are predominantly oriented NEE-trending to NNE-trending, with dips of 45–85° and a dominant peak between 65° and 75°. Although cores and borehole image logs reliably capture fracture orientation, they seldom constrain fracture size directly [51]. To address this, Clark [52] applied fractal theory to estimate fracture geometry from sparse data. Using log-log regression, the minimum fracture size () and fractal dimension () were determined, quantifying the spatial correlation and hierarchical scaling of coeval tectonic fractures. Guided by the observed power-law scaling of fracture sizes, we established the following fracture size model in Equation (8):
The Baecher [53] model, one of the earliest fully formulated discrete fracture network (DFN) models, assumes that fracture centers follow a Poisson distribution in space. Each fracture is represented as a circular disk defined by its radius and orientation. This was later refined by the Dershowitz [43] polygonal model, which introduced fracture termination rules to more realistically capture intersection and truncation behavior. In this study, we adopted an enhanced Baecher model as the conceptual basis for DFN generation in the Shahezi Formation. We incorporated statistically derived fracture orientation and size parameters to construct a stochastic DFN. This model simulates the 3D spatial distribution, geometric connectivity, and mechanical interactions within the fracture network.
4.4.2. Stochastic Modeling of 3D Fracture Spatial Distribution
Fracture development zones identified from tectonic stress field analyses were integrated with borehole image log data. A stochastic simulation of fractures within the Shahezi Formation of the Shenzijing subsag based on random modeling theory. The simulation results indicate that during the fault-controlled extensional phase, tensile fractures formed in the Shahezi Formation. Their formation was predominantly governed by the activity of the pre-Shenzijing basement fault. Fracture propagation and intensity were strongly constrained by this major fault system. The simulated fractures exhibited a dominant NNE-trending orientation, consistent with regional structural patterns. The orientation distribution of the simulated fracture network further confirms this directional control (Figure 18).
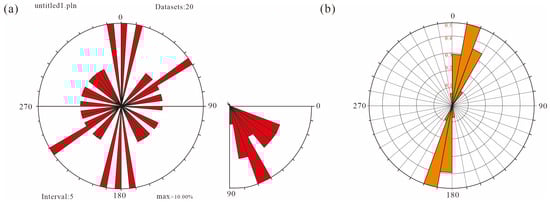
Figure 18.
(a) Fracture development azimuth map of well Changshen-39. (b) Fracture orientation map from numerical simulation of the syn-stretching period in a rift basin.
The simulated fracture network is mechanically consistent with an extensional regime. It exhibits a dominant NNE-trending orientation, with angular deviations of 0–30° and a modal peak between 12° and 18°. This trend aligns closely with the adjacent pre-Shenzijing major fault to the west, confirming its structural control over fracture propagation. Quantitative validation against field and borehole data shows 92% directional consistency between simulated and observed fractures. This strongly supports both the stochastic modeling approach and the underlying mechanical interpretation of fracture development.
Tensile fractures within the Shahezi Formation exhibit widespread spatial development. Their density is markedly higher along the western flank of the study area, where they form well-defined and continuous zones. These fracture systems extend consistently both southward and northward, reflecting a regionally coherent deformation response. Localized tensile fracturing also occurs south of well Changshen-2 and southwest of well Changshen-104, though these manifestations remain spatially restricted. In contrast, much of the study area shows minimal fracture development. This is particularly true along the eastern margin near the Changshen-37, Changshen-105, and Changshen-1-1 alignment. This indicates negligible influence from the Qianshenzijing Fault activity. Tensile fracturing in the Shahezi Formation is largely governed by localized stress concentration along the western structural margin. The eastern domain remains structurally quiescent, highlighting pronounced heterogeneity in fracture intensity and propagation across the basin (Figure 19).
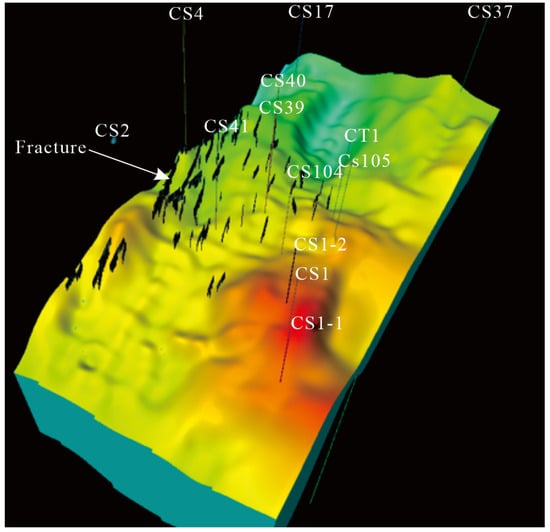
Figure 19.
Three-dimensional spatial distribution characteristics of fractures in the Sha-2 Member of the Shahezi Formation.
5. Contribution of Fractures to Formation Permeability
The primary contribution of fractures to the reservoir lies in their enhancement of permeability, while their influence on porosity is negligible. Therefore, in assessing the impact of fracturing on reservoir quality, only the permeability effects of fractures are considered [29,54]. The Oda formulation in Equation (9) was employed to quantify the fracture-induced permeability, incorporating parameters such as natural gas density, viscosity, fracture aperture, and fracture dimensions. A three-dimensional stochastic simulation was conducted to model the geometric properties of individual fractures, constrained by fracture width data obtained from image logging. On this basis, the fracture permeability contribution for each stratigraphic interval was systematically calculated and analyzed. The results allowed for the establishment of evaluation criteria for favorable zones and the delineation of high-quality reservoir regions controlled by fracture-enhanced permeability.
where denotes permeability, is the pressure gradient, the dynamic viscosity, and the fluid density. The fluid within fractures is assumed incompressible, and flow through these narrow apertures is governed by laminar dynamics, well captured by the N-S equations [55,56].
5.1. Analysis of Fracture Permeability Calculation Results
To simulate fracture-enhanced permeability using a finite-element approach, equivalent fracture properties were assigned to each grid cell. These properties include density, permeability, shape factor, and directional spacing [57,58]. Simulation results identify the Qianshenzijing Fault as the primary control on fracture distribution in the Sha-2 Member of the Shahezi Formation. This fault-driven fracturing generated high-permeability corridors of 50–70 mD along the Changshen-2, Changshen-4, and Changshen-17 alignment. These corridors influence a more extensive region than the related Yingcheng Formation. The spatial pattern of permeability enhancement reflects strong mechanical heterogeneity. Laterally, the most significant effects are localized in the fault-proximal west and the northern area near well Changshen-17. Southern propagation beyond well Changshen-104 remains limited, while central and eastern regions show markedly reduced fracture impacts. Despite peak extensional activity, the high mudstone content of the Sha-2 Member constrained fracture dimensions. This resulted in more modest permeability gains compared to the Yingcheng and Huoshiling Formations (Figure 20). This study systematically delineates a western fault-dominated fracture system that weakens toward the central trough. The system is virtually absent in the east, highlighting a pronounced structural control on reservoir quality.
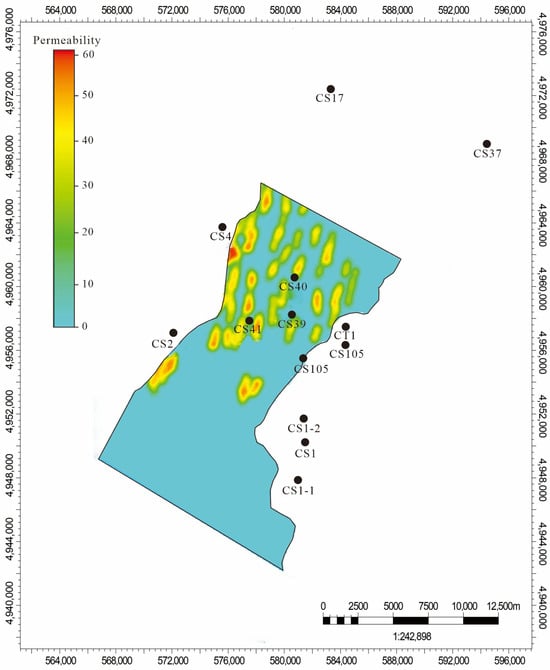
Figure 20.
Contribution of fractures to reservoir quality in the Sha-2 Member of the Shahezi Formation.
5.2. Criteria for Favorable Target Evaluation
5.2.1. Fracture Density Exceeding 0.1 Fractures per Meter
Within the mudstone-dominated succession of the Shahezi Formation, fracture development in sandstone intervals exerts fundamental control on natural gas accumulation (Table 6). These sandstones represent a near-source reservoir system. In this system, fractures act as essential conduits that significantly enhance both storage capacity and permeability in an otherwise tight lithology [59]. Accordingly, zones of elevated fracture intensity constitute the most prospective targets for gas accumulation. Statistical analysis of fracture density from wells Changshen-39, Changshen-40, and Changshen-41 was conducted. The analysis indicates that natural gas occurs exclusively in sandstone intervals where the fracture density exceeds 0.1 fractures/m. This finding establishes a clear threshold of 0.1 fractures/m. This threshold represents the minimum fracture density required for the development and preservation of productive sandstone gas reservoirs in the Shahezi Formation.
Table 6.
Fracture information for the perforated interval of well Changshen-39.
5.2.2. Sand-Body Thickness Exceeding 5.5 m
Statistical analysis of sandstone bodies in the sand groups II–V intervals of the Shahezi Formation was conducted. This analysis used data from wells Changshen-39, Changshen-40, and Changshen-41. It reveals that fracture density is critically controlled by sandstone thickness. We identify a distinct threshold at 5.5 m in individual sandstone thickness that governs fracture development. In sandstones thinner than 5.5 m, surrounding mudstones act as ductile barriers, accommodating strain through bedding-parallel slip. This process dissipates localized stress, inhibiting the accumulation of tensile stress required for fracture initiation within the sandstone. Consequently, these thin units remain largely fracture-free. Conversely, when sandstone thickness exceeds 5.5 m, its mechanical stiffness increases substantially. Under mudstone confinement, these thicker sand bodies effectively concentrate tectonic stresses, leading to brittle failure and systematic fracture formation (Figure 21). This 5.5 m threshold defines the favorable stratigraphic intervals for fracture development within the Sha-2 Member. These fracture-prone zones critically enhance reservoir permeability and provide a robust geological criterion for predicting producible intervals in tight sandstone gas reservoirs.
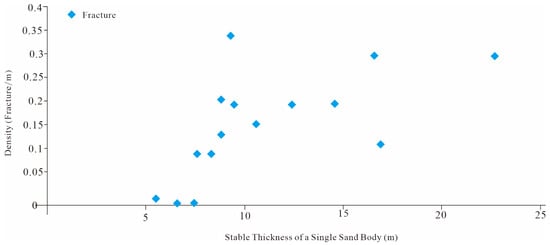
Figure 21.
The relationship between single sand body thickness and fracture development.
5.3. Delineation of Favorable Target Areas
We established critical thresholds: fracture density exceeding 0.1 fractures/m and individual sandstone thickness greater than 5.5 m. Based on these thresholds, we predicted and mapped sweet spots within the Shahezi Formation. In the Sha-2 Member, these zones are predominantly distributed in the central study area, forming an NS-trending belt concentrated between wells Changshen-4, Changshen-40, and Changshen-41. In contrast, the southern region remains relatively unfavorable, reflecting the overarching structural control exerted by the Qianshenzijing Fault system. The Shahezi Formation features extensive mudstone interbeds with relatively low rigidity, which generally suppresses fracture propagation under tectonic stress. Effective fracturing occurs only where individual sandstone layers exceed 5.5 m in thickness. Structurally, the Sha-2 Member exhibits a distinct mud-encased sandstone architecture, wherein tight sandstones are enveloped by thick, organic-rich source rocks. This configuration supports a self-sourcing, self-sealing reservoir model, forming autogenic tight fractured gas systems. In summary, the primary favorable zone lies within the slope belt between wells Changshen-40 and Changshen-4. It is slightly offset toward Changshen-40 and adjacent to the central sag. This zone covers approximately 11.9 km2, comprising 11 discontinuous, strip-like sandstone bodies, each thicker than 5.5 m (Figure 22). These results demonstrate that fracture-controlled sweet spots in the Shahezi Formation are influenced by lithologic rigidity. They are also affected by fault activity and localized stress concentration. Together, these factors provide a geologic framework for targeting tight gas reservoirs in the region.
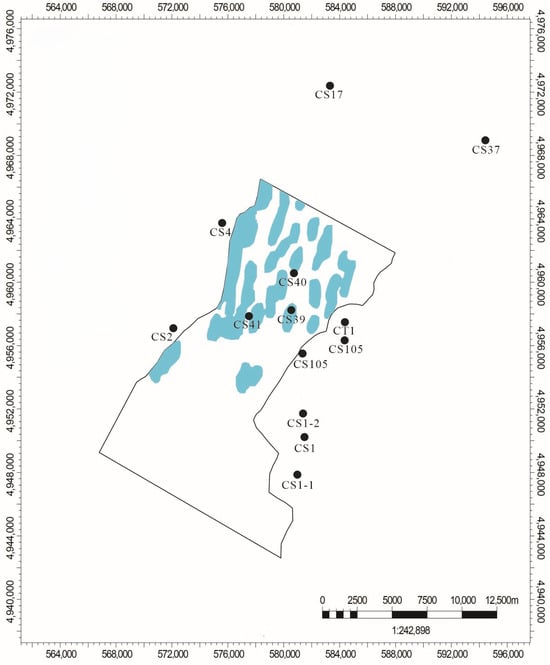
Figure 22.
The favorable zone of the Sha-2 Member of the Shahezi Formation.
5.4. Discussion and Application
Fracture modeling aims to characterize the geometry, spatial patterns, and distribution of fractures within a reservoir. Established approaches include equivalent continuum models, discrete fracture network (DFN) models, and hybrid frameworks. Equivalent continuum models are computationally efficient but offer only coarse representations, whereas DFN models provide high-resolution descriptions at the expense of increased uncertainty. Hybrid models integrate the strengths of both approaches and draw on multiple data sources. Consequently, they have emerged as the preferred framework for characterizing complex fracture systems (Figure 23).
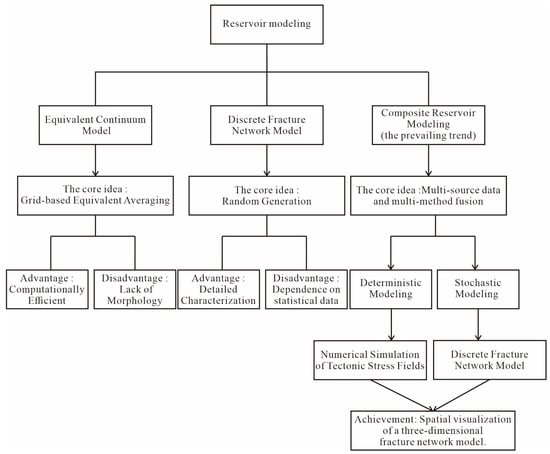
Figure 23.
The fundamental methods of fracture modeling.
- (1)
- Limitations and uncertainties of integrated reservoir modeling. Core observations and image logs provide complementary constraints on fracture orientation and depth-specific occurrence. Reliable estimates of fracture size, however, remain difficult to obtain. Data incompleteness severely restricts robust statistical characterization of fracture dimensions. Interwell scale fracture attributes, including density, orientation, length, and intersection relationships, exert a primary control on permeability anisotropy. These attributes also govern the development of preferential flow pathways. Paleo-tectonic stress field modeling imposes strong mechanical constraints on dominant fracture orientations and overall development intensity. However, the precise locations and lengths of individual fractures remain inherently stochastic [60,61,62]. As a result, the model produces multiple plausible high-permeability pathways rather than a single unique solution. Therefore, the high-permeability zones identified in this study should be interpreted as probabilistic envelopes. These envelopes delineate the spatial extent of favorable domains rather than representing deterministic predictions that eliminate uncertainty.
- (2)
- The implications of this study for practical reservoir development. This stratigraphic framework clarifies the reservoir-scale impact of fractures within the Shahezi Formation. Favorable fracture-modified zones in the second member are concentrated in the central area, forming an NS-trending belt. Alternatively, they define a broadly favorable corridor spanning the Changshen-39 to Changshen-1 area. From a field-development perspective, the fracture-controlled sweet spots provide a robust geological basis for optimizing well-pattern design. The predicted distribution of high-permeability pathways provides a robust basis for forecasting long-term production behavior. They also help in evaluating the risks and returns of alternative development scenarios. However, further integration is required to translate these insights into refined drilling strategies and optimized hydraulic-fracturing designs.
6. Conclusions
- (1)
- Building upon conventional core observations and well-log interpretations. This study introduces an innovative centroid dimension method for quantitative fracture characterization, using fracture line density as the key parameter. Our analysis identifies the Sha-2 Member as the dominant fracture interval, hosting both tectonic and bedding-slip fractures shaped by structural stress and lithological contrasts. The fracture system exhibits strong heterogeneity, controlled jointly by fault proximity, sand-mud ratio, and sandstone thickness.
- (2)
- Stress-field simulations bfased on tensile failure rate quantitatively map the distribution of extensional fractures in the Sha-2 Member. The model predicts intense fracturing in the western sector near well Changshen-40, structurally influenced by the Qianshenzijing Fault. Core and log data reveal a more nuanced picture: although tectonic stress is uniformly high, only the tuffaceous sandstone-rich sand group IV develops effective fractures. The more argillaceous sand groups II, III, and V remain poorly fractured. This contrast underscores lithology as the primary control on fracture effectiveness. By integrating one-dimensional well data with two-dimensional simulation outputs, we link different observational scales. The differences in lithology determine how stress responds in specific strata and control whether fractures can form effective flow pathways. They ultimately govern the precise locations of fracture development and the microscopic heterogeneity.
- (3)
- Using an improved Baecher model, we constructed a discrete fracture network (DFN) coupled with finite element flow simulation to derive permeability fields and evaluate reservoir fluid conductivity. Results show that high-permeability zones are confined to the central Qianshenzijing Fault belt, fading southward and disappearing eastward. The DFN model clarifies a critical discrepancy: although fault activity induces widespread fracturing, the high mudstone content of the Sha-2 Member restricts fracture aperture and connectivity. Consequently, high fracture density does not translate into high permeability. This emphasizes lithology as the decisive factor in fracture-based reservoir performance. In summary, fault systems create the structural potential for fracture development, but lithology ultimately determines reservoir effectiveness. This integrated methodology transcends the limitations of single-scale observations, delivering a system-level understanding of fracture network architecture. It thereby establishes a rigorous, quantitative framework. This framework is used to identify productive fracture corridors in fault-depression basins and to optimize the development of tight gas reservoirs in the Changling Fault Depression.
Author Contributions
Conceptualization, Y.Z. and Y.T.; methodology, Y.Z. and L.Q.; software, Y.Z. and Y.T.; validation, Y.T. and H.S.; formal analysis, Y.Z.; investigation, Y.Z. and L.Q.; resources, Y.T.; data curation, Y.Z.; writing—original draft preparation, Y.Z.; writing—review and editing, Y.T. and L.Q.; visualization, L.Q.; supervision, H.S.; project administration, H.S.; funding acquisition, Y.T. All authors have read and agreed to the published version of the manuscript.
Funding
This study was supported by the National 13th Five-Year Plan Major Project (No. 2017ZX05008-001; No. 2017ZX05008-005); Hubei Provincial Department of Education Scientific Research Program Project (No. T201905).
Institutional Review Board Statement
Not applicable.
Informed Consent Statement
Not applicable.
Data Availability Statement
The original contributions presented in the study are included in the article. Further inquiries can be directed to the corresponding author.
Conflicts of Interest
The authors declare no conflicts of interest.
References
- Shen, H.; Hu, J.; Yang, G.; Yang, L.; Shao, M.L.; Yang, K.S.; Wang, Y.H. Accumulation characteristics and exploration potential of tight oil and gas in southern Songliao Basin. Acta Pet. Sin. 2025, 46, 61–76. [Google Scholar] [CrossRef]
- Ding, W.L.; Wang, X.H.; Hu, Q.J.; Yin, S.; Cao, X.Y.; Liu, J.J. Progress in tight sandstone reservoir fractures research. Adv. Earth Sci. 2015, 30, 737–750. [Google Scholar] [CrossRef]
- Yu, S.Q.; Li, L.; Shi, G.Y.; Cao, Z.; He, X.Y. Fracture development and evolution characteristics of low permeability sandstone reservoirs. Chin. J. Geol. 2021, 56, 109–120. [Google Scholar]
- Nelson, R.A. Geologic Analysis of Naturally Fractured Reservoirs; Gulf Professional Publishing: Houston, TX, USA, 1985. [Google Scholar]
- Laubach, S.E.; Olson, J.E.; Gross, M.R. Mechanical and fracture stratigraphy. AAPG Bull. 2009, 93, 1413–1426. [Google Scholar] [CrossRef]
- Ellis, M.A.; Laubach, S.E.; Eichhubl, P.; Olson, J.E.; Hargrove, P.; Fall, A. Fracture development and diagenesis of Torridon Group Applecross Formation, near An Teallach, NW Scotland: Millennia of brittle deformation resilience? J. Geol. Soc. 2012, 169, 297–310. [Google Scholar] [CrossRef]
- Geng, B.; Zhou, D.Z.; Wang, M.; Wang, Y.G.; Wang, S.J.; Meng, L.; Zhang, Y.Y. Development and prospects of logging evaluation technologies for reservoirs in Shengli Oilfield. Pet. Geol. Recovery Effic. 2024, 31, 184–195. [Google Scholar] [CrossRef]
- Yin, S.; Zhang, Z.Y.; Wang, R.Y.; Liu, H.L.; Xu, Z.Q.; Wang, M.J.; Liu, Y.; Liu, J.S.; Xu, K.; Ju, W.; et al. Advances, challenges and prospects of reservoir geomechanics for deep/ultra-deep oil and gas exploration in China. Nat. Gas Ind. 2025, 45, 33–47. Available online: http://kns.cnki.net/kcms/detail/51.1179.TE.20250320.1657.002.html (accessed on 31 March 2025).
- Dai, J.; Wang, B. Integrated methods for identification and prediction of reservoir fractures. Pet. Geol. Recovery Effic. 2003, 10, 1–2+8–5. [Google Scholar]
- Zhou, X.G.; Deng, H.W.; Cao, C.J.; Yuan, J.Y.; Mao, X.C.; Xiao, Y.R. Quantitative prediction and evaluation methods of reservoir structural fractures. Acta Geosci. Sin. 2003, 24, 175–180. [Google Scholar]
- Pu, J.; Qin, Q. A summary of fracture prediction methods for oil and gas reservoirs. Spec. Oil Gas Reserv. 2008, 15, 9–13+106. [Google Scholar]
- Yang, H.J.; Li, Y.; Tang, Y.G.; Lei, G.L.; Zhou, P.; Zhou, L.; Xu, A.M.; Huan, Z.P.; Zhu, W.H.; Chen, W.L.; et al. Accumulation conditions and key exploration and development technologies for Keshen gas field in Tarim Basin. Acta Pet. Sin. 2021, 42, 399–414. [Google Scholar] [CrossRef]
- Li, X.; Qin, R. Method of fracture characterization and productivity prediction of 19-6 buried-hill fractured reservoirs, Bohai Bay Basin. Earth Sci. 2023, 48, 475–487. [Google Scholar]
- Dong, H.; Yang, J.G.; Wu, G.Q.; Ma, K.; Li, X. Digital core technology-based microstructure characteristics and main controlling factors of continental shale oil: A case study of shale in Cretaceous Qingshankou Formation in Songliao Basin. Geol. Resour. 2021, 30, 377–384. [Google Scholar] [CrossRef]
- Sun, Z.L.; Li, Z.M.; Shen, B.J.; Zhu, Q.M.; Li, C.X. NMR technology in reservoir evaluation for shale oil and gas. Pet. Geol. Exp. 2022, 44, 930–940. [Google Scholar] [CrossRef]
- Shao, G.Y.; Xiong, W.; Shen, R.; Yang, Y.; Shang, Z.H.; Wang, G.D.; Yu, H. Application progress of CT scanning technology in characterization of shale oil and gas reservoir microstructure. Appl. Chem. Ind. 2023, 52, 1785–1789+1799. [Google Scholar] [CrossRef]
- Huang, J.X.; Peng, S.M.; Wang, X.J.; Xiao, K. Application of imaging logging data in the study of fractures and in-situ stress. Acta Pet. Sin. 2006, 27, 65–69. [Google Scholar]
- Qian, S.; Yang, Z.; Xu, C. Logging evaluation methods of low-organic matter fault-block shale oil in the Subei Basin and their application. Pet. Reserv. Eval. Dev. 2025, 15, 19–27+39. [Google Scholar] [CrossRef]
- Fiallos, M.; Morales, A.; Yu, W.; Miao, J.J. Characterization of complex hydraulic fractures in Eagle Ford shale oil development through embedded discrete fracture modeling. Pet. Explor. Dev. 2021, 48, 613–619. [Google Scholar] [CrossRef]
- Deng, P.; Wei, G.; Yang, Y. Establishment and application of geological mathematical models in quantitative prediction of reservoir tectonic fractures. Nat. Gas Geosci. 2006, 17, 480–484. [Google Scholar]
- Wei, Y.S.; Wang, J.L.; Yu, W.; Qi, Y.D.; Miao, J.J.; Yuan, H.; Liu, C.X. A smart productivity evaluation method for shale gas wells based on 3D fractal fracture network model. Pet. Explor. Dev. 2021, 48, 787–796. [Google Scholar] [CrossRef]
- Tang, Y.; Xiao, A.; Tang, W.; Ke, W.; Zeng, F. Stochastic fracture simulation based on three-dimensional laser scan technology: A case study of Kuqa River outcrop in Kuqa Depression. Earth Sci. 2023, 48, 640–656. [Google Scholar]
- Zhang, Z.; Meng, P.; Yang, W.; Zhang, X.L.; Huang, Q.; Wang, H.R. Characterization of braided river reservoir architecture based on seismic attribute stacking ensemble learning: A case study of the C-2 Oilfield in the Bohai Bay Basin. Pet. Reserv. Eval. Dev. 2025, 15, 64–72. [Google Scholar] [CrossRef]
- Sun, X. Post-stack fracture prediction technology for shale gas reservoirs based on well-seismic integration in Nanchuan area. Pet. Reserv. Eval. Dev. 2022, 12, 462–467. [Google Scholar]
- Wu, L.; Zhu, M.; Feng, X.Q.; Ji, D.S.; Zhou, L.; Liu, S.X.; Zhang, L.Y.; Tan, Y.L.; Qian, Z.L.; Yang, Z. Interpretation of tectonic stress field and structural deformation in Sikeshu Sag, Junggar Basin. Acta Pet. Sin. 2022, 43, 494–506. [Google Scholar] [CrossRef]
- Zeng, L.B.; Lyu, P.; Qu, X.F. Multi-scale fractures in tight sandstone reservoirs with low permeability and geological conditions of their development. Oil Gas Geol. 2020, 41, 449–454. [Google Scholar]
- Liu, P.B.; Pu, R.H.; Liu, J.X. Study on sedimentary microfacies and reservoir identification from the Huoshiling Formation to the Yingcheng Formation in Shiwu Fault Depression. Oil Geophys. Prospect. 2009, 44, 347–353. [Google Scholar]
- Yan, Y.M.; Liu, S.F.; Pan, F.; Wu, J.; Qi, P.W. Study on basement faults in Shiwu Fault Depression, southern Songliao Basin based on high-precision gravity and magnetic data. Geoscience 2011, 25, 122–128. [Google Scholar]
- Dong, S.Q.; Zeng, L.B.; Cao, H.; Xu, C.S.; Wang, S.J. A discrete fracture network modeling method constrained by fracture density and its application. Geol. Rev. 2018, 64, 1302–1314. [Google Scholar]
- Wang, K.; Zhang, R.; Li, B.; Wang, J.; Song, B.; Zeng, Q.; Zhang, Z.; Huang, Q. Characteristics and geological modeling of structural fractures in tight sandstone reservoir: Taking Dabei-12 gas reservoir in Kuqa Depression, Tarim Basin as an example. Mar. Orig. Pet. Geol. 2023, 28, 72–82. [Google Scholar]
- Shu, L.; Mu, Y.; Wang, B. Petroleum-bearing strata and structural characteristics of the Songliao Basin. J. Stratigr. 2003, 27, 340–347. [Google Scholar]
- Gao, R.; Cai, X. Formation Conditions and Distribution Patterns of Oil and Gas Fields in the Songliao Basin; Petroleum Industry Press: Beijing, China, 1997. [Google Scholar]
- Zhang, W.; Li, H.; Li, M. Deep structural characteristics and natural gas accumulation in the Changling Fault Depression of southern Songliao Basin. Geoscience 2008, 22, 592–598. [Google Scholar]
- Qiu, L.; Yan, D.P.; Xu, H.; Shi, H.; Dong, W.; Sun, S. Late Cretaceous mud volcanism in the southwestern Songliao basin records slab rollback of the subducted paleo-Pacific Plate underneath NE China. J. Asian Earth Sci. X 2020, 3, 100028. [Google Scholar] [CrossRef]
- Fang, L.M.; Li, Y.X.; Yin, J.Y.; Chen, J.L. Characteristics and formation mechanism of inversion structures at the end of rift stage in Songliao Basin. Oil Geophys. Prospect. 2003, 38, 190–193. [Google Scholar]
- Yu, W.; Dong, Q.; Zhou, L.; Zhang, Y.; Li, G.; Zhui, J. Action of reversal fault structure on sandstone-type uranium mineralization in the south of Songliao Basin. Uranium Geol. 2008, 24, 195–200. [Google Scholar]
- Cai, Q.S.; Hu, M.Y.; Ngia, N.R.; Hu, Z.G. Sequence stratigraphy, sedimentary systems and implications for hydrocarbon exploration in the northern Xujiaweizi Fault Depression, Songliao Basin, NE China. J. Pet. Sci. Eng. 2017, 152, 471–494. [Google Scholar] [CrossRef]
- Lai, J.; Xiao, L.; Zhao, X.; Zhao, F.; Li, Y.H.; Zhu, S.F.; Wang, G.W.; Liu, H.K. Genesis and logging evaluation methods of deep-ultradeep high-quality clastic reservoirs: A case study of Cretaceous Bashijiqike Formation in Kuqa Depression. Acta Pet. Sin. 2023, 44, 612–625. [Google Scholar]
- Chen, J.; Zhang, Q.L.; Wang, L.S.; Xie, G.A.; Xu, S.Y.; Bi, S.P.; Ge, R.F. Tectonic Transformation of Changling Fault Depression in the Southern Songliao Basin and Its Significance of Hydrocarbon Accumulation. Acta Geol. Sin. 2008, 82, 1027–1035. [Google Scholar]
- Xu, H.D.; Wang, S.F.; Chen, K.Y. Fundamentals of Seismic Stratigraphy Interpretation; China University of Geosciences Press: Wuhan, China, 1990. [Google Scholar]
- Yu, K.; Hou, H.B.; Guo, N.F.; He, X.H. Petroleum and Natural Gas Geology in the Faulted Sequence of the Southern Songliao Basin; Petroleum Industry Press: Beijing, China, 2002. [Google Scholar]
- Florez-Nino, J.M.; Aydin, A.; Mavko, G.; Antonellini, M.; Ayaviri, A. Fault and fracture systems in a fold and thrust belt: An example from Bolivia. AAPG Bull. 2005, 89, 471–493. [Google Scholar] [CrossRef]
- Dershowitz, W.S.; Einstein, H.H. Characterizing rock joint geometry with joint system models. Rock Mech. Rock Eng. 1988, 21, 21–51. [Google Scholar] [CrossRef]
- Gudmundsson, A. Rock Fractures in Geological Processes; Cambridge University Press: Cambridge, UK, 2011. [Google Scholar]
- Xi, X.; Feng, Z.M.; Yang, S.T.; Ning, Z.G.; Pan, J.L.; Zhang, L.M.; Yin, Z.Q.; Cai, M.F. Nanoindentation-based random field model for fracture of heterogeneous rock. Rock Mech. Rock Eng. 2025, 58, 5185–5205. [Google Scholar] [CrossRef]
- Santos, R.; Miranda, T.; Barbosa, J.; Gomes, I.; Matos, G.; Gale, J.; Neumann, V.; Guimarães, L. Characterization of natural fracture systems: Analysis of uncertainty effects in linear scanline results. AAPG Bull. 2015, 99, 2203–2219. [Google Scholar] [CrossRef]
- Wu, M.; Yang, F.L. Application of tectonic stress field forward and inverse modeling in volcanic fracture reservoir prediction. In Proceedings of the 26th Annual Meeting of the Chinese Geophysical Society and 13th Academic Conference of the Seismological Society of China, Ningbo, China, 16–19 October 2010; Tongji University Press: Shanghai, China, 2010; p. 634. [Google Scholar]
- Ladanyi, B.; Archambault, G. Simulation of shear behavior of a jointed rock mass. In Proceedings of the 11th U.S. Symposium on Rock Mechanics (USRMS), Berkeley, CA, USA, 16–19 June 1969. [Google Scholar]
- Zhang, Y. Numerical simulation study of discrete fracture network models for fractured reservoirs. J. Pet. Sci. Eng. 2008, 61, 123–134. [Google Scholar]
- Fernández-Ibáñez, F.; DeGraff, J.M.; Ibrayev, F. Integrating borehole image logs with core: A method to enhance subsurface fracture characterization. AAPG Bull. 2018, 102, 1067–1090. [Google Scholar] [CrossRef]
- Jiang, X.Y.; Song, T.; Gan, L.D.; Du, W.H.; Li, X.B.; Xu, L. Multi-scale modeling and application of fractured granite buried-hill reservoirs. Oil Geophys. Prospect. 2023, 58, 403–411. [Google Scholar] [CrossRef]
- Clark, R.M.; Cox, S.J.D.; Laslett, G.M. Generalizations of power-law distributions applicable to sampled fault-trace lengths: Model choice, parameter estimation and caveats. Geophys. J. Int. 1999, 136, 357–372. [Google Scholar] [CrossRef]
- Baecher, G.B.; Lanney, N.A.; Einstein, H.H. Statistical description of rock properties and sampling. In Proceedings of the 18th U.S. Symposium on Rock Mechanics, Golden, CO, USA, 22–24 June 1977; Colorado School of Mines: Golden, CO, USA, 1977; pp. 1–8. [Google Scholar]
- Lang, X.; Guo, Z. A modeling method for fractured reservoirs based on Discrete Fracture Network (DFN) model. Acta Sci. Nat. Univ. Pekin. 2013, 49, 964–972. [Google Scholar]
- Liu, J.J.; Dai, L.Q.; Li, S.T. Numerical simulation of microcosmic flow in porous media. J. Liaoning Tech. Univ. Nat. Sci. 2005, 24, 680–682. [Google Scholar]
- Ye, L.Y.; Liu, J.J.; Xue, Q.; He, X.; Pei, G.H. Numerical simulation of microcosmic flow in fracture-cavity carbonate reservoir based on Navier-Stokes equations. J. China Univ. Geosci. 2007, 18, 510–512. [Google Scholar]
- Zeng, Q.Q.; Zhang, L.; Liu, P.; Wang, Z.; Wang, L.; Zhao, L.Y.; Li, Z.P. Study on dynamic fractures in water injection wells of tight oil reservoirs based on inter-well connectivity. Fault-Block Oil Gas Field 2022, 29, 383–389. [Google Scholar]
- Yong, L.; Cheng, B.J.; Xu, T.J. Research and application of high-resolution reservoir fracture prediction and connectivity evaluation method. Geophys. Prospect. Pet. 2024, 63, 846–857. [Google Scholar]
- Aydin, A. Failure modes of shales and their implications for natural and man-made fracture assemblages. AAPG Bull. 2014, 98, 2391–2409. [Google Scholar] [CrossRef]
- Guerriero, V.; Iannace, A.; Mazzoli, S.; Parente, M.; Vitale, S.; Giorgioni, M. Quantifying uncertainties in multi-scale studies of fractured reservoir analogues: Implemented statistical analysis of scan line data from carbonate rocks. J. Struct. Geol. 2010, 32, 1271–1278. [Google Scholar] [CrossRef]
- Pradhan, A.; Mukerji, T. Seismic Bayesian evidential learning: Estimation and uncertainty quantification of sub-resolution reservoir properties. Comput. Geosci. 2019, 24, 1121–1140. [Google Scholar] [CrossRef]
- Sun, W.; Durlofsky, L.J. A new data-space inversion procedure for efficient uncertainty quantification in subsurface flow problems. Math. Geosci. 2017, 49, 679–715. [Google Scholar] [CrossRef]
Disclaimer/Publisher’s Note: The statements, opinions and data contained in all publications are solely those of the individual author(s) and contributor(s) and not of MDPI and/or the editor(s). MDPI and/or the editor(s) disclaim responsibility for any injury to people or property resulting from any ideas, methods, instructions or products referred to in the content. |
© 2025 by the authors. Licensee MDPI, Basel, Switzerland. This article is an open access article distributed under the terms and conditions of the Creative Commons Attribution (CC BY) license.