Featured Application
This study offers insights for urban planners and policymakers to improve electric scooter safety and adoption by addressing infrastructure gaps and user concerns. Findings support the design of safer micro-mobility environments and targeted policies to promote sustainable transportation.
Abstract
Micro-mobility, which includes small, lightweight vehicles such as bicycles, electric scooters, and electric bikes, has emerged as a key component of modern urban transportation over the last decade. ESs have transformed how people navigate cities by offering an eco-friendly alternative to traditional transport, improving last-mile connectivity, and reducing traffic congestion. However, they also present challenges related to safety, infrastructure, and regulation. The rising crash rates involving electric scooters pose a significant public safety concern, driven by their novelty and limited research on associated risks. This study investigates factors influencing the adoption and use of electric scooter-sharing services, emphasizing risk perception, cultural norms, technological familiarity, and physical infrastructure. It also examines travel behaviors, common risks, and barriers to adoption. Using data from 254 Israeli participants, including 50 electric scooter users, the research highlights that 48% of users experienced near-miss incidents, and 38% used scooters on vehicular roads. The primary risk was identified as dangerous driver behavior on these roads, while the key barrier to adoption was a high perception of risk or low sense of safety. A structural equation model revealed that risk perception is influenced by gender-related attitudes and subjective norms, which indirectly diminish positive attitudes toward electric scooters and willingness to share and use them. The findings emphasize the importance of a safe physical infrastructure in fostering positive attitudes and promoting electric scooter use. This research provides valuable insights into mitigating risks and improving the adoption of electric scooters as a sustainable micro-mobility option.
1. Introduction
Promoting sustainable transportation and shifting from private passenger vehicles to other active transport modes are important environmental, economic, and public health goals [1,2]. Following the need for sustainable transportation, the number of micro-mobility modes, mainly electric bicycles, and scooters, has been increasing rapidly, especially among the many people using them in cities [3,4]. In Israel, a sharp increase in electric bike and scooter use was identified [5,6,7].
The data from the Israel Central Bureau of Statistics [7] indicate a steady increase in the number of accidents involving ESs in Israel over the past several years. In 2018, there were 237 reported accidents, with the number rising to 1157 in 2023. Specifically, the figures are as follows: 598 accidents in 2019, 694 in 2020, 953 in 2021, and 1103 in 2022. This trend underscores the growing prevalence of ES usage and highlights the need for enhanced safety measures and infrastructure to address the associated risks. In 2023, 55 of the accidents were in Ashdod, being the third city in Israel in ES-related accidents (followed by Tel Aviv-Yafo and Holon). Siman-Tov et al. [8] showed that between 2013 and 2015, 795 hospitalized cases from e-bike and motorized scooter accidents were reported in Israel, with a six-fold increase over this period. Most injuries involved riders, but 8% were pedestrians, with 33% of all casualties being children (0–14 years) and 42% of pedestrian casualties being children or seniors above 60.
ESs are motorized vehicles but are often classified under micro-mobility, blending both motorized and active transport modes. While they require minimal physical effort, ESs contribute to sustainable urban transport by reducing reliance on cars and are commonly integrated into active transportation systems. Promoting the use of active modes is essential for promoting sustainable transportation. However, the associated risks need to be examined. Understanding risk factors while using active modes can decrease risk perceptions and make active modes more attractive. This research examines factors affecting the adoption and use of electric scooter sharing (ES-sharing) services, especially risk perception, norms, culture, familiarity with new technology, and built environment. This study also attempts to study ES drivers’ travel behavior, common ES risks, and barriers to its prevalence. The study findings can increase awareness of this relatively new mode of transportation and help decision makers suggest appropriate policies that overcome these barriers.
Micro-mobility and ESs, in general, have several advantages, including decreasing traffic congestion, being eco-friendly, a relatively inexpensive form of transportation, being lightweight, occupying little space for parking, compatibility, being considered a fun mode of driving, and overcoming the limitations of the first/last-mile problem. However, numerous challenges, especially safety challenges, restrict the prevalence of ES users because ESs cause many crashes for users and non-users, which have exponentially increased since their introduction [7,9]. A substantial percentage of accidents are attributed to unsafe behaviors. These include not wearing safety gear, not driving on the designated lanes, traffic rule violations, blocking walkways and sidewalks, excessive speeds, carrying a passenger, underage riding, alcohol use, drug use, and smartphone use.
Illegal behavior is common among ES users. For example, Siebert et al. [10] showed a high number of users reporting illegal behavior. In addition to not knowing the laws, users admit to acting illegally. Haworth et al. [11] studied risky behaviors of ES and bicycle users in downtown Brisbane, Australia, where helmet wearing is mandatory, and an ES must be ridden on the footpath. Illegal driving was 49.6% and 12.2% for shared and private ESs, respectively. Also, 40% rode within one meter of at least one pedestrian, which indicates the potential for collision. Sometimes users engage in illegal behavior simply because they are unaware of the roles. For example, according to Allem and Majmundar [12] and Trivedi et al. [13], there is inadequate safety education from private companies. Carrese et al. (2021) [14] address the issue of wild parking in ES-sharing systems, a topic not sufficiently covered in the literature. Their study connects this problem to bad user habits, risk, and safety concerns, proposing a mathematical optimization approach to improve the management of ES fleet repositioning and urban decorum.
ES users also cause injuries and inconvenience to non-users [13,15,16,17,18]. For example, Trivedi et al. [13] showed that 8.4% of ES-involved injuries were to pedestrians. Blomberg et al. [16] recorded 468 scooter-related injuries. They showed that 13.8% of ES injuries involved non-users, compared with the findings that only 4.4% of manual scooter injuries involved non-users.
Several studies aimed to examine the effects of personal characteristics on safety behaviors. For example, Gioldasis et al. [19] showed that male and young drivers are more likely to develop risky behaviors such as alcohol use, drug use, and using smartphones while driving. Farley et al. [20] studied ES-related injuries in the US between 2014 and 2019. They found a sharp increase in emergency department visits, especially for individuals aged 15 to 39. Yang et al. [21] examined reported crashes and showed that children and seniors are more prone to be severely injured. Falling-off crashes are more common among female users, but fatal crashes are less common. Younes et al. [22] also showed that males are more likely to use roads than females, who are more likely to use bike lanes or sidewalks. Males between 20 and 40 are the most injured users [23]. Sanders et al. [24] showed a significant difference in the perceived risk between males and females. They showed that females were more likely to cite safety barriers, and male ES users travel faster than females [25]. The study by Rupi et al. (2023) [26] shows that gender differences affect how female and male cyclists perceive the ease of use of pathways and make related choices. However, these differences become less significant with age, suggesting that more experienced female cyclists make choices similar to male cyclists. Laa and Leth (2020) [27] found that ES users in Vienna tend to be young, male, and highly educated, with significant differences between private scooter owners and sharing scheme users. Both groups primarily replace walking and public transport with ES trips, while private owners also shift from using private cars. This increases pressure on limited cycling infrastructure, highlighting the need for city policies to allocate more space for safe cycling and traffic-calmed zones, promoting a more sustainable and equitable urban transport system. A study conducted by Azimian and Jiao [28] in Austin, Texas finds that ES injury accidents are concentrated in central urban areas, where ES availability and parking constraints are higher. Key factors influencing accidents include the ratio of young males to females, household income, public vs. private transport use, and land use characteristics like restaurants and educational centers.
Crashes and near-crash incidents are attributed to behavioral, environmental, and infrastructure factors. For example, White et al. [29] showed that 67% of the safety critical events observed in their study were attributed to infrastructure factors, 19% to other road users’ factors, and 14% to user behavior factors. Loss of control related to infrastructure was the most common factor, constituting 47% of the total safety-critical events. Sexton et al. [30] showed that improving the safety perception of ES users can be achieved most effectively by enhancing infrastructure safety. Improving nighttime conspicuity can reduce severe injuries. Sidewalks are the most common location of ES-related injuries, constituting 58% of the injuries they studied, whereas road injuries constituted 23%. Sievert et al. [31] showed that bike lanes and sidewalks were indicated to provide the greatest feelings of safety by 62.4% and 24.5%, respectively, of the ES users they studied. In addition, bike lanes and sidewalks were indicated as the preferred place to ride by 49.6% and 22.7%, respectively. However, Kazemzadeh et al. [32] showed that the design of sidewalks and bike lanes did not consider the specific requirements of ESs as compared with pedestrians and cyclists.
Significant concern about moving vehicles and potholed or rough roadways was reported. Bloom et al. [33] showed that streets were the most common place of incidents. Thus, enhanced infrastructure is the most advantageous alternative for safe ES use, compared with safe operation regulations and safety training [34].
Regarding how scooter users perceived ES use, Kopplin et al. [35] showed that ESs are primarily viewed as a form of entertainment rather than a significant form of transportation. Regarding using a shared ES, fun and adventure were more motivational factors for using shared ESs than saving time or money or for environmental reasons. In addition, ES use is more appealing in hot weather than walking [24].
Regarding the willingness to use an ES-sharing service, researchers found that sharing services are attracting attention as a key transport mode to replace a large cohort of existing transportation modes [36]. Those who use ES-sharing services can pick up an ES at any place within a designated area and return it to the same or another place within the same area. Using a mobile communication platform, users can check the availability of ESs in real time and pay for the cost automatically through a registered card. However, despite these positive attitudes regarding using an ES-sharing service, researchers show substantial barriers exist. The willingness to use an ES is a major determinant of being attracted to using an ES service. In addition to the factors that affect the willingness to use an ES, many additional factors can prevent road users from using an ES-sharing service. Several previous studies investigated factors affecting people’s intentions to use ES-sharing services. These studies suggest that the service price, trip situation, and environmental factors influence the intention to use the services. In addition, their preferences are also associated with certain sociodemographic characteristics, individual values, and psychological factors [36].
Younes et al. [4] suggested that the time of day, weather, gasoline prices, and local festivals influence the use of ES services. Samadzad et al. [37] showed that the most important factors determining the willingness to use an ES-sharing service are their perceived usefulness, level of trust in the service, and subjective norms. Additionally, the acceptance of new technology and the ease of using these technologies affect the willingness to use an ES-sharing service [35].
Several studies aimed to study the causes of ES injuries and their nature. For example, English et al. [38] showed that the most common cause of ES-related injuries was falling from the scooter, accounting for half the injuries of their 124 adult patients. Bloom et al. [33] showed that loss of balance is one of the major causes. Not wearing a helmet is considered a serious problem that worsens the results of ES accidents and increases head and face injuries [23]. Several studies point out the insufficient use of safety gear among ES users, especially helmets [10,22,31,33,39,40]. For example, Puzio et al. [39] showed that none of the 92 patients they studied who were injured in accidents related to ESs had used protective gear. Tuckel and Pok-Carabalona [40] showed that 46% and 42% of E-bike and ES users wore helmets.
The literature review highlights the rapid growth of ES use, alongside a significant increase in accidents and injuries related to ES. While ESs provide benefits such as eco-friendly transport and reduced congestion, safety concerns remain a major challenge. Factors contributing to ES-related accidents include unsafe user behaviors, infrastructure issues, and inadequate safety gear usage. Additionally, the adoption of ES-sharing services is influenced by various factors, including perceived usefulness, trust in the service, and societal norms. Notably, gender biases and risk perceptions play a crucial role in shaping public attitudes toward ES use, especially regarding female users. The literature review shows that no studies examined the relationships among ES risk perception and other factors that affect ES prevalence. This gap is covered by this study.
To explore the complex interplay of factors influencing ES use and risk perception, this study develops a conceptual framework that examines the relationships among ES risk perception, support for ES use, support for shared ES services, subjective norms, and perceptions of others toward female drivers. These factors were chosen for the following reasons: subjective norms, reflecting societal expectations, shape attitudes toward ES use and shared services while also influencing gender-specific perceptions regarding female drivers. These gendered perceptions, in turn, affect both risk perception and support for shared ES services. Risk perception emerges as a pivotal factor, mediating the influence of societal norms and gendered attitudes on support for ES use and shared services. Positive perceptions of safety and reduced risk promote greater acceptance and advocacy for ES adoption and sharing. Structural equation modeling (SEM) was employed to analyze and validate these hypothesized relationships, providing a comprehensive approach to understanding the dynamics underlying attitudes and behaviors toward ES use. Exploring these relationships is essential to addressing barriers, informing policy, and designing strategies to improve safety and public acceptance of ES systems. This study addresses this gap by examining how these factors impact the adoption and acceptance of ES systems, focusing on safety concerns and gender biases to inform policies that promote sustainable ES use.
2. Methods
The data used for this analysis were collected in Ashdod, a city located in southern Israel. The survey was conducted online with WhatsApp and other social media platforms, using a snowball method to reach other participants. This study primarily employs SEM to analyze the relationships between the variables. Descriptive statistics were used to provide background information about the sample, while confirmatory factor analysis (CFA) was conducted to assess the suitability and validity of the latent variables before applying SEM. These methods were designed to explore different aspects of the data, offering insights at varying levels of analysis. Additionally, travel behavior of ES users, common ES risks, and barriers to ES use were also studied to provide valuable insights that complement the SEM analysis by offering a different perspective on the data.
2.1. Questionnaire
A questionnaire was devised to mine the relevant data for increasing the awareness of ESs and for the structural equation model (SEM). The questionnaire contained four parts. Part one (Risk perception) aimed to study the participants’ risk perceptions. Participants were asked about the main risks of ES use, and they were asked to evaluate how much they agreed with several statements regarding ES use safety. Part two (Perception toward female ES drivers) aimed to study the participants’ (both males and females) point of view towards female drivers. They were presented with several cases regarding the use of ESs by females and were asked to evaluate how much they agreed with these cases. Part three (Supporting the use of ESs and shared ES services) aimed to study how much participants supported the use of ESs and shared ES services. They were presented with several statements that indicated support for ESs and the use of shared ESs and they were asked to evaluate how much they agreed with those statements. Part four (ES users’ travel behavior) aimed to study the driving behavior of the participants who use ESs. Participants were asked about the purpose of using an ES, how often they were involved in near-miss accidents, where they usually use an ES, how often they wear a helmet, how often they use an ES, and how using an ES affected their travel destinations. Aside from the four parts, the questionnaire also collected the participants’ sociodemographic characteristics; participants were asked to evaluate how much of their local physical environment is safe for ES use.
2.2. Participants
The questionnaire was completed by 254 participants. Their age range is between 13 and 74 years old, with an average age of 28.2 years old and a standard deviation of 12.8 years. Among them, 50 participants are ES users. Table 1 presents the participants’ sociodemographic characteristics. Among the participants, 180 were employed and they were asked to estimate their income based on the average Israeli income on that year [7].

Table 1.
Participants’ sociodemographic characteristics.
2.3. Confirmatory Factor Analysis (CFA)
A confirmatory factor analysis was used to test the proposed measurement models of the studied latent variables. The exclusion criteria were factor loading lower than 0.4. Also, any factor that led to an alpha Cronbach value lower than 0.7 was excluded (due to poor internal consistency). The CFA was conducted using RStudio4.2.2.
2.4. Structural Equation Model
The following precursor steps were undertaken to construct the SEM: (a) using RStudio, a CFA was used to find the relevant latent variables, with factor loading lower than 0.4 being the exclusion criteria; (b) after conducting the CFA, factors were grouped under logical latent variables. Any factor that did not associate with a latent variable was excluded; (c) and the alpha Cronbach value was checked, and any factor that led to an alpha Cronbach value lower than 0.7 was excluded (due to poor internal consistency).
The SEM model was then constructed along the following lines: (a) the model examined the relationship among the latent variables and the effect of a safe ES environment on those variables, using the following goodness-of-fit indices to determine optimal results; (b) significance of individual structural paths, using only the structural paths that were statistically significant (p-value < 0.05), with borderline significance being retained; (c) Comparative Fit Index (CFI) and Tucker–Lewis Index (TLI) values were close to 0.9; (d) Root Mean Square Error of Approximation (RMSEA) and Standardized Root Mean Residual (SRMR) values were less than or equal to 0.08, and lastly, the Akaike Information Criterion (AIC) was used to compare between models. Some measurements that poorly affected the SEM were excluded from the latent variables in the SEM, even with a factor loading above 0.4. The analysis was conducted using the “Lavaan” package in RStudio. A multivariate normality test was conducted on the factors to determine which estimator method to use in the SEM.
3. Results
The analysis of travel behavior in Section 3.1 focuses on data collected from 50 ES users, while the findings in the remaining sections are based on the full dataset comprising 254 participants.
3.1. Travel Behavior of ES Users
The 50 ES users who completed the questionnaire included thirty-six males and fourteen females, ranging from 15 to 42 years old; their average age was 22.0, with a standard deviation of 5.8 years. Most of them were used to riding an ES. For example, 62% of them started using an ES more than a year before the questionnaire and only one started less than a month before the questionnaire. Participants were asked about the purposes for which they use ES (Figure 1). They could select one or more options and were also given the opportunity to specify any additional reasons by selecting the “other” option. Most ES use was for leisure, 30% of participants use an ES for work, and 30% use an ES for education. The introduction of the ES made travel easier and opened new destinations for the participants. Forty percent said that ES use increased the number of visits to their usual destinations, and 36% said that an ES made it possible to visit new destinations. These results support the advantages of ES use as a viable transportation alternative. In safety gear, 84% claimed to wearing a helmet in the last month before the questionnaire. This percentage is much higher than the results found in the literature (ranging from 0% to 42%), and this depends on the country and the safety regulations implemented there. In Israel, helmet use is mandatory; failure to wear a helmet while driving can lead to an NIS 1000 fine. Forty-eight percent of participants were in a near-miss accident situation.
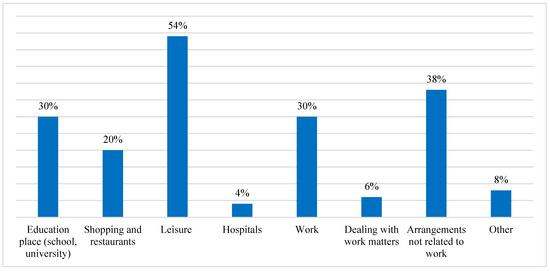
Figure 1.
For what purposes do you use an ES?
Figure 2 presents the near-miss incidents of the participants for four scenarios that they were presented with in the questionnaire. Pedestrians have the lowest involvement, and vehicles with excessive speed have the highest involvement. Figure 3 presents the infrastructure participants use for ES use (they could pick one or more of the answers). The most common places are bike lanes and sidewalks. However, 38% of participants use it on motor roads. In Israel, driving an ES outside their designated use places (bike lanes and side streets with low traffic) leads to a fine. For example, driving ES on a pedestrian sidewalk leads to an NIS 250 fine.
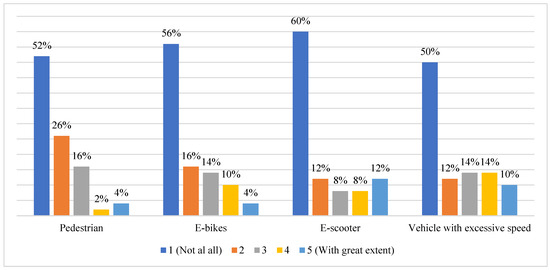
Figure 2.
How often have you been involved in a “near-miss” accident while riding an ES due to the outbreak of the following entities?
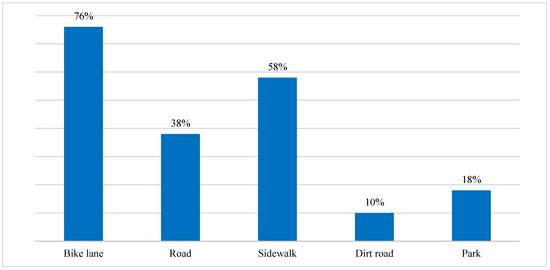
Figure 3.
Where do you usually use an ES?
3.2. Common ES Risks
Understanding the participant’s risk perception can aid in improving the safety environment of ES use, thus decreasing accident rates and increasing the prevalence of ES use (that is hindered by a low sense of safety). Participants were asked to name the main risks associated with several risks. These risks were based on the literature and the author’s experience. Participants could pick one or more of the answers; also, they could point out other risks that they think of by selecting the option “other”. The results are presented in Figure 4, as can be seen, dangerous behavior by other drivers on the road was the most frequently chosen risk, followed by a lack of lanes designated for ES use and careless ES driving behavior. The least frequently chosen risk is the careless behavior of pedestrians. The results suggest that comfortable ES use lanes for ES users substantially improve safety perception by avoiding exposure to other road users, especially vehicles (a factor that causes accidents with the highest severity). Another key component is improving ES driving behavior by increasing the awareness of ES users to their effect on other road users (61% chose it to be one of the main risks).
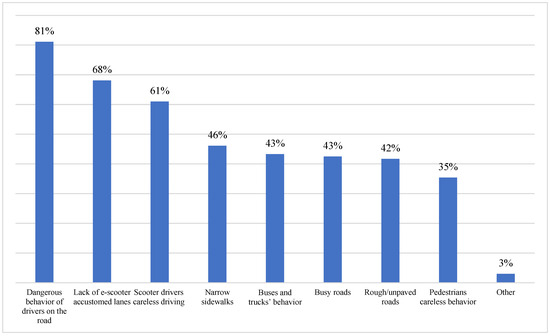
Figure 4.
What are the main risks associated with riding an ES?
3.3. Barriers to ES Use
The growing use of ESs has many positive impacts on the public and the environment. However, several barriers exist that minimize the prevalence of ES use. Understanding these barriers can aid in developing plans to minimize them, thus increasing the use of ESs. All 254 participants were asked to state the reasons that prevent them from using ESs. This question is also relevant for ES users since they may have limited use of ES due to various factors. Participants could pick one or more of the answers; also, they had the option of “other” to fill any reason that was not specified in the question. As shown in Figure 5, a low sense of safety is by far the most reported reason by participants for preventing ES use. This result is consistent with the finding in the previous section. Weather conditions are also a considerable barrier; this is consistent with the findings of Abouelela et al. [41]. This low sense of safety is one of the main shortcomings of micro-mobility. Reducing cost also has great potential in increasing the use of ESs, as 23% reported it to be a barrier. For the 9% that reported a different option, “other”, there were many reasons; however, only a few participants reported each one. Examples of these answers are “no place to load stuff”, “I have a car”, and “age”.
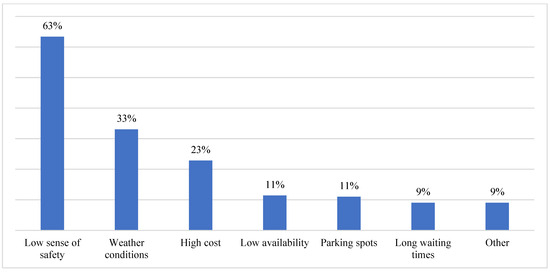
Figure 5.
What reasons prevent you from using an ES?
3.4. Latent Variables
The CFA found the following latent variables: risk perception, positive attitudes towards ESs, subjective norms, support shared ES service, willingness to share personal ES, willingness to use shared ES service, female attitudes, female risk, and safe ES environment. The factors for latent variables are as follows: positive attitudes towards ESs, subjective norms, support shared ES service, willingness to share personal ES, and willingness to use shared ES service, in the survey, are questions with a 5-point Likert scale (1 is “to a very low extent”, 5 is “to a very high extent”). The factors for the latent variable risk perception in the survey are questions with a 5-point Likert scale (1 is “Totally disagree”, 5 is “Totally agree”). The factors for the latent variables’ female attitudes and female risk in the survey are questions with a 4-point Likert scale (1 is “Totally disagree”, 4 is “Totally agree”). If a question was irrelevant to a particular participant, they could choose “Irrelevant for me”. This answer was assigned a zero value in the model so that it would not affect the analysis. This option was available for all factors aside from the ones for the risk perception latent variable (since the option “Irrelevant for me” does not apply). The results of the “safe ES environment” question, which is incorporated in the SEM, are presented in Figure 6 (Participants were asked to evaluate the safety of their local environment for ESs, reporting from 1 “Totally unsafe” to 5 “Totally safe”).
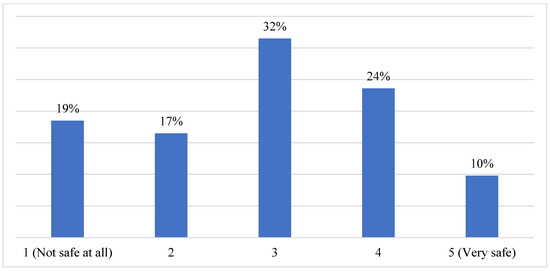
Figure 6.
How safe is your local environment for ES driving?
The factors relevant to female attitudes and risk are presented in Figure 7. The questions were specifically focused on females due to their lower prevalence as ES users, as reflected in the questionnaire where 189 out of 254 participants noted they encountered more male than female ES users. While the sample size may not be large enough to draw definitive conclusions, the focus on female drivers in this study is intended to explore the unique barriers they face when using ESs, as well as the societal perceptions that may influence their usage. The results suggest a general disagreement with the statements towards female drivers. And only 28% of participants agree that female drivers pose a greater danger. However, the results also reveal a notable pattern of aversion towards elderly and young female drivers, with responses indicating significant reservations among participants. Between 38% and 48% respondents expressed negative attitudes towards these demographic groups. This trend reflects potential cultural or societal biases, where gender and age may influence perceptions of competency or safety in driving or operating vehicles like scooters. Such findings underscore the need to address these biases, as they may impact policies, educational initiatives, or societal acceptance of diverse groups in shared transportation environments.
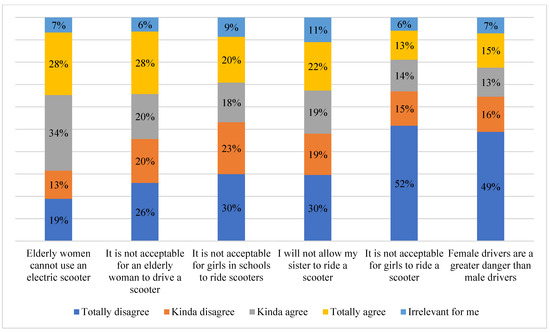
Figure 7.
Factors associated with female attitudes and risk.
Table 2 outlines the latent variables, their corresponding factors and Cronbach’s Alpha values, indicating internal consistency. The latent variables and their associated factors marked with reference [42] in Table 2 were adapted from the study by Huang (2021). The original questions were slightly rephrased, and the term “scooter” was replaced with “ES” to better reflect the scope of this study. While the foundational structure and intent of the questions remain consistent with Huang’s (2021) work, these adjustments were made to align them with the specific context and objectives of this research. Each latent variable exhibited a high level of reliability, with Cronbach’s alpha values ranging from 0.75 to 0.92. This suggests that the factors within each latent variable consistently measure the same underlying construct.
Table 2.
Latent variables and their factors.
Positive attitudes: This variable, with an alpha of 0.92, includes factors like the satisfaction and practicality of owning a private ES, and it reflects a positive perception of ES as a transportation mode.
Subjective norms: With a Cronbach’s alpha of 0.91, this variable captures social influences, emphasizing the impact of significant others on the respondent’s likelihood of using shared ES services.
Support for shared ES service: This variable also has high reliability (α = 0.92), reflecting a positive view of shared ES services, considering aspects like fun, cost-effectiveness, and the potential for habitual use.
Willingness to share personal ES: The reliability of this variable is strong (α = 0.91), focusing on the respondent’s willingness to share their personal ES for better utilization, financial gain, and professional management.
Willingness to use shared ES service: With an alpha of 0.91, this variable indicates the likelihood of using shared ES services for various purposes, including daily commutes and work-related travels.
Risk perception: This variable has a reliability of 0.92, capturing concerns related to safety and the perceived dangers of riding an ES in different scenarios.
Female attitudes and female risk: These variables reflect gender-specific attitudes and risk perceptions. Female attitudes have a lower reliability (α = 0.75), which might suggest a more complex or less consistent construct.
3.5. SEM Results–Latent Variables
An SEM was developed to examine the relationships among the latent variables. Before running the SEM, a multivariate normality test was used to assess the factors. The results show that all factors are not normally distributed with a p-value lower than 0.001. Therefore, the Robust Maximum Likelihood estimator was used in the “Lavaan” package in RStudio.
Initially, the SEM analysis incorporated all sociodemographic variables listed in Table 1, treating them as categorical variables. For the 74 participants who reported being unemployed, their income was grouped into a single distinct category, without further breakdown into specific income sources such as parental allowances or pensions. In addition, age was categorized into fewer groups than originally presented in Table 1, though this modification did not result in statistical significance. However, after conducting the analysis, it was found that most of these sociodemographic variables, including income and age, did not demonstrate statistical significance in relation to the model’s outcome variables. Gender emerged as the only significant variable in this regard. The inclusion of these non-significant sociodemographic variables in the SEM led to issues with the model’s stability, reliability, and overall fit. As a result, to improve the robustness of the SEM and maintain the clarity and focus of the analysis, these sociodemographic variables were excluded from the final model.
Table 3 presents the SEM results for the latent variables, showing the estimates, standard deviations, p-values, and standardized estimates (β).
Table 3.
SEM results–latent variables.
Positive attitudes: The factors A1 through A5 all show significant loadings, with A2 (β = 0.861) and A5 (β = 0.854) having the strongest associations. This indicates that positive attitudes towards private ES ownership and its practicality are significant predictors of the overall latent variable.
Subjective norms: B2 (β = 0.896) and B3 (β = 0.912) show the strongest associations, emphasizing the influence of social pressures on the decision to use shared ES services.
Support shared ES service: The factors C1 to C5 are all significant, with C4 (β = 0.853) showing a strong association, indicating that the potential for habit formation is a key aspect of supporting shared ES services.
Willingness to share personal ES: D2 (β = 0.907) and D3 (β = 0.961) are significant, with D3 showing the strongest association, suggesting that professional management is a major factor in the willingness to share personal ESs.
Willingness to use shared ES service: E2 (β = 0.892) and E3 (β = 0.889) are highly significant, indicating that frequent and continued use of shared ES services is a strong predictor of willingness.
Risk perception: F2 (β = 0.931) and F3 (β = 0.872) highlight the fear of accidents, particularly with motor vehicles and electric bicycles, as the most significant concerns.
Female attitudes: G2 (β = 0.811) has the strongest loading, indicating that the perception of elderly females’ inability to use ESs is a significant factor in shaping gender-specific attitudes.
Table 4 provides the regression results, showing the relationships between different latent variables. These results are visually depicted in Figure 8, which presents the standardized estimates, and contains the latent variables and the pathways among them.
Table 4.
Structural equation results—Regression.
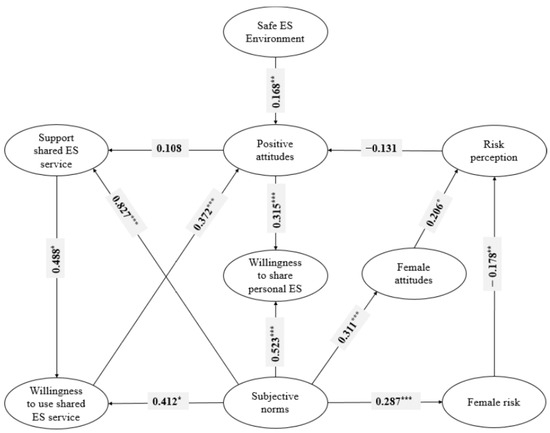
Figure 8.
Structural equation model. * p < 0.05; ** p < 0.01; *** p < 0.001.
Positive attitudes: Risk perception negatively affects positive attitudes (β = −0.131, p = 0.075), though this effect is not statistically significant. This suggests that higher risk perception may decrease positive attitudes. Willingness to use shared ES service positively influences positive attitudes (β = 0.372, p < 0.001). The more willing individuals are to use shared ES services, the more favorable their attitudes towards them become. A safe ES environment positively impacts positive attitudes (β = 0.168, p = 0.007), indicating that perceptions of safety enhance favorable attitudes toward ES.
Support for shared ES service: Positive attitudes toward ES services have a moderate positive effect on support for shared ES services (β = 0.108, p = 0.052). Subjective norms strongly influence support for shared ES services (β = 0.827, p < 0.001), indicating that social pressures and expectations are key drivers in promoting support for these services.
Willingness to use shared ES service: This willingness is significantly driven by subjective norms (β = 0.412, p = 0.019), suggesting that societal expectations play a crucial role in shaping individuals’ willingness to use shared ES services. Support for shared ES services significantly predicts the willingness to use them (β = 0.488, p = 0.013), demonstrating that increased support for these services leads to a higher likelihood of using them.
Willingness to share personal ES: This is positively influenced by positive attitudes (β = 0.315, p < 0.001). Individuals with more favorable attitudes towards ES are more likely to share their personal ES. It is also strongly influenced by subjective norms (β = 0.523, p < 0.001), highlighting the significant role of societal expectations.
Risk perception: Female-specific attitudes positively affect risk perception (β = 0.206, p = 0.013), suggesting that negative perceptions of female use of ES increase overall risk perception. Female-specific risks negatively impact overall risk perception (β = −0.178, p = 0.008), indicating that these perceived risks may lower the general perception of risk.
Female attitudes and Female risk: Both are significantly influenced by subjective norms, with β values of 0.311 and 0.287, respectively, showing that societal expectations strongly shape gender-specific attitudes and perceived risks.
Table 5 provides the following SEM goodness-of-fit indices: Comparative Fit Index (CFI) = 0.908 and Tucker–Lewis Index (TLI) = 0.900: Both values indicate an acceptable fit, as values above 0.9 are considered good. Root Mean Square Error of Approximation (RMSEA) = 0.057: This value is within the acceptable range (0.05–0.08), indicating a good fit. Standardized Root Mean Square Residual (SRMR) = 0.072: This is slightly above the ideal threshold of 0.08, suggesting a reasonable fit.
Table 5.
SEM goodness-of-fit indices.
4. Conclusions
This study aimed to investigate the factors influencing the adoption and use of ES, with a particular focus on risk perception, societal norms, attitudes towards shared ES services, and the physical environment. Using SEM, this research explored the complex relationships among various latent variables affecting ES risk perception and adoption behavior. This study primarily employs SEM to analyze the relationships between the variables. Descriptive statistics were used to provide background information about the sample, while CFA was conducted to assess the suitability and validity of the latent variables before applying SEM. Additionally, travel behavior of ES users, common ES risks, and barriers to ES use were also studied to provide valuable insights that complement the SEM analysis by offering a different perspective on the data.
While descriptive statistics provided an overview of the sample and basic trends, the core analysis was based on SEM, which allowed for an in-depth examination of the connections between the following factors, risk perception, positive attitudes toward ES, subjective norms, support for shared ES services, willingness to use shared ES services, willingness to share personal ES, gender-specific attitudes, and the perception of a safe ES environment. The SEM results reveal the complex relationships among the latent variables. The results highlight that positive attitudes towards shared ESs are influenced by perceptions of safety, willingness to use shared services, and societal norms. Safety concerns slightly decrease positive attitudes, while willingness to use and a safe environment significantly enhance them. Support for shared ES services is primarily driven by societal expectations and positive attitudes. Willingness to use shared ES is shaped by societal norms and support for these services. Willingness to share personal ES is influenced by positive attitudes and social pressures. Gender-specific attitudes and risks are also shaped by societal norms, affecting overall risk perception. Efforts to improve safety, societal acceptance, and positive experiences with shared ES can increase participation and support for these services.
The questionnaire findings also underscore several important issues: 48% of ES users reported experiencing near-miss accidents, and 38% used ES on the road, highlighting significant safety concerns. A major barrier to increased ES use was a low sense of safety, and societal bias against young female and elderly drivers was evident. ESs are used mostly for leisure. Bike lanes and sidewalks are the main path used by ES riders. These results provide valuable insights into the societal context of ES adoption and can guide efforts to reduce risks and promote broader usage.
Sociodemographic variables such as age, income, or household size were initially considered in the analysis. However, most of these variables were not statistically significant, with gender being the only exception. Including additional sociodemographic variables in the SEM impacted the stability and reliability of the model. Therefore, these non-significant variables were excluded from the final SEM to avoid potential issues with model complexity and ensure the robustness of the results.
Future research should address the limitation of not considering all sociodemographic variables, by expanding the participant pool. The income level should also consider the various categories of unemployment, such as allowances for young individuals and pensions for older individuals. Furthermore, factors not explored in this study, such as individual preferences, previous exposure to shared ES systems, the impact of stray animals or pets, and broader contextual influences like market conditions or policy frameworks, should be examined to develop a more comprehensive understanding of the determinants affecting the willingness to adopt shared ESs. Expanding the dataset and integrating these factors would refine the SEM and enhance its applicability across diverse populations and contexts.
Author Contributions
Conceptualization, F.S. and W.E.; methodology, F.S. and W.E.; software, F.S. and W.E.; validation, F.S.; formal analysis, F.S.; data curation, F.S. and W.E.; writing—original draft preparation, F.S.; writing—review and editing, F.S. and W.E. All authors have read and agreed to the published version of the manuscript.
Funding
This research received no external funding.
Institutional Review Board Statement
Not applicable.
Informed Consent Statement
Not applicable.
Data Availability Statement
The datasets used and analyzed during the current study are available from the corresponding author upon reasonable request.
Conflicts of Interest
The authors declare no conflicts of interest.
References
- Schiller, P.L.; Kenworthy, J. An Introduction to Sustainable Transportation: Policy, Planning and Implementation; Routledge: London, UK, 2017. [Google Scholar]
- De Nazelle, A.; Nieuwenhuijsen, M.J.; Antó, J.M.; Brauer, M.; Briggs, D.; Braun-Fahrlander, C.; Cavill, N.; Cooper, A.R.; Desqueyroux, H.; Fruin, S.; et al. Improving health through policies that promote active travel: A review of evidence to support integrated health impact assessment. Environ. Int. 2011, 37, 766–777. [Google Scholar] [CrossRef] [PubMed]
- Aguilera-García, Á.; Gomez, J.; Sobrino, N.; Vinagre Díaz, J.J. Moped scooter sharing: Citizens’ perceptions, users’ behavior, and implications for urban mobility. Sustainability 2021, 13, 6886. [Google Scholar] [CrossRef]
- Younes, H.; Zou, Z.; Wu, J.; Baiocchi, G. Comparing the temporal determinants of dockless scooter-share and station-based bike-share in Washington, DC. Transp. Res. Part A Policy Pract. 2020, 134, 308–320. [Google Scholar] [CrossRef]
- Gitelman, V.; Korchatov, A.; Elias, W. Speeds of young e-cyclists on urban streets and related risk factors: An observational study in Israel. Safety 2020, 6, 29. [Google Scholar] [CrossRef]
- Gitelman, V.; Korchatov, A.; Carmel, R.; Elias, W. Young e-cyclists in Israeli cities: A characterization of typical behaviours and risk factors based on field observations. Trans. Transp. Sci. 2018, 9, 18–32. [Google Scholar] [CrossRef]
- Israel Central Bureau of Statistics. “Traffic Accidents with Casualties 2018–2023”. Available online: https://www.cbs.gov.il/he/mediarelease/Pages/2021/%D7%AA%D7%90%D7%95%D7%A0%D7%95%D7%AA-%D7%93%D7%A8%D7%9B%D7%99%D7%9D-%D7%A2%D7%9D-%D7%A0%D7%A4%D7%92%D7%A2%D7%99%D7%9D-%D7%A1%D7%99%D7%9B%D7%95%D7%9D-%D7%A9%D7%A0%D7%AA-2020.aspx (accessed on 3 January 2025).
- Siman-Tov, M.; Radomislensky, I.; Israel Trauma Group; Peleg, K. The casualties from electric bike and motorized scooter road accidents. Traffic Inj. Prev. 2017, 18, 318–323. [Google Scholar] [CrossRef]
- Namiri, N.K.; Lui, H.; Tangney, T.; Allen, I.E.; Cohen, A.J.; Breyer, B.N. Electric scooter injuries and hospital admissions in the United States, 2014–2018. JAMA Surg. 2020, 155, 357–359. [Google Scholar] [CrossRef]
- Siebert, F.W.; Ringhand, M.; Englert, F.; Hoffknecht, M.; Edwards, T.; Rötting, M. Braking bad–Ergonomic design and implications for the safe use of shared E-scooters. Saf. Sci. 2021, 140, 105294. [Google Scholar] [CrossRef]
- Haworth, N.; Schramm, A.; Twisk, D. Comparing the risky behaviours of shared and private e-scooter and bicycle riders in downtown Brisbane, Australia. Accid. Anal. Prev. 2021, 152, 105981. [Google Scholar] [CrossRef]
- Allem, J.P.; Majmundar, A. Are electric scooters promoted on social media with safety in mind? A case study on Bird’s Instagram. Prev. Med. Rep. 2019, 13, 62–63. [Google Scholar] [CrossRef]
- Trivedi, T.K.; Liu, C.; Antonio, A.L.M.; Wheaton, N.; Kreger, V.; Yap, A.; Schriger, D.; Elmore, J.G. Injuries associated with standing electric scooter use. JAMA Netw. Open 2019, 2, e187381. [Google Scholar] [CrossRef] [PubMed]
- Carrese, S.; d’Andreagiovanni, F.; Giacchetti, T.; Nardin, A.; Zamberlan, L. A beautiful fleet: Optimal repositioning in e-scooter sharing systems for urban decorum. Transp. Res. Procedia 2021, 52, 581–588. [Google Scholar] [CrossRef]
- James, O.; Swiderski, J.I.; Hicks, J.; Teoman, D.; Buehler, R. Pedestrians and e-scooters: An initial look at e-scooter parking and perceptions by riders and non-riders. Sustainability 2019, 11, 5591. [Google Scholar] [CrossRef]
- Blomberg, S.N.F.; Rosenkrantz, O.C.M.; Lippert, F.; Christensen, H.C. Injury from electric scooters in Copenhagen: A retrospective cohort study. BMJ Open 2019, 9, e033988. [Google Scholar] [CrossRef]
- Pourfalatoun, S.; Ahmed, J.; Miller, E.E. Shared Electric Scooter Users and Non-Users: Perceptions on Safety, Adoption and Risk. Sustainability 2023, 15, 9045. [Google Scholar] [CrossRef]
- Che, M.; Lum, K.M.; Wong, Y.D. Users’ attitudes on electric scooter riding speed on shared footpath: A virtual reality study. Int. J. Sustain. Transp. 2021, 15, 152–161. [Google Scholar] [CrossRef]
- Gioldasis, C.; Christoforou, Z.; Seidowsky, R. Risk-taking behaviors of e-scooter users: A survey in Paris. Accid. Anal. Prev. 2021, 163, 106427. [Google Scholar] [CrossRef]
- Farley, K.X.; Aizpuru, M.; Wilson, J.M.; Daly, C.A.; Xerogeanes, J.; Gottschalk, M.B.; Wagner, E.R. Estimated incidence of electric scooter injuries in the US from 2014 to 2019. JAMA Netw. Open 2020, 3, e2014500. [Google Scholar] [CrossRef]
- Yang, H.; Ma, Q.; Wang, Z.; Cai, Q.; Xie, K.; Yang, D. Safety of micro-mobility: Analysis of E-Scooter crashes by mining news reports. Accid. Anal. Prev. 2020, 143, 105608. [Google Scholar] [CrossRef] [PubMed]
- Younes, H.; Noland, R.B.; Andrews, C.J. Gender split and safety behavior of cyclists and e-scooter users in Asbury Park, NJ. Case Stud. Transp. Policy 2023, 14, 101073. [Google Scholar] [CrossRef]
- Schneeweiss, M.; Hassan-Ali, M.; Kam, A. Safety and risk factors associated with electric scooter use globally: A literature review. McMaster Univ. Med. J. 2021, 18, 48–60. [Google Scholar] [CrossRef]
- Sanders, R.L.; Branion-Calles, M.; Nelson, T.A. To scoot or not to scoot: Findings from a recent survey about the benefits and barriers of using E-scooters for riders and non-riders. Transp. Res. Part A Policy Pract. 2020, 139, 217–227. [Google Scholar] [CrossRef]
- Cubells, J.; Miralles-Guasch, C.; Marquet, O. Gendered travel behaviour in micromobility? Travel speed and route choice through the lens of intersecting identities. J. Transp. Geogr. 2023, 106, 103502. [Google Scholar] [CrossRef]
- Rupi, F.; Freo, M.; Poliziani, C.; Postorino, M.N.; Schweizer, J. Analysis of gender-specific bicycle route choices using revealed preference surveys based on GPS traces. Transp. Policy 2023, 133, 1–14. [Google Scholar] [CrossRef]
- Laa, B.; Leth, U. Survey of E-scooter users in Vienna: Who they are and how they ride. J. Transp. Geogr. 2020, 89, 102874. [Google Scholar] [CrossRef]
- Azimian, A.; Jiao, J. Modeling factors contributing to dockless e-scooter injury accidents in Austin, Texas. Traffic Inj. Prev. 2022, 23, 107–111. [Google Scholar] [CrossRef]
- White, E.; Guo, F.; Han, S.; Mollenhauer, M.; Broaddus, A.; Sweeney, T.; Robinson, S.; Novotny, A.; Buehler, R. What factors contribute to e-scooter crashes: A first look using a naturalistic riding approach. J. Saf. Res. 2023, 85, 182–191. [Google Scholar] [CrossRef] [PubMed]
- Sexton, E.G.; Harmon, K.J.; Sanders, R.L.; Shah, N.R.; Bryson, M.; Brown, C.T.; Cherry, C.R. Shared e-scooter rider safety behaviour and injury outcomes: A review of studies in the United States. Transp. Rev. 2023, 43, 1263–1285. [Google Scholar] [CrossRef]
- Sievert, K.; Roen, M.; Craig, C.M.; Morris, N.L. A survey of electric-scooter riders’ route choice, safety perception, and helmet use. Sustainability 2023, 15, 6609. [Google Scholar] [CrossRef]
- Kazemzadeh, K.; Haghani, M.; Sprei, F. Electric scooter safety: An integrative review of evidence from transport and medical research domains. Sustain. Cities Soc. 2022, 89, 104313. [Google Scholar] [CrossRef]
- Bloom, M.B.; Noorzad, A.; Lin, C.; Little, M.; Lee, E.Y.; Margulies, D.R.; Torbati, S.S. Standing electric scooter injuries: Impact on a community. Am. J. Surg. 2021, 221, 227–232. [Google Scholar] [CrossRef]
- Deveci, M.; Gokasar, I.; Pamucar, D.; Coffman, D.M.; Papadonikolaki, E. Safe E-scooter operation alternative prioritization using a q-rung orthopair Fuzzy Einstein based WASPAS approach. J. Clean. Prod. 2022, 347, 131239. [Google Scholar] [CrossRef]
- Kopplin, C.S.; Brand, B.M.; Reichenberger, Y. Consumer acceptance of shared e-scooters for urban and short-distance mobility. Transp. Res. Part D Transp. Environ. 2021, 91, 102680. [Google Scholar] [CrossRef]
- Gössling, S. Integrating e-scooters in urban transportation: Problems, policies, and the prospect of system change. Transp. Res. Part D Transp. Environ. 2020, 79, 102230. [Google Scholar] [CrossRef]
- Samadzad, M.; Nosratzadeh, H.; Karami, H.; Karami, A. (). What are the factors affecting the adoption and use of electric scooter sharing systems from the end user’s perspective? Transp. Policy 2023, 136, 70–82. [Google Scholar] [CrossRef]
- English, K.C.; Allen, J.R.; Rix, K.; Zane, D.F.; Ziebell, C.M.; Brown, C.V.; Brown, L.H. The characteristics of dockless electric rental scooter-related injuries in a large US city. Traffic Inj. Prev. 2020, 21, 476–481. [Google Scholar] [CrossRef] [PubMed]
- Puzio, T.J.; Murphy, P.B.; Gazzetta, J.; Dineen, H.A.; Savage, S.A.; Streib, E.W.; Zarzaur, B.L. The electric scooter: A surging new mode of transportation that comes with risk to riders. Traffic Inj. Prev. 2020, 21, 175–178. [Google Scholar] [CrossRef] [PubMed]
- Tuckel, P.; Pok-Carabalona, K. Behavior of Riders of Micromobility Vehicles in New York City. 2022. Available online: https://www.hunter.cuny.edu/communications/repository/files/Behavior-of-Riders-of-Micro-Mobile-Vehicles-in-NYC.pdf (accessed on 19 January 2025).
- Abouelela, M.; Chaniotakis, E.; Antoniou, C. Understanding the landscape of shared-e-scooters in North America; Spatiotemporal analysis and policy insights. Transp. Res. Part A Policy Pract. 2023, 169, 103602. [Google Scholar] [CrossRef]
- Huang, F.H. User behavioral intentions toward a scooter-sharing service: An empirical study. Sustainability 2021, 13, 13153. [Google Scholar] [CrossRef]
Disclaimer/Publisher’s Note: The statements, opinions and data contained in all publications are solely those of the individual author(s) and contributor(s) and not of MDPI and/or the editor(s). MDPI and/or the editor(s) disclaim responsibility for any injury to people or property resulting from any ideas, methods, instructions or products referred to in the content. |
© 2025 by the authors. Licensee MDPI, Basel, Switzerland. This article is an open access article distributed under the terms and conditions of the Creative Commons Attribution (CC BY) license (https://creativecommons.org/licenses/by/4.0/).