Abstract
COVID-19, caused by the SARS-CoV-2 virus, was first identified in December 2019 and rapidly evolved into a global pandemic. Although much of the research has focused on predictive models, less attention has been given to analyzing the effectiveness of anti-pandemic measures before the availability of vaccines. This study aims to fill that gap by analyzing the correlation between key COVID-19 endpoints—new confirmed cases and new deaths—across five countries: Italy, France, Germany, the United Kingdom, and the United States. We use a broad range of data sources, including population demographics, geography, health indicators, government responses, mobility patterns, and traffic data, all spanning from March 2020 to April 2021. The dataset covers three waves of the pandemic, with the third wave influenced by the early availability and distribution of vaccines. To identify the most significant factors, a feature selection process was applied to the data, helping to determine the key measures influencing the pandemic’s course. Our findings contribute valuable insights for future pandemics, providing policymakers with evidence-based guidance for implementing the most effective anti-pandemic measures when vaccines are not yet available.
1. Introduction and Literature Review
Severe acute respiratory syndrome coronavirus 2 (SARS-CoV-2) is the virus that causes COVID-19 (coronavirus disease 2019), the respiratory illness responsible for the COVID-19 pandemic [1]. It is unusual viral pneumonia in patients, first found in late December 2019. In a few months, the World Health Organization declared a pandemic because of its fatal effects on public health [2]. The process of authorization of the first vaccines began in late 2020 while their distribution started in and continued throughout 2021. Before vaccines became widely available, public health authorities and governments around the world relied on a combination of non-pharmaceutical interventions and strategies. Which were the most effective measures to mitigate the spread of the pandemic? Obviously, these measures were effective to varying degrees in different countries depending on the timing of implementation [3].
The literature contains hundreds of studies on COVID-19 published from the beginning of 2020 to date. Research on the immunology of coronavirus, clinical and therapeutic approaches, on the evolution of coronavirus and transmission, the vaccine production and distribution, the associated psychological disorders, material science and engineering challenges, public health, and emergency management has been published to tackle the pandemic and mitigate its impact.
One critical area of research focuses on predicting COVID-19 and measuring correlations between confirmed cases (and deaths) and various controlled and uncontrolled factors, such as government decisions, community mobility measures, demographics, and hospitalizations. Statistical analyses and machine learning techniques provide effective models and tools for mining correlations between different health indicators, emergency decisions, and pandemic evolution [4]. The availability of freely available statistical toolbox further encourages exploring interventions strategies to mitigate the pandemic’s impact [5,6].
Several literature contributions have presented correlation analyses [7,8,9,10,11] applied to COVID-19 data before the distribution of vaccines. These analyses involve different patterns and multiple countries for comparison. For example, Ref. [12] used the Pearson coefficient to measure the correlation between the stock market and COVID-19, while Ref. [9] used the Spearman and Kendall coefficients to group countries with similar correlation measures. Ref. [7] used the cross-correlation technique to estimate the relationship between human mobility patterns and COVID-19 daily cases in Jakarta and Indonesia. Additionally, Ref. [13] presented a literature review on human mobility behavior in the context of the current pandemic.
Researchers in [14] developed a tool to monitor diseases and analyze the spatiotemporal epidemiology of SARSCoV-2. Another significant contribution was made by [11], who conducted a correlation analysis on climate indicators using New York pandemic data. Additionally, Ref. [15] investigated the spatial–temporal variations in COVID-19 occurrences in relation to climate fluctuations. Furthermore, Ref. [10] selected a limited set of independent critical factors such as population density, elderly population, ethnic minority populations, diabetics, income, and smoking adults to measure their correlation with COVID-19 occurrence. This involved the quantification of Pearson’s correlation and a spatial–geographical analysis covering the United States.
Feature selection analysis is crucial for understanding the dynamics of phenomena such as the COVID-19 pandemic. One commonly used approach is the Principal Component Analysis (PCA) method, which is frequently employed in COVID-19 investigations [16,17,18]. However, PCA is not suitable when dealing with both categorical and continuous features simultaneously.
The literature showcases several contributions that demonstrate the purpose and scope of “feature ranking analysis”. Such contributions also compare different models and algorithms used to measure the relevance of a specific attribute to a target response, such as a selected endpoint [19,20]. Further details about the chosen algorithm for this study are discussed in Section 5.
The correlation analysis and the feature selection are usually the first steps towards a prediction study. Some scientific papers have presented predictive studies using techniques such as time series smoothing, neural networks, and random forest [2,8,21,22,23,24]. However, these studies were often conducted on specific countries and limited to the first wave of the COVID-19 disease. For instance, one study [24] forecasted epidemiological trends of the COVID-19 pandemic for 16 countries, including the USA, Brazil, India, Mexico, South Africa, and Italy. More recent studies have focused on subsequent waves of COVID-19 and the mass distribution of vaccines [4,25,26]. These studies have utilized time-series analyses, auto-regression techniques, Monte Carlo agent-based modeling [25], diffusion modeling [27], artificial neural network modeling [26], and the SIR compartmental model [28]. Additionally, there are explicit models that estimate the total number of deaths and the cumulative number of deaths due to the COVID-19 virus in the United States [29]. Furthermore, Ref. [30] estimated the COVID-19 death toll, considering the time-dependent effects of pandemic restrictions and changes related to COVID-19 in various regions and cities in the United States.
Along with the global pandemic spread, the role of vaccines in tackling epidemic waves is assessed in different countries. Ref. [31] mined citizens’ willingness or reluctance to be vaccinated in seven European countries. The dynamics of the pre- and post-vaccine waves in Rio de Janeiro city using techniques such as the Poincaré plot, approximate entropy, second-order difference plot, and central tendency measures are illustrated in [32]. Manjarrez et al. [33] employed Fourier and similarity analyses to examine mortality patterns within the frequency domain. By using a composite pandemic severity index and hierarchical clustering and by subdividing the pandemic into fifteen phases, Ref. [34] identified similar trajectories of pandemic severity among all German counties.
Major interest is paid to citizens’ behavioral and habits change during and after COVID-19 in different countries. Kinoshita et al. [35] investigated the discrepancy between infection prevention intentions and citizen behaviors using Bayesian probability revision. Perceived risk and psychological factors in response to the pandemic’s waves are also correlated with the citizens’ retail shopping abandonment in [36]. The shift to alternative transportation modes in urban and long-range mobility is explored in light of the spread of the pandemics and the perceived risk [37,38,39], but not enough investigated as an anti-epidemic lever of intervention. In addition to studies on individual behavior, research has also focused on the effectiveness of government-imposed restrictions in controlling the pandemic’s spread. Apio et al. [40] used the stringency index to evaluate the level of restriction policies in Korea, proposing a more country-specific measure, the Korea stringency index (KSI), to capture the nuanced impact of these policies. Similarly, Kishore et al. [41] utilized the Oxford stringency index (SI) across multiple countries to assess how government responses correlated with the severity of COVID-19 outcomes, further reinforcing the critical role of policy measures in pandemic control. These studies complement the investigation of behavioral changes by demonstrating the direct influence of government restrictions on population mobility and pandemic progression.
To the authors’ knowledge, no studies have already correlated the pre-vaccine evolution of COVID-19 across waves in different countries, with controlled and uncontrolled features belonging to a multitude of domains. These domains include both controlled features influenced by government responses and decisions (such as school closures, restrictions on community mobility and transportation, workplace closures, and facial covering) and exogenous uncontrolled features (such as geographical indicators, population demographics, or citizens behavior).
This paper aims to measure the correlation between a large number of features monitored daily for significant countries to analyze pre-vaccine government strategies and decisions and their ranked effectiveness against new confirmed COVID-19 cases (1) and deaths (2). We refer to (1) and (2) as responses and endpoints of this study. A comparative study to measure the effects of demographic, geographic, and healthcare system factors, with different anti-pandemic restrictions to citizens’ mobility and social places for different countries before the spread of vaccines has not been conducted yet and is hence mandatory to prepare for new COVID-19-like pandemics in the future.
The subsequent sections of this paper are structured as follows: Section 2 introduces the proposed methodology for data collection, database construction, and correlation analysis comparing different periods and countries. Section 3 outlines the selected data sources for the database construction, presenting the features involved in the correlation analyses with confirmed cases and new death cases. Section 4 presents the results of the correlation analyses and discusses significant findings from a comparative study of correlation measures for different countries and periods. Section 5 demonstrates a feature ranking analysis to identify the most relevant features. Finally, Section 6 delivers a conclusive discussion encompassing conclusions and areas of interest for further research.
2. Methodology
The outlined methodology comprises four primary steps, database building (1), data entry (2), correlation analysis (3), and feature ranking and selection (4), involving a critical analysis of the attributes relevant to this study.
This methodology is characteristic of many data mining and machine learning analyses conducted on extensive datasets. Specifically, the COVID-19 pandemic has facilitated the accumulation of numerous records, each representing a country under analysis. These records encompass a range of features, both categorical and non-categorical, sourced from diverse origins. Regrettably, some records are incomplete for certain countries due to the absence of at least one feature. Consequently, the focus has been directed towards countries with complete data and “comparable countries” such as Italy, France, Germany, the UK, and the United States. The initial subset pertains to the European community, while the inclusion of the UK and the US enables substantial comparative analyses, which are pivotal for this study and its subsequent discussion.
3. Database Building
The following section outlines the database architecture established for the correlation analysis component of this study. It is a dynamic, time-based database that aggregates records from various open-database sources across the globe, encompassing data from numerous countries. The primary sources were carefully selected based on their high level of availability, daily updates, and global reach, ensuring the most current and consistent data for analysis. These primary sources encompass the following:
- GitHub, which is a provider of Internet hosting for software development (https://github.com/, accessed on 1 November 2021);
- Eurocontrol, which is a pan-European civil military organization dedicated to supporting European aviation (https://www.eurocontrol.int/, accessed on 1 November 2021);
- Oxford government responses (https://covidtracker.bsg.ox.ac.uk, accessed on 1 November 2021);
- Apple mobility trends (https://covid19.apple.com/mobility, accessed on 1 November 2021), available upon request;
- Epidemiology open data, community mobility open data (https://ourworldindata.org/covid-google-mobility-trends, accessed on 1 November 2021);
- Geography, healthcare system, and demographics data.
Table 1 presents the detailed list of open sources selected for the database construction and daily record fulfillment. A brief description and the URL gives the reader more detailed info and a direct link to collect and update new data.

Table 1.
Selected sources for data collection.
The data sources at our disposal can be categorized as “static” and “dynamic” datasets. Figure 1 exemplifies the merging process of the datasets, including geography, demographics, and health-related indicators. We make a clear distinction between time-dependent feature sets and time-invariant feature sets. The former pertains to the epidemiology waves, government restrictions, and their consequential impacts on the mobility of inhabitants. The latter elucidates the geographical, demographical, and infrastructural attributes of the countries under observation. Our specific focus lies in the healthcare system, encompassing factors such as life expectancy, the number of hospital beds, and the availability of nursing staff, among others.
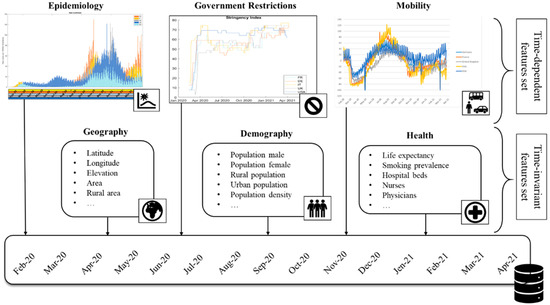
Figure 1.
Merging process from different data sources.
Appendix A presents a detailed description of the database structure and features.
In the context of a given country, the term “wave” denotes the period of a pandemic disease characterized by a substantial increase in new cases, followed by a subsequent decrease or stabilization. Table 2 provides a comprehensive account of these periods for the specific set of countries under scrutiny for correlation and comparative analysis, as delineated in the subsequent sections.
Table 2.
Waves, starting and ending times, for the selected countries in March 2020–April 2021.
4. Correlation Analysis
The objective is to assess the degree of correlation between two critical target responses: the new confirmed cases and the new deaths, and the detailed features outlined in Appendix A. Figure 2 illustrates the trajectory of the new confirmed cases and the new deaths for the selected countries during the specified time period (February 2020–April 2021).
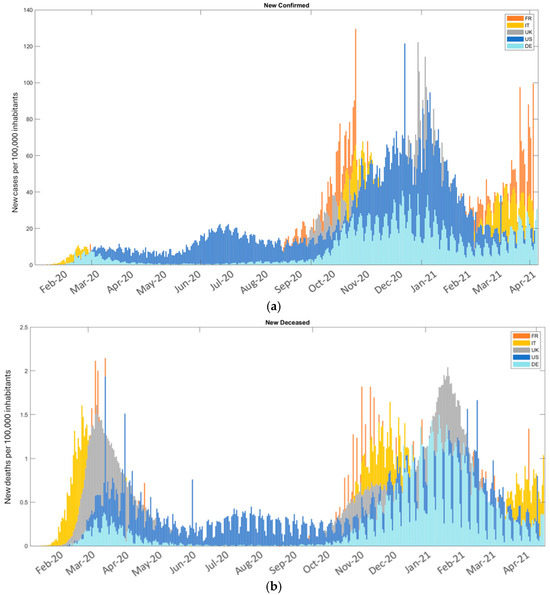
Figure 2.
New confirmed cases (a) and new deaths (b) from February 2020 to April 2021.
Figure 3 (stringency index) and Figure 4 (mobility features) depict the trend of the features for the specified period and the cohort of countries under study. It is important to note that decisions regarding government restrictions vary across countries and over time.

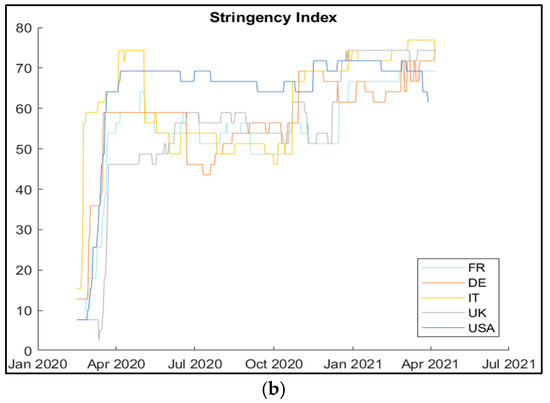
Figure 3.
Oxford COVID-19 government responses (a) and stringency index (b).


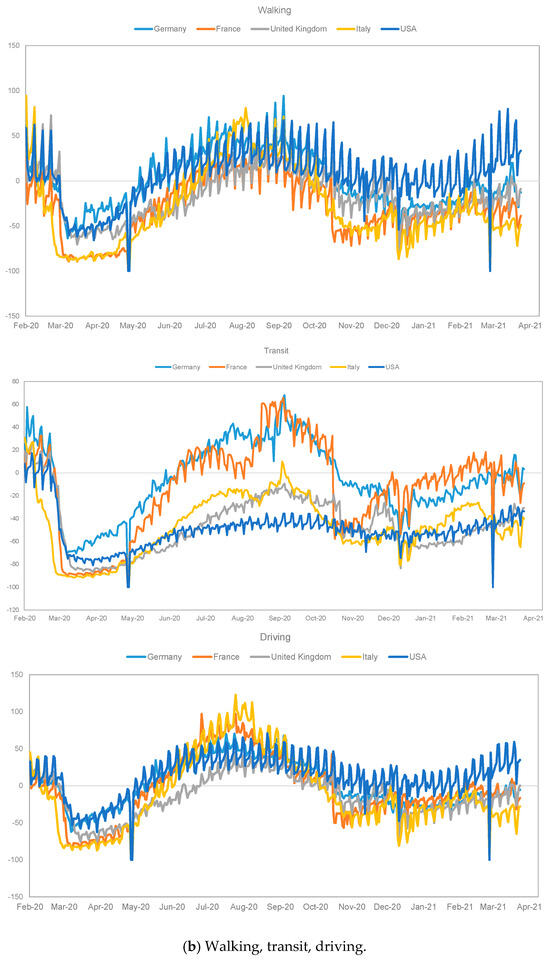
Figure 4.
Feature trend. Google COVID-19 Community Mobility (a) and Apple COVID-19 Community Mobility (b).
The COVID-19 stringency index [42] is monitored daily for each country and reflects the level of government mobility restrictions in response to the pandemic. It consolidates various policy measures, such as lockdowns, travel restrictions, and social distancing, into a single composite score. The index is standardized to a scale from 0 to 100, where higher values indicate stricter government interventions, leading to closures and limitations on mobility. This index highlights the variability in restrictions not only across countries but also over time. It primarily captures the government’s actions, rather than the behavior or impact on specific population groups.
Appendix B and Appendix C reports the Spearman correlation values between two selected endpoints and the categorical and continuous features used in this study. The Spearman correlation is suitable for analyzing both continuous and categorical variables. To quickly identify a specific correlation measure, a naming convention based on three variables has been introduced: “endpoint_feature_country_wave”.
For example, if we consider the feature “school closing” (refer to Appendix B) and the endpoint “new confirmed cases,” the global correlation index across all countries is also provided (highlighted in bold in Appendix B and Appendix C). For the first wave, the value is 2.717; for the second wave, it is 0.152; and for the third wave, it is 1.02. It is important to note that the correlation at the individual country level can significantly differ from the global correlation, providing additional insights for analysts.
Some correlation values may be absent in the tables because the related feature is constant for the selected records. For instance, the correlation level for “new cases_school closing_Germany_3rd wave” may be missing if the related feature is constant.
Section 4.1 illustrates some results of the correlation analysis conducted on the new confirmed cases (Section 4.1.1 and Section 4.1.2) and the new deaths (Section 4.1.3).
4.1. Oxford Government Responses and Citizens’ Mobility Features
4.1.1. Oxford Government Responses—New Confirmed Cases
The correlation analyses were conducted on the new confirmed cases and the Oxford government responses (Appendix B, table (a)). The stringency index levels of correlation are notably high, particularly during the first wave, with a global value for the new confirmed cases at 2.524. The overall level quantified across the three time periods (from first to third wave) is 5.807. This generic global value has been denoted as the “score” of the selected feature. In the UK, the three levels of correlation quantified for the stringency index are close to 0 (−0.014 in the first wave, −0.126 in the second, and −0.093 in the third). The highest values are observed in the first wave (0.769 in Italy). The trend of the stringency index and its individual contributions are detailed in Figure 3. Other significant and high levels of correlation pertain to the following features:
- Stay at home requirements (score 6.518, which is the sum of the three waves’ values; 3.658 global level in the first wave; 0.878 for the USA in the first wave).
- Workplaces closing (score 5.22, which is the sum of the three waves’ values; 3.251 global level in the first wave; 0.903 for the UK in the first wave).
- School closing (score 3.889, which is the sum of the three waves’ values; 2.717 global level in the first wave; 0.637 for Germany in the first wave).
- Restriction on gatherings (2.925 global level in the first wave).
Contact tracing correlation values generate the global score of −1.57, which refers to the first wave period. This score is one of the negative correlation values recorded in the correlation level table of the Oxford government responses.
4.1.2. Citizens’ Mobility Features—New Confirmed Cases
The analysis presents the following findings from the correlation analyses involving mobility features and new confirmed cases (Appendix C, table (a)):
- The correlations exhibit high levels, with the global score for the residential feature reaching 7.991, and often being lower than zero. Notably, the global score for the retail and recreation feature stands at −6.796, with a peak in the first wave for the UK.
- The residential feature correlation is predominantly positive for each country and all three time periods, except for France in the third wave (−0.136), suggesting a divergent governmental strategy.
- Traffic data also demonstrate high levels of negative correlations.
The continuous new deceased feature correlation levels closely approach 1 (peaking at 0.914 for the UK in the first wave), signifying a notable correlation between new deaths and new confirmed cases, particularly in the first and second waves (with a global score of 4.015 in the first and 3.579 in the second). This correlation notably decreases from the first to the third wave (global score 1.688).
4.1.3. Citizens’ Mobility Features—New Deaths
The following are some findings from the correlation analyses conducted for the endpoint new deaths (Appendix C, table (b)):
- Oxford government response features: The highest global score level of correlation is 6.85 for the stay-at-home requirement feature (UK and France have levels higher than 0.85 in the first wave). The Spearman level is 6.691 for the workplaces closing feature (the peak is in the UK’s first wave, equal to 0.887).
- The level of correlations with the mobility features are notably high. For instance, the global score for the parks feature is −7.177, for transit stations −8.466, and for residential 9.737 (0.912 for Italy in the first wave).
- The level of correlation with the new confirmed cases feature is also very high.
Further discussion regarding the analysis and comparison of the correlation levels assumed in different periods and for other countries can be found in the following two subsections: the first devoted to the “new confirmed cases” and the second to the “new deaths” endpoint.
4.2. New Confirmed Cases—Comparative Analysis
The dot plots showcased in Figure 5 and Figure 6 illustrate the results of correlation analyses conducted across different time periods, specifically comparing the first wave vs. second wave and second wave vs. third wave for selected countries. The horizontal axis of the plot denotes the correlation levels quantified during specific wave periods. Each dot on the plot represents a specific country, with the color indicating a particular feature. Dots of the same color in close proximity means that the countries adopted similar strategies for that feature in the two consecutive periods, even if such strategies differed between the first and second periods.
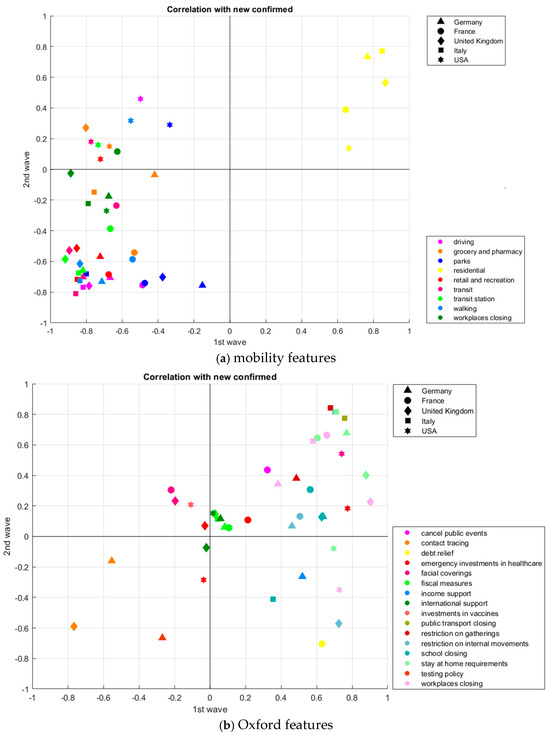
Figure 5.
Correlation analysis—endpoint “new cases”, 1st wave vs. 2nd wave: (a) “mobility” features; (b) “Oxford” features. Matlab toolbox.
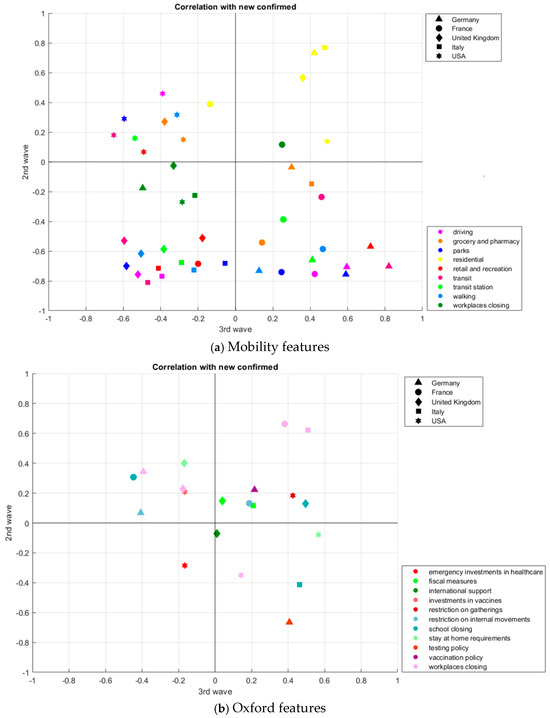
Figure 6.
Correlation analysis—endpoint “new cases”, 2nd wave vs. 3rd wave: (a) “mobility” features; (b) “Oxford” features. Matlab toolbox.
Furthermore, Appendix B and Appendix C highlights the absence of certain correlation values for specific countries, variable pairs (one feature and one endpoint), and a given wave period. This indicates that the Spearman correlation measure cannot be calculated. Consequently, the disappearance of some dots from Figure 5 to Figure 6 is due to the lack of correlation values for the considered feature, the selected endpoint, and the two waves involved. Notably, Figure 6b displays a more scattered distribution compared to Figure 6a.
Whether a dot on the plot represents a specific combination of a feature and a country and is located near the bisector line, similar correlations occur when transitioning from the first to the second wave, as depicted in the plot. For instance, when considering the residential mobility feature (indicated by yellow dots in plots (a) of Figure 5 and Figure 6), the five countries are clustered together, suggesting that they made similar decisions despite potential differences when transitioning from the second to the third periods, as evidenced by the comparison of Figure 5 and Figure 6. Specifically, France, which exhibited a negative correlation in the third wave, transitioned from the first region (dot plot (a) in Figure 5) to the second region (dot plot (a) in Figure 6).
In Figure 5, dot plot (a) illustrates a region (the fourth) with positive correlation values in the first period and negative values in the second, but there are no dots. However, the same region in Figure 6a is full of dots. Several features significantly alter the level of correlation when transitioning from the first to the second wave period. For instance, the mobility features for Germany and France exhibit similar behaviors. Comparable patterns can also be observed for these countries when considering the Oxford Government responses/decisions and comparing the first and the third wave periods.
4.3. New Deaths—Comparative Analysis
Figure 7 and Figure 8 present the correlation analysis for the new deaths endpoint and the previously selected and illustrated features, considering the period March 2020–April 2021, the selected countries, and the comparison between first and second waves and between second and third waves, respectively.
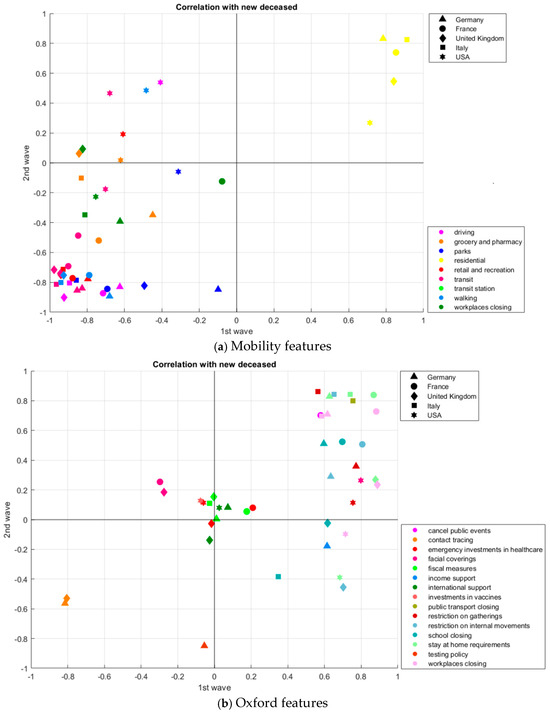
Figure 7.
Correlation analysis—endpoint “new deaths”, 1st wave vs. 2nd wave: (a) “mobility” features; (b) “Oxford” features. Matlab toolbox.
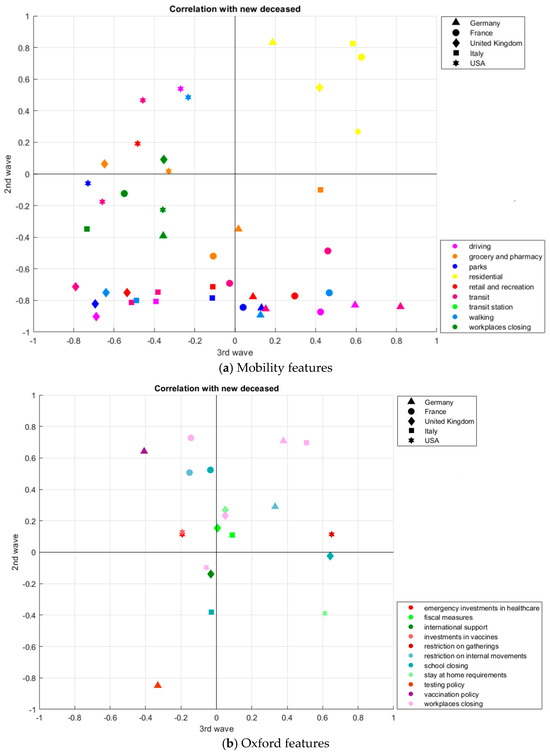
Figure 8.
Correlation analysis—endpoint “new deaths”, 2nd wave vs. 3rd wave: (a) “mobility” features; (b) “Oxford” features. Matlab toolbox.
The absence of correlation values for this endpoint results in the non-existence of certain data points arising from the combination of features and countries. Notably, when considering France and Germany, mobility features exhibit significant changes between the first and third wave periods, as evidenced by their presence in all four regions of the dot plot in Figure 7a.
Upon comparing two dot plots—one representing new confirmed cases and the other new deaths—it becomes apparent that some dots share similar locations, indicating their presence in the same region and at similar levels. Conversely, there are also dots located in different regions. For instance, the residential mobility feature and France are depicted in different regions in the second and third plots.
5. Features Ranking Analysis
Relevant features are attributes that provide valuable information for determining the endpoint value. This section is dedicated to the feature selection process, which involves identifying relevant features and discarding irrelevant ones. The method used is a Relief-based algorithm as defined and classified by [19,20]. This analysis and ranking approach is conducted individually. It evaluates individual features by assigning them weights or scores based on their degree of relevance. The original Relief algorithm was formulated by [43], and one of its evolutions is RReliefF [44], which is an individual evaluation filter method implemented by the Orange toolbox.
The utilization of score-based analysis, underpinned by the relevant literature on data mining and machine learning techniques, serves to empower decision-makers in making well-informed choices by focusing on the most salient features. This is particularly crucial in the context of unforeseeable illnesses such as the COVID-19 pandemic. It is worth noting that the analyses conducted and presented in this study do not explicitly establish cause-and-effect relationships. However, they form the initial foundation for the identification and prediction of such relationships.
The ranked scores quantified for each feature by the RReliefF algorithm are presented in Table 3 and Table 4. These scores are based on new confirmed cases and new deaths, respectively. The color scale in Table 3 is linked to the values, with low values shown in red and high values displayed in green. The ranking analyses are done for five selected countries (“FIVE COUNTRIES”) and for each individual country (France, Germany, Italy, the UK, and the USA).
Table 3.
Ranking analysis for the new confirmed cases. Five-country analysis vs. single-country analyses. RReliefF by Orange toolbox.
Table 4.
Ranking analysis for the new deaths. Five-country analysis vs. single-country analyses. RReliefF by Orange toolbox.
For each country, the ranked score is reported for the entire observation period (“ALL WAVES”) and for each individual wave (“1st WAVE,” “2nd WAVE,” etc.). It is worth noting that the ranking order can vary significantly when considering the whole period compared to a single wave time window, indicating that the relevant features can differ between periods.
The sequence of features reported in the first column of Table 3 and Table 4 aligns with the ranked values obtained from the FIVE COUNTRIES and ALL WAVES analysis. For example, workplace_closing is the first critical feature in Table 4 because in the FIVE COUNTRIES and ALL WAVES analysis, the RReliefF measure is 0.133.
When considering Italy and the endpoint of new confirmed cases, the most relevant features for the entire historical period are vaccination_policy followed by workplace_closing. However, different results are observed when analyzing individual waves. For the first wave, public_transport_closing followed by stay_at_home_requirements are most relevant, while for the second wave, vaccination_policy followed by retail_and_recreation are significant. In the third wave, workplace_closing followed by school_closing are the most relevant features. It is noteworthy that the relevance of features can vary between waves. For instance, school_closing is relevant for Italy in the whole period (rank = 3) but not in the second wave (rank = 11), and it is ranked 2 in the third wave. The most relevant feature in the second wave for Italy is vaccination_policy, which is consistent with the correlation measured for Italy and the endpoint of new confirmed cases. This confirms that different countries adopted different strategies and government responses to the pandemic.
6. Discussion and Concluding Remarks
The four-step-based correlation and feature selection analysis conducted in this study differs from the existing literature contributions for the following main issues simultaneously supported by a quantitative approach:
- Dynamic database collecting categorical and continuous attributes data from multiple sources of different typologies (population demographics, geography, health, government, community mobility, traffic, patients on hospitals, COVID infections);
- Time-based database that supports comparative analyses on different periods and waves of the COVID-19 pandemic;
- Focus on a selection of homogeneous and comparable countries in order to support comparative analyses;
- Correlation-based analysis and feature ranking analyses;
- Database availability for further research. This repository could also host new attributes coming from other additional sources, e.g., related to climate indicators or vaccines distributions;
- Adoption of an open-source data mining and machine learning toolbox;
- The result of the analysis confirms an essential role of the travel restriction and social distancing among the most adopted measures of governments to mitigate the effects of the pandemic;
- Findings in this study could assist the governmental policymaking in the near future thanks to a comparative approach that involves a wide period of observation and multiple homogeneous countries;
- The focus on non-pharmaceutical measures during periods in absence of a mass spread of vaccines makes these analyses useful to support the decision-making process in future pandemics when vaccines are still not available.
The sum of the ranking positions for each feature and each country given the ranking analyses illustrated in Table 3 and Table 4 on the whole set of data (see the so called “ALL” type analysis) are reported in Appendix D. For example, given the school closing feature, the global score (see the “global ranking score” in Appendix D) is 25, which is the sum of rank 3 for Italy, rank 4 for France, rank 16 for Germany, and rank 1 for the UK and USA. This is an additional list of summary results coming from the feature ranking analysis:
- When the target endpoint is the new confirmed cases, school closing (1), workplaces closing (2), workplaces (3), parks (4), and residential (5) are the most significant attributes for the selected response. This group of features changes passing to the new deaths endpoint: facial coverings (1), driving (2), stay at home requirements (3), residential (4), and workplaces closing (5). Residential and workplaces closing are two most significant attributes for both endpoints.
- School closing is part of the selection of most five significant attributes in three of the five countries for the new confirmed endpoint.
- Facial coverings is part of the selection of most five significant attributes in four of the five countries for the new confirmed endpoint.
- Given the target new confirmed cases and the set of five most significant attributes, two are Oxford government responses (school closing and workplaces closing) and three are google mobility features (workplaces, parks, and residential).
- Given the target new deaths and the set of five most significant attributes, two are Oxford government responses (facial coverings and stay at home requirements), one is an Apple mobility feature (driving) and two are Google mobility features (residential and workplaces closing).
This study’s time-based approach can facilitate new quantitative analyses of available and historical datasets capturing daily new records. It is imperative to conduct criticality analyses and select relevant features that consider the combined effects of various decisions, such as different government strategies, on specific endpoints.
Future research should aim to explore the effectiveness of prediction models for forecasting, operating on the extensive set of categorical and continuous attributes, features, and endpoints. Consequently, this study provides readers, planners, and policymakers, specializing in various research fields, with the opportunity to work with an integrated database, which is an additional research deliverable.
Author Contributions
Conceptualization R.M. and H.P.; methodology R.M.; formal analysis, investigation G.L.; data curation and writing G.L. and I.B. All authors have read and agreed to the published version of the manuscript.
Funding
This research did not receive any specific grant from funding agencies in the public, commercial, or not-for-profit sectors.
Institutional Review Board Statement
Not applicable.
Informed Consent Statement
Not applicable.
Data Availability Statement
See Table 1.
Acknowledgments
The authors warmly thank the Elisa Taroni and Sebastiano Naldoni for their invaluable work and cooperation on this research project.
Conflicts of Interest
The authors declare no conflict of interest.
Appendix A. Feature Descriptions and Classification
| Data Source Typology | Feature/Attribute | Type of Attribute | Description |
| Auxiliary attributes | Key Date Time index ONDATA State | C T N C C | Unique string identifying the region, e.g., US_CA Date [aaaa-mm-gg] Progressive index of time Wave number (1st–2nd–3rd wave period) for the single country Region name |
| Population demographics | Population Population_male Population_female Rural_population Urban_population Population_density HDI | N N N N N N N | Total counts of humans Total count of males Total count of females Population in a rural area Population in an urban area Population per squared kilometer of a land area Composite index of life expectancy, education and per capita income indicators |
| Pop_age_00_09 Pop_age_10_19 Pop_age_20_29 Pop_age_30_39 Pop_age_40_49 Pop_age_50_59 Pop_age_60_69 Pop_age_70_79 Pop_age_80_89 Pop_age_90_99 Pop_age_80_and_older | N N N N N N N N N N N | Estimated population between the ages of {lower} and {upper}, both inclusive | |
| Geography | Latitude Longitude Area Rural_area Urban_area | N N N N N | Floating point representing the geographic coordinate Floating point representing the geographic coordinate Area encompassing this region Area encompassing rural land in this region Area encompassing urban land in this region |
| Health related indicators | Life_expectancy Smoking_prevalence Diabetes_prevalence Infant_mortality_rate Male_mortality_rate Female_mortality_rate Pollution_mortality_rate Comorbidity_mortality_rate Hospital_beds Nurses Physicians Health_expenditure Out_of_pocket_health_expenditure | N N N N N N N N N N N N N | Average years that an individual is expected to live Percentage of smokers in population Percentage of persons with diabetes in population Infant mortality rate (per 1.000 live births) Mortality rate, adult, male (per 1.000 male adult) Mortality rate, adult, female (per 1.000 female adult) Mortality rate attributed to household and ambient air pollution, age-standardized (per 100.000 population) Mortality from cardiovascular disease, cancer, diabetes or cardiorespiratory disease between exact ages 30 and 70 Hospital beds (per 1.000 people) Nurses and midwives (per 1.000 people) Physicians (per 1.000 people) Health expenditure per capita Out of pocket expenditure per capita |
| Oxford COVID-19 government response | School_closing Workplaces_closing Cancel_public_events Restrictions_on_gatherings Public_transport_closing Stay_at_home_requirements Restrictions_on_internal_movement International_travel_controls Public_information_campaigns Testing_policy Contact_tracing Facial_coverings Vaccination_policy Income_support Debt_relief Fiscal_measures International_support Emergency_investments_in_healthcare Investments_in_vaccines Stringency_index | C C C C C C C C C C C C C N N N N N N N | School closures: 0—no measures; 1—recommend closing; 2—require closing (only some levels or categories, e.g., just high school, or just public school); 3—require closing all levels Workplace closures: 0—no measures; 1—recommend closing (or work from home); 2—require closing (or work from home) for some sectors or categories of workers; 3—require closing (or work from home) all but essential workplaces (e.g., grocery stores, doctors) Cancel public events: 0—no measures; 1—recommend cancelling; 2—require cancelling Restrictions on gatherings: 0—no restrictions; 1—restrictions on very large gatherings (the limit is above 1.000 people); 2—restrictions on gatherings between 100–1000 people; 3—restrictions on gatherings between 10–100 people; 4—restrictions on gatherings of less then 10 people Close public transport: 0—no measures; 1—recommend closing (or significantly reduce volume/route/means of transport available); 2—require closing (or prohibit most citizens from using it) Stay at home: 0—no measures; 1—recommend not leaving house; 2—require not leaving house with exceptions for daily exercise, grocery shopping, and ‘essential’ trips; 3—require not leaving house with minimal exceptions (e.g., allowed to leave only once every few days, or only one person can leave at a time, etc.) Restrictions on internal movement: 0—no measures; 1—recommend movement restrictions; 2—restrict movement International travel controls: 0—no measures; 1—screening; 2—quarantine arrivals from high-risk regions; 3—ban on high-risk regions; 4—total border closure Public information campaigns: 0—no COVID-19 public information campaigns; 1—public officials urging caution about COVID-19; 2—coordinated public information campaign (e.g., across traditional and social media) Testing policy: 0—no testing policy; 1—only those who both (a) have symptoms and (b) meet specific criteria (e.g., key workers, admitted to hospital, came into contact with a known case, returned from overseas); 2—testing on anyone showing COVID-19 symptoms; 3—open public testing (e.g., “drive through” testing available to asymptomatic people) Contact tracing: 0—no contact tracing; 1—limited contact tracing—not done for all cases; 2—comprehensive contact tracing—done for all cases Face coverings: 0—no policy; 1—recommended; 2—required in some specified shared/public spaces outside the home with other people present, or some situations when social distancing not possible; 3—required in all shared/public spaces outside the home with other people present or all situations when social distancing not possible; 4—required outside the home at all time regardless of location or presence of other people Vaccination policy: 0—no availability; 1—availability for ONE of following: key workers/clinically vulnerable groups/elderly groups; 2—availability for TWO of following: key workers/clinically vulnerable groups/elderly groups; 3—availability for ALL of following: key workers/clinically vulnerable groups/elderly groups; 4—availability for all three plus partial additional availability (select broad groups/ages) Value of fiscal stimuli, including spending or tax cuts Debt/contract relief for households Value of fiscal stimuli, including spending or tax cuts Giving international support to other countries Emergency funding allocated to healthcare Emergency funding allocated to vaccine research Overall stringency index equal to the sum of categorial features’ values of government restrictions normalized to 100 |
| Google COVID-19 community mobility | Retail_and_recreation Grocery_and_pharmacy Parks Transit_stations Workplaces Residential | N N N N N N | Percentage change in visits to restaurants, cafes, shopping centers, theme parks, museums, libraries, and movie theaters compared to baseline Percentage change in visits to place like grocery markets, food warehouses, farmer markets, specialty food shops, drug stores, and pharmacies compared to baseline Percentage change in visits to places like local parks, public beaches, marinas, dog parks, plazas, and public gardens compared to baseline Percentage change in visits to places like public transport hubs such as subway, bus and train stations compared to baseline Percentage change in visits to places of work compared to baseline Percentage change in visits to places of residence compared to baseline |
| Apple COVID-19 community mobility | Walking Driving Transit | N N N | Percentage change in walking mobility Percentage change in mobility by car Percentage change in mobility with public transport |
| Air traffic data | Departure_flight Arrival_flight Total_flight | N N N | Number of IFR departures Number of IFR arrivals Number of total IFR movements |
| Patients of COVID-19 and hospitals | Current_intensive_care | N | Count of current (active) cases admitted into ICU after a positive COVID-19 test to date |
| COVID-19 infections | New_confirmed New_recovered New_tested New_deceased | N N N N | Count of new confirmed after positive test on this date Count of new recoveries from a positive COVID-19 case on this date Count of new COVID-19 tests performed on this date Count of new deaths from a positive COVID-19 case on this date |
Appendix B. Spearman Correlation Values, Oxford Government Responses
| (a) New Cases Endpoint. | |||
| Oxford Government Response | Correlations with New Cases | ||
| First Wave | Second Wave | Third Wave | |
| School closing France Germany Italy United Kingdom USA | 2.717 0.564 0.637 0.355 0.628 0.533 | 0.152 0.307 0.130 −0.413 0.128 | 1.020 −0.447 0.462 0.495 0.510 |
| Workplaces closing France Germany Italy United Kingdom USA | 3.251 0.658 0.382 0.580 0.903 0.728 | 1.509 0.664 0.343 0.624 0.228 −0.350 | 0.462 0.381 −0.393 0.507 −0.175 0.142 |
| Cancel public events France Germany Italy United Kingdom USA | 2.556 0.323 0.601 0.355 0.629 0.648 | 0.436 0.436 | 0.234 0.234 |
| Restrictions on gatherings France Germany Italy United Kingdom USA | 2.995 0.461 0.486 0.678 0.596 0.774 | 1.408 0.381 0.843 | 0.432 0.006 0.426 |
| Public transport closing France Germany Italy United Kingdom USA | 2.538 0.437 0.758 0.629 0.714 | 1.286 0.511 0.775 | |
| Stay at home requirements France Germany Italy United Kingdom USA | 3.658 0.604 0.769 0.711 0.878 0.696 | 2.462 0.646 0.678 0.815 0.402 −0.079 | 0.398 −0.168 0.566 |
| Restriction on internal movement France Germany Italy United Kingdom USA | 3.125 0.506 0.461 0.702 0.725 0.731 | 0.445 0.132 0.068 0.815 −0.057 | −0.049 0.187 −0.407 0.171 |
| International travel control France Germany Italy United Kingdom USA | 1.295 0.490 0.823 −0.146 −0.352 0.480 | −0.268 −0.268 | |
| Public information campaigns France USA | 1.102 0.398 0.704 | ||
| Testing policy France Germany Italy United Kingdom USA | −0.078 −0.631 −0.268 0.399 −0.251 0.673 | −0.665 −0.665 | 0.407 0.407 |
| Contact tracing France Germany United Kingdom | −1.570 −0.252 −0.553 −0.765 | −0.749 −0.160 −0.589 | −0.444 −0.444 |
| Facial coverings France Germany Italy United Kingdom USA | 0.207 −0.219 0.079 −0.199 −0.195 0.741 | 1.081 0.305 0.234 0.542 | |
| Vaccination policy France Germany Italy United Kingdom USA | 0.303 0.223 0.080 | 0.065 0.459 0.216 −0.523 −0.087 | |
| Income support France Germany Italy United Kingdom USA | 2.635 0.509 0.520 0.168 0.629 0.809 | −0.263 −0.263 | |
| Debt relief France Germany Italy United Kingdom USA | 1.954 0.630 0.274 −0.400 0.641 0.809 | −0.704 −0.704 | |
| Fiscal measures France Germany Italy United Kingdom USA | 0.225 0.106 0.083 0.043 0.029 −0.036 | 0.382 0.057 0.061 0.116 0.148 | 0.090 0.208 0.039 −0.157 |
| International support France Germany United Kingdom USA | 0.178 0.123 0.059 −0.021 0.017 | 0.196 0.116 −0.072 0.152 | 0.011 0.011 |
| Emergency investments in healthcare France Germany Italy United Kingdom USA | 0.407 0.213 0.153 0.105 −0.028 −0.036 | −0.108 0.108 0.069 −0.285 | 0.042 0.208 −0.166 |
| Investments in vaccines France Germany Italy United Kingdom USA | 0.065 0.048 0.115 0.010 −0.108 | 0.081 −0.127 0.208 | −0.023 0.143 −0.166 |
| Stringency index France Germany Italy United Kingdom USA | 2.524 0.507 0.503 0.769 −0.014 0.759 | 1.613 0.629 0.293 0.537 −0.126 0.280 | 1.670 0.323 0.210 0.612 −0.093 0.618 |
| (b) New Deaths. | |||
| Oxford Government Response | Correlations with New Cases | ||
| First Wave | Second Wave | Third Wave | |
| School closing France Germany Italy United Kingdom USA | 2.787 0.697 0.596 0.348 0.617 0.529 | 0.629 0.524 0.511 −0.382 −0.024 | 0.602 −0.034 −0.028 0.641 0.023 |
| Workplaces closing France Germany Italy United Kingdom USA | 3.684 0.882 0.616 0.585 0.887 0.714 | 2.272 0.728 0.709 0.698 0.234 −0.097 | 0.735 −0.144 0.378 0.508 0.050 −0.057 |
| Cancel public events France Germany Italy United Kingdom USA | 2.715 0.579 0.569 0.348 0.586 0.633 | 0.702 0.702 | 0.261 0.261 |
| Restrictions on gatherings France Germany Italy United Kingdom USA | 3.105 0.462 0.772 0.563 0.553 0.755 | 1.334 0.359 0.861 0.114 | 0.606 −0.044 0.650 |
| Public transport closing France Germany Italy United Kingdom USA | 2.818 0.778 0.756 0.584 0.700 | 1.606 0.805 0.801 | |
| Stay at home requirements France Germany Italy United Kingdom USA | 3.795 0.868 0.627 0.739 0.878 0.683 | 2.392 0.839 0.829 0.843 0.270 −0.389 | 0.663 0.051 0.612 |
| Restriction on internal movement France Germany Italy United Kingdom USA | 3.513 0.806 0.634 0.653 0.703 0.717 | 1.184 0.507 0.290 0.843 −0.456 | 0.403 −0.152 0.331 0.224 |
| International travel control France Germany Italy United Kingdom USA | 1.339 0.585 0.857 −0.181 −0.412 0.490 | 0.018 0.018 | |
| Public information campaigns France USA | 1.080 0.389 0.691 | ||
| Testing policy France Germany Italy United Kingdom USA | −0.042 −0.764 −0.055 0.403 −0.290 0.664 | −0.849 −0.849 | −0.331 −0.331 |
| Contact tracing France Germany United Kingdom | −1.887 −0.267 −0.815 −0.805 | −1.095 −0.564 −0.531 | −0.065 −0.065 |
| Facial coverings France Germany Italy United Kingdom USA | 0.551 −0.297 0.401 −0.075 −0.276 0.798 | 0.703 0.254 0.185 0.264 | |
| Vaccination policy Germany Italy United Kingdom USA | 0.917 0.642 0.275 | −0.605 −0.408 −0.528 0.331 | |
| Income support France Germany Italy United Kingdom USA | 2.879 0.587 0.614 0.302 0.584 0.792 | −0.178 −0.178 | |
| Fiscal measures France Germany Italy United Kingdom USA | 0.098 0.176 0.011 −0.026 −0.003 −0.060 | 0.324 0.055 0.005 0.109 0.155 | −0.090 0.089 0.004 −0.183 |
| International support France Germany United Kingdom USA | 0.204 0.131 0.073 −0.026 0.026 | 0.024 0.082 −0.138 0.080 | −0.032 −0.032 |
| Emergency investments in healthcare France Germany Italy United Kingdom USA | 0.354 0.209 0.109 0.113 −0.017 −.060 | 0.167 0.080 −0.027 0.114 | −0.104 0.089 −0.193 |
| Investments in vaccines France Germany Italy United Kingdom USA | 0.083 0.071 0.124 −0.036 −0.076 | 0.004 −0.124 0.128 | −0.114 0.079 −0.193 |
| Stringency index France Germany Italy United Kingdom USA | 3.037 0.802 0.735 0.767 −0.080 0.813 | 1.777 0.801 0.595 0.702 −0.205 −0.116 | 0.847 −0.112 −0.241 0.384 0.156 0.660 |
Appendix C. Spearman Correlation Values, Oxford Government Responses
| (a) Mobility Features. New Cases Endpoint. | |||
| Mobility | Correlations with New Cases | ||
| First Wave | Second Wave | Third Wave | |
| Retail and recreation France Germany Italy United Kingdom USA | −3.82 −0.675 −0.722 −0.850 −0.852 −0.721 | −2.416 −0.685 −0.569 −0.716 −0.513 −0.067 | −0.560 −0.200 0.722 −0.413 −0.178 −0.491 |
| Grocery and pharmacy France Germany Italy United Kingdom USA | −3.180 −0.532 −0.419 −0.755 −0.803 −0.671 | −0.306 −0.542 −0.036 −0.148 0.270 0.150 | 0.193 0.142 0.300 0.408 −0.378 −0.279 |
| Parks France Germany Italy United Kingdom USA | −2.135 −0.474 −0.153 −0.798 −0.375 −0.335 | −2.590 −0.741 −0.756 −0.682 −0.701 0.290 | −0.400 0.246 0.590 −0.057 −0.584 −0.595 |
| Transit stations France Germany Italy United Kingdom USA | −3.997 −0.666 −0.818 −0.842 −0.917 −0.734 | −2.149 −0.387 −0.659 −0.676 −0.586 0.159 | −0.544 0.256 0.411 −0.289 −0.384 −0.538 |
| Workplaces France Germany Italy United Kingdom USA | −3.664 −0.627 −0.675 −0.789 −0.886 −0.687 | −0.579 0.116 −0.176 −0.224 −0.025 −0.270 | −1.081 0.249 −0.496 −0.217 −0.332 −0.285 |
| Residential France Germany Italy United Kingdom USA | 3.786 0.644 0.766 0.847 0.867 0.662 | 2.595 0.389 0.733 0.770 0.565 0.138 | 1.610 −0.136 0.421 0.476 0.359 0.490 |
| Walking France Germany Italy United Kingdom USA | −3.479 −0.542 −0.713 −0.836 −0.836 −0.552 | −2.343 −0.586 −0.732 −0.727 −0.615 0.317 | −0.447 0.467 0.126 −0.222 −0.505 −0.313 |
| Driving France Germany Italy United Kingdom USA | −3.253 −0.486 −0.667 −0.817 −0.785 −0.498 | −2.527 −0.754 −0.706 −0.768 −0.758 0.459 | −0.286 0.424 0.595 −0.393 −0.522 −0.390 |
| Transit France Germany Italy United Kingdom USA | −3.974 −0.632 −0.818 −0.858 −0.893 −0.773 | −2.098 −0.236 −0.702 −0.811 −0.529 0.180 | −0.436 0.460 0.820 −0.469 −0.596 −0.651 |
| (b) Mobility Features. New Deaths Endpoint. | |||
| Mobility | Correlations with New Deaths | ||
| First Wave | Second Wave | Third Wave | |
| Retail and recreation France Germany Italy United Kingdom USA | −4.152 −0.878 −0.796 −0.929 −0.941 −0.608 | −2.820 −0.772 −0.777 −0.713 −0.750 0.192 | −0.742 0.296 0.089 −0.110 −0.534 −0.483 |
| Grocery and pharmacy France Germany Italy United Kingdom USA | −3.482 −0.738 −0.449 −0.831 −0.843 −0.621 | −0.890 −0.520 −0.349 −0.101 0.062 0.018 | −0.644 −0.108 0.017 0.424 −0.648 −0.329 |
| Parks France Germany Italy United Kingdom USA | −2.454 −0.692 −0.099 −0.857 −0.494 −0.312 | −3.360 −0.844 −0.848 −0.786 −0.823 −0.059 | −1.363 0.040 0.131 −0.113 −0.692 −0.729 |
| Transit stations France Germany Italy United Kingdom USA | −4.338 −0.901 −0.854 −0.937 −0.944 −0.702 | −3.212 −0.692 −0.854 −0.749 −0.741 −0.176 | −0.916 −0.027 0.152 −0.383 −0.658 |
| Workplaces France Germany Italy United Kingdom USA | −3.091 −0.077 −0.624 −0.812 −0.824 −0.754 | −1.000 −0.124 −0.392 −0.349 0.092 −0.227 | −2.350 −0.549 −0.356 −0.735 −0.352 −0.358 |
| Residential France Germany Italy United Kingdom USA | 4.103 0.853 0.784 0.912 0.841 0.713 | 3.210 0.739 0.832 0.824 0.547 0.268 | 2.424 0.626 0.187 0.583 0.419 0.609 |
| Walking France Germany Italy United Kingdom USA | −3.821 −0.789 −0.680 −0.941 −0.927 −0.484 | −2.712 −0.752 −0.893 −0.801 −0.751 0.485 | −0.769 0.467 0.126 −0.490 −0.640 −0.232 |
| Driving France Germany Italy United Kingdom USA | −2.870 −0.873 −0.830 −0.805 −0.901 0.539 | −2.870 −0.873 −0.830 −0.805 −0.901 0.539 | −0.329 0.424 0.595 −0.391 −0.687 −0.270 |
| Transit France Germany Italy United Kingdom USA | −2.338 −0.487 −0.840 −0.812 −0.715 0.466 | −2.388 −0.487 −0.840 −0.812 −0.715 0.466 | −0.481 0.460 0.820 −0.514 −0.790 −0.457 |
| (c) Air Traffic Data. New Cases Endpoint. | |||
| Air Traffic Data | Correlations with New Cases | ||
| First Wave | Second Wave | Third Wave | |
| Departure flight France Germany Italy United Kingdom | −2.557 −0.509 −0.556 −0.681 −0.881 | −2.537 −0.589 −0.588 −0.642 −0.718 | 0.287 −0.150 0.233 0.006 0.198 |
| Arrival flight France Germany Italy United Kingdom | −2.564 −0.516 −0.555 −0.677 −0.816 | −2.528 −0.603 −0.584 −0.636 −0.705 | 0.102 −0.171 0.135 −0.052 0.190 |
| Total flight France Germany Italy United Kingdom | −2.564 −0.514 −0.556 −0.679 −0.815 | −2.534 −0.596 −0.585 −0.640 −0.713 | 0.109 −0.160 0.135 −0.061 0.195 |
| (d) Air Traffic Data. Deaths Endpoint. | |||
| Air Traffic Data | Correlations with New Deaths | ||
| First Wave | Second Wave | Third Wave | |
| Departure flight France Germany Italy United Kingdom | −3.459 −0.851 −0.859 −0.848 −0.901 | −3.270 −0.781 −0.797 −0.820 −0.872 | −0.281 0.302 −0.122 −0.239 −0.222 |
| Arrival flight France Germany Italy United Kingdom | −3.459 −0.855 −0.854 −0.847 −0.903 | −3.255 −0.783 −0.792 −0.819 −0.861 | −0.111 0.305 0.054 −0.242 −0.228 |
| Total flight France Germany Italy United Kingdom | −3.462 −0.854 −0.857 −0.848 −0.903 | −3.264 −0.782 −0.794 −0.820 −0.868 | −0.116 0.306 0.054 −0.253 −0.223 |
| (e) Hospital and Infections. New Cases Endpoint. | |||
| Hospital and Infections | Correlations with New Cases | ||
| First Wave | Second Wave | Third Wave | |
| Current intensive care France Italy | 1.134 0.376 0.758 | 1.617 0.779 0.838 | 0.852 0.438 0.414 |
| New deceased France Germany Italy United Kingdom USA | 4.015 0.664 0.754 0.870 0.914 0.813 | 3.579 0.721 0.808 0.804 0.826 0.420 | 1.688 −0.136 0.004 0.281 0.855 0.684 |
| New recovered France Italy | −0.037 0.390 0.353 | 1.436 0.713 0.723 | 0.675 0.499 0.176 |
| New tested France Italy United Kingdom USA | −0.655 −0.344 −0.037 −0.575 0.301 | 2.203 0.396 0.758 0.718 0.331 | 0.935 0.029 0.814 −0.485 0.577 |
| (f) Hospital and Infections. New Cases Endpoint. | |||
| Hospital and Infections | Correlations with New Deaths | ||
| First Wave | Second Wave | Third Wave | |
| Current intensive care France Italy | 1.525 0.680 0.845 | 1.868 0.928 0.940 | 0.564 0.020 0.544 |
| New deceased France Germany Italy United Kingdom USA | 4.015 0.664 0.754 0.870 0.914 0.813 | 3.579 0.721 0.808 0.804 0.826 0.420 | 1.688 −0.136 0.004 0.281 0.855 0.684 |
| New recovered France Italy | 0.001 −0.532 0.536 | 1.847 0.912 0.935 | 0.750 −0.045 0.795 |
| New tested France Italy United Kingdom USA | −0.664 −0.423 0.035 −0.675 0.399 | 2.444 0.574 0.697 0.763 0.410 | 1.200 0.646 0.418 −0.334 0.470 |
Appendix D. Summary Results on Feature Ranking Analysis: (a) the New Confirmed Cases vs. (b) the New Deaths
| (a) New Confirmed Cases. | ||
| Target: New Confirmed per 100.000 | ||
| Feature | Global Ranking Score | Times in First 5 Positions |
| School closing | 25 | 4 |
| Workplaces closing | 32 | 3 |
| Workplaces | 35 | 2 |
| Parks | 40 | 2 |
| Residential | 42 | 2 |
| Retail and recreation | 42 | 2 |
| Debt relief | 45 | 0 |
| Walking | 50 | 0 |
| Contact tracing | 53 | 0 |
| Grocery and pharmacy | 56 | 1 |
| Restriction on internal movement | 58 | 2 |
| Facial coverings | 59 | 1 |
| Transit | 61 | 0 |
| Emergency investments in healthcare | 62 | 1 |
| Stay at home requirements | 64 | 1 |
| Transit station | 65 | 0 |
| Driving | 84 | 1 |
| Income support | 85 | 1 |
| Public transport closing | 85 | 0 |
| Testing policy | 85 | 1 |
| Fiscal measures | 87 | 0 |
| International travel control | 89 | 0 |
| Cancel public events | 96 | 0 |
| Restriction on gatherings | 99 | 0 |
| International support | 108 | 0 |
| Investments in vaccines | 116 | 0 |
| Vaccination policy | 118 | 1 |
| Public information campaigns | 123 | 0 |
| (b) New Deaths. | ||
| Target: New Confirmed per 100.000 | ||
| Feature | Global Ranking Score | Times in First 5 Positions |
| Facial coverings | 38 | 3 |
| Driving | 40 | 2 |
| Stay at home requirements | 41 | 2 |
| Residential | 44 | 1 |
| Workplaces closing | 44 | 2 |
| Workplaces | 47 | 1 |
| Walking | 48 | 1 |
| Retail and recreation | 49 | 1 |
| Restriction on internal movement | 51 | 1 |
| Transit | 52 | 1 |
| Vaccination policy | 60 | 1 |
| Grocery and pharmacy | 62 | 0 |
| Public transport closing | 64 | 2 |
| Parks | 65 | 1 |
| School closing | 70 | 1 |
| Transit station | 73 | 0 |
| Debt relief | 78 | 1 |
| Emergency investments in healthcare | 82 | 1 |
| Income support | 82 | 1 |
| Testing policy | 83 | 1 |
| Restriction on gatherings | 90 | 0 |
| International travel control | 96 | 0 |
| Contact tracing | 97 | 1 |
| International support | 107 | 0 |
| Fiscal measures | 111 | 0 |
| Cancel public events | 114 | 0 |
| Investments in vaccines | 114 | 0 |
| Public information campaigns | 128 | 0 |
References
- Gorbalenya, A.E.; Baker, S.C.; Baric, R.S.; de Groot, R.J.; Drosten, C.; Gulyaev, A.A.; Haagmans, B.L.; Lauber, C.; Leontovich, A.M.; Neuman, B.W.; et al. The species Severe acute respiratory syndrome-related coronavirus: Classifying 2019-nCoV and naming it SARS-CoV-2. Nat. Microbiol. 2020, 5, 536–544. [Google Scholar]
- Gupta, V.K.; Gupta, A.; Kumar, D.; Sardana, A. Prediction of COVID-19 confirmed, death, and cured cases in India using random forest model. Big Data Min. Anal. 2021, 4, 116–123. [Google Scholar] [CrossRef]
- Ye, Q.; Ozbay, K.; Zuo, F.; Chen, X. Impact of Social Media on Travel Behaviors during the COVID-19 Pandemic: Evidence from New York City. Transp. Res. Rec. 2023, 2677, 219–238. [Google Scholar] [CrossRef]
- Utku, A. Deep learning based hybrid prediction model for predicting the spread of COVID-19 in the world’s most populous countries. Expert Syst. Appl. 2023, 231, 120769. [Google Scholar] [CrossRef]
- Demšar, J.; Curk, T.; Erjavec, A.; Gorup, Č.; Hočevar, T.; Milutinovič, M.; Možina, M.; Polajnar, M.; Toplak, M.; Starič, A.; et al. Orange: Data mining toolbox in python. J. Mach. Learn. Res. 2013, 14, 2349–2353. [Google Scholar]
- Thange, U.; Shukla, V.K.; Punhani, R.; Grobbelaar, W. Analyzing COVID-19 dataset through data mining tool ’Orange’. In Proceedings of the 2nd International Conference on Computation, Automation and Knowledge Management, ICCAKM 2021, Dubai, United Arab Emirates, 19–21 January 2021; pp. 198–203. [Google Scholar]
- Wijayanto, A.W.; Wulansari, I.Y. Human Mobility Patterns and Its Cross-Correlation with the COVID-19 Transmission in Jakarta, Indonesia. J. Phys. Conf. Ser. 2021, 1863, 012017. [Google Scholar] [CrossRef]
- Ahmad, F.; Almuayqil, S.N.; Humayun, M.; Naseem, S.; Khan, W.A.; Junaid, K. Prediction of COVID-19 cases using machine learning for effective public health management. Comput. Mater. Contin. 2021, 66, 2265–2282. [Google Scholar] [CrossRef]
- Fahrudin, T.; Wijaya, D.R.; Agung, A.A.G. COVID-19 Confirmed Case Correlation Analysis Based on Spearman and Kendall Correlation. In Proceedings of the 2020 International Conference on Data Science and Its Applications, ICoDSA 2020, Bandung, Indonesia, 5–6 August 2020. [Google Scholar]
- Ali, T.; Mortula, M.; Sadiq, R. GIS-based vulnerability analysis of the United States to COVID-19 occurrence. J. Risk Res. 2021, 24, 416–431. [Google Scholar] [CrossRef]
- Bashir, M.F.; Ma, B.B.; Komal, B.; Bashir, M.A.; Tan, D.; Bashir, M. Correlation between climate indicators and COVID-19 pandemic in New York, USA. Sci. Total Environ. 2020, 728, 138835. [Google Scholar] [CrossRef] [PubMed]
- Wang, M.; Cheng, Q.; Huang, J.; Cheng, G. ACM International Conference Proceeding Series Analysis of the European stock market’s advance response time to COVID-19 based on Pearson correlation Coefficient. In Proceedings of the ACAI 2020: 2020 3rd International Conference on Algorithms, Computing and Artificial Intelligence, Sanya, China, 24–26 December 2020. [Google Scholar]
- Benita, F. Human mobility behavior in COVID-19: A systematic literature review and bibliometric analysis. Sustain. Cities Soc. 2021, 70, 102916. [Google Scholar] [CrossRef] [PubMed]
- Rohleder, S.; Bozorgmehr, K. Monitoring the spatiotemporal epidemiology of COVID-19 incidence and mortality: A small-area analysis in Germany. Spat. Spatio-Temporal Epidemiol. 2021, 38, 100433. [Google Scholar] [CrossRef] [PubMed]
- Olaniran, J.M.; Adebayo, O.E.; Kehinde, S.O. Spatio-temporal variations in COVID-19 in relation to the global climate distribution and fluctuations. Spat. Spatio-Temporal Epidemiol. 2021, 37, 100417. [Google Scholar]
- Efimov, V.M.; Polunin, D.A.; Kovaleva, V.Y.; Efimov, K.V. The PCA-seq method applied to analyze of the dynamics of COVID-19 epidemic indicators. J. Phys. Conf. Ser. 2021, 1715, 012025. [Google Scholar] [CrossRef]
- Mahmoudi, M.R.; Heydari, M.H.; Qasem, S.N.; Mosavi, A.; Band, S.S. Principal component analysis to study the relations between the spread rates of COVID-19 in high risks countries. Alex. Eng. J. 2021, 60, 457–464. [Google Scholar]
- Shen, L.; Wang, H.; Zhu, B.; Zhao, T.; Liu, A.; Lu, W.; Kang, H.; Wang, Y. Impact of urbanization on air quality in the Yangtze River Delta during the COVID-19 lockdown in China. J. Clean. Prod. 2021, 296, 126561. [Google Scholar] [CrossRef]
- Urbanowicz, R.J.; Olson, R.S.; Schmitt, P.; Meeker, M.; Moore, J.H. Benchmarking relief-based feature selection methods for bioinformatics data mining. J. Biomed. Inform. 2018, 85, 168–188. [Google Scholar] [CrossRef]
- Urbanowicz, R.J.; Meeker, M.; La Cava, W.; Olson, R.S.; Moore, J.H. Relief-based feature selection: Introduction and review. J. Biomed. Inform. 2018, 85, 189–203. [Google Scholar] [CrossRef] [PubMed]
- Arora, P.; Kumar, H.; Panigrahi, B.K. Prediction and analysis of COVID-19 positive cases using deep learning models: A descriptive case study of India. Chaos Solitons Fractals 2020, 139, 110017. [Google Scholar] [CrossRef]
- Rahimi, I.; Gandomi, A.H.; Asteris, P.G.; Chen, F. Analysis and prediction of covid-19 using SIR, SEIQR and machine learning models: Australia, Italy and UK cases. Information 2021, 12, 109. [Google Scholar] [CrossRef]
- Rasjid, Z.E.; Setiawan, R.; Effendi, A. A Comparison: Prediction of Death and Infected COVID-19 Cases in Indonesia Using Time Series Smoothing and LSTM Neural Network. Procedia Comput. Sci. 2021, 179, 982–988. [Google Scholar] [CrossRef]
- ArunKumar, K.E.; Kalaga, D.V.; Sai Kumar, C.M.; Chilkoor, G.; Kawaji, M.; Brenza, T.M. Forecasting the dynamics of cumulative COVID-19 cases (confirmed, recovered and deaths) for top-16 countries using statistical machine learning models: Auto-Regressive Integrated Moving Average (ARIMA) and Seasonal Auto-Regressive Integrated Moving Average (SARIMA). Appl. Soft Comput. 2021, 103, 107161. [Google Scholar]
- De-Leon, H.; Aran, D. MAM: Flexible Monte-Carlo Agent based model for modelling COVID-19 spread. J. Biomed. Inform. 2023, 141, 104364. [Google Scholar] [CrossRef] [PubMed]
- Truong, D.; Truong, M.D. Impacts of Daily Travel by Distances on the Spread of COVID-19: An Artificial Neural Network Model. Transp. Res. Rec. 2023, 2677, 934–994. [Google Scholar] [CrossRef] [PubMed]
- Schäfer, M.; Heidrich, P.; Götz, T. Modelling the Spatial Spread of COVID-19 in a German District using a Diffusion Model. arXiv 2023, arXiv:2307.09956. [Google Scholar] [CrossRef] [PubMed]
- Abdin, A.F.; Fang, Y.P.; Caunhye, A.; Alem, D.; Barros, A.; Zio, E. An optimization model for planning testing and control strategies to limit the spread of a pandemic—The case of COVID-19. Eur. J. Oper. Res. 2023, 304, 308–324. [Google Scholar] [CrossRef]
- Pham, H. On estimating the number of deaths related to COVID-19. Mathematics 2020, 8, 655. [Google Scholar] [CrossRef]
- Pham, H. Estimating the COVID-19 death toll by considering the time-dependent effects of various pandemic restrictions. Mathematics 2020, 8, 1628. [Google Scholar] [CrossRef]
- Sabat, I.; Neumann-Böhme, S.; Barros, P.P.; Torbica, A.; van Exel, J.; Brouwer, W.; Stargardt, T.; Schreyögg, J. Vaccine hesitancy comes in waves: Longitudinal evidence on willingness to vaccinate against COVID-19 from seven European countries. Vaccine 2023, 41, 5304–5312. [Google Scholar] [CrossRef] [PubMed]
- Reis, A.S.; dos Santos, L.; Cunha, A., Jr.; Konstantyner, T.C.R.O.; Macau, E.E.N. Unravelling COVID-19 waves in Rio de Janeiro city: Qualitative insights from nonlinear dynamic analysis. Infect. Dis. Model. 2024, 9, 314–328. [Google Scholar] [CrossRef] [PubMed]
- Manjarrez, E.; Delfin, E.F.; Dominguez-Nicolas, S.M.; Flores, A. Power spectral density and similarity analysis of COVID-19 mortality waves across countries. Heliyon 2024, 10, e35546. [Google Scholar] [CrossRef]
- Kuebart, A.; Stabler, M. Waves in time, but not in space—An analysis of pandemic severity of COVID-19 in Germany. Spat. Spatio-Temporal Epidemiol. 2023, 47, 100605. [Google Scholar] [CrossRef] [PubMed]
- Kinoshita, S.; Sato, M.; Ida, T. Bayesian probability revision and infection prevention behavior in Japan: A quantitative analysis of the first wave of COVID-19. Res. Econ. 2024, 78, 100986. [Google Scholar] [CrossRef]
- Akhtar, N.; Ittefaq, H.; Siddiqi, U.I.; Islam, T.; Hameed, Z.; Kuzior, A. Zero-COVID and retail: Using multi-wave data to examine the role of perceived risk and psychological factors in shopping abandonment. J. Retail. Consum. Serv. 2024, 78, 103737. [Google Scholar] [CrossRef]
- Jamal, S.; Paez, A. Exploring modal shift in non-active sustainable transport modes during the first wave of COVID-19 in Bangladesh. Multimodal Transp. 2024, 3, 100130. [Google Scholar] [CrossRef]
- Cochran, A.L.; Wang, J.; Iacobucci, E. Perceived discrimination, transit use, and walking behavior during the COVID-19 pandemic: Evidence from the Understanding America Study. Travel Behav. Soc. 2025, 38, 100871. [Google Scholar] [CrossRef]
- Noureldin, M.G.; Diab, E. Understanding the effects of a long-term transit service suspension during the COVID-19 pandemic on transit users’ travel choices. Case Stud. Transp. Policy 2024, 17, 101223. [Google Scholar] [CrossRef]
- Catherine, A.; Kyulhee, H.; Doeun, L.; Bogyeom, L.; Taesung, P. Development of New Stringency Indices for Nonpharmacological Social Distancing Policies Implemented in Korea During the COVID-19 Pandemic: Random Forest Approach. JMIR Public Health Surveill. 2024, 10, e47099. [Google Scholar]
- Kamal, K.; Vidushi, J.; Kumar, P.A.; Madhur, V.; Vipin, K. Utility of the Comprehensive Health and Stringency Indexes in Evaluating Government Responses for Containing the Spread of COVID-19 in India: Ecological Time-Series Study. JMIR Public Health Surveill. 2023, 9, e38371. [Google Scholar]
- Mathieu, E.; Ritchie, H.; Rodés-Guirao, L.; Appel, C.; Giattino, C.; Hasell, J.; Macdonald, B.; Dattani, S.; Beltekian, D.; Ortiz-Ospina, E.; et al. Coronavirus Pandemic (COVID-19). Published online at OurWorldinData.org. 2020. Available online: https://ourworldindata.org/coronavirus (accessed on 1 November 2021).
- Kira, K.; Rendell, L.A. The feature selection problem: Traditional methods and a new algorithm. Proc. AAAI 1992, 2, 129–134. [Google Scholar]
- Kononenko, I. Estimating attributes: Analysis and extensions of relief. In Proceedings of the European Conference on Machine Learning, Catania, Italy, 6–8 April 1994; Springer: Berlin/Heidelberg, Germany, 1994; pp. 171–182. [Google Scholar]
Disclaimer/Publisher’s Note: The statements, opinions and data contained in all publications are solely those of the individual author(s) and contributor(s) and not of MDPI and/or the editor(s). MDPI and/or the editor(s) disclaim responsibility for any injury to people or property resulting from any ideas, methods, instructions or products referred to in the content. |
© 2025 by the authors. Licensee MDPI, Basel, Switzerland. This article is an open access article distributed under the terms and conditions of the Creative Commons Attribution (CC BY) license (https://creativecommons.org/licenses/by/4.0/).