Abstract
Contemporary science is seeking simple and scalable methods of producing stable colloidal solutions of carbon nanomaterials that have favorable optical properties. Pyrolytic carbon (PyC), a by-product of methane pyrolysis, is a promising sustainable material. This study developed a method of obtaining stable PyC colloids using ultrasonic homogenization and investigated the effects of solvent polarity on dispersion, stability, and photoluminescence. Mechanically fragmented PyC was ultrasonically treated in ethanol, acetonitrile, and cyclohexane. Characterization using dynamic light scattering, UV-Vis spectroscopy, photoluminescence, Raman spectroscopy, Fourier-transform infrared spectroscopy (FTIR), and electron microscopy revealed that solvent polarity significantly influenced fragmentation and colloid stability. Polar solvents, especially ethanol, promoted better dispersion of aggregates, whereas nonpolar cyclohexane produced smaller, yet unstable aggregates. Raman and FT-IR analyses confirmed graphitic domains and oxygen-containing surface groups, which are critical to colloidal stability. UV-Vis spectra displayed solvent-dependent shifts in absorption edges, while photoluminescence spectra showed blue emission centered at ~490 nm, which is linked to surface states. Electron microscopy verified the presence of spherical nanoparticles with a diameter of ~20 nm and high carbon purity after sedimentation. These results demonstrate that ultrasonic treatment combined with solvent selection provides a straightforward route to photoluminescent PyC colloids with potential applications in sensors, bioimaging, and optoelectronics.
1. Introduction
Carbon and its allotropic forms, including nanostructured materials, play a key role in modern technology with applications spanning electronics, biomedicine, and materials engineering [1]. Among these, pyrolytic carbon (PyC) is a material produced by the deposition of carbon from the gas phase, typically formed during the thermal decomposition of hydrocarbons under anaerobic and high-temperature conditions [2,3]. Depending on factors such as temperature, type and concentration of the precursor, duration of the process, and type of substrate, this process can lead to carbon layers with a varied microstructure—ranging from isotropic to highly ordered laminar form [4]. Currently, many manufacturing techniques are used to obtain PyC with different properties and performance profiles. Some of these include chemical vapor deposition (CVD), which provides exceptional control over the microstructure and is used to produce composite materials and protective coatings [5]. Other methods of PyC production are: catalytic pyrolysis in fluidized beds, which enables the synthesis of carbon nanotubes (CNTs) with high structural quality; plasma pyrolysis (>2000 K), which facilitates the rapid synthesis of nanostructures with minimal processing time (<1 s); and microwave-assisted pyrolysis, which offers energy-saving solutions with significantly reduced energy consumption (0.6–2 kW) [6]. Alternative approaches, including hydrothermal carbonization (HTC) at moderate temperatures (180–250 °C), show favorable techno-economic profiles, with a payback period of 5.3 years and the ability to process biomass with high moisture content [7]. These diverse production methods highlight the versatility of PyC as a material platform, enabling the tailored synthesis of carbon structures, from bulk materials to nanostructured colloids, each suitable for specific technological applications. The availability of PyC derived from methane pyrolysis as a precursor material opens up new opportunities for the development of functional colloidal solutions, especially when combined with advanced dispersion techniques such as ultrasonic treatment, which is the subject of this study. In practice, PyC is valued for its high biocompatibility and mechanical and chemical resistance, with properties closely related to the synthesis conditions and the resulting microstructure [5,8].
In recent years, the use of methane pyrolysis to synthesize PyC has become increasingly important in the context of global decarbonization efforts [9]. This process produces high-purity hydrogen, known as “turquoise hydrogen”, and solid carbon without emitting any carbon dioxide. Thermal pyrolysis of methane, carried out at a temperature of 1200–1500 °C with a conversion efficiency of 53–96%, is an industrially mature process (TRL 7-8), enabling the simultaneous production of hydrogen, the cost of which is estimated at 1.3–2.9 USD/kg in the case of hydrogen production in large-scale installations [10,11]. Controlling process parameters such as temperature and catalyst type enables precise control of the morphology and degree of structural order of the resulting carbon [10,12,13]. The PyC produced in this way is a valuable raw material for further processing.
While PyC has traditionally been used in macroscopic form, advanced applications, such as nanocomposites, biosensors, and drug carriers, require the development of stable colloidal solutions [1]. Structurally, PyC is classified as a turbostratic carbon material characterized by an imperfect crystalline structure resembling graphite but with a disordered layer arrangement that significantly improves its mechanical properties compared to pure graphite. The basic structure of PyC consists of small crystallites of 2–40 nm in size with randomly oriented graphene layers, resulting in isotropic bulk properties [2,4]. This unique architecture provides exceptional properties that make PyC suitable for a variety of technological applications. The material is characterized by high mechanical strength, with a Young’s modulus ranging from 15 to 50 GPa, depending on deposition conditions and structural parameters [14]. Thermally, PyC exhibits exceptional stability, with an in-plane thermal conductivity approaching 2000 W/(m·K) at room temperature, exceptional thermal resistance up to 3500 °C in non-oxidizing atmospheres, and a negative temperature coefficient of electrical resistance (−0.0017 ± 0.0003 ppm/K), enabling effective thermal management in advanced applications. The electrical conductivity is anisotropic, with an in-plane resistivity of 2–4 μΩ·m, compared to a perpendicular resistivity of 2–5 × 10³ μΩ·m [14]. At the nanoscale, PyC exhibits photoluminescent properties resulting from multiple mechanisms: surface functional groups containing oxygen and nitrogen heteroatoms (hydroxyl, carboxyl, and carbonyl groups), structural defects associated with sp2/sp3 hybridization sites, and small sp2 graphitic domains (2–5 nm). Photoluminescence is excitation-dependent, with characteristic blue emission typically centered around 460–490 nm, while functional groups on the PyC surface generate additional emission components at longer wavelengths (530–576 nm) due to defect-related radiative recombination and aggregation-induced effects [15,16]. These oxygen-containing functional groups are essential for colloidal stabilization through electrostatic interactions and are easily introduced during ultrasonic or oxidative surface modification treatments.
Colloidal carbon solutions are dispersion systems in which carbon nanoparticles are uniformly dispersed in a liquid medium. Although they appear homogeneous, they are actually heterogeneous systems, as revealed by the Tyndall effect or electron microscopy [17]. The stability of these systems fundamentally depends on the balance between attractive van der Waals forces and repulsive electrostatic or steric interactions, as described by DLVO theory (Derjaguin-Landau-Verwey-Overbeek theory) [18]. The currently available methods for obtaining colloidal carbon solutions, such as hydrothermal synthesis [19] or mechanical grinding [4,20], often involve the use of toxic reagents and require multi-step processes or are difficult to scale. A significant advantage of the ultrasound method is that it is safe, energy-efficient and compliant with the principles of green chemistry [21]. Ultrasound can be used for synthesizing materials (sonochemical synthesis) [22,23] or, more commonly, for effectively breaking up agglomerates and obtaining homogeneous dispersions (sonodispersion) [24,25,26]. In their work, Sao et al. synthesized silver and tin oxide nanocomposites using the sonochemical method, which exhibited good photocatalytic properties [23]. Huang et al., on the other hand, presented an overview of carbon nanotube dispersion processes, including the sonication process mainly for solution stabilization [25].
In light of the above, the main objective of this study is to develop and evaluate an ultrasonic approach to obtaining colloidal solutions of pyrolytic carbon as a simple, rapid method for producing functional materials based on these solutions. As part of the research, dynamic light scattering was used to analyze the particle size distribution before and after sonication, and the effect of solvent polarity on this distribution was evaluated. The absorption and photoluminescence properties of the colloidal solutions obtained were characterized. Structural analysis was performed using Raman and Fourier transform infrared (FTIR) spectroscopy, while the morphology of the PyC particles was examined using scanning and transmission electron microscopy. The findings of this study will inform further research into the effective use of PyC colloidal solutions in advanced applications.
The following sections of the article provide a detailed description of the research methodology, including the procedure for synthesizing colloidal solutions and the analytical techniques employed (Section 2: Materials and Methods). The experimental results are then presented and discussed, with a particular focus on the impact of sonication parameters on colloid properties (Section 3: Results). Section 4. Discussion provides a broad discussion of the results obtained. The final conclusions summarize the main findings and suggest directions for further research.
2. Materials and Methods
2.1. Materials
All solvents used in the studies were used without prior purification. Acetonitrile (spectroscopic purity) and cyclohexane (spectroscopic purity) were obtained from Chempur (Piekary Śląskie, Poland), and anhydrous ethanol (99.8%, pure p.a.) was obtained from Avantor (Gliwice, Poland).
Colloidal Solutions of Pyrolytic Carbon (PyC)
Preparing PyC colloidal solutions involved two stages. Figure 1 shows the individual steps of the process. In the first stage, PyC was obtained through the pyrolysis of methane. This process was carried out under the conditions described in detail in our previous work [27]. A cobalt catalyst impregnated on silica was used as a carrier in the methane pyrolysis process. The process yield was 53%, with a process selectivity of 95.7%. Analysis of the PyC material revealed it to be pure carbon with an amorphous-graphitic structure. The PyC carbon material obtained after the process was then mechanically ground in an agate mortar and three samples were prepared, to which acetonitrile (ACN), ethanol (EtOH) and cyclohexane (CHX) were added in sequence. For clarity, these samples are referred to as PyC/EtOH, PyC/ACN and PyC/CHX, respectively. Distinct PyC fractions were obtained in solutions with a PyC concentration of 1 g/L. The PyC concentration employed in this study was selected based on established protocols from the literature on carbon nanoparticle dispersions [22,28,29]. Next, a fragmentation process was carried out using a Sonics VCX 500 ultrasonic homogenizer (Sonics&Materials Inc., Newtown, CT, USA). The power and frequency of the ultrasound were maintained at 500 W and 20 kHz, with no pulse duration. The ultrasound amplitude was 90% with a maximum temperature of 50°C. The process was carried out for 5 min in each case. The obtained samples were labeled as PyC/EtOH/sh, PyC/CAN/sh, and PyC/CHX/sh. The resulting suspensions were stored at room temperature and allowed to sediment. After 24 h, the solution above each sediment was collected, obtaining colloidal solutions of n-PyC: n-PyC/EtOH, n-PyC/ACN, and n-PyC/CHX.
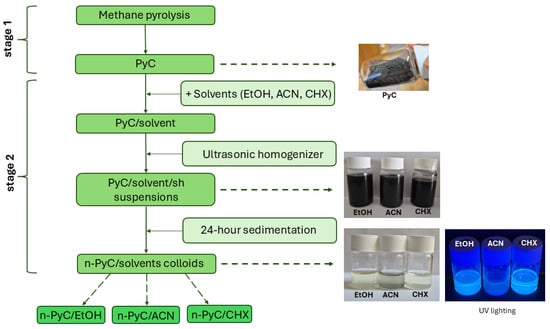
Figure 1.
Schematic diagram of PyC colloidal solution synthesis.
2.2. Characterization Methods
The colloidal solutions of pyrolytic carbon were characterized using dynamic light scattering (DLS), Raman spectroscopy, Fourier-transform infrared spectroscopy (FTIR), ultraviolet–visible spectrophotometry, scanning electron microscopy (SEM) and transmission electron microscopy (TEM).
The particle size distribution was analyzed using dynamic laser light scattering with a Zetasizer Nano ZS (Malvern Instruments, Worcestershire, UK) in disposable polystyrene (PMMA) cuvettes. The hydrodynamic diameters were calculated from the correlation functions using the Malvern Nanosizer software v3.0. Each sample was measured three times; the reported particle size distributions are representative.
The temporal stability of the n-PyC dispersions was evaluated using Dynamic Light Scattering (DLS). Measurements were performed after 1, 3, and 7 days of storage under identical environmental conditions. For each time point, the particle size distribution and key cumulant parameters were determined, including the Z-Average hydrodynamic diameter, the Polydispersity Index (PdI), and the scattering Count Rate. These parameters were used to assess potential changes in particle size, distribution uniformity, and scattering intensity, providing insight into aggregation processes or sedimentation occurring over time. The Z-Average is the cumulant-based mean hydrodynamic diameter obtained from the intensity-weighted particle size distribution. It represents the harmonic intensity-averaged size calculated from the first cumulant of the autocorrelation function. Due to its strong sensitivity to the presence of larger particles or early-stage aggregates, the Z-Average is considered the most robust and reproducible indicator of overall colloidal stability. The PdI is a dimensionless measure of the width of the particle size distribution derived from the second cumulant analysis. Values below 0.1 indicate a monodisperse system, whereas values above ~0.3 are characteristic of broad or multimodal distributions often associated with aggregation or heterogeneity. The PdI therefore reflects the uniformity of the particle population and is widely used to assess the degree of dispersion stability. Count Rate refers to the intensity of light scattered by the particles detected by the photomultiplier tube during DLS measurement, expressed in kilocounts per second (kcps). It reflects both the number of particles in suspension and their scattering efficiency, which depends on particle size and refractive index. Changes in Count Rate over time can indicate variations in particle concentration, aggregation processes, or sedimentation.
Absorption characteristics were recorded using a Lambda 900 UV/VIS/NIR spectrophotometer fitted with a PELA-1020 integrating sphere (Perkin Elmer, Inc., Shelton, CT, USA). Measurements were performed in the range of 200–800 nm. Photoluminescence measurements were recorded for colloidal PyC solutions in solvents of varying polarity, such as cyclohexane (CHX), tetrahydrofuran (THF), and acetonitrile (ACN). An Ocean Optics spectrophotometer (Ocean Optics, Orlando, FL, USA) was used for these measurements. Photoluminescence was excited using a UV light source with a wavelength of 365 nm. The measurements were performed in the UV-Vis range. Spectroscopic measurements (UV-Vis, PL) were performed once for each sample, as is standard practice for these techniques.
Raman spectroscopy, FT-IR, SEM, and TEM analyses were performed exclusively on the n-PyC/EtOH colloidal sample. The structural properties of the investigated samples were analyzed using Raman and Fourier transform infrared (FTIR) spectroscopy. Raman measurements were performed using an Almega XR spectrometer (Thermo Electron Corp., Thermo Fisher Scientific, Waltham, MA, USA) with a 532 nm excitation laser in the 100–4000 cm−1 range and with a spectral resolution of 2 cm−1. The estimated sampling depth for the 532 nm laser was about 0.7 μm. FT-IR spectra were obtained using a Thermo Nicolet iS5 infrared spectrometer (Thermo Fisher Scientific, Waltham, MA, USA) equipped with ATR accessory. Spectra were registered in the range of 4000–400 cm−1, with the resolution of 4 cm−1, in 64 scans. Spectroscopic measurements (Raman, FTIR) were performed once for each sample, as is standard practice for these techniques.
Characterization of surface morphology and elemental composition of carbon nanostructures was performed using a high-resolution scanning electron microscope (SEM) Apreo 2S LoVac (Thermo Fisher Scientific, Waltham, MA, USA), equipped with an energy-dispersive X-ray spectroscopy (EDS) system with UltraDry (Thermo Fisher Scientific, Waltham, MA, USA) and Octane Elect (EDAX Ametek GmbH, Wiesbaden, Germany) detectors. SEM analyses were carried out for samples deposited on silicon substrates after solvent evaporation.
Transmission electron microscopy (TEM) studies were carried out using a S/TEM TITAN 80–300 microscope (FEI, Eindhoven, The Netherlands) operated at an accelerating voltage of 300 kV. The microscope was equipped with an energy-dispersive X-ray spectroscopy (EDS) detector (EDAX, Mahwah, NJ, USA). Observations were performed in both scanning transmission modes: high-angle annular dark-field (HAADF) and bright-field (BF).
3. Results
3.1. DLS
The results of dynamic light scattering (DLS) measurements are presented in Figure 2. The figure illustrates the distributions of hydrodynamic particle diameters by intensity (Figure 2a,c,e) and volume (Figure 2b,d,e) in three different solvents—ACN (Figure 2a,b), EtOH (Figure 2c,d), CHX (Figure 2e,f)—at different stages of the process: initial homogenization (PyC/solvent), sonication (PyC/solvent/sh), and after 24 h of sedimentation (n-PyC/solvent).
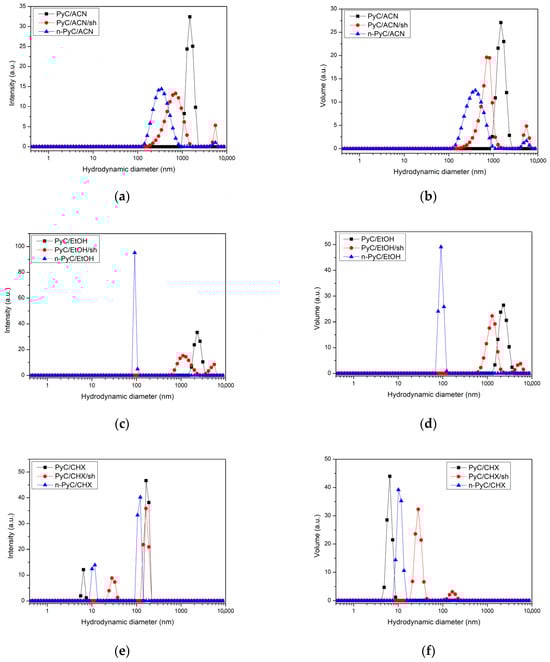
Figure 2.
Distribution of the hydrodynamic diameter of PyC particles by intensity (a,c,e) and by volume (b,d,f) in solvents of different polarity: in ACN (a,b), EtOH (c,d), and CHX (e,f).
A comparative analysis of the results in three solvents with different polarities sheds light on the mechanism of PyC colloidal stabilization. The effect of solvent polarity on the dispersion efficiency of carbon nanomaterials is well documented in the literature [30,31]. High polarity promotes interactions with functional groups on the surface of carbon nanostructures, such as carboxyl groups, which may form during the ultrasonic grinding of PyC [32]. These interactions lead to effective stabilization through electrostatic repulsion. The results obtained are consistent with these observations. In the case of polar solvents—ethanol (Figure 2c,d) and acetonitrile (Figure 2a,b)—the sonication process causes a clear shift in the particle size distribution towards smaller diameters. In the ACN solution, the maximum particle size distribution before ultrasonic disruption (PyC/ACN) appeared at a hydrodynamic diameter of 1480 nm, and after sonication (PyC/ACN/sh) was 712 nm. In EtOH solutions, however, these sizes were larger: 2300 nm (PyC/EtOH) before and 1280 nm (PyC/EtOH/sh) after the ultrasonic process, respectively. In both solvents, the use of ultrasound (red dots) intensively breaks up agglomerates compared to initial mechanical homogenization (black squares), which results from acoustic cavitation generating strong liquid micro-jet streams capable of overcoming the van der Waals forces responsible for particle agglomeration [26]. After sedimentation (blue triangles) in the ACN solution (n-PyC/ACN), the particle size distribution remains in the range of hydrodynamic diameters smaller than after sonication (PyC/ACN/sh)—approximately 342 nm. This may indicate relatively good colloidal stabilization in this solvent, related to electrostatic repulsion resulting from the presence of functional groups on the surface of PyC nanoparticles. In the EtOH solution after sedimentation (n-PyC/EtOH), the size distribution shifts towards smaller diameters (90 nm). The same size distribution in EtOH (n-PyC/EtOH) is characterized by the highest intensity compared to the distributions in the other solvents (Figure 2c). This may indicate the presence of nanoparticles with a homogeneous distribution in the solution. However, it does not mean that the EtOH solution contains the most PyC particles. This is due to the DLS method itself, which is extremely sensitive to larger particles due to their disproportionately stronger light scattering [33]. Ethanol, as a protic solvent, participates in the formation of hydrogen bonds, which constitute strong intermolecular interactions, leading to the formation of solvation layers around the PyC particles and preventing their agglomeration [34].
The analysis of the particle size distribution of PyC in a nonpolar solvent (CHX) (Figure 2e,f) showed a significantly better dispersion of the PyC material compared to the polar solvents. Before the ultrasonication process (PyC/CHX), the particles had a hydrodynamic distribution with dominant sizes of 164 and 6.5 nm. After sonication (PyC/CHX/sh), the distributions in CHX show dominant peaks in the range of similar and larger agglomerates (164 and 28.1 nm), indicating the lack of effective stabilization of the dispersion. The sedimentation process of the colloidal solution after 24 h causes a rapid increase in diameters and a decrease in the DLS signal (Figure 2e, n-PyC/CHX), signaling rapid coagulation and precipitation of the particles. This indicates the dominance of van der Waals forces in a nonpolar environment [26,31].
To assess the stability of the colloids, n-PyC was tested in three solvents (ACN, EtOH, CHX) for 7 days. The solutions were stored at room temperature. Table 1 summarizes the parameters from measurements taken on days 1, 3, and 7 of storage, used to assess potential changes in particle size, distribution uniformity, and scattering intensity.

Table 1.
Results of measurements of the tested PyC dispersions after 1, 3 and 7 days (Z-Average—the cumulant-based mean hydrodynamic diameter obtained from the intensity-weighted particle size distribution; Count Rate—the intensity of light scattered by the particles detected by the photomultiplier; Pdl—dimensionless measure of the width of the particle size distribution).
The n-PyC/ACN dispersion exhibited high stability, with only minor fluctuations in Z-Average size (163.2 nm; 163.2 nm;157.3 nm from day 1 to day 7). The PdI remained constant at approximately 0.15, indicating a relatively narrow size distribution. A gradual and moderate decrease in Count Rate (from 305.5 to 290 kcps) suggested slight dilution effects or minor changes in scattering efficiency rather than destabilization. Overall, the ACN system maintained a stable colloidal state over the entire storage period. Similarly, the n-PyC/EtOH dispersion demonstrated robust stability. The hydrodynamic diameter remained virtually unchanged (near 140 nm), and PdI values stayed consistently below 0.10, characteristic of a monodisperse population. Only a minimal decrease in Count Rate (from 423.9 kcps to 416.1 kcps) was observed, further supporting the absence of aggregation or sedimentation. Together, these parameters confirm that both ACN and EtOH serve as highly suitable solvents for long-term dispersion stability of n-PyC.
In stark contrast, the n-PyC/CHX dispersion showed progressive destabilization. A substantial increase in Z-Average was recorded (144.6 nm; 211.8 nm; 287.7 nm), indicating the formation of increasingly large aggregates. The dispersion was initially highly polydisperse (PdI = 0.479–0.516), consistent with rapid aggregation processes. During the early phase, the Count Rate rose from 257.9 to 304.2 kcps, likely due to the presence of large, strongly scattering agglomerates. By day 7, however, Count Rate decreased dramatically to 198.1 kcps, while PdI dropped to 0.299. This combination suggests that the largest aggregates underwent sedimentation, leaving behind a depleted supernatant containing a narrower but less concentrated population of particles. Figure 3 presents the hydrodynamic particle diameter distributions of the studied colloids after intensity measurements taken on days 1, 3, and 7 of storage at room temperature.
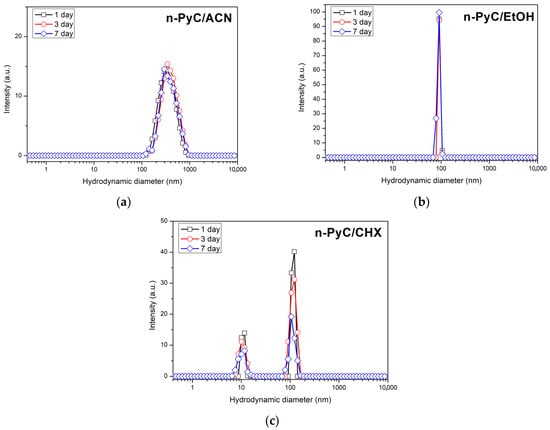
Figure 3.
Distribution of the hydrodynamic diameter of n-PyC particles by intensity in solvents of different polarity: in ACN (a), EtOH (b), and CHX (c).
No significant changes in the particle-size distributions were observed for the ACN and EtOH samples, indicating that the colloids remained stable and did not undergo measurable agglomeration throughout the observation period. In contrast, the CHX dispersion exhibited a slight broadening of the dominant particle population together with a measurable decrease in scattering intensity, which is consistent with reduced colloidal stability.
DLS analysis clearly shows that the ultrasonic dispersion process effectively breaks up PyC carbon agglomerates. However, the polarity of the solvent is the key factor determining the colloid’s long-term stability. The best results, in the form of stable dispersions with small particle diameters, were obtained using polar solvents such as ethanol and acetonitrile.
3.2. UV-Vis Spectrophotometry and Photoluminescence
Figure 4 shows the absorption characteristics of n-PyC colloidal solutions in solvents of varying polarity: acetonitrile (ACN), ethanol (EtOH), and cyclohexane (CHX). The n-PyC colloidal solution in ACN exhibits higher absorbance than those in EtOH and CHX in the measurement range of 280–800 nm. It is important to note that UV-Vis measurements of colloidal suspensions reflect both genuine absorption and light scattering effects. The higher apparent absorbance of the n-PyC/ACN dispersion compared to n-PyC/EtOH arises from stronger light scattering caused by the presence of larger particle agglomerates (342 nm vs. 90 nm hydrodynamic diameter, Figure 2). At these sizes, scattering occurs in the Mie regime, where the intensity increases strongly with particle diameter, and even moderate differences in size result in disproportionately higher optical attenuation [35]. Thus, the enhanced absorbance in ACN does not indicate a higher concentration of carbon but rather reflects superior colloidal stabilization in ethanol through hydrogen bonding interactions, as evidenced by the significantly smaller particle sizes after sedimentation. Presumably, the process of ultrasonic grinding of PyC in ACN is less effective than in EtOH, and more particles remain in suspension in the form of larger clusters, which leads to greater absorption. Presumably, the process of ultrasonic grinding of PyC in ACN is less effective than in EtOH, and more particles remain in suspension in the form of larger clusters, which leads to greater absorption.
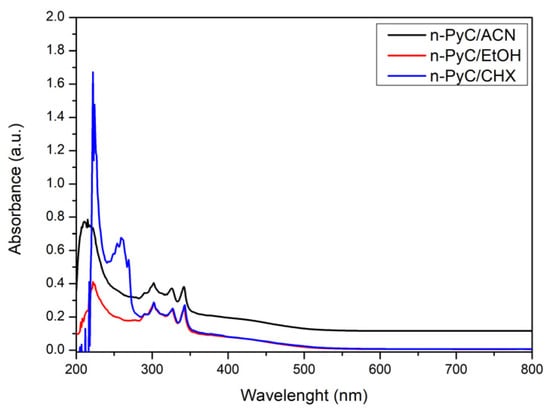
Figure 4.
Absorbance characteristics of PyC colloidal solutions in solvents of varying polarity (ACN, EtOH, CHX).
The presence of band maxima at a wavelength of 220 nm may indicate π→π* electron transitions occurring in small graphite systems with sizes of 2–5 nm. The literature indicates the presence of such domains in PyC [36,37,38]. In turn, the band at 260 nm observed in the cyclohexane solution is typical for π→π* transitions in sp2 carbon dot domains and larger aromatic systems [38,39]. The absence of a clear band in this wavelength range in polar solvents (EtOH, ACN) is presumably due to band masking by solvent absorption or dipole–dipole interactions. Subsequent bands appearing in all solutions and not exhibiting a solvatochromic effect (302, 325, and 342 nm) are presumably derived from n→π* transitions characteristic of surface functional groups containing heteroatoms and structural defects [39,40]. It should also be mentioned that the presence of multiple absorption bands for non-functionalized carbon structures is explained in the literature as heterogeneity in their size [41].
Figure 5a shows the normalized photoluminescence characteristics of n-PyC colloidal solutions in three solvents with different polarities (ACN, EtOH, and CHX). The spectra were excited with radiation at a wavelength of 365 nm. In turn, Figure 5b shows the deconvolution of the spectrum of a colloidal n-PyC solution in ethanol into four components, which confirms the complex nature of n-PyC photoluminescence. No solvatochromic effect is observed in the normalized photoluminescence spectra of colloidal solutions in solvents of different polarity (Figure 5a). Spectrum deconvolution (Lorentzian line shapes) (Figure 5b) indicates the presence of three distinct emission centers of different origins, correlated with the absorption spectrum (Figure 4). The ~460 nm component is presumably related to emission in small sp2 domains of PyC [15,16], while the ~490 nm component is related to emission from surface states in functional groups containing heteroatoms (O, N) [15,16]. The third component ~530 nm may be related to emission from defects and originate from radiative recombination in defect states associated with sp2/sp3 hybridization [15]. The low-intensity component ~576 nm may originate from aggregated emission centers, where the restriction of rotational movements of surface groups leads to effective long-wave emission [42].
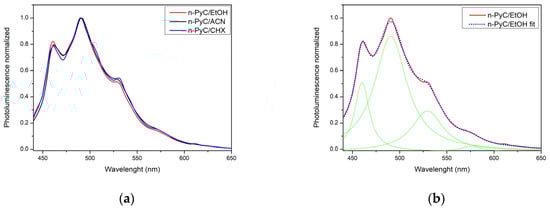
Figure 5.
Photoluminescence characteristics of n-PyC colloidal solutions in solvents of different polarity (ACN, EtOH, CHX); (a) effect of solvent polarity on the position of photoluminescence bands, (b) characteristics for n-PyC colloidal solution in ethanol with four component fitting (green lines).
3.3. Raman Spectroscopy
Raman analysis was performed for the series prepared in ethanol (sample PyC/EtOH, PyC/EtOH/sh, n-PyC/EtOH) chosen as a representative example to confirm the overall PyC structure at various stages of the process. Figure 6 presents the corresponding spectra in the range of 900–1900 cm−1. This region features the characteristic G (~1560 cm−1) and D (~1360 cm−1) bands commonly observed in carbon materials. The G band (E2g symmetry) arises from the stretching vibrations of sp2-bonded carbon atom pairs in both ring and chain configurations and indicates the existence of graphitic carbon. In contrast, the D band (A1g symmetry) is attributed to the breathing modes of sp2 carbon atoms in aromatic rings and is associated with disordered (amorphous) carbon [43]. To analyze all spectra, we employed a multi component fitting approach combining Gaussian and Lorentzian line shapes. In addition to the D and G bands, weaker features appear in two other regions, e.g., D* (~1100–1250 cm−1), attributed to disorder-induced edge and sp2–sp3 hybridization defects at network boundaries and D″ (~1500–1550 cm−1) often linked to amorphous lattice contributions or interstitial defects in less-crystalline carbon [44,45]. The presence of the D* band in the Raman spectra confirms the formation of localized structural defects, which is consistent with the PL emission components (~490 and ~530 nm) observed in Figure 5b and attributed to surface and defect-related states. The multicomponent fitting analysis for PyC/EtOH, PyC/EtOH/sh, and n-PyC/EtOH is shown in Figure 7, and the fitted peak parameters are summarized in Table 2. Figure 7 compares the spectra recorded for the ethanol-based series at different stages of the ultrasonic process.
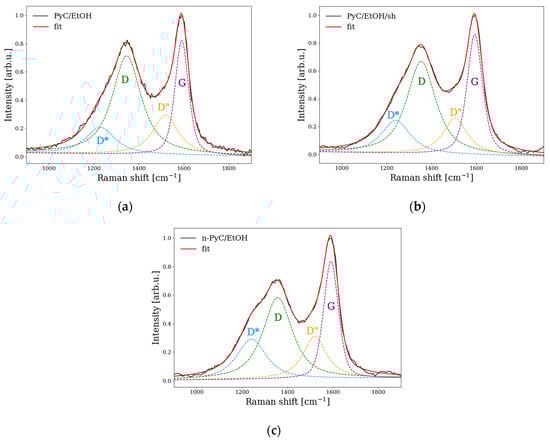
Figure 6.
Raman spectra of three carbon samples: (a) PyC/EtOH, (b) PyC/EtOH/sh, (c) n-PyC/EtOH collected over the 900–1900 cm−1 range. Each spectrum is shown with a four component fit (dashed lines).
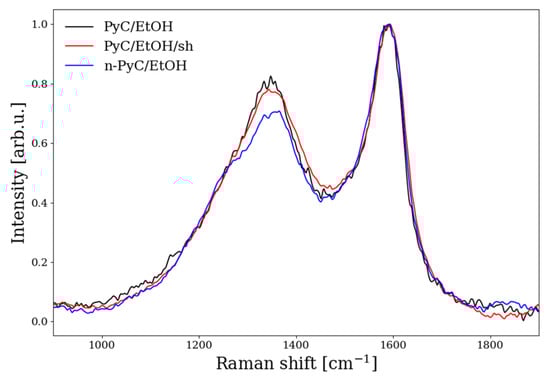
Figure 7.
Raman spectra of PyC/EtOH (black), PyC/EtOH/sh (red), and n-PyC/EtOH (blue) over 900–1900 cm−1.
Table 2.
Multipeak fitting results of Raman spectra for PyC sonicated in ethanol.
The Raman fitting results (Table 2) reveal that both the D and D* bands exhibit notable changes upon ultrasonic treatment. Specifically, both the intensity and the integrated peak area of the D* band approximately double in n-PyC/EtOH compared to untreated PyC/EtOH, indicating a strong sensitivity of this band to ultrasonic treatment. This behavior suggests that sonication introduces additional disorder, particularly at the edges of sp2 domains, consistent with previous findings that associate the D* band with disordered graphitic structures or sp2–sp3 hybridization at network edges [44,45]. In contrast, the G and D″ bands remain relatively stable across all samples, suggesting that ultrasonic treatment does not significantly affect the graphitic domain size (G band) nor does it induce substantial amorphous or interstitial-like defects typically associated with the D″ band. These results imply that the main structural impact of colloidal sonication is confined to the introduction of localized edge and bonding defects rather than broad amorphization or loss of sp2 ordering.
3.4. FT-IR Spectroscopy
Figure 8 shows the FT-IR/ATR spectroscopy spectrum for a sample of n-PyC colloid in ethanol (n-PyC/EtOH). The measurement was performed after evaporation of the solvent. The results confirm the presence of functional groups on the surface of PyC nanoparticles after ultrasonic homogenization, in contrast to the FT-IR spectrum of PyC carbon obtained directly after the methane pyrolysis process [46]. The band at 3319 cm−1 can be attributed to the stretching vibrations of hydroxyl groups (O-H). The width of this band indicates the presence of hydrogen bonds between hydroxyl groups on the surface of PyC nanoparticles and with water and ethanol molecules as solvents [16,47]. The bands at 2924 cm−1 and 2854 cm−1 correspond to the stretching vibrations of C-H bonds in aliphatic -CH2- and -CH3 groups. Their presence is associated with solvent residues [47,48]. The signals at 1737 cm−1, 1651 cm−1, and 1546 cm−1 are presumably associated with C=O vibrations in carbonyl groups in various chemical environments: in ester, carboxyl, and carbonyl groups on the surface and in the core of nanoparticles [47,49]. The band at 1651 cm−1 may also originate from bending vibrations of -OH groups of adsorbed water [47]. The bands at wavenumbers 1435, 1361, 1281, 1117, and 699 cm−1 correspond to various bending and stretching vibrations of C-O, C-C, and C-H groups. The bands in the range of 1000–1300 cm−1 are typical for stretching vibrations of C-O groups in alcohols, esters, and ethers [16,47,48]. The presence of these bands confirms the complex nature of the functionalization of the PyC carbon surface after ultrasonic homogenization in ethanol.
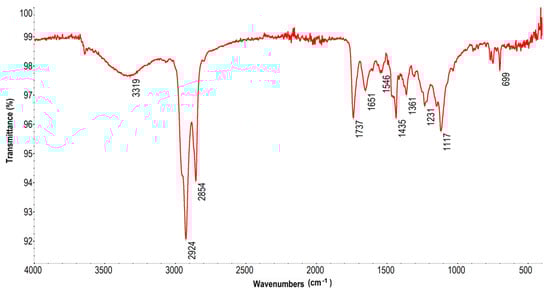
Figure 8.
FT-IR spectrum of the n-PyC/EtOH colloidal solution.
3.5. Electron Microscopy
Figure 9a shows a SEM image of a PyC/EtOH/sh sample before sedimentation. The sample was deposited onto a silicon substrate, and the solvent was allowed to evaporate. Large micrometric aggregates composed of smaller nanometric structures of various shapes are observed. Pyrolytic materials tend to form hierarchical structures in which nanoparticles spontaneously assemble into larger agglomerates due to strong van der Waals interactions [50]. EDS elemental analysis of the imaged area confirms that carbon is the main component of the PyC structures.
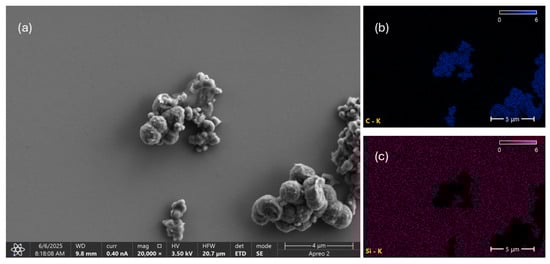
Figure 9.
SEM image (a) and elemental distribution map of carbon (b) and silicon (c) on the tested PyC/EtOH/sh sample.
Figure 10 shows SEM and TEM images of the n-PyC/EtOH sample obtained after sedimentation and decantation from the visible sediment. Figure 10a, acquired using SEM, shows smaller, dispersed structures with dimensions of several tens of nanometers. Figure 10b,c show TEM images of the tested sample, confirming the presence of nanoparticles approximately 20 nm in size in the colloidal solution. Elemental analysis performed using EDS shows that these nanoparticles consist predominantly of carbon. The results confirm the effective disaggregation of PyC carbon by ultrasonic homogenization.
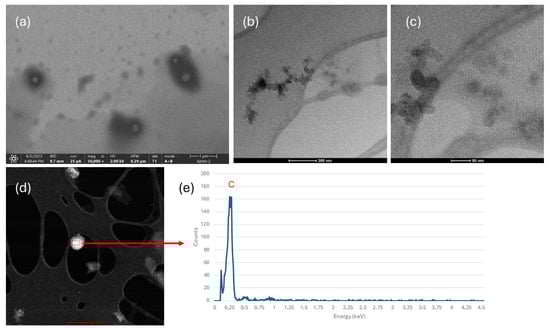
Figure 10.
SEM image (a); TEM images (b,c); EDS analysis (d,e) of the tested n-PyC/EtOH sample after sedimentation.
4. Discussion
Our results demonstrate solvent-dependent colloidal behaviors of ultrasonicated PyC. To better understand these observations, we briefly summarize the relevant aspects of bubble dynamics. The effects of ultrasound arise from acoustic cavitation, a phenomenon in which gas or vapor bubbles form, grow, and collapse in a liquid exposed to an acoustic field. As the ultrasound wave propagates, alternating cycles of compression and rarefaction cause the bubbles to expand and contract. Under suitable conditions, a bubble can undergo a rapid, nearly adiabatic collapse, generating extreme local temperatures and pressures. This process converts the mechanical energy of the acoustic field into thermal energy within the bubble, thereby driving ultrasound-induced chemical reactions [51].
The dynamics of this process are described by the Rayleigh–Plesset (RP) equation, which models the time-dependent evolution of the bubble radius [52]. The equation of motion for a cavitating bubble, derived from the conservation of energy, can be written as follows (1).
where is instantaneous bubble radius [m], is radial acceleration of the bubble wall [m/s2], is radial velocity of the bubble wall [m/s], is liquid density [kg/m3], is the hydrostatic pressure at the bubble wall [Pa], σ is surface tension [N/m], is initial (equilibrium) bubble radius [m], is polytropic exponent, μ is dynamic viscosity of the liquid [Pa·s], is vapor pressure inside the bubble [Pa], is amplitude of the acoustic pressure [N/m2], ω = 2πf is angular frequency of the ultrasound field [Hz].
The Rayleigh–Plesset equation shows the essential features of cavitation dynamics, including the influence of liquid density, viscosity, surface tension, and vapor pressure. However, it is a stiff, nonlinear equation whose solutions are highly sensitive to parameter values, requiring numerical integration to resolve the rapid collapse phase. Here, the equation was solved using a high-accuracy implicit integrator (Radau method implemented in Python 3.13/SciPy), which accurately reproduces the qualitative features of bubble motion. Figure 11 shows the representative numerical solution for ethanol, to qualitatively illustrate a typical oscillation profile of an acoustically driven bubble: gradual expansion during the rarefaction phase followed by a rapid collapse.
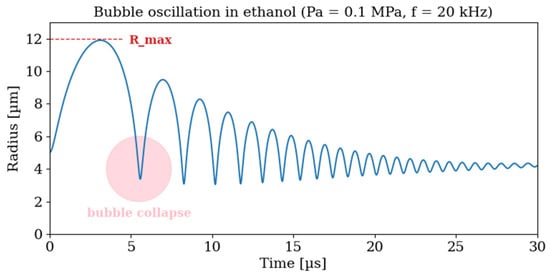
Figure 11.
Numerical solution of the Rayleigh–Plesset equation for ethanol at 25 °C. The assumed acoustic wave parameters are Pa = 0.1 MPa, f = 20 kHz.
The cavitation behavior is strongly governed by the physicochemical properties of the liquid, i.e., density, viscosity, surface tension, and vapor pressure. These parameters control the achievable bubble size (R_max, Figure 11) and the intensity of the pressure field generated during oscillation. Mechanically, violent bubble collapses give rise to shock waves and microjets capable of fragmenting particle agglomerates. At the same time, the collapse promotes the formation of reactive radicals, thereby initiating chemical reactions.
The three solvents used in this study exhibit substantial differences in their physicochemical properties. Ethanol, characterized by low viscosity (1.2 mPa·s), moderate surface tension (22.3 mN/m) and relatively low vapor pressure (5.95 kPa), supports efficient bubble oscillation and repeated collapses with limited vapor damping. Under these conditions, the collapse generates a substantial yield of reactive species, predominantly •OH and •H, which enhance particle solvation and suppress agglomeration. As a result, mechanical fragmentation combined with radical-mediated stabilization leads to a narrow size distribution of about 90 nm observed experimentally [53]. Acetonitrile combines very low viscosity (0.35 mPa·s) with higher surface tension (29 mN/m) and vapor pressure (9.7 kPa), leading to larger bubble expansions but more pronounced vapor damping during collapse. Mainly •CN, •CH2CN, and •H radicals are formed but at lower yields and with weaker oxidizing character than •OH, making them less effective in stabilizing particle surfaces. As a result, mechanical fragmentation occurs, yet the reduced efficiency of radical-driven surface stabilization leads to a broader distribution of particle sizes [53]. Cyclohexane is a nonpolar solvent with relatively high vapor pressure (13.2 kPa), which results in cavitation bubbles that are strongly damped during collapse. Moreover, mainly relatively inert alkyl radicals (•C6H11) are formed, that exhibit low chemical reactivity toward oxidation. Consequently, the radicals formed are insufficient to effectively functionalize or stabilize particle surfaces, limiting chemical stabilization and the colloidal particles remain largely unaltered under cavitation in cyclohexane [53]. Based on the physicochemical phenomena discussed above the high yield of •OH radical is expected in ethanol. This prediction is consistent with the FT-IR results, where strong hydroxyl and carbonyl stretches are observed (Figure 8), as well as with the DLS measurements showing the formation of stable ~90 nm colloids (Figure 2). In contrast, the predominant formation of neutral alkyl radicals expected in cyclohexane explains the rapid aggregation observed experimentally. Thus, sonication-induced surface functionalization of PyC is a direct consequence of the dynamics of cavitation bubble collapse and the chemical reactivity of solvent-derived radicals.
Analysis of the differences in particle size and colloidal stability between the three solvents (Figure 2) reveals the fundamental role of the stabilization mechanisms governed by the DLVO theory [18]. In DLVO theory, colloidal stability is determined by the balance between attractive van der Waals forces (always present) and repulsive electrostatic or steric forces. The presence of oxygen-containing functional groups on the PyC surface—confirmed by FT-IR (Figure 8)—creates electrostatic repulsion in polar media through ionizable carboxyl groups. In ethanol, a protic solvent, hydrogen bonding between surface functional groups and solvent molecules forms stabilizing solvation layers, providing additional steric protection. The superior stability observed in ethanol (90 nm after sedimentation) compared to acetonitrile (342 nm) reflects this dual stabilization mechanism. Additionally, sonochemical cavitation in ethanol yields highly reactive •OH radicals, which promote oxidative functionalization and enhance colloidal stability and blue photoluminescence. In contrast, acetonitrile as a polar aprotic solvent lacks hydrogen-bonding ability, and cavitation generates less reactive radicals (e.g., •CN, •CH2CN), resulting in weaker stabilization and broader particle size distributions. Cyclohexane, being nonpolar and unable to form stabilizing solvation layers, primarily produces inert alkyl radicals during sonication. Consequently, chemical functionalization is minimal, leading to rapid particle aggregation and poor colloidal stability. This molecular perspective reveals that the interplay between solvent physical parameters and the chemistry of cavitation-induced radicals dictates both the structural evolution of PyC particles and the properties of the resulting colloids. This is reflected in both spectroscopic and light scattering results.
Importantly, the normalized photoluminescence spectra (Figure 5) demonstrate a lack of pronounced solvatochromic effects in solvents of widely varying polarities—all samples exhibit consistent blue emission (~490 nm) with identical multicomponent structures (460, 490, 530, 576 nm). This solvent-independent photoluminescence indicates that the surface chemistry and structure remain qualitatively similar in different solvent environments, despite drastic differences in aggregation behavior. This represents a significant difference compared to many carbon quantum dot systems, where solvent-dependent PL shifts often negatively impact spectroscopic reliability and reproducibility. This solvent independence observed in PyC colloids suggests that surface functionalization and structural order remain stable in different chemical environments.
5. Conclusions
This study successfully demonstrated a simple ultrasonic homogenization approach for producing photoluminescent pyrolytic carbon colloids from industrial methane pyrolysis waste. The work established that solvent polarity is the critical factor determining both mechanical fragmentation effectiveness and long-term colloidal stability.
Polar protic solvents (ethanol) produce the most effective dispersion, yielding stable colloids with ~90 nm hydrodynamic diameter and narrow size distributions. This superior stability arises from dual stabilization mechanisms: hydrogen bonding between surface functional groups and solvent molecules creates robust solvation layers, while sonochemical cavitation generates high yields of reactive •OH and •H radicals that oxidatively functionalize the PyC surface. Rayleigh–Plesset equation modeling confirms that solvent viscosity, surface tension, and vapor pressure directly control cavitation bubble dynamics and radical formation efficiency. Acetonitrile produces broader particle size distributions (~342 nm) due to lower radical reactivity, while cyclohexane fails to stabilize particles, leading to rapid aggregation.
Structural characterization using Raman spectroscopy revealed the coexistence of sp2 graphitic domains and sp3 defects, indicating a disordered carbon structure typical of pyrolytic materials. FT-IR analysis confirmed the presence of oxygen-containing functional groups, including hydroxyl, carbonyl, and carboxyl groups, which contribute to colloidal stability through electrostatic and steric stabilization mechanisms.
The optical properties of PyC colloids showed solvent dependence, with UV-Vis absorption edges shifting towards blue in polar solvents. The multifaceted photoluminescence profile (four emission components at 460, 490, 530, and 576 nm) reflects the complex PyC nanostructure. Notably, the absence of solvatochromic effects across solvents indicates that surface chemistry remains qualitatively similar regardless of solvent—a significant advantage for spectroscopic reproducibility in practical applications.
Microscopic analysis using SEM and TEM, combined with EDS elemental mapping, confirmed formation of spherical high-purity carbon nanoparticles (~20 nm diameter).
The simple methodology for converting industrial PyC waste into functional photoluminescent colloids demonstrates a potential route for value-added utilization of this material. While the observed optical and colloidal properties of PyC colloids suggest potential competitiveness with synthetically produced carbon quantum dots, comprehensive comparative evaluation including photostability, quantum yield measurements, and functional testing in biosensing applications would be necessary to establish the full scope of PyC applicability in practical technologies.
Author Contributions
Conceptualization, K.W. and K.S.; methodology, K.W., K.S., M.W., P.D. and K.M.; software, K.W., K.S., K.M. and M.M.-N.; validation, K.W., K.S. and M.W.; formal analysis, K.S. and M.M.-N.; investigation, K.W., K.S. and M.W.; resources, K.M.; data curation, P.D. and K.M.; writing—original draft preparation, K.W. and K.S.; writing—review and editing, K.W., K.S. and M.W.; visualization, K.W. and K.S.; supervision, K.W.; project administration, K.W.; funding acquisition, K.W. and M.W. All authors have read and agreed to the published version of the manuscript.
Funding
This research was funded in part by National Science Centre, Poland, Grant number: 2023/07/X/ST5/00214 and 2025/09/X/ST5/00196. For the purpose of Open Access, the author has applied a CC-BY public copyright license to any Author Accepted Manuscript (AAM) version arising from this submission.
Informed Consent Statement
Not applicable.
Data Availability Statement
The original contributions presented in this study are included in the article Further inquiries can be directed to the corresponding author.
Conflicts of Interest
The authors declare no conflicts of interest.
References
- Speranza, G. Carbon Nanomaterials: Synthesis, Functionalization and Sensing Applications. Nanomaterials 2021, 11, 967. [Google Scholar] [CrossRef]
- Fitzer, E.; Köchling, K.H.; Boehm, H.P.; Marsh, H. Recommended terminology for the description of carbon as a solid. Pure Appl. Chem. 1995, 67, 473–506. [Google Scholar] [CrossRef]
- Devi, M.; Rawat, S. A comprehensive review of the pyrolysis process: From carbon nanomaterial synthesis to waste treatment. Oxf. Open Mater. Sci. 2020, 1, itab014. [Google Scholar] [CrossRef]
- Kwiecińska, B.K.; Pusz, S. Pyrolytic carbon—Definition, classification and occurrence. Int. J. Coal Geol. 2016, 163, 1–7. [Google Scholar] [CrossRef]
- Li, T.; Zhang, Y.; Fu, Y.; Sun, J.; Li, J. Siliconization elimination for SiC coated C/C composites by a pyrolytic carbon coating and the consequent improvement of the mechanical property and oxidation resistances. J. Eur. Ceram. Soc. 2021, 41, 5046–5055. [Google Scholar] [CrossRef]
- Holler, J.; Vine, D. Methane Pyrolysis for Hydrogen Production; The Royal Society of Chemistry: London, UK, 2025. [Google Scholar]
- Lucian, M.; Fiori, L. Hydrothermal carbonization of waste biomass: Process design, modeling, energy efficiency and cost analysis. Energies 2017, 10, 211. [Google Scholar] [CrossRef]
- Xiao, C.; Zhao, F.; Yang, X.; Zhao, Y.; Song, Q.; Shen, Q. Simultaneous Enhancement of Mechanical and Tribological Properties of Isotropic Pyrolytic Carbon by Graded Retention Chemical Vapor Deposition Method. SSRN 2024. [Google Scholar] [CrossRef]
- Markowski, J.; Wojtasik, M. Piroliza metanu na tle wybranych metod otrzymywania wodoru Methane pyrolysis against the background of selected hydrogen production methods. Nafta-Gaz 2023, 79, 428–435. [Google Scholar] [CrossRef]
- Wojtasik, M.; Burnus, Z.; Markowski, J.; Żak, G.; Lubowicz, J. Piroliza metanu-wpływ wybranych parametrów na przebieg procesu Methane pyrolysis-influence of selected parameters on the course of the process. Nafta-Gaz 2023, 79, 484–489. [Google Scholar] [CrossRef]
- Alghfeli, A.; Xu, H.; Heronimus, B.T.; Jeevaretanam, B.; Spearrin, R.M.; Fisher, T.S. Methane pyrolysis by Joule heating for graphitic carbon and hydrogen production. iScience 2025, 28, 113546. [Google Scholar] [CrossRef]
- Xi, K.; Li, J.; Guo, M.; Hu, B.; Li, K. Characteristics of chemical vapour deposition in micro pore structure in char layer of polymer composites. Polym. Degrad. Stab. 2020, 178, 109222. [Google Scholar] [CrossRef]
- Li, K.; Zou, Y.; Bourbigot, S.; Ji, J.; Chen, X. Pressure effects on morphology of isotropic char layer, shrinkage, cracking and reduced heat transfer of wooden material. Proc. Combust. Inst. 2021, 38, 5063–5071. [Google Scholar] [CrossRef]
- Nguyen, L.Q.; Larsen, P.E.; Larsen, T.; Goswami, S.B.; Villanueva, L.G.; Boisen, A.; Keller, S.S. Pyrolytic carbon resonators for micromechanical thermal analysis. Microsyst. Nanoeng. 2019, 5, 58. [Google Scholar] [CrossRef]
- Zhang, B.; Wang, B.; Ushakova, E.V.; He, B.; Xing, G.; Tang, Z.; Rogach, A.L.; Qu, S. Assignment of Core and Surface States in Multicolor-Emissive Carbon Dots. Small 2023, 19, 2204158. [Google Scholar] [CrossRef]
- Balanta, M.; Filho, W.d.S.; Souza, M.; de Assunção, R.; Champi, A.; Cuevas, R. Deconvolution of photoluminescence spectra and electronic transition in carbon dots nanoparticles from microcrystalline cellulose. J. Lumin. 2023, 255, 119607. [Google Scholar] [CrossRef]
- Yan, J.; Manelski, R.; Vasilas, B.; Jin, Y. Mobile colloidal organic carbon: An underestimated carbon pool in global carbon cycles? Front. Environ. Sci. 2018, 6, 405429. [Google Scholar] [CrossRef]
- Muneer, R.; Hashmet, M.R.; Pourafshary, P. Fine Migration Control in Sandstones: Surface Force Analysis and Application of DLVO Theory. ACS Omega 2020, 5, 31624–31639. [Google Scholar] [CrossRef]
- Balda, M.; Mackenzie, K.; Woszidlo, S.; Uhlig, H.; Möllmer, J.; Kopinke, F.-D.; Schüürmann, G.; Georgi, A. Bottom-Up Synthesis of De-Functionalized and Dispersible Carbon Spheres as Colloidal Adsorbent. Int. J. Mol. Sci. 2023, 24, 3831. [Google Scholar] [CrossRef]
- Mathur, J. 3. Preparation and Purification of Colloids. Available online: https://www.kdpublications.in (accessed on 30 June 2025).
- Skrabalak, S.E. Ultrasound-assisted synthesis of carbon materials. Phys. Chem. Chem. Phys. 2009, 11, 4930–4942. [Google Scholar] [CrossRef]
- Li, Z.; Dong, J.; Zhang, H.; Zhang, Y.; Wang, H.; Cui, X.; Wang, Z. Sonochemical catalysis as a unique strategy for the fabrication of nano-/micro-structured inorganics. Nanoscale Adv. 2021, 3, 41–72. [Google Scholar] [CrossRef] [PubMed]
- Sao, D.; Mandal, R.; Mahato, S.; Das, P.S.; Roy, G.; Panda, B.; Dhak, D.; Kuiri, P.K.; Mukherjee, B.; Nath, R. Sonochemically synthesized integrated silver-tin oxide nanostructure for enhanced photocatalytic applications. Phys. B Condens. Matter 2025, 715, 417548. [Google Scholar] [CrossRef]
- Lucas, A.; Zakri, C.; Maugey, M.; Pasquali, M.; Van Der Schoot, P.; Poulin, P. Kinetics of nanotube and microfiber scission under sonication. J. Phys. Chem. C 2009, 113, 20599–20605. [Google Scholar] [CrossRef]
- Huang, Y.Y.; Terentjev, E.M. Dispersion of Carbon Nanotubes: Mixing, Sonication, Stabilization, and Composite Properties. Polymers 2012, 4, 275–295. [Google Scholar] [CrossRef]
- Mahbubul, I.M.; Chong, T.H.; Khaleduzzaman, S.S.; Shahrul, I.M.; Saidur, R.; Long, B.D.; Amalina, M.A. Effect of ultrasonication duration on colloidal structure and viscosity of alumina-water nanofluid. Ind. Eng. Chem. Res. 2014, 53, 6677–6684. [Google Scholar] [CrossRef]
- Wojtasik, K.; Wojtasik, M.; Suchanek, K.; Zięba, M.; Karasiński, P.; Pakieła, W.; Żak, G.; Krasodomski, W. Effect of pyrolytic carbon addition on the structural and optical properties of TiO2 composite thin films. Sci. Rep. 2025, 15, 8078. [Google Scholar] [CrossRef] [PubMed]
- Enríquez-Sánchez, N.; Vilchis-Nestor, A.R.; Camacho-López, S.; Camacho-López, M.A.; Camacho-López, M. Photoluminescent carbon colloids prepared by laser fragmentation of carbon from waste coffee grounds. Superf. Vacío 2024, 37, 240901. [Google Scholar] [CrossRef]
- Manzetti, S.; Gabriel, J.-C.P. Methods for dispersing carbon nanotubes for nanotechnology applications: Liquid nanocrystals, suspensions, polyelectrolytes, colloids and organization control. Int. Nano Lett. 2018, 9, 31–49. [Google Scholar] [CrossRef]
- Shen, L.; Pang, S.; Zhong, M.; Sun, Y.; Qayum, A.; Liu, Y.; Rashid, A.; Xu, B.; Liang, Q.; Ma, H.; et al. A comprehensive review of ultrasonic assisted extraction (UAE) for bioactive components: Principles, advantages, equipment, and combined technologies. Ultrason. Sonochemistry 2023, 101, 106646. [Google Scholar] [CrossRef]
- Rajendran, D.; Ramalingame, R.; Adiraju, A.; Nouri, H.; Kanoun, O. Role of Solvent Polarity on Dispersion Quality and Stability of Functionalized Carbon Nanotubes. J. Compos. Sci. 2022, 6, 26. [Google Scholar] [CrossRef]
- Pustahija, L.; Kern, W. Surface Functionalization of (Pyrolytic) Carbon—An Overview. C 2023, 9, 38. [Google Scholar] [CrossRef]
- Stetefeld, J.; McKenna, S.A.; Patel, T.R. Dynamic light scattering: A practical guide and applications in biomedical sciences. Biophys. Rev. 2016, 8, 409–427. [Google Scholar] [CrossRef] [PubMed]
- Leekumjorn, S.; Gullapalli, S.; Wong, M.S. Understanding the solvent polarity effects on surfactant-capped nanoparticles. J. Phys. Chem. B 2012, 116, 13063–13070. [Google Scholar] [CrossRef]
- Aden, A.L.; Kerker, M. Scattering of Electromagnetic Waves from Two Concentric Spheres. J. Appl. Phys. 1951, 22, 1242–1246. [Google Scholar] [CrossRef]
- Wang, Y.; Hurley, D.H.; Luther, E.P.; Beaux, M.F.; Vodnik, D.R.; Peterson, R.J.; Bennett, B.L.; Usov, I.O.; Yuan, P.; Wang, X.; et al. Characterization of ultralow thermal conductivity in anisotropic pyrolytic carbon coating for thermal management applications. Carbon 2018, 129, 476–485. [Google Scholar] [CrossRef]
- Liang, M.; Ren, Y.; Cui, J.; Zhang, X.; Xing, S.; Lei, J.; He, M.; Xie, H.; Deng, L.; Yu, F.; et al. Order-in-disordered ultrathin carbon nanostructure with nitrogen-rich defects bridged by pseudographitic domains for high-performance ion capture. Nat. Commun. 2024, 15, 6437. [Google Scholar] [CrossRef]
- Kleimeier, N.F.; Liu, Y.; Turner, A.M.; Young, L.A.; Chin, C.-H.; Yang, T.; He, X.; Lo, J.-I.; Cheng, B.-M.; Kaiser, R.I. Excited state photochemically driven surface formation of benzene from acetylene ices on Pluto and in the outer solar system. Phys. Chem. Chem. Phys. 2021, 24, 1424–1436. [Google Scholar] [CrossRef]
- Elugoke, S.E.; Uwaya, G.E.; Quadri, T.W.; Ebenso, E.E. Carbon Quantum Dots: Basics, Properties, and Fundamentals. ACS Symp. Ser. 2024, 1465, 3–42. [Google Scholar] [CrossRef]
- Mousa, M.A.; Abdelrahman, H.H.; Fahmy, M.A.; Ebrahim, D.G.; Moustafa, A.H.E. Pure and doped carbon quantum dots as fluorescent probes for the detection of phenol compounds and antibiotics in aquariums. Sci. Rep. 2023, 13, 12863. [Google Scholar] [CrossRef]
- Kumar, P.; Bohidar, H.B. Observation of fluorescence from non-functionalized carbon nanoparticles and its solvent dependent spectroscopy. J. Lumin. 2013, 141, 155–161. [Google Scholar] [CrossRef]
- Liu, Z.X.; Wu, Z.L.; Gao, M.X.; Liu, H.; Huang, C.Z. Carbon dots with aggregation induced emission enhancement for visual permittivity detection. Chem. Commun. 2016, 52, 2063–2066. [Google Scholar] [CrossRef]
- Ferrari, A.C.; Robertson, J. Raman spectroscopy of amorphous, nanostructured, diamond–like carbon, and nanodiamond. Philos. Trans. R. Soc. Lond. Ser. A Math. Phys. Eng. Sci. 2004, 362, 2477–2512. [Google Scholar] [CrossRef]
- Claramunt, S.; Varea, A.; López-Díaz, D.; Velázquez, M.M.; Cornet, A.; Cirera, A. The importance of interbands on the interpretation of the raman spectrum of graphene oxide. J. Phys. Chem. C 2015, 119, 10123–10129. [Google Scholar] [CrossRef]
- Vollebregt, S.; Ishihara, R.; Tichelaar, F.D.; Hou, Y.; Beenakker, C.I.M. Influence of the growth temperature on the first and second-order Raman band ratios and widths of carbon nanotubes and fibers. Carbon 2012, 50, 3542–3554. [Google Scholar] [CrossRef]
- Wojtasik, M.; Krasodomski, W.; Żak, G.; Wojtasik, K.; Pakieła, W. Morphological and Structural Analysis of Pyrolytic Carbon from Simple Thermal Methane Pyrolysis. Appl. Sci. 2025, 15, 10742. [Google Scholar] [CrossRef]
- Ren, J.; Weber, F.; Weigert, F.; Wang, Y.; Choudhury, S.; Xiao, J.; Lauermann, I.; Resch-Genger, U.; Bande, A.; Petit, T. Influence of surface chemistry on optical, chemical and electronic properties of blue luminescent carbon dots. Nanoscale 2019, 11, 2056–2064. [Google Scholar] [CrossRef]
- Mohammed, S.J.; Omer, K.M.; Hawaiz, F.E. Deep insights to explain the mechanism of carbon dot formation at various reaction times using the hydrothermal technique: FT-IR, 13C-NMR, 1H-NMR, and UV-visible spectroscopic approaches. RSC Adv. 2023, 13, 14340–14349. [Google Scholar] [CrossRef]
- Jalilov, A.S. Solvent Effect on Structural Elucidation of Photoluminescent Graphitic Carbon Nanodots. ACS Omega 2020, 5, 20409–20416. [Google Scholar] [CrossRef]
- González-González, R.B.; González, L.T.; Madou, M.; Leyva-Porras, C.; Martinez-Chapa, S.O.; Mendoza, A. Synthesis, Purification, and Characterization of Carbon Dots from Non-Activated and Activated Pyrolytic Carbon Black. Nanomaterials 2022, 12, 298. [Google Scholar] [CrossRef]
- Suslick, K.S.; Eddingsaas, N.C.; Flannigan, D.J.; Hopkins, S.D.; Xu, H. The Chemical History of a Bubble. Acc. Chem. Res. 2018, 51, 2169–2178. [Google Scholar] [CrossRef]
- Hao, X.; Suo, H.; Peng, H.; Xu, P.; Gao, X.; Du, S. Simulation and exploration of cavitation process during microalgae oil extracting with ultrasonic-assisted for hydrogen production. Int. J. Hydrog. Energy 2021, 46, 2890–2898. [Google Scholar] [CrossRef]
- Nanzai, B.; Mochizuki, A.; Wakikawa, Y.; Masuda, Y.; Oshio, T.; Yagishita, K. Sonoluminescence intensity and ultrasonic cavitation temperature in organic solvents: Effects of generated radicals. Ultrason Sonochem 2023, 95, 106357. [Google Scholar] [CrossRef] [PubMed]
Disclaimer/Publisher’s Note: The statements, opinions and data contained in all publications are solely those of the individual author(s) and contributor(s) and not of MDPI and/or the editor(s). MDPI and/or the editor(s) disclaim responsibility for any injury to people or property resulting from any ideas, methods, instructions or products referred to in the content. |
© 2025 by the authors. Licensee MDPI, Basel, Switzerland. This article is an open access article distributed under the terms and conditions of the Creative Commons Attribution (CC BY) license (https://creativecommons.org/licenses/by/4.0/).