A Phase Map for Vertical Upflow of Slightly Cohesive Geldart A Powders Focused on High Solids Mass Flux
Featured Application
Abstract
1. Introduction
1.1. Pertinent Summary of the Recent Work
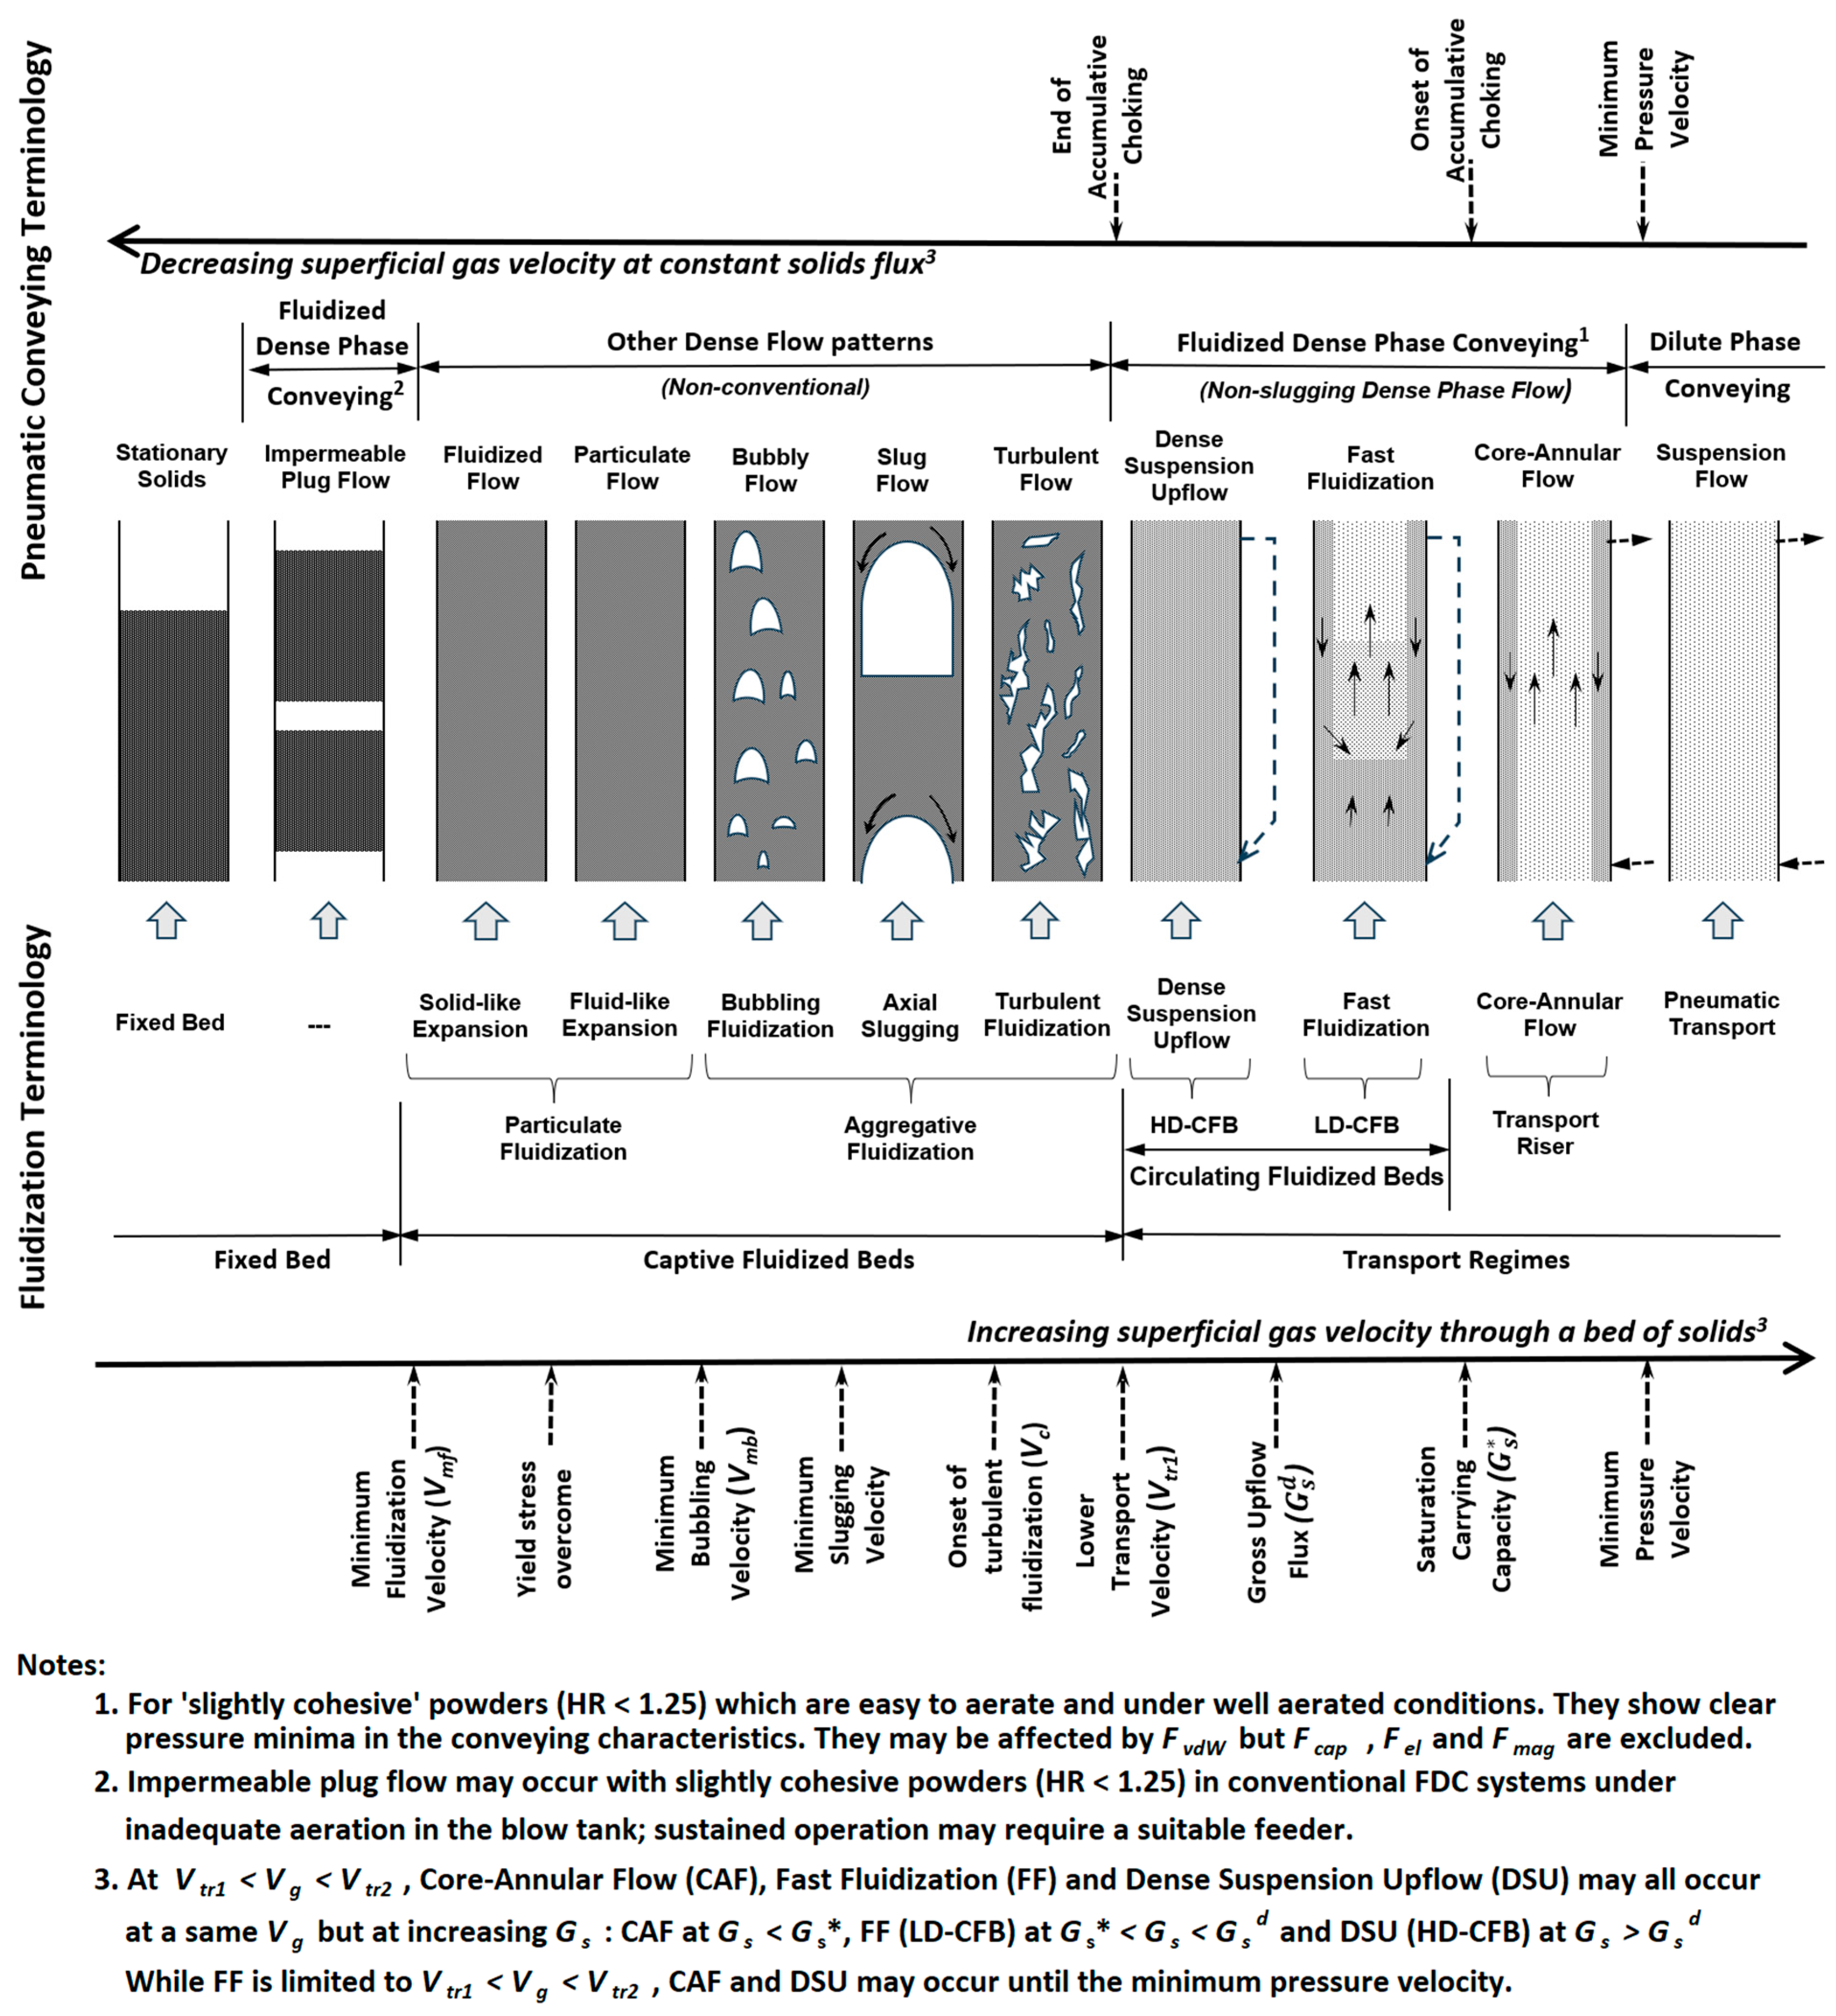
1.1.1. Fluidized Dense Phase Conveying
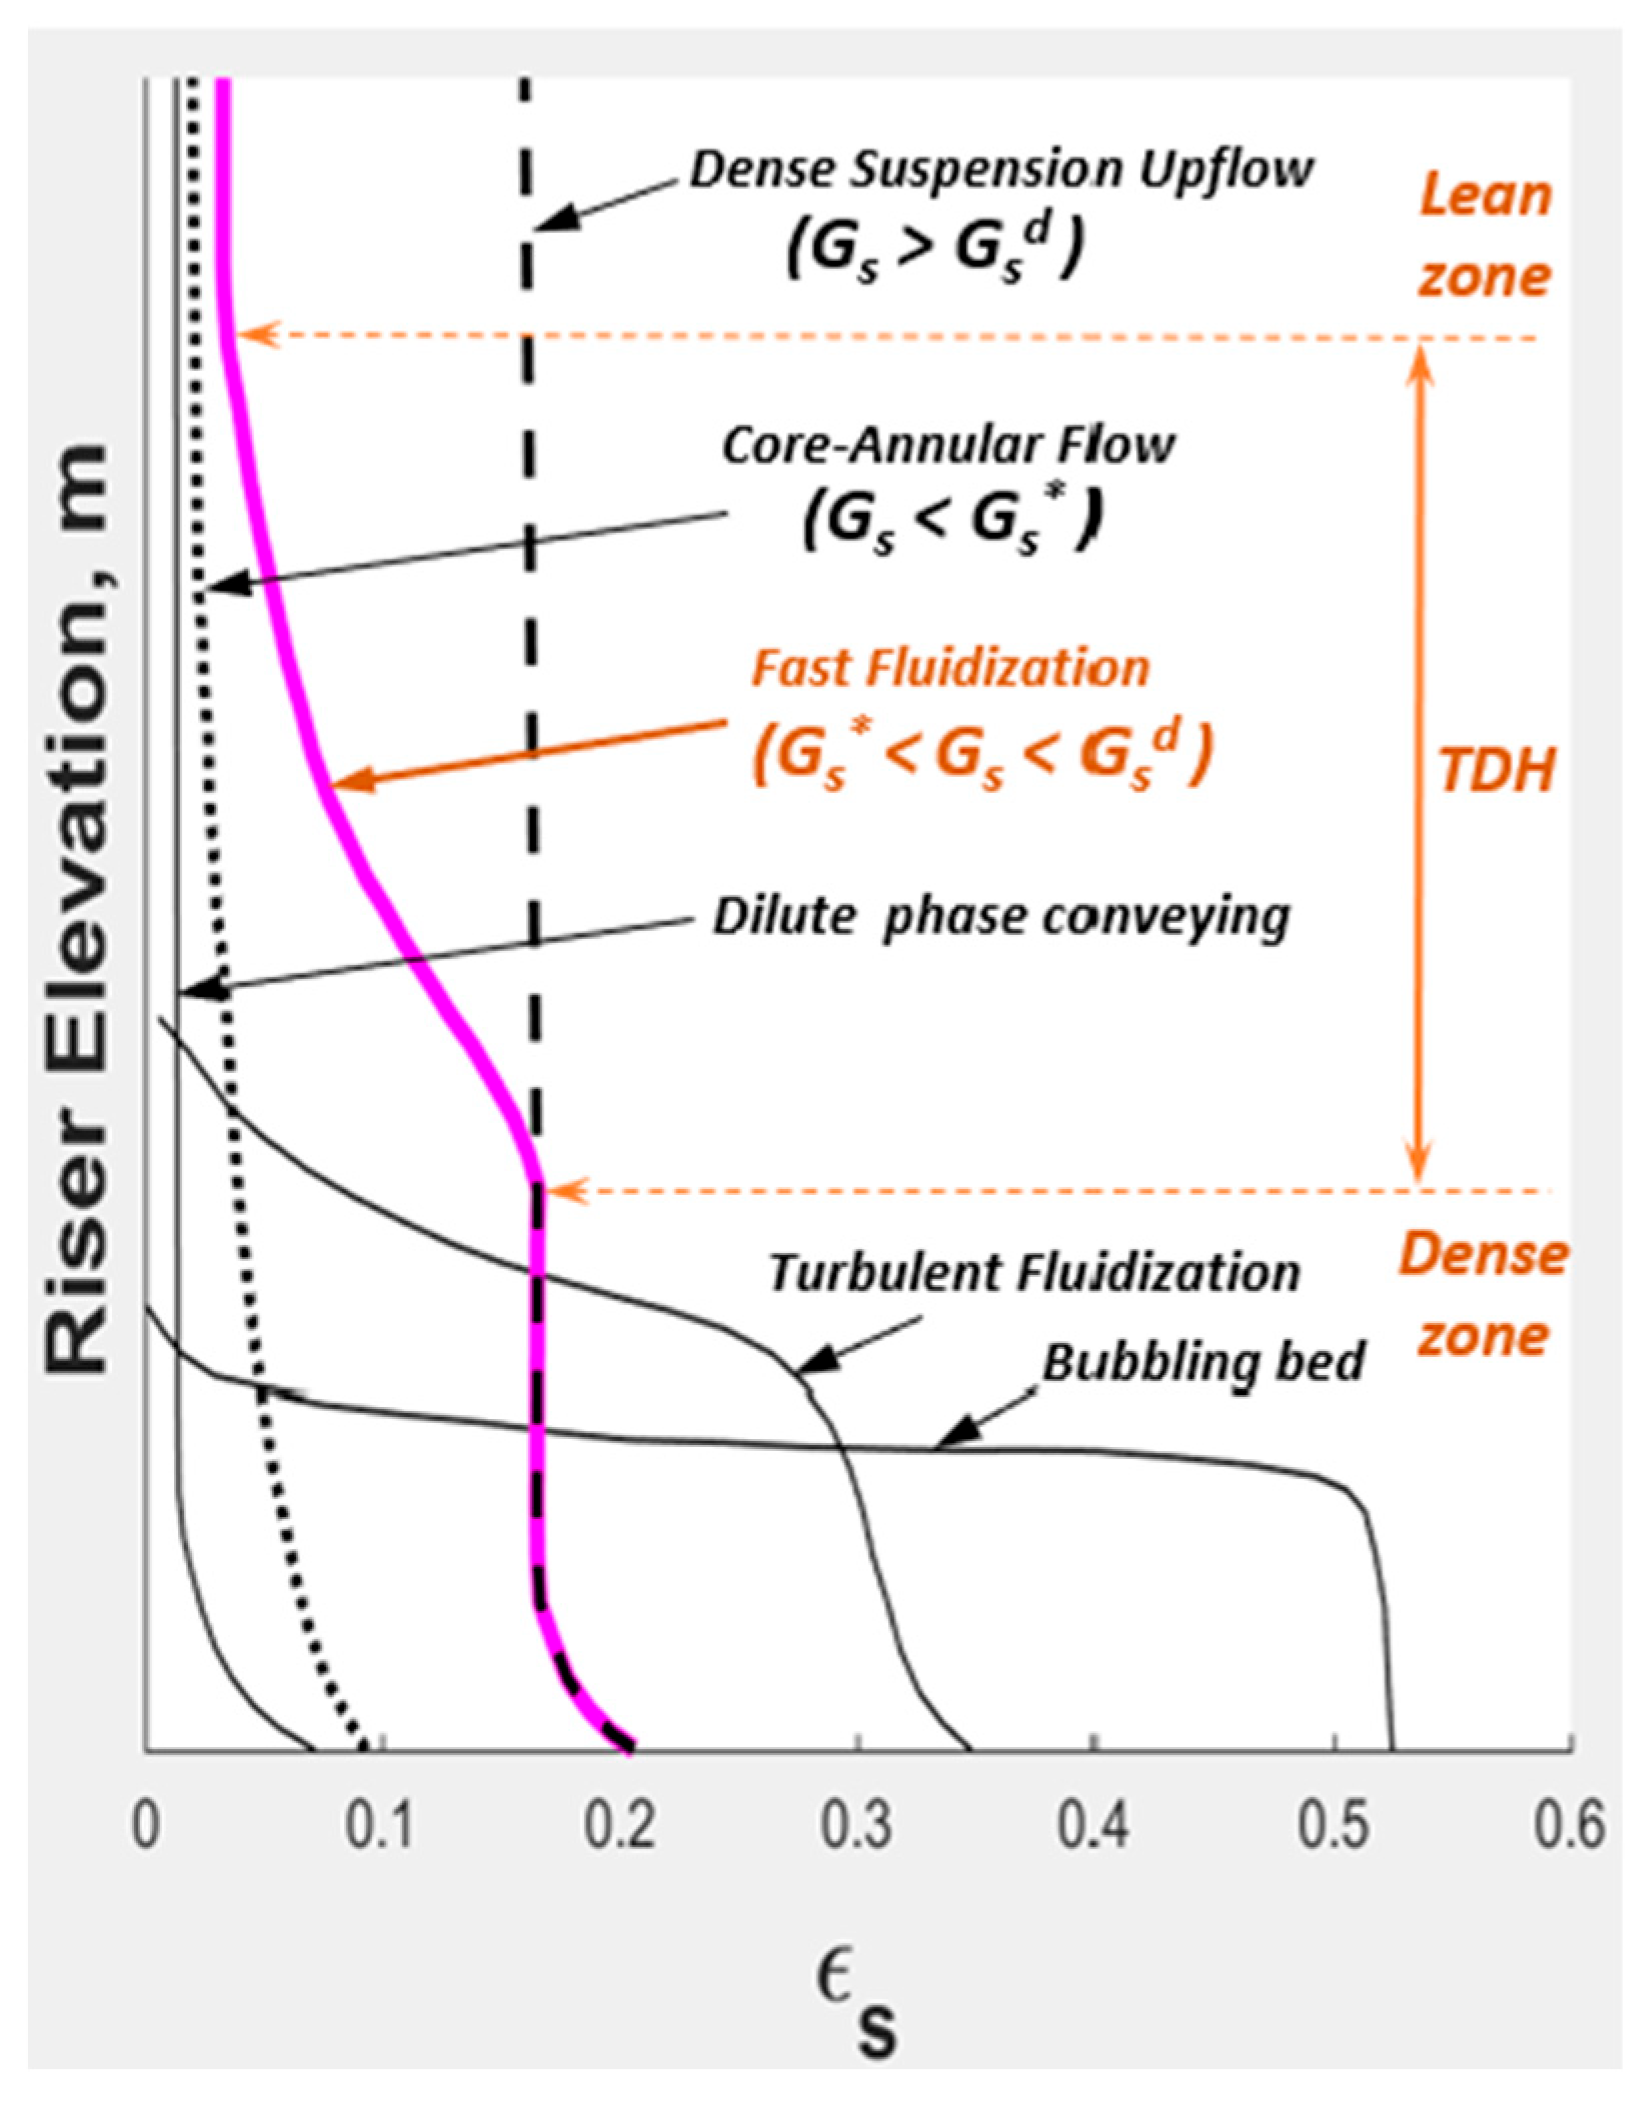
1.1.2. Vertical Upflow Patterns for SCA Powders
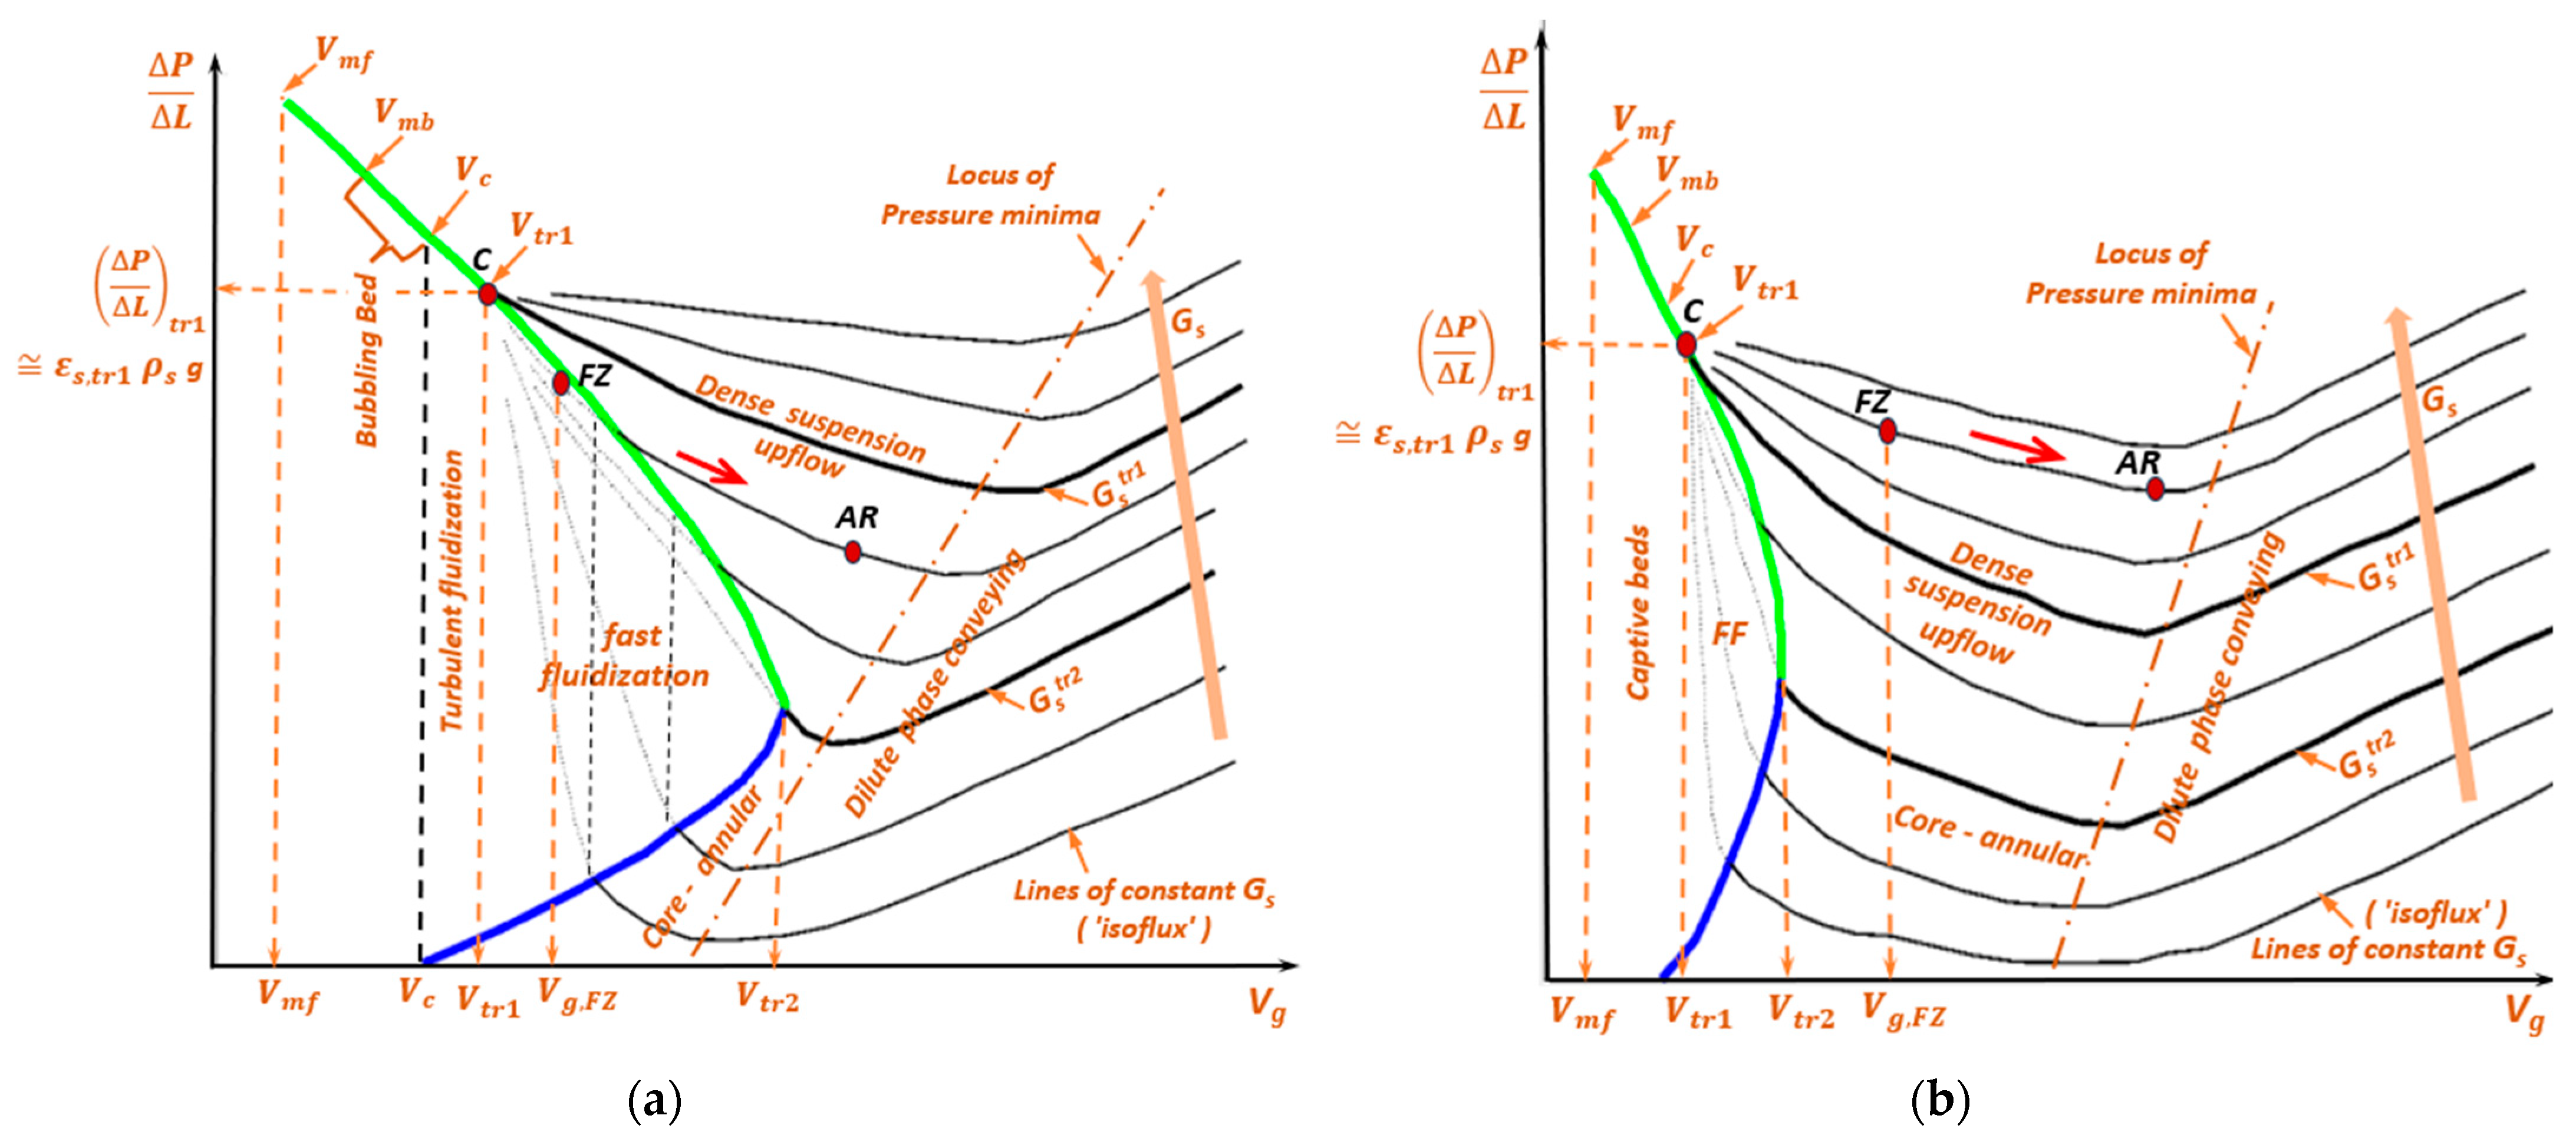
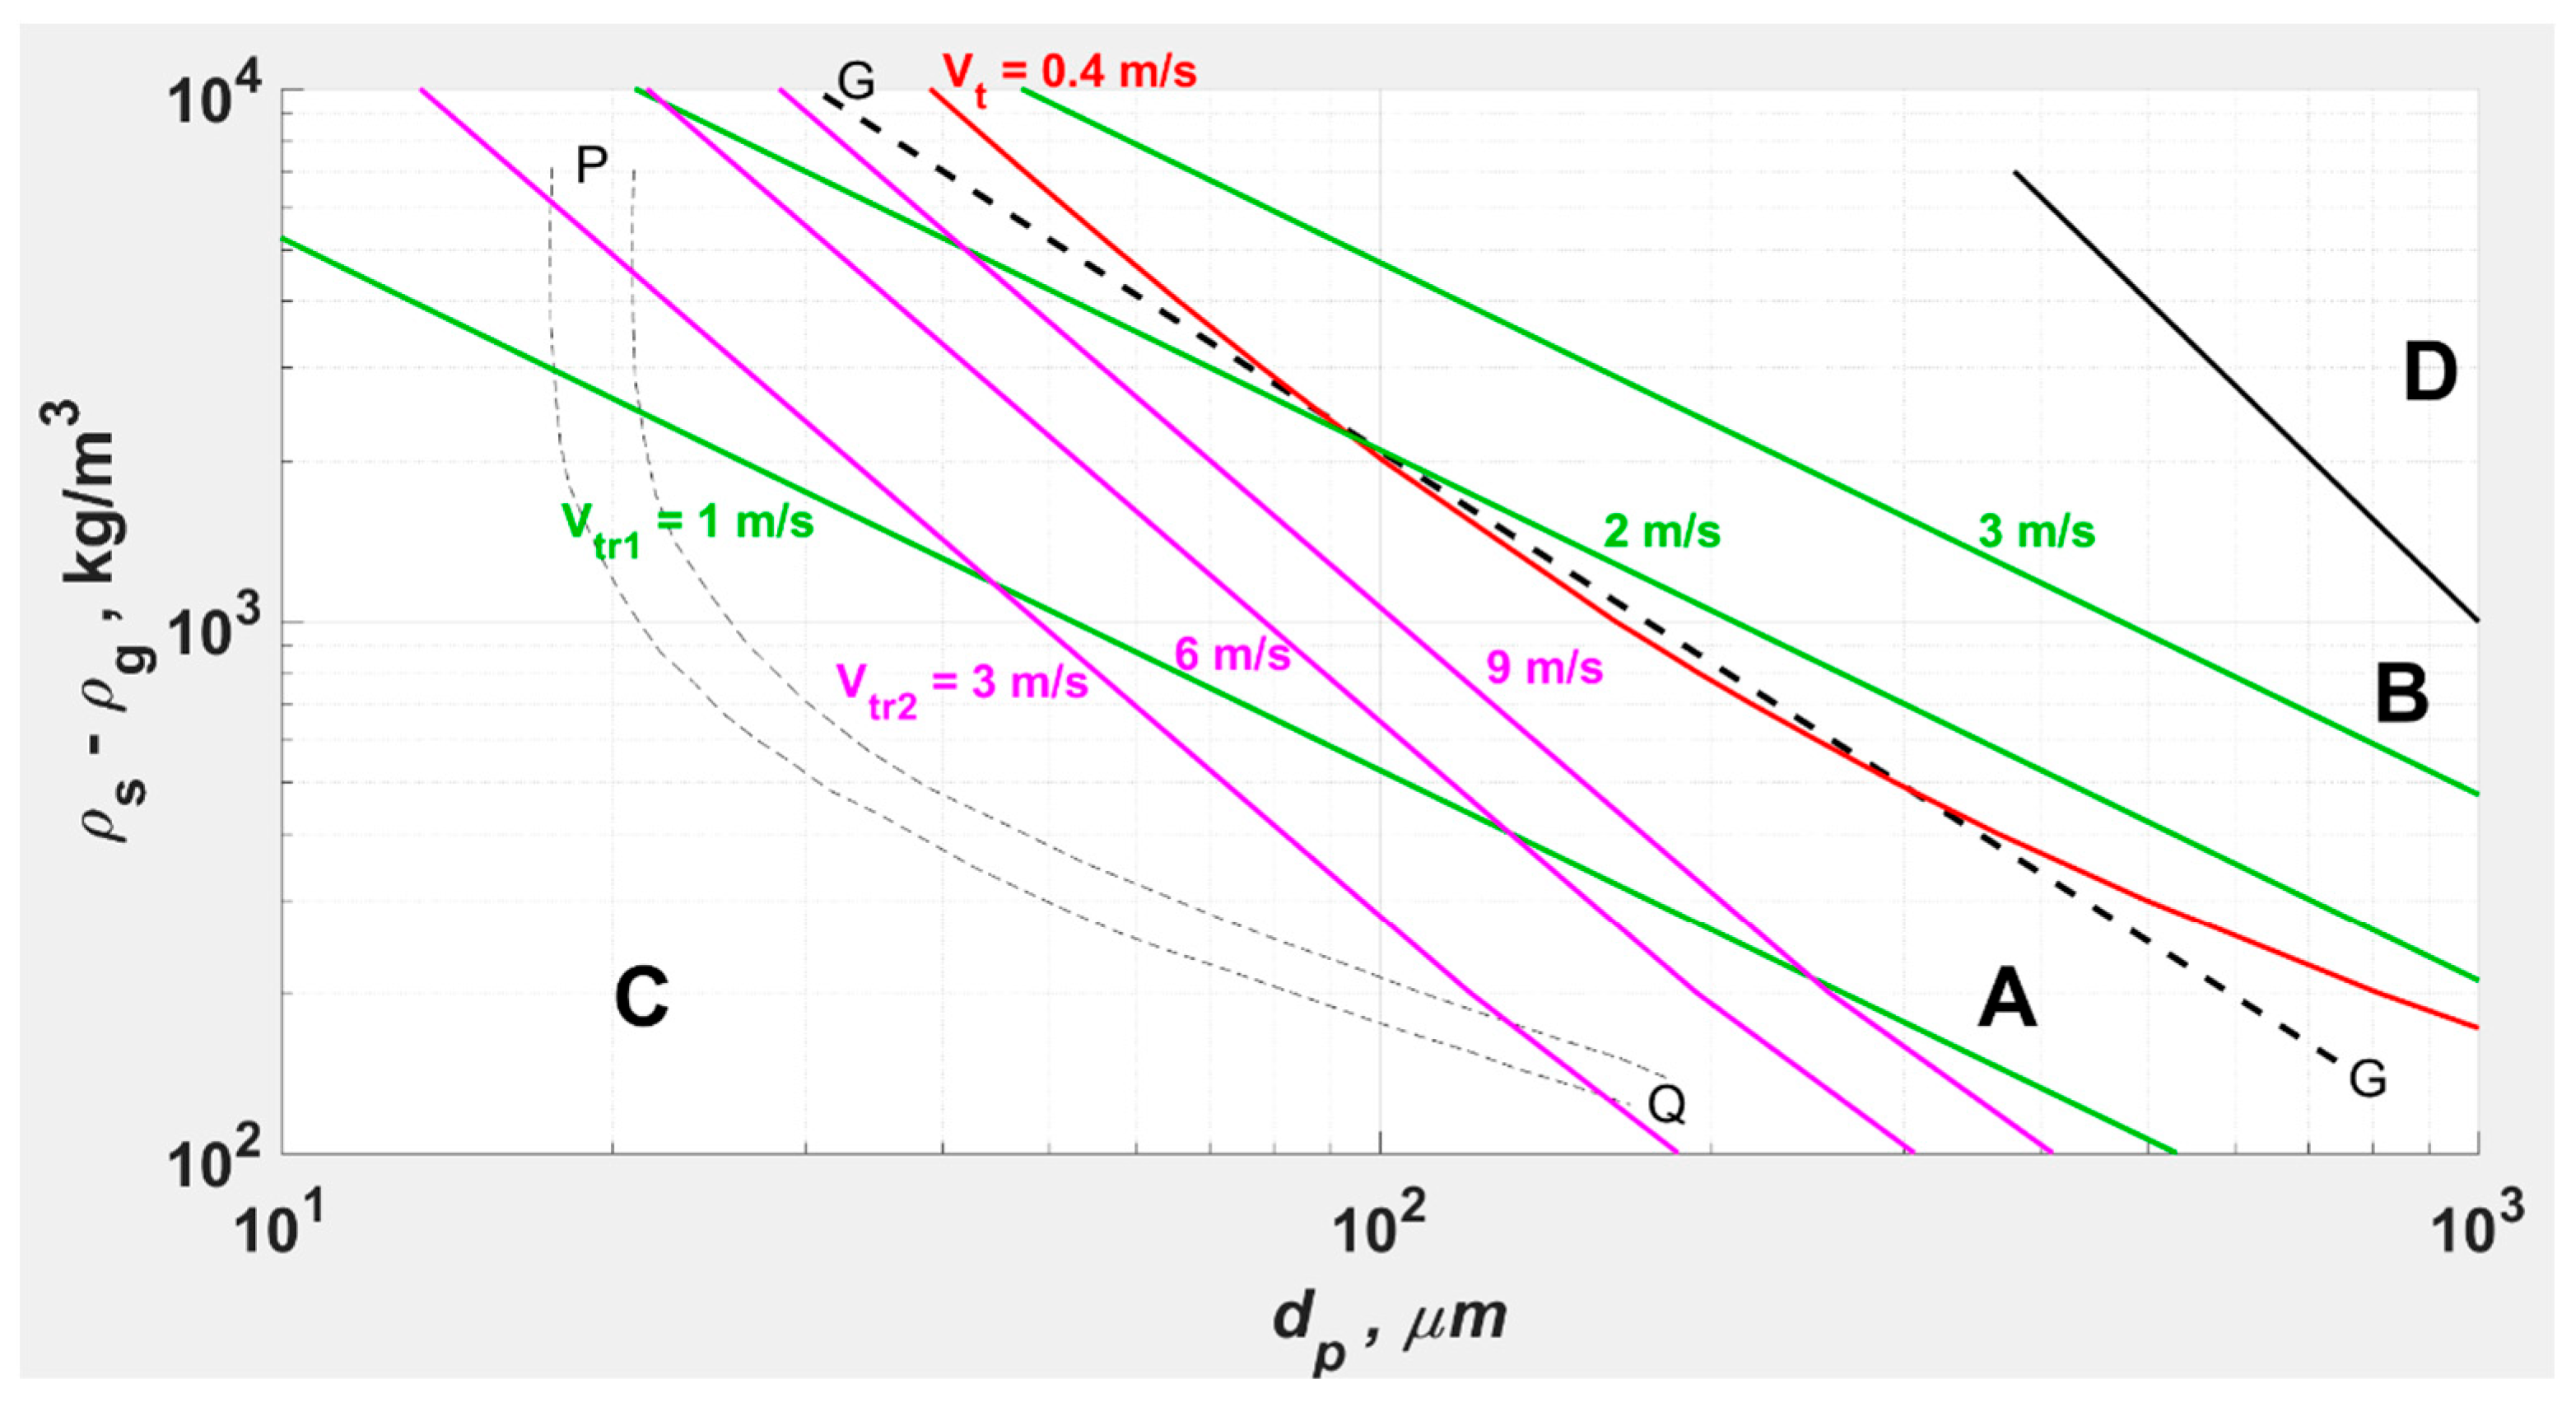
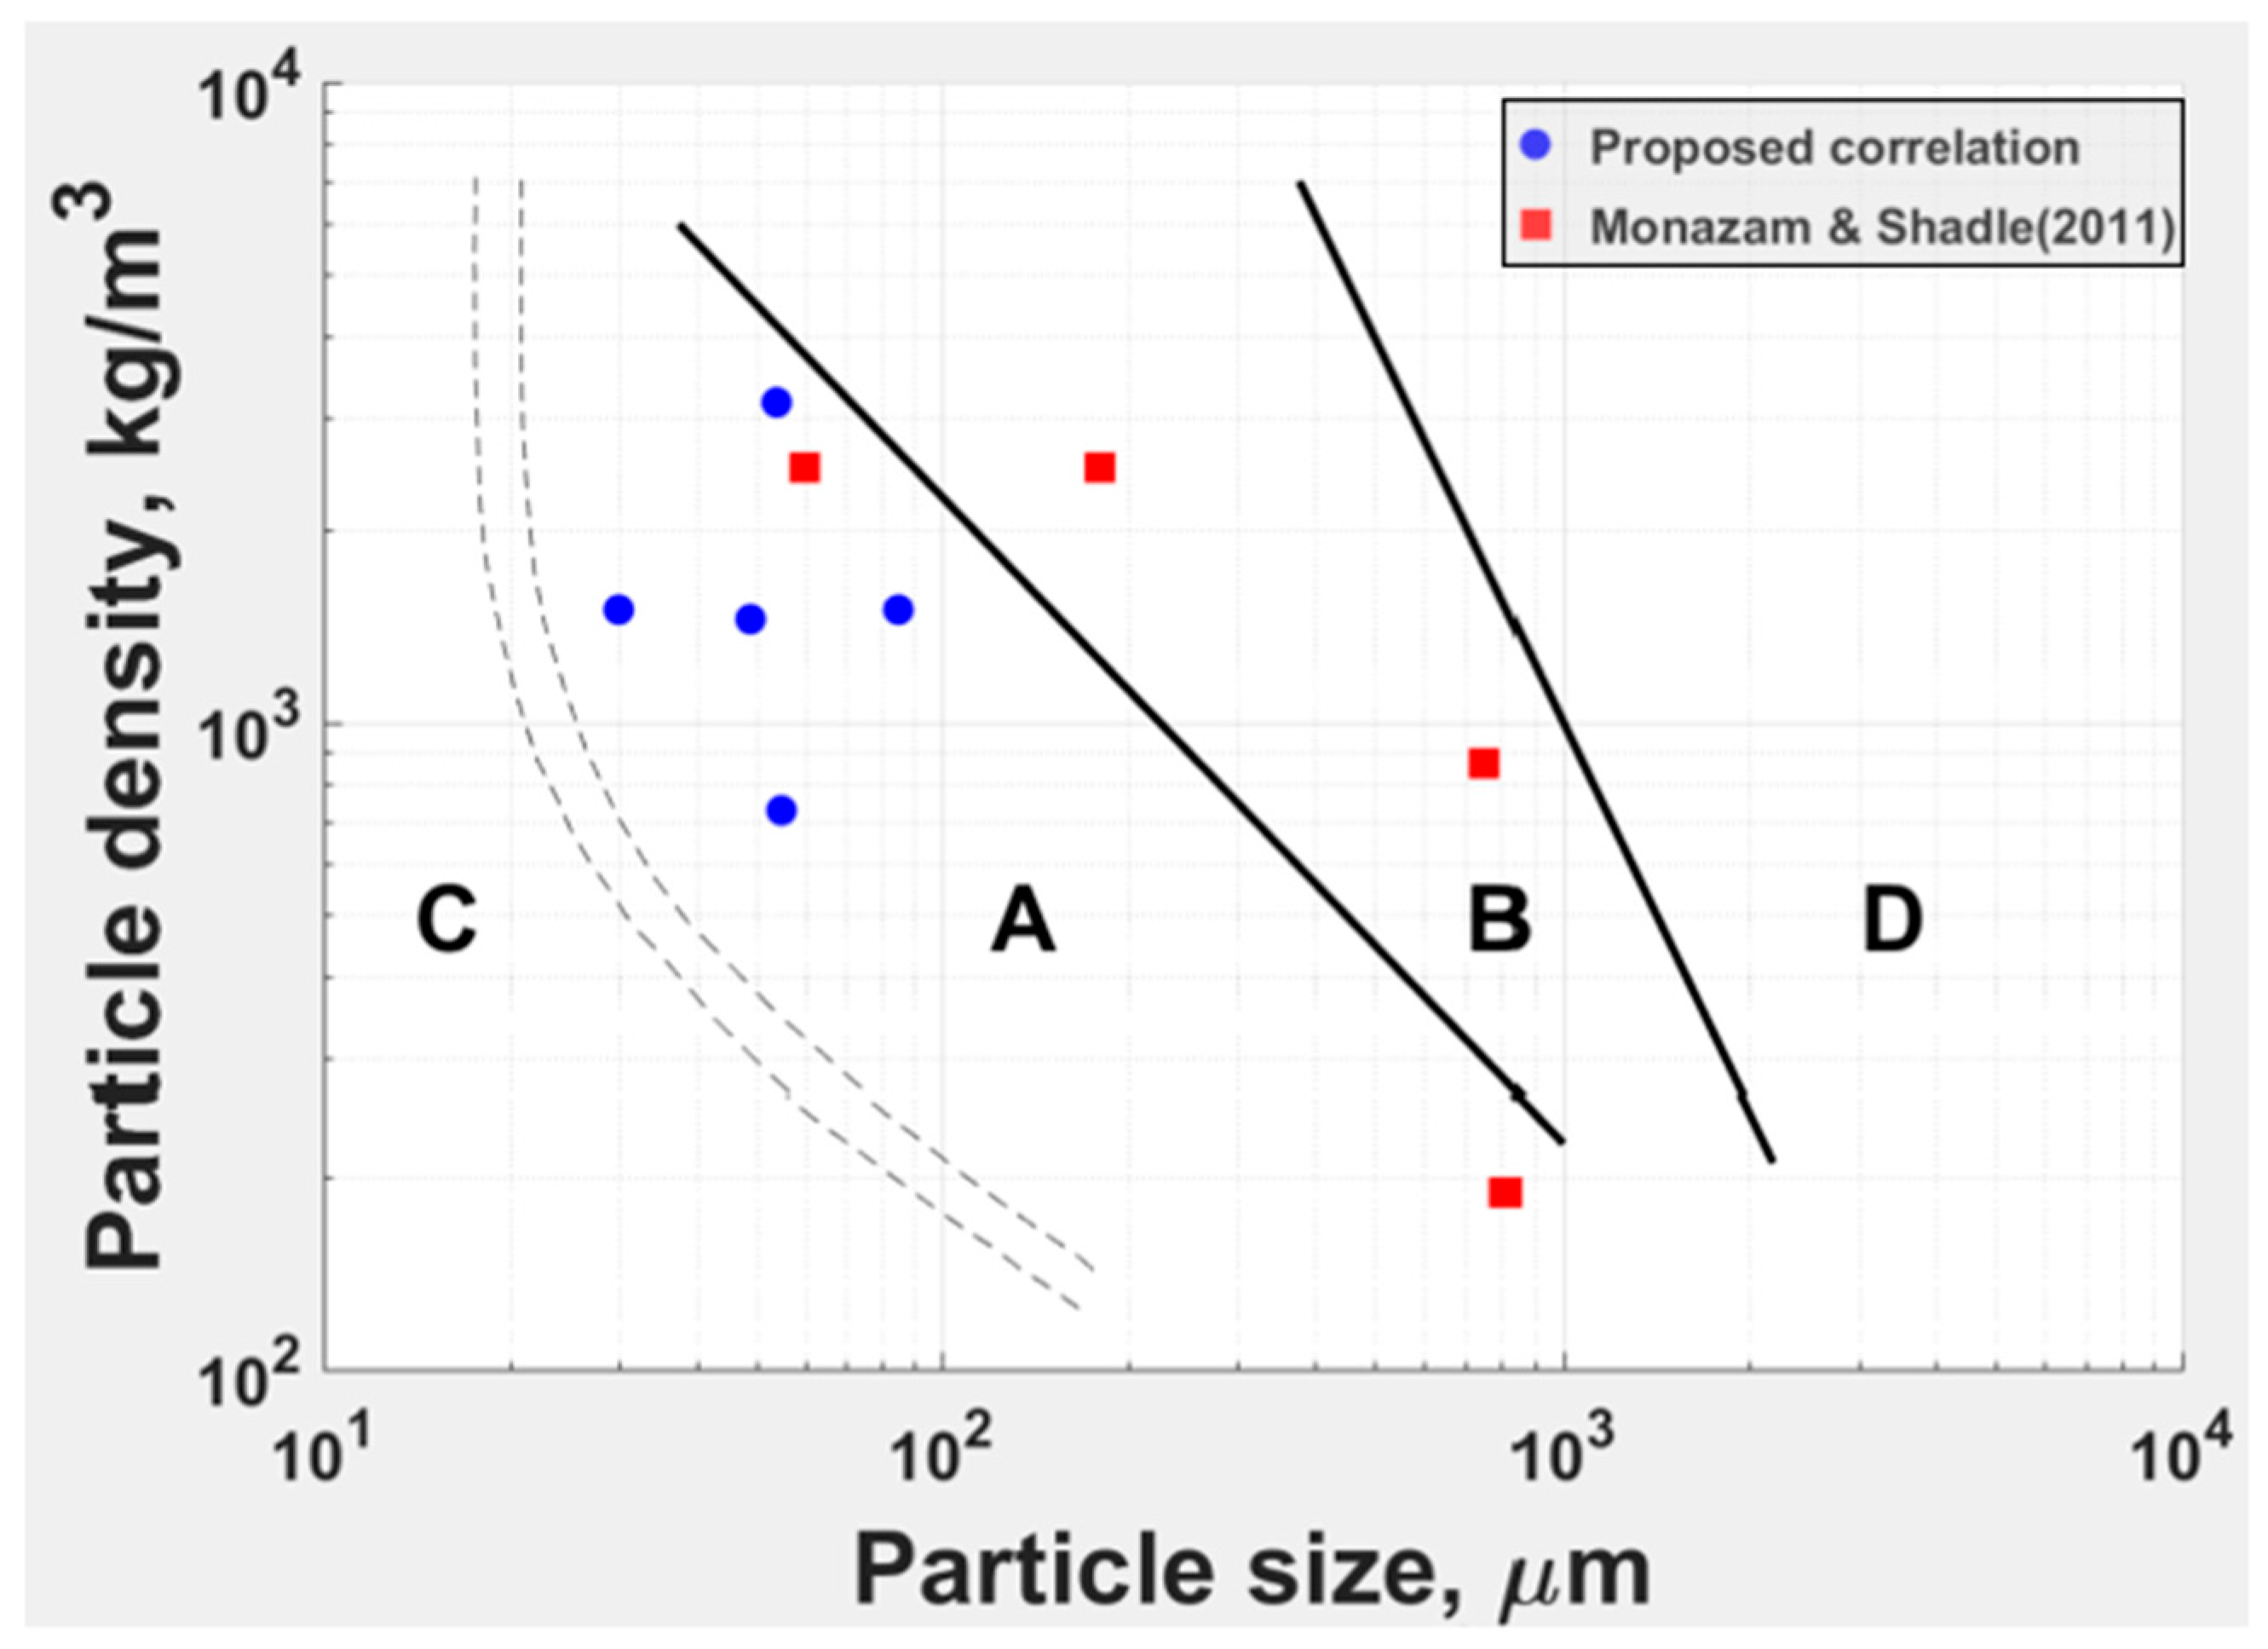
1.1.3. The Phase Map of Wirth
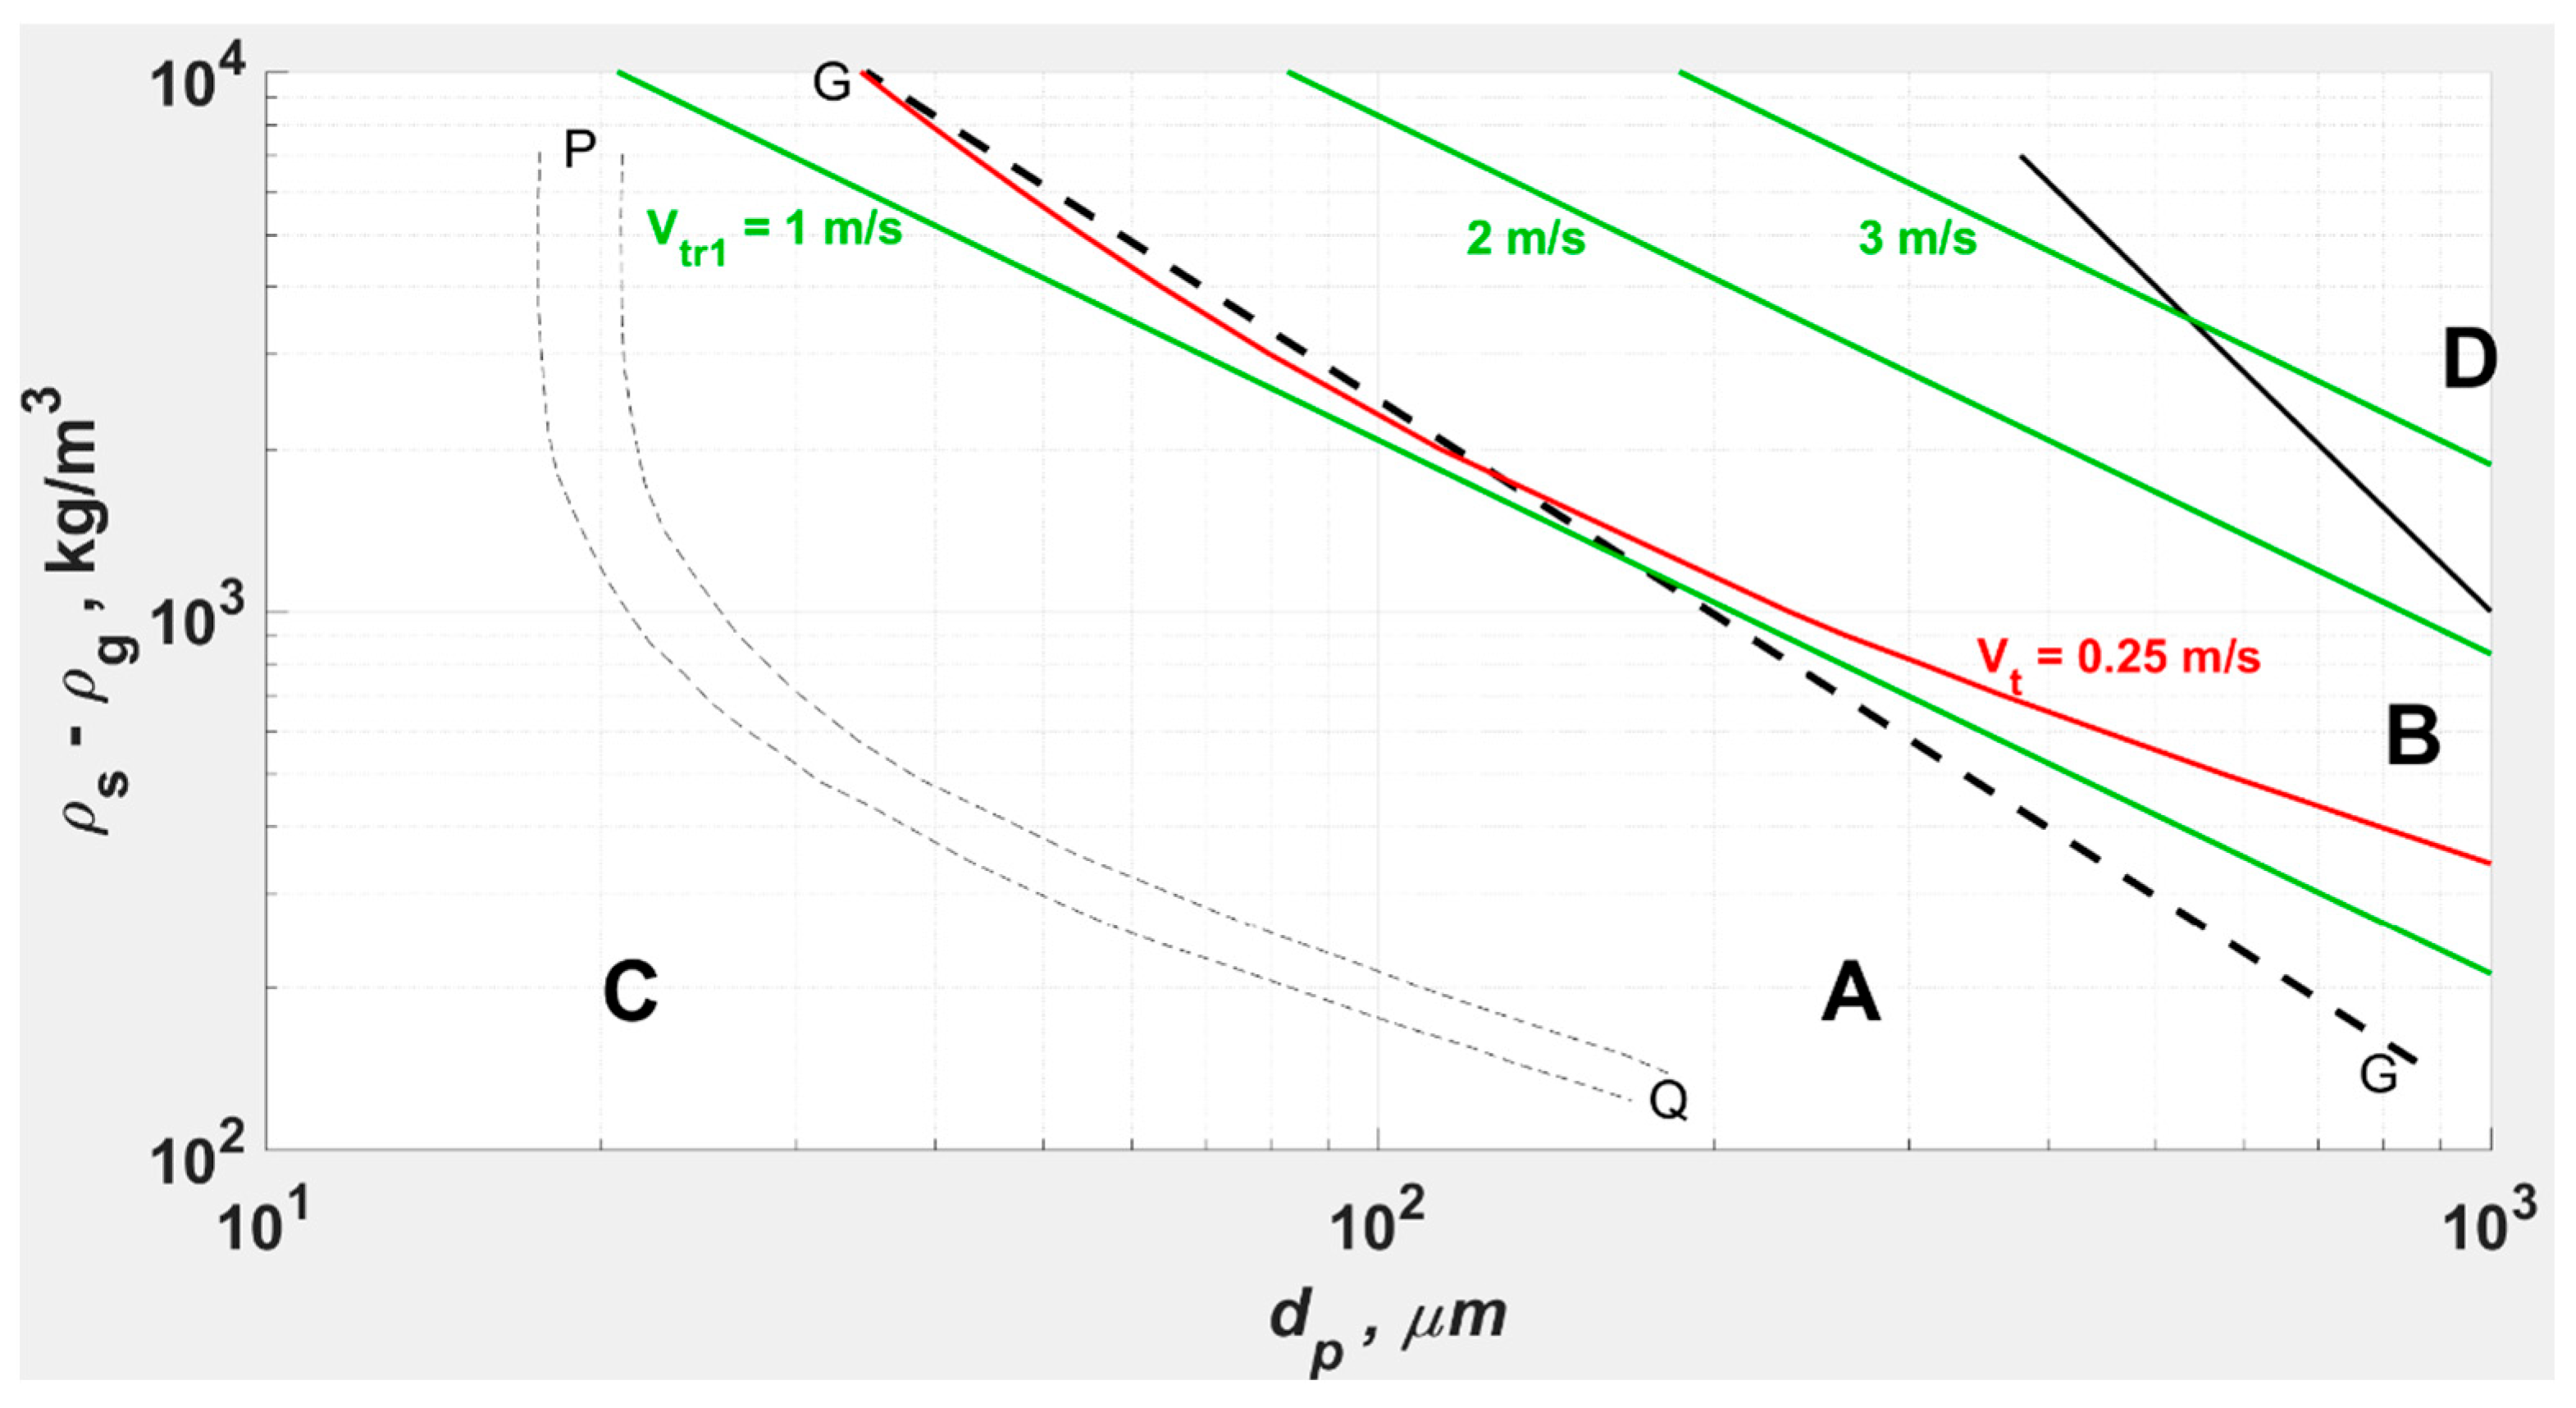
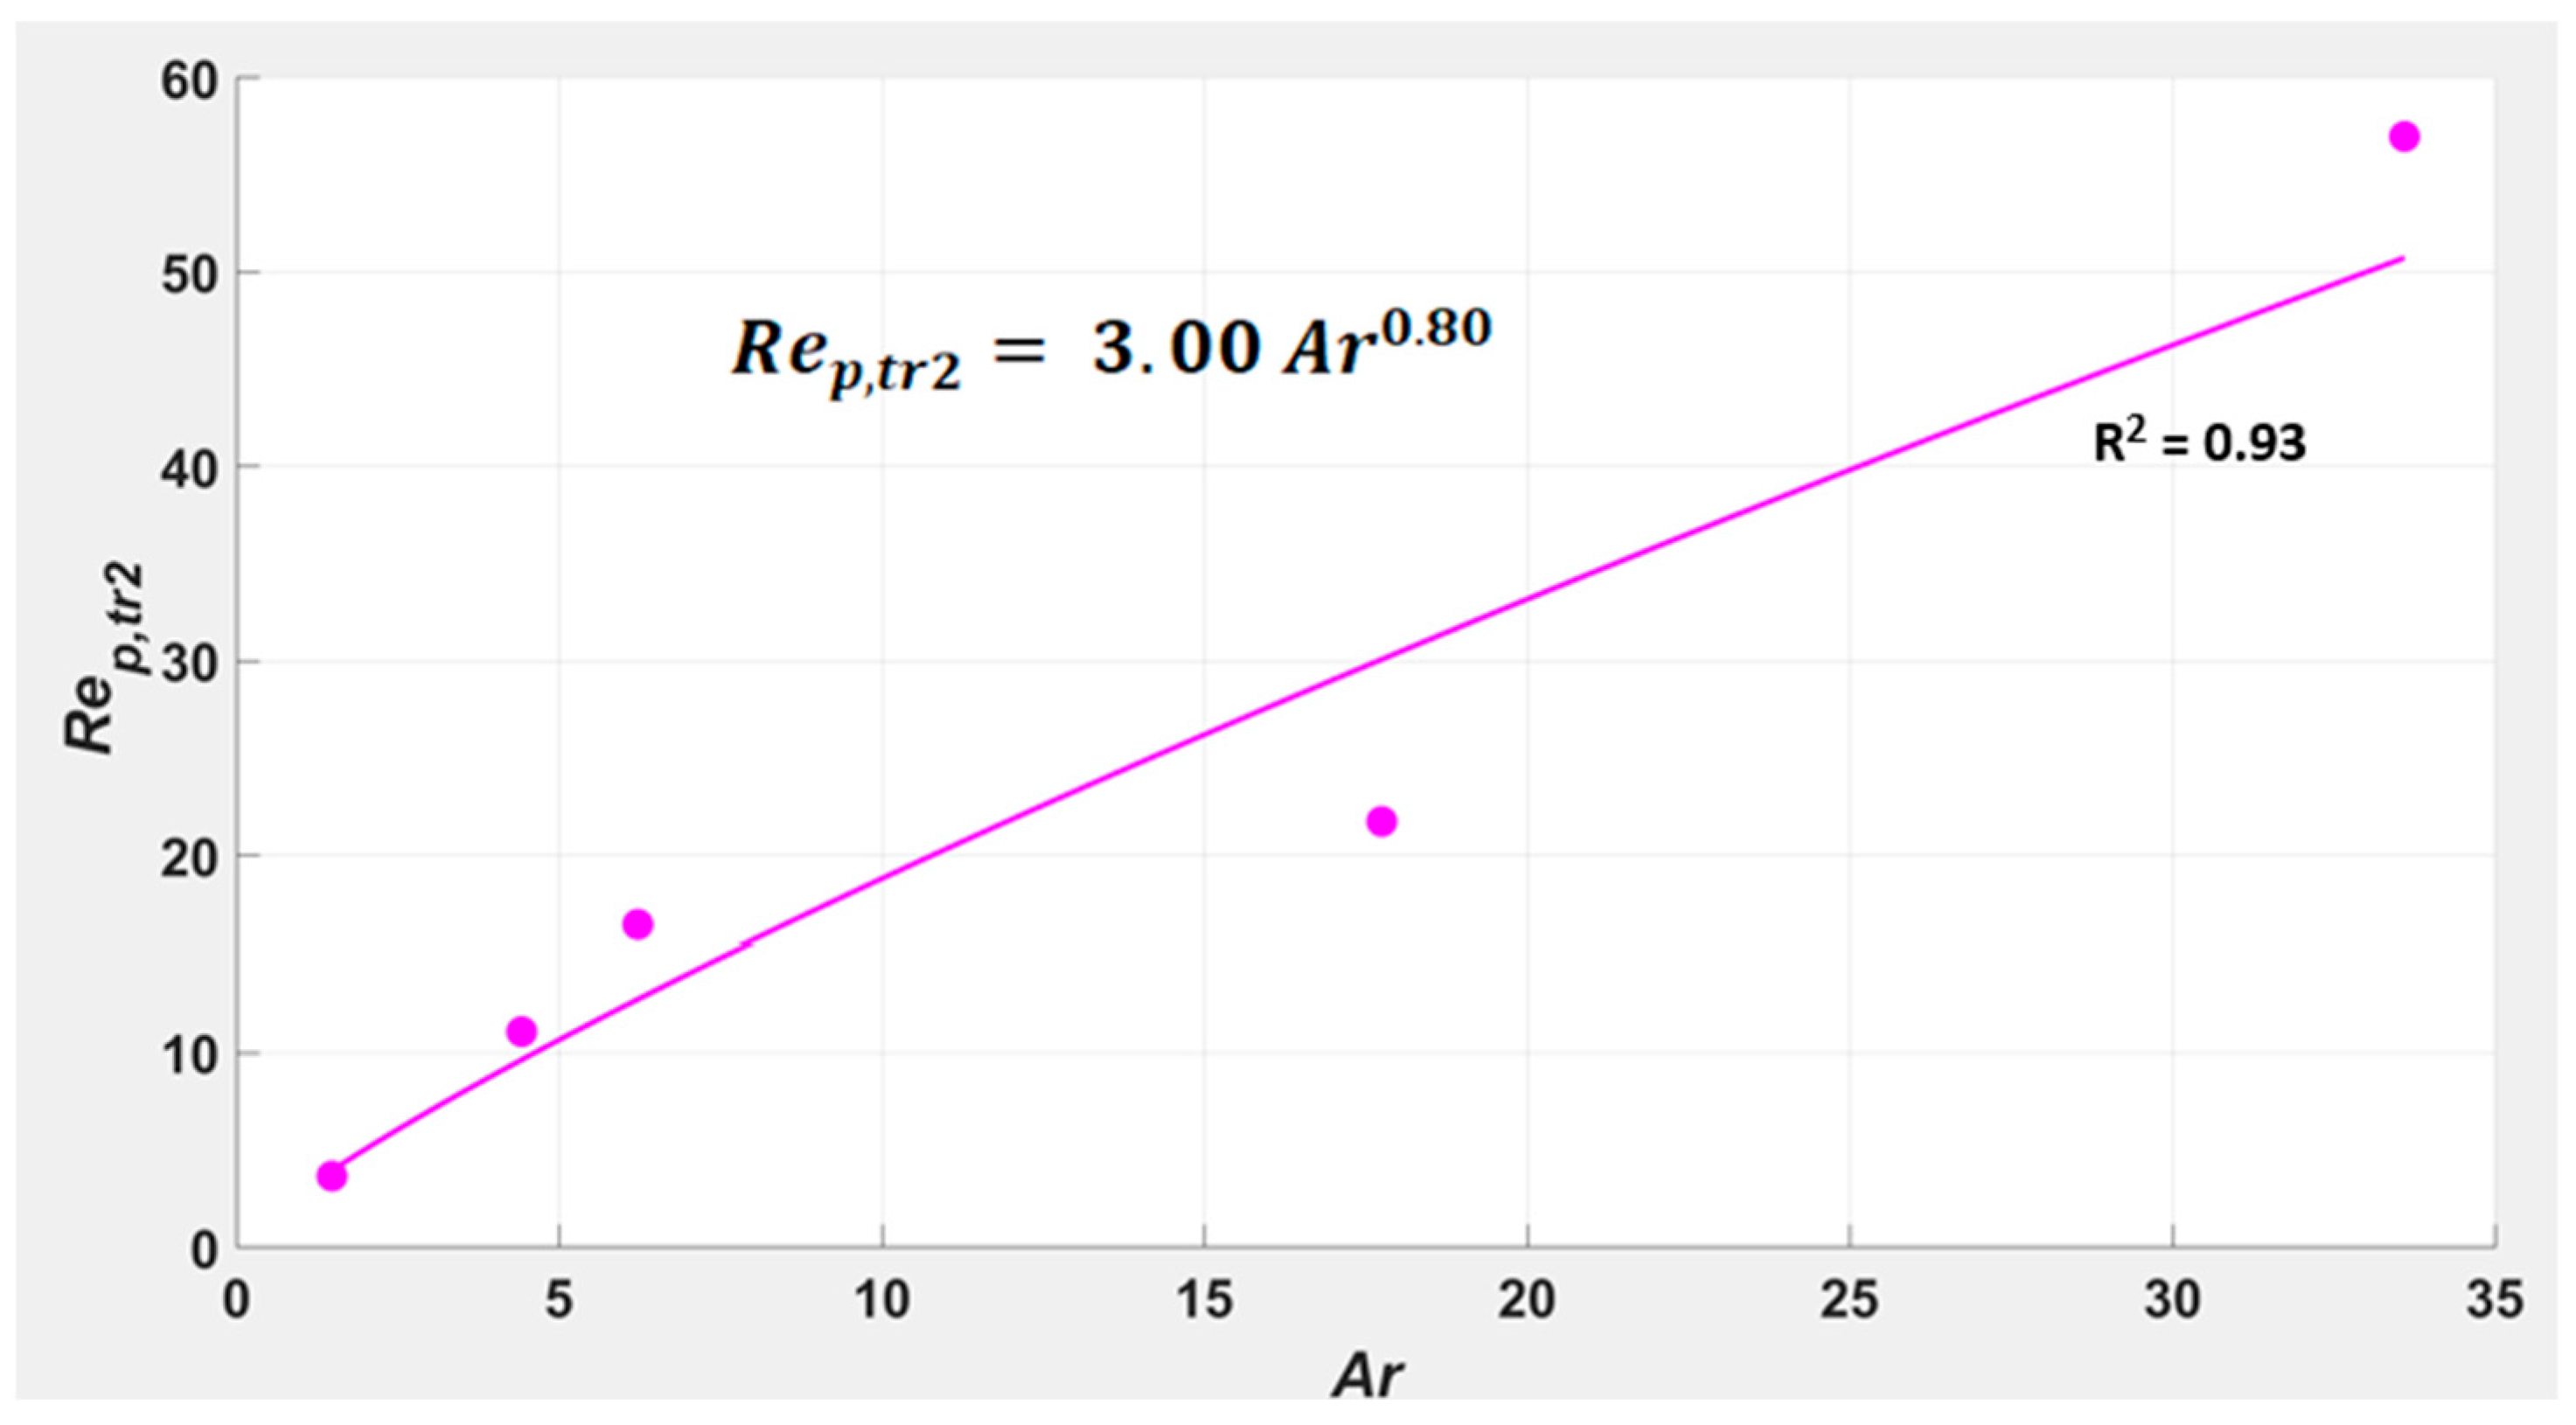
1.1.4. Provisional Correlation for Upper Transport Velocity
1.1.5. Validation of DSU and Its Boundaries by Eulerian Modeling
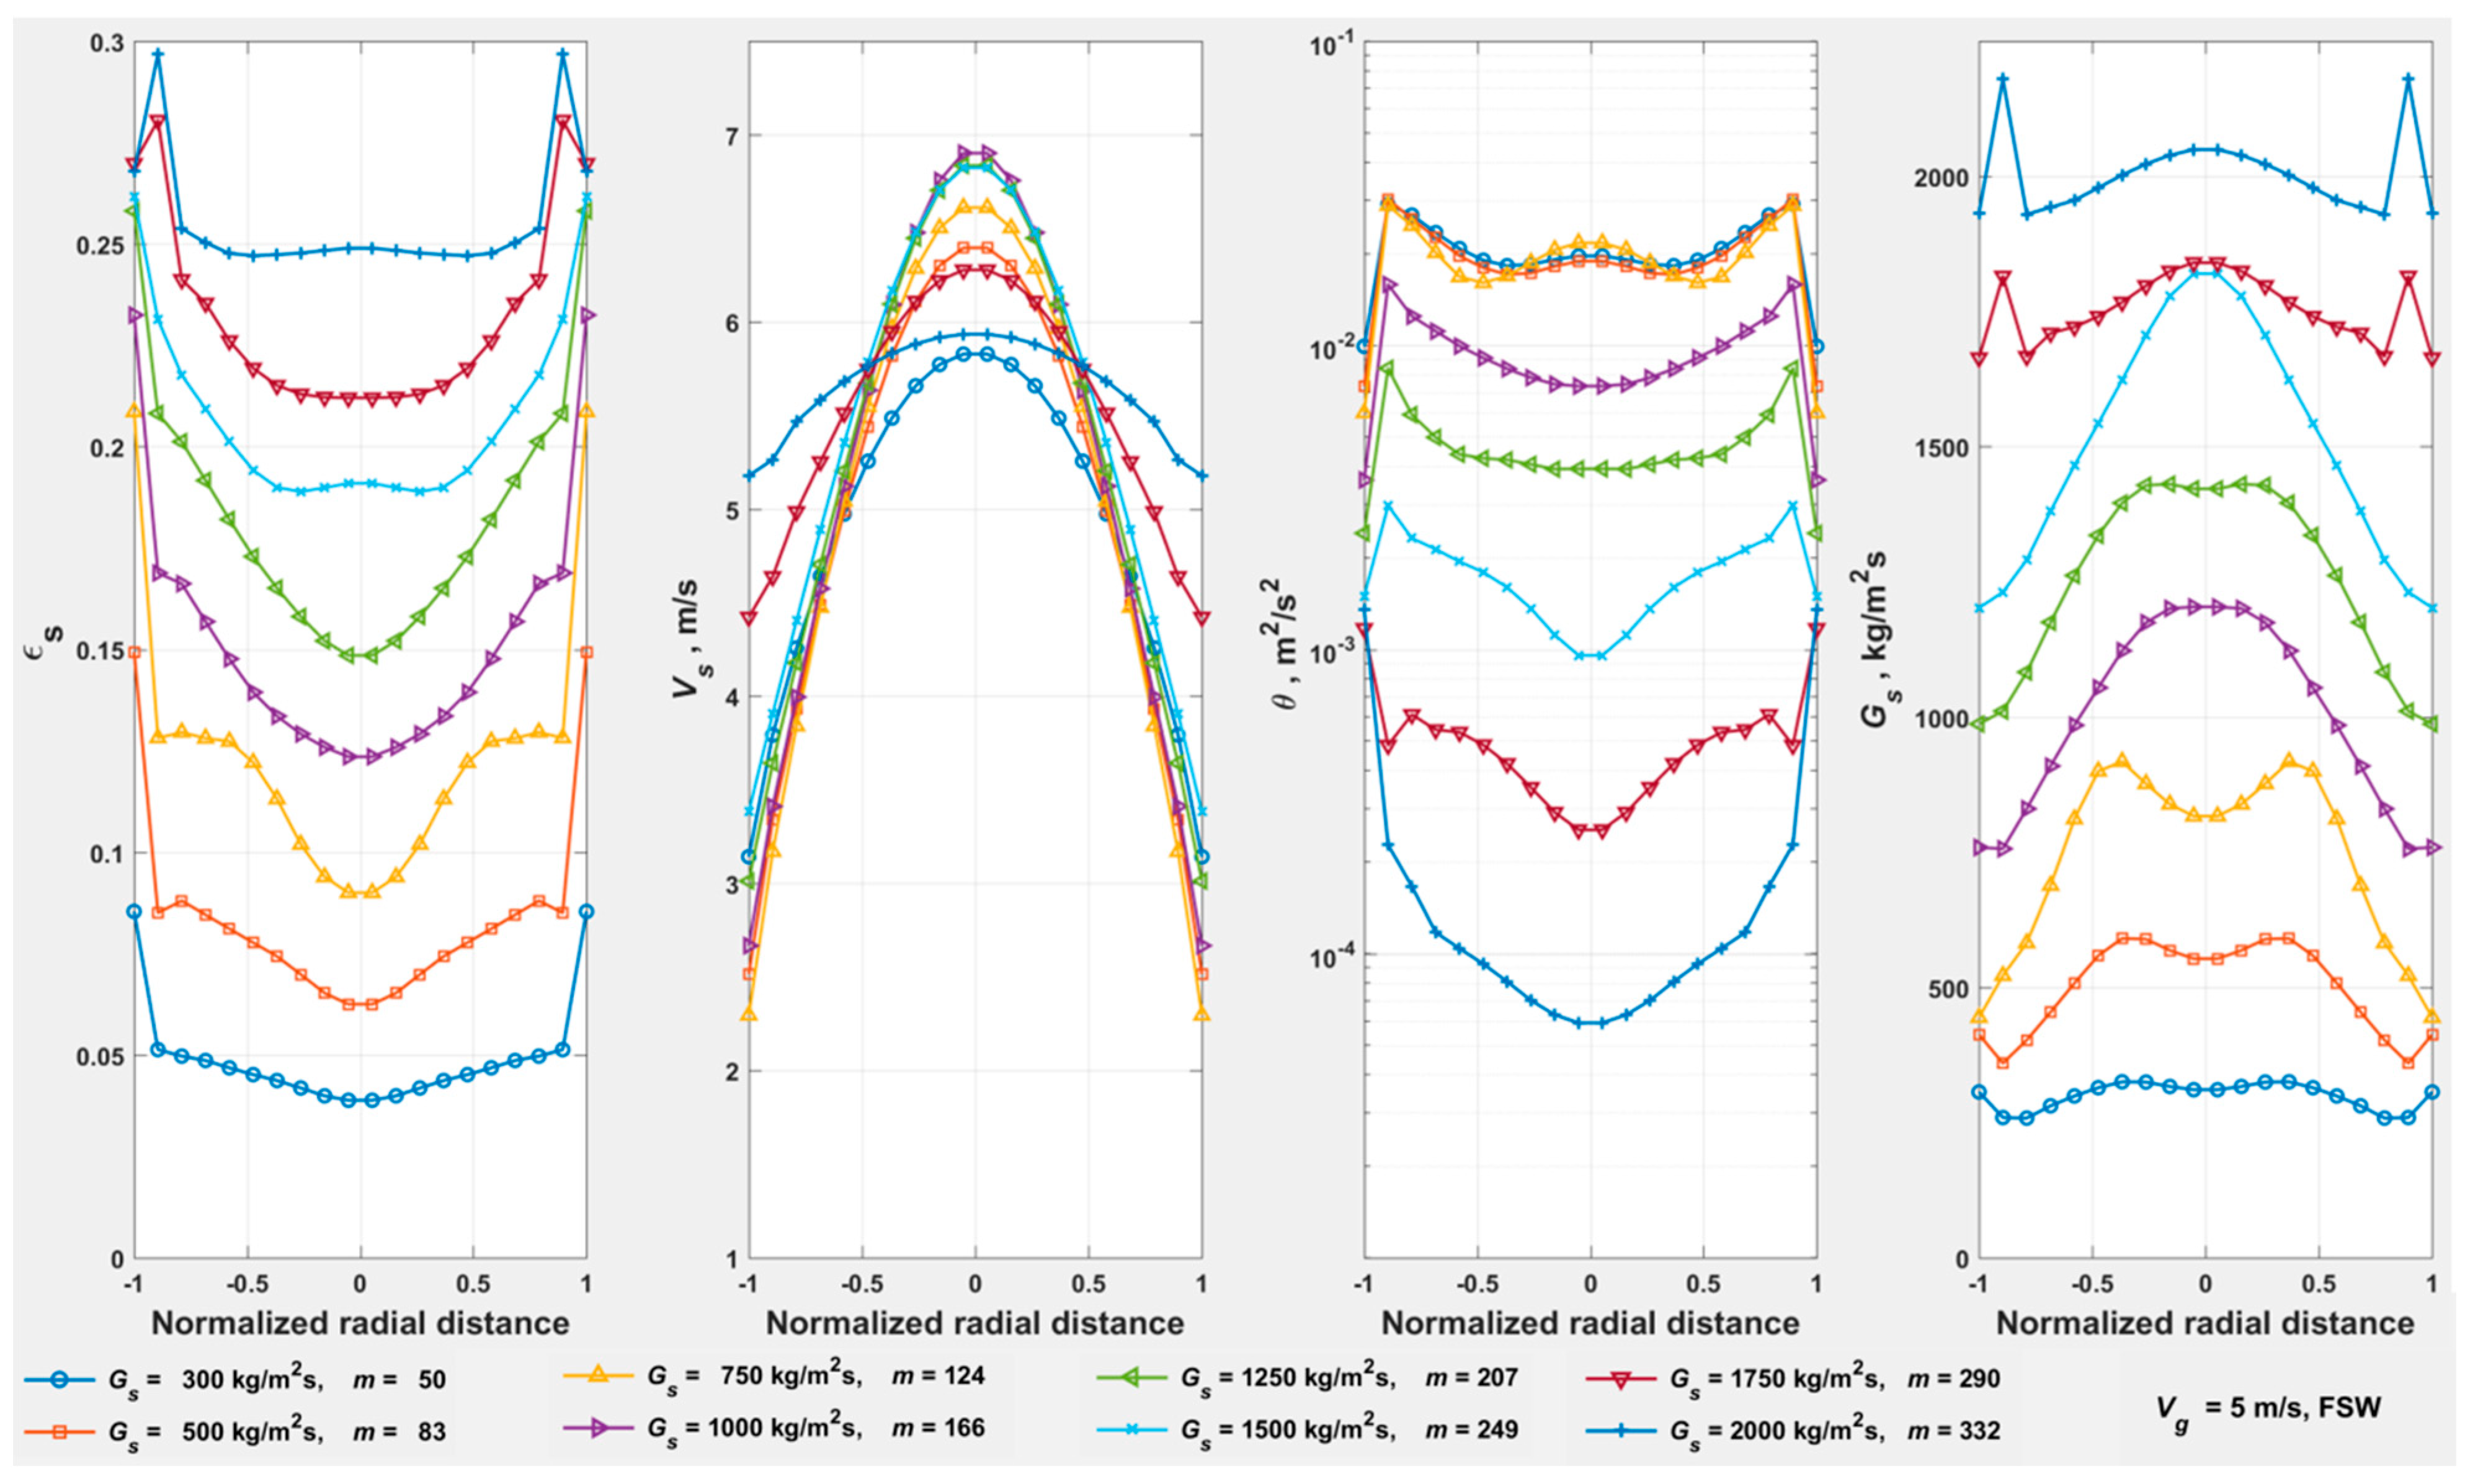
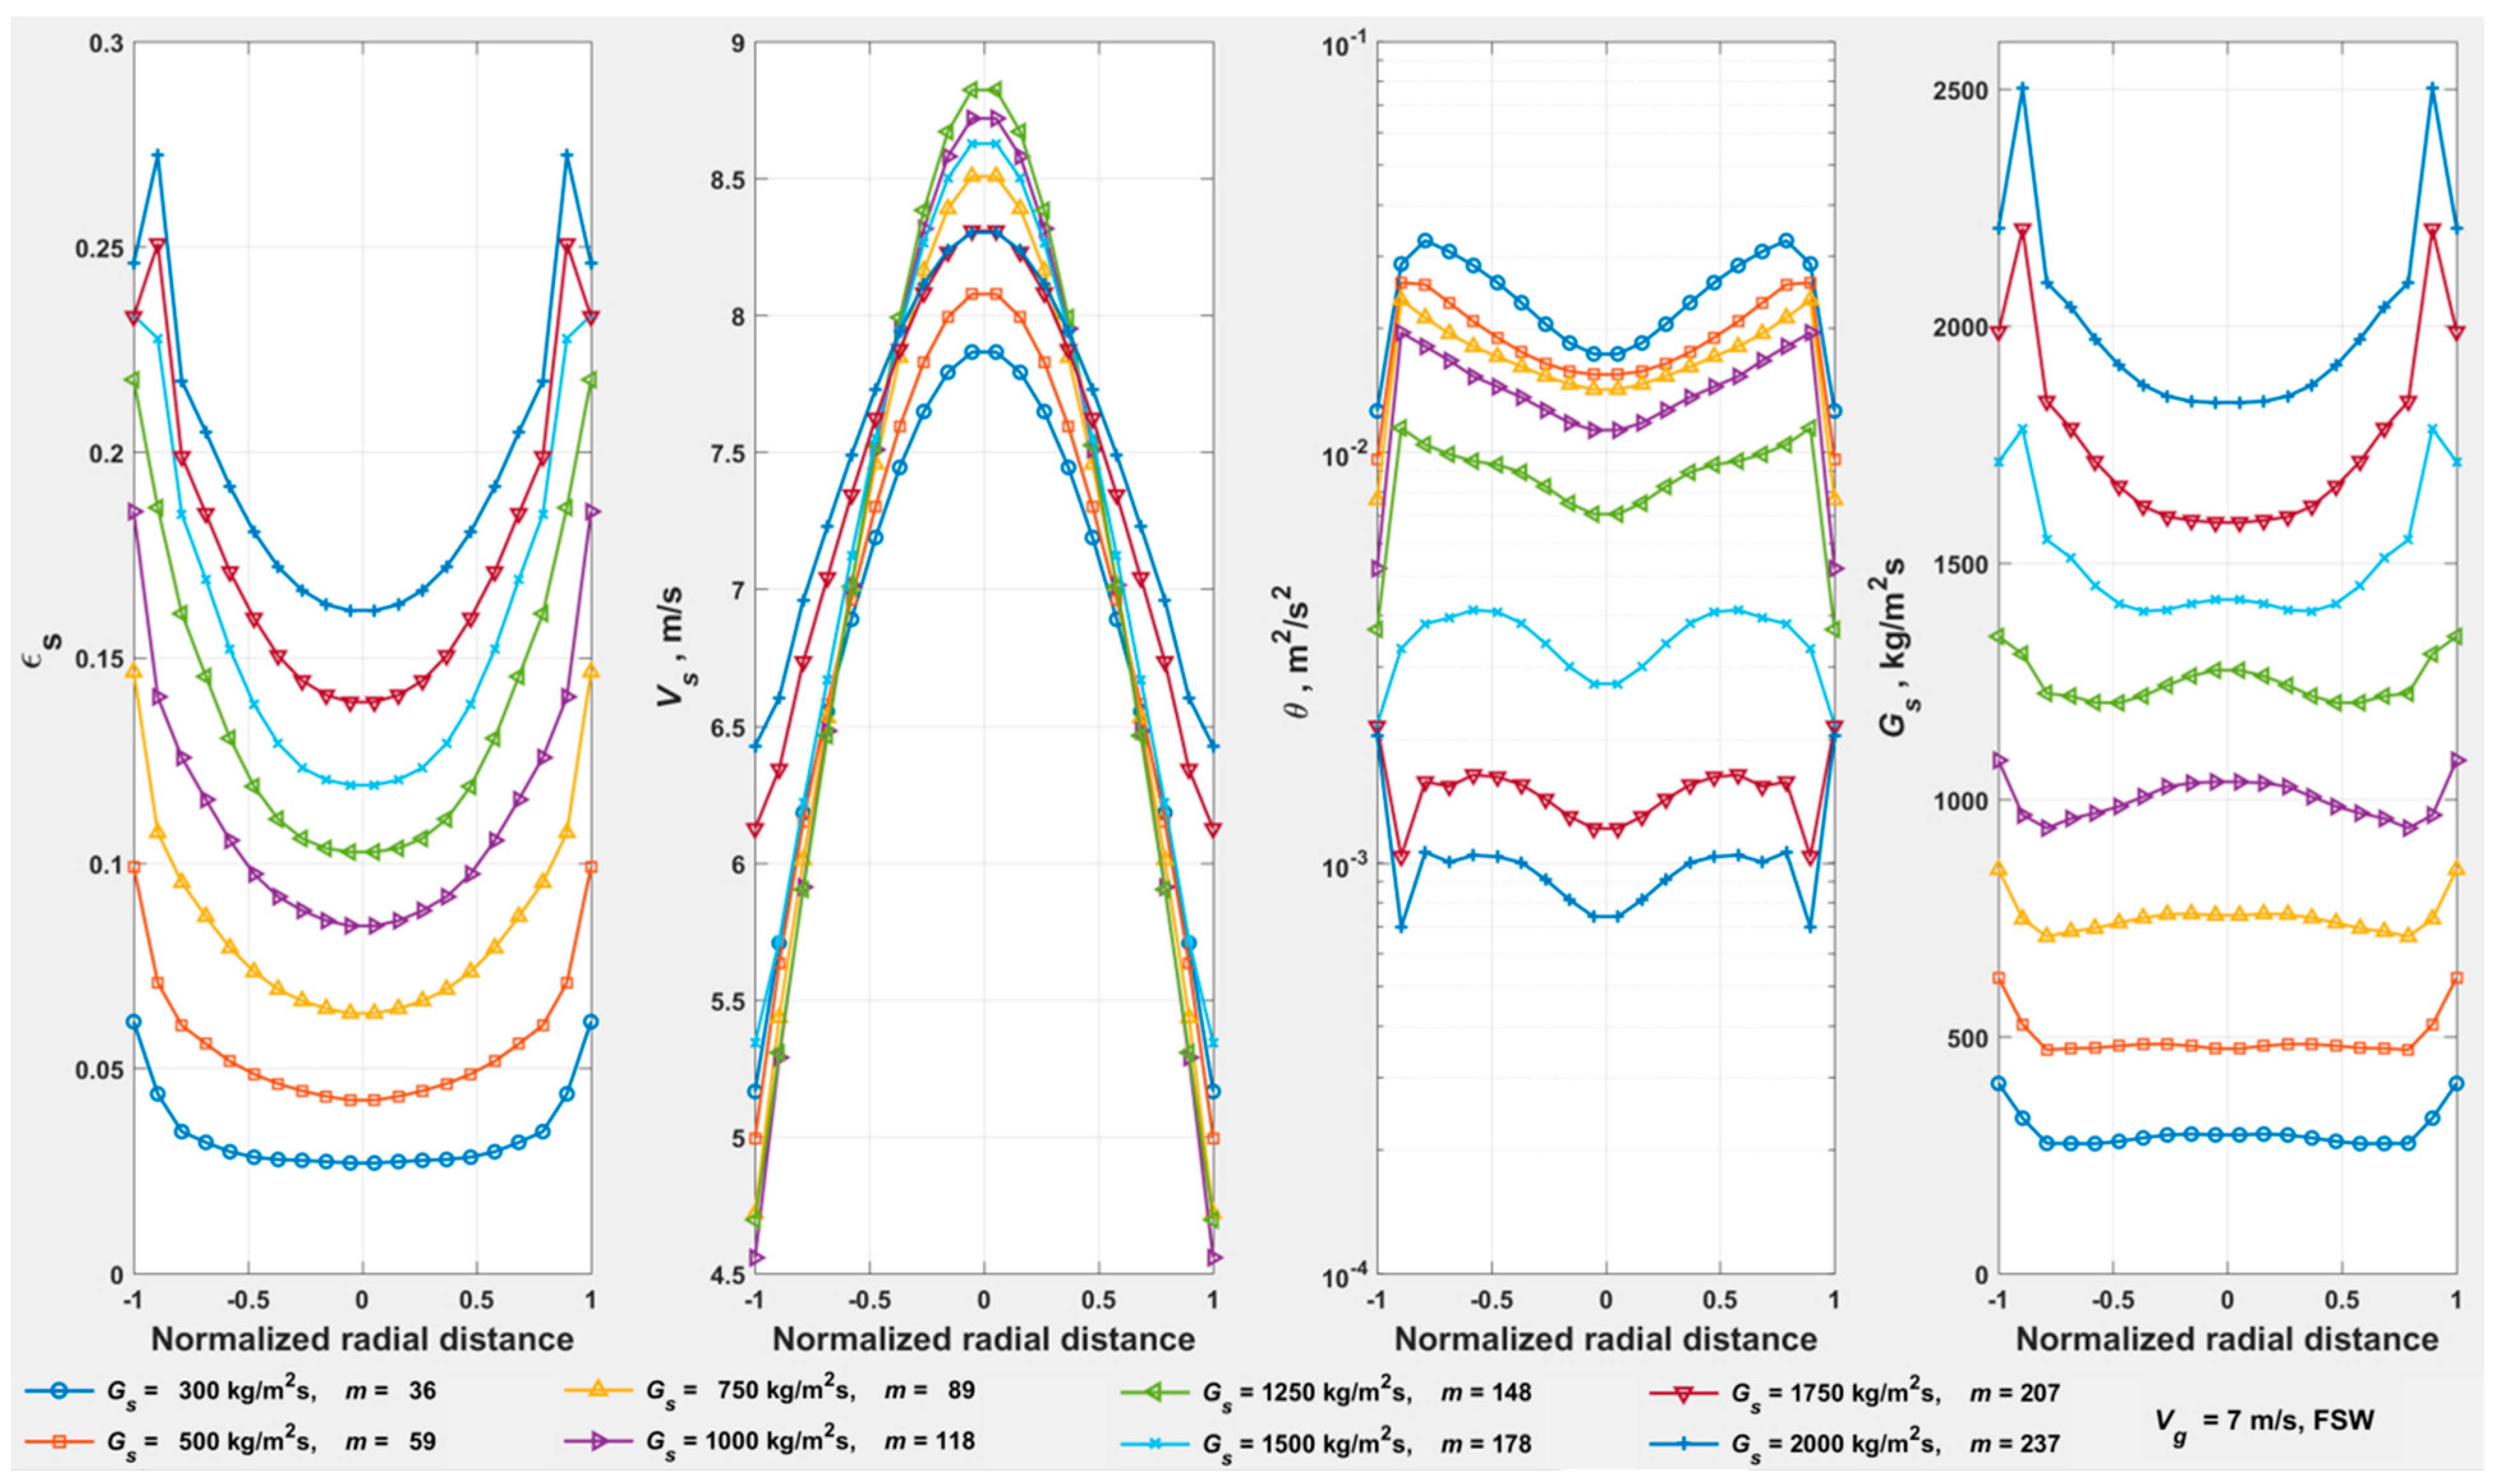
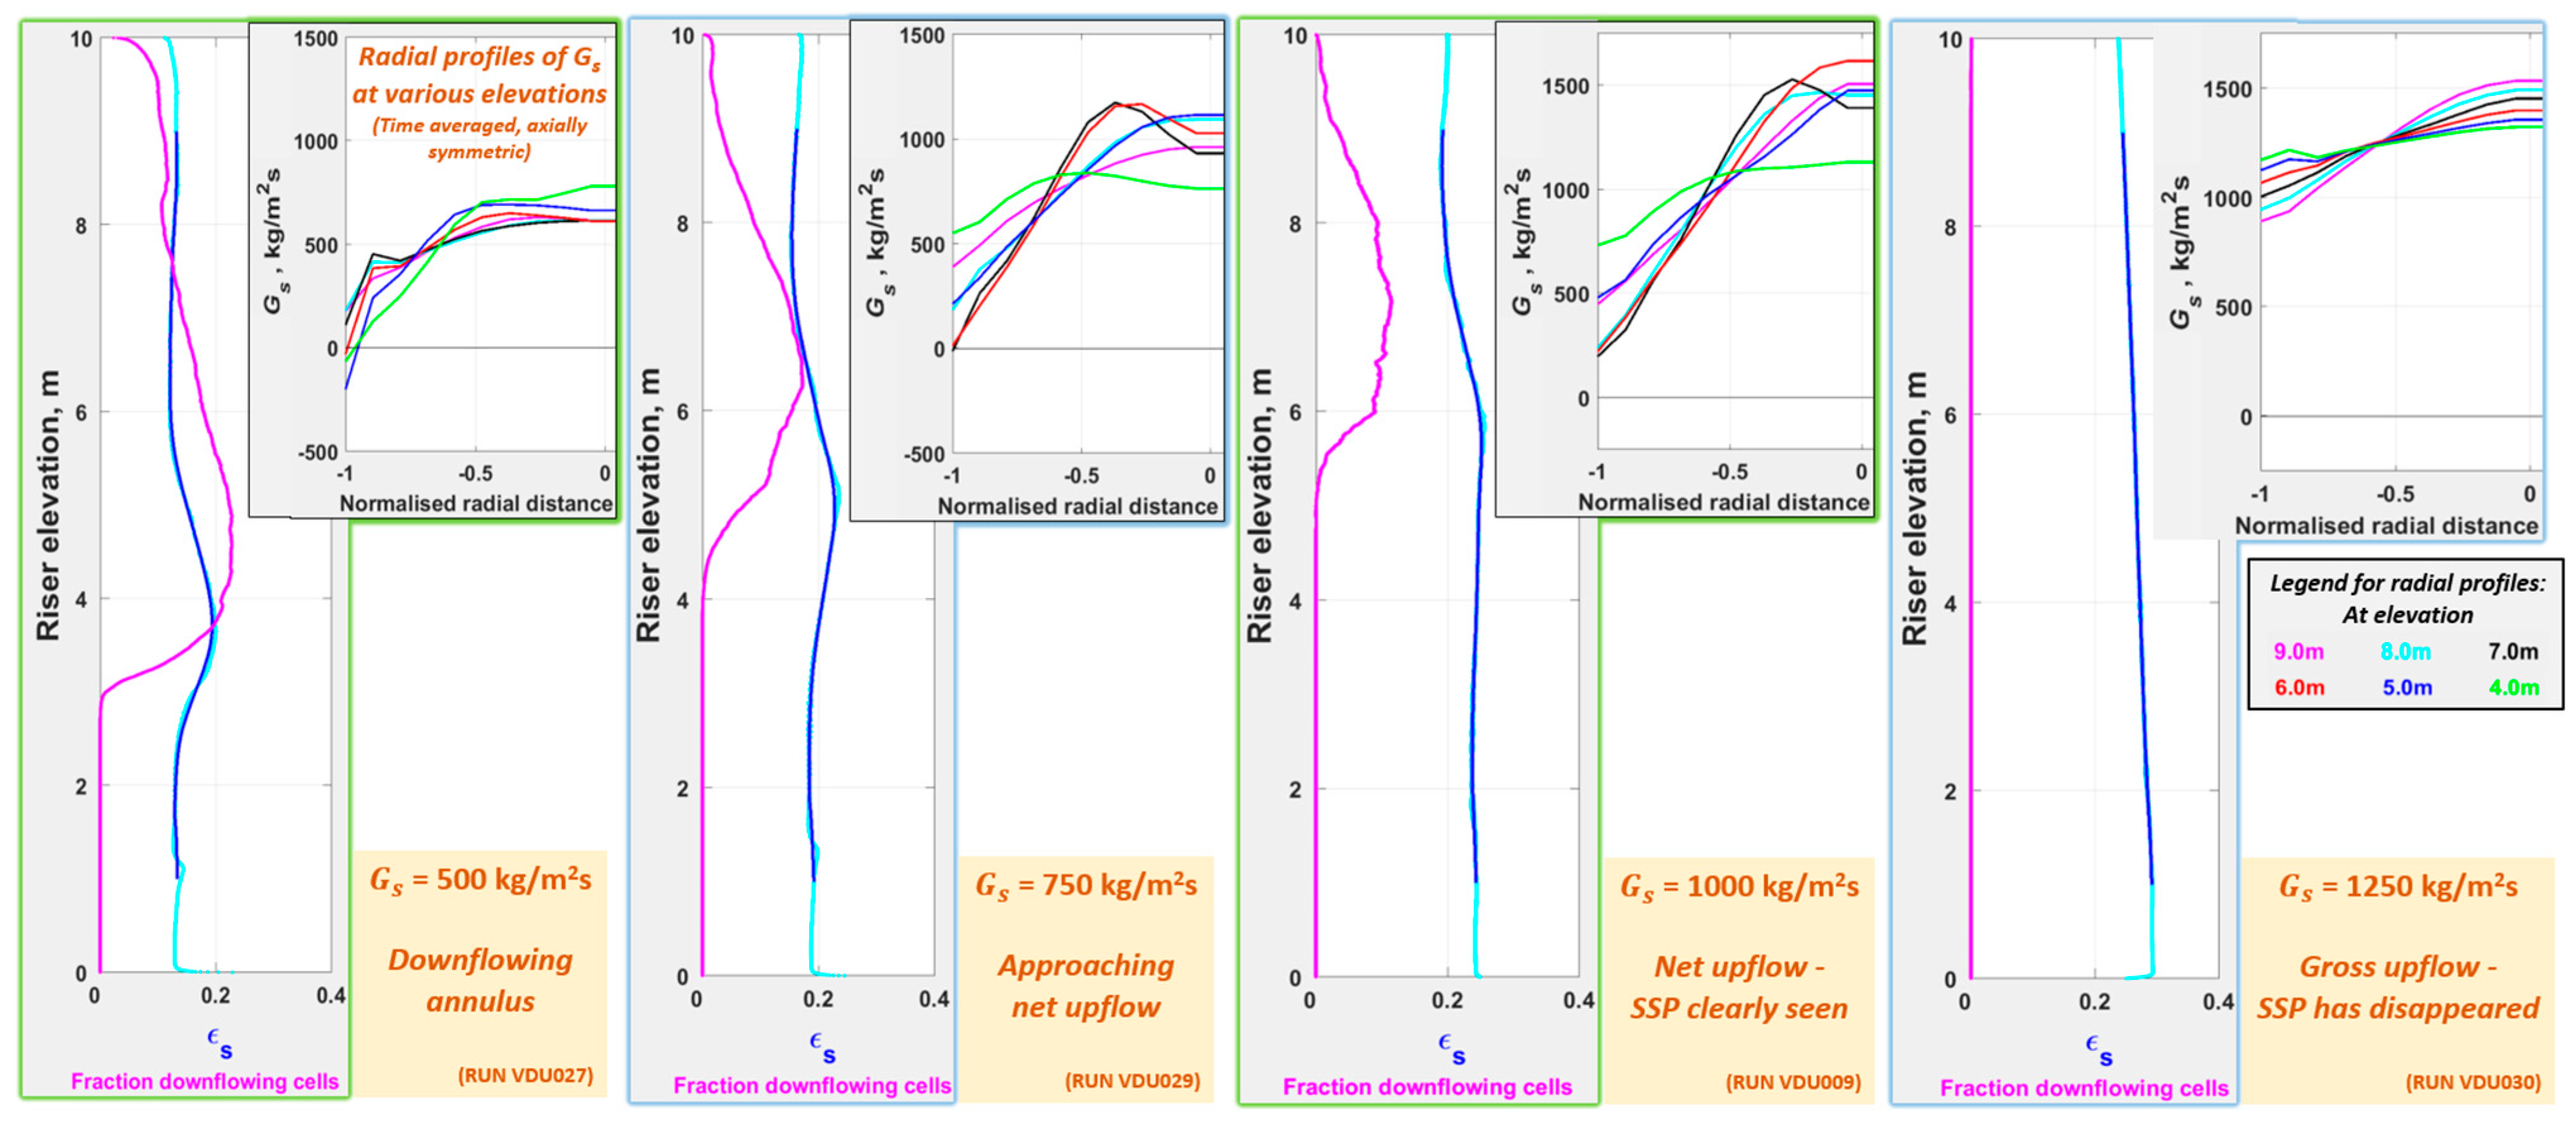
- Some researchers, for example, [4,53] do not recognize DSU as a separate flow regime, as it has not hitherto been defined based on clear transitions in the behavior of the flow field. Therefore, it was intended to explore whether the transitions to DSU can be perceived from the trend in any of the distributed parameters as the flow field changes.
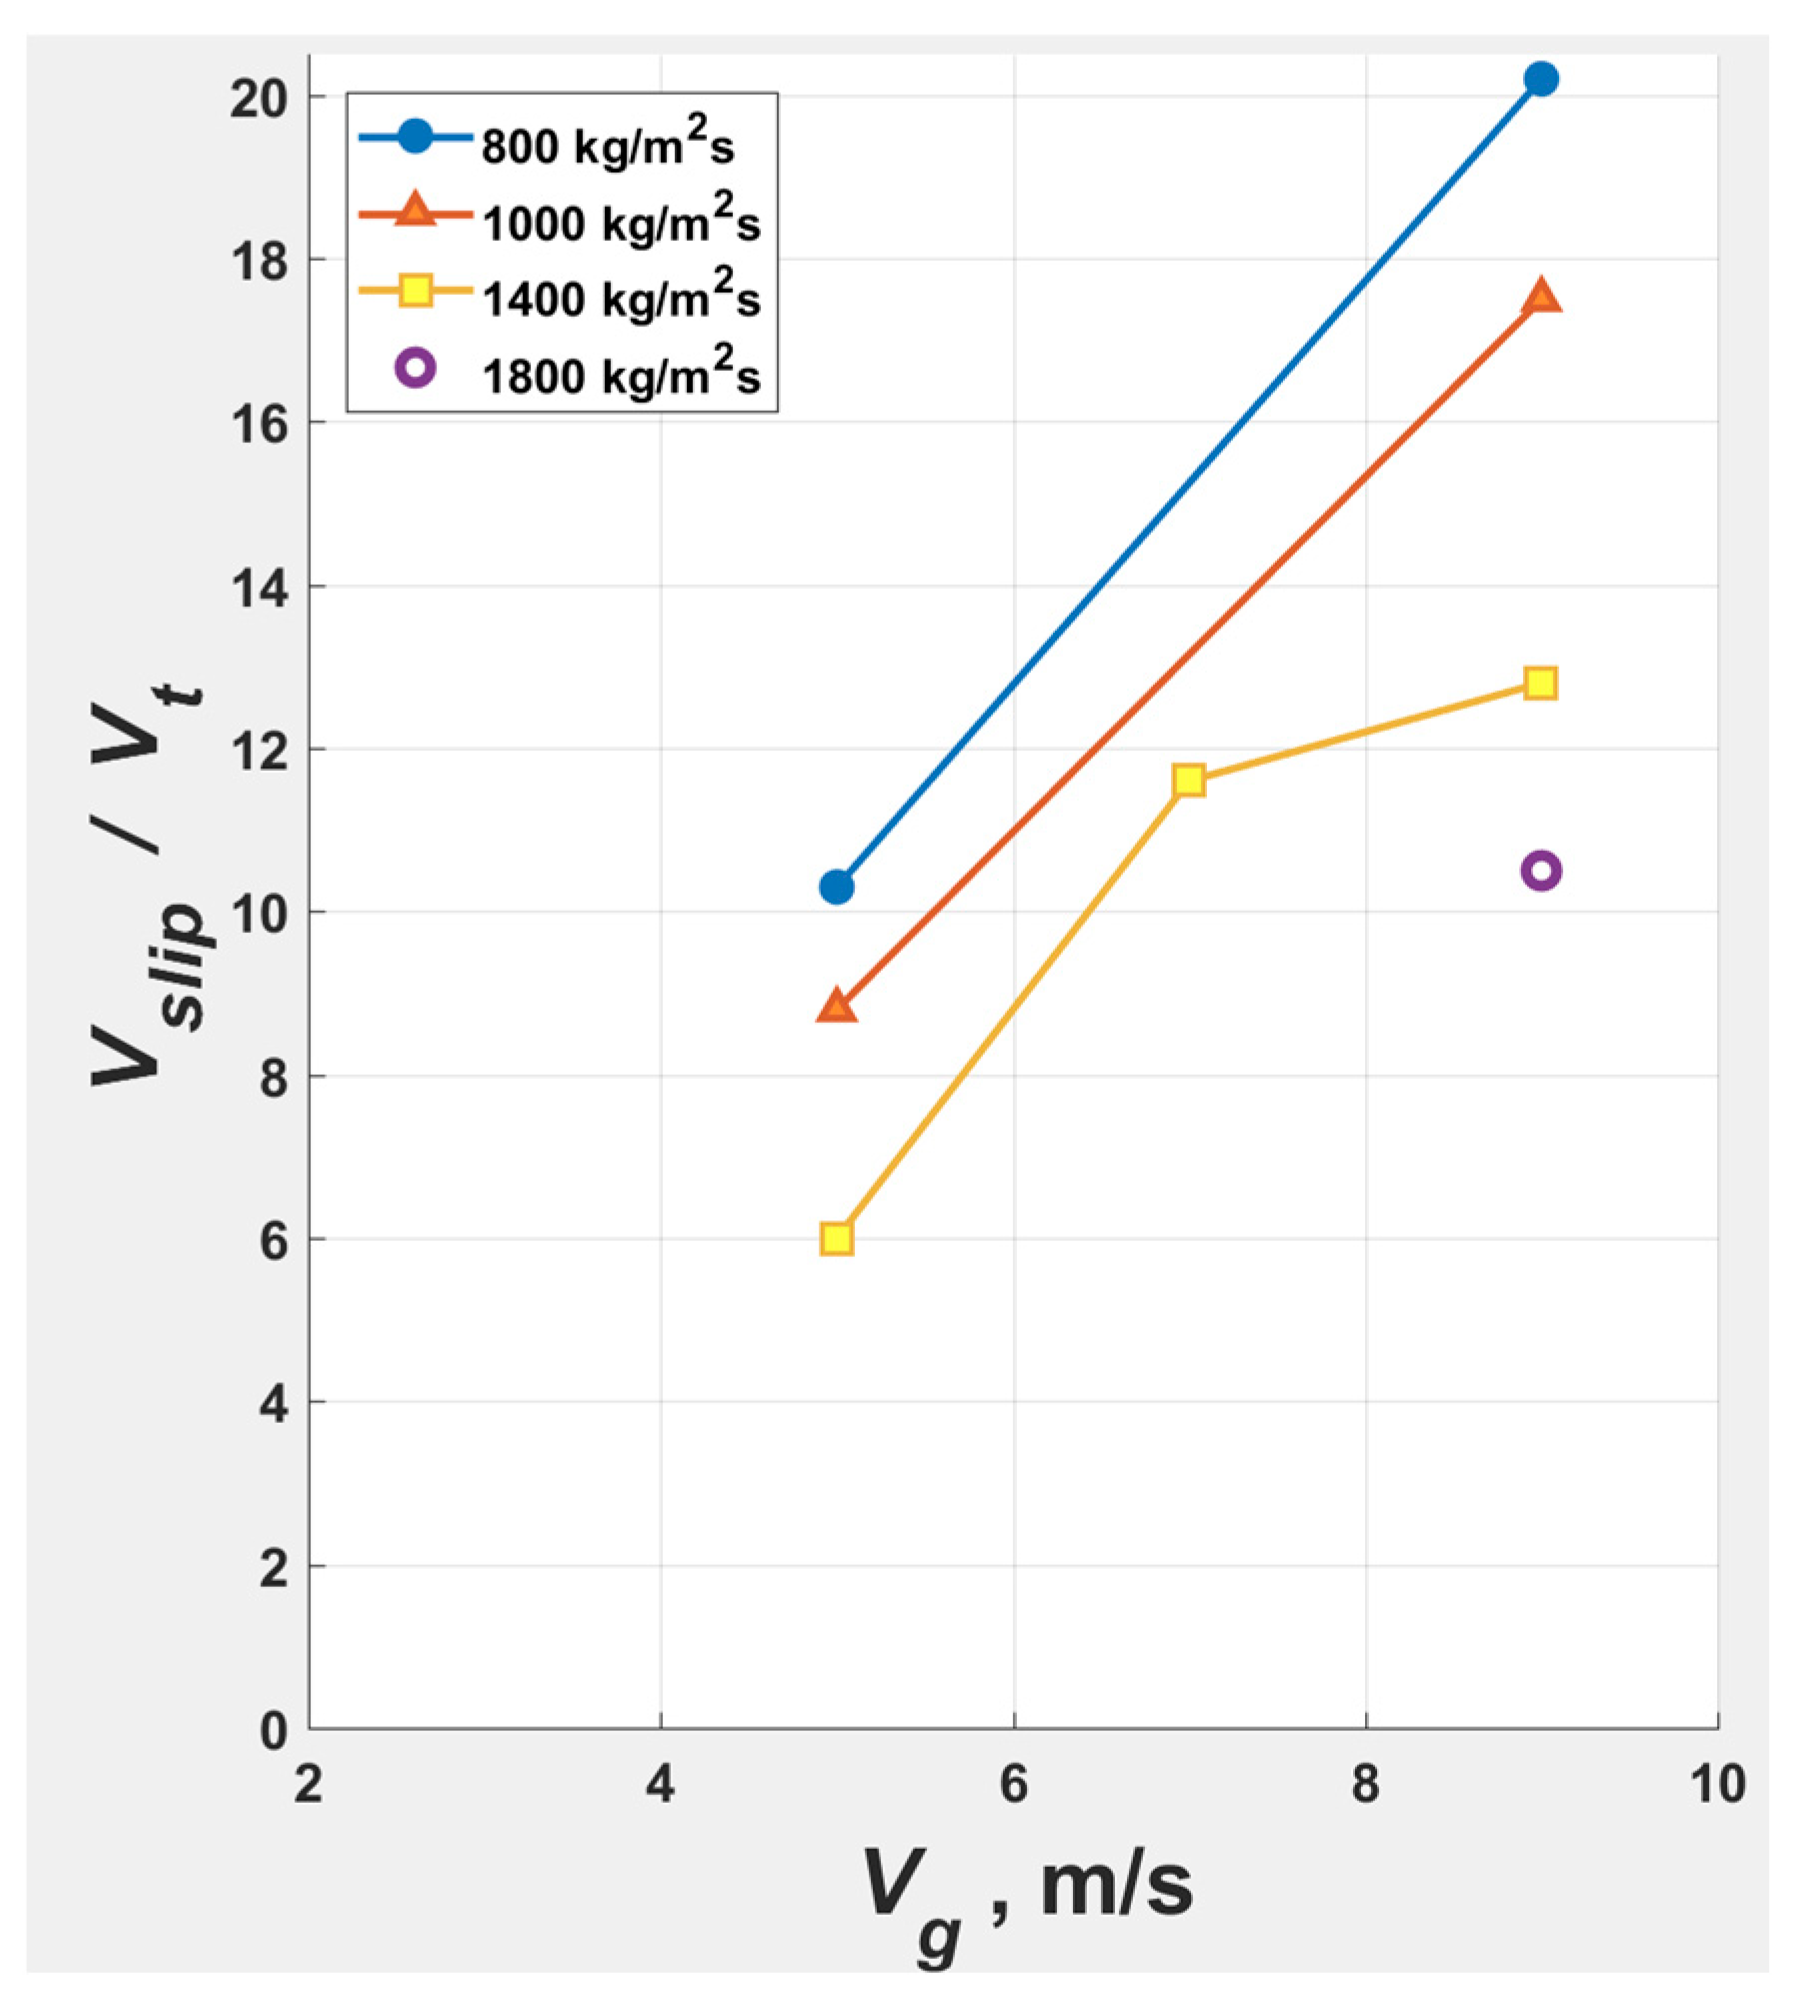
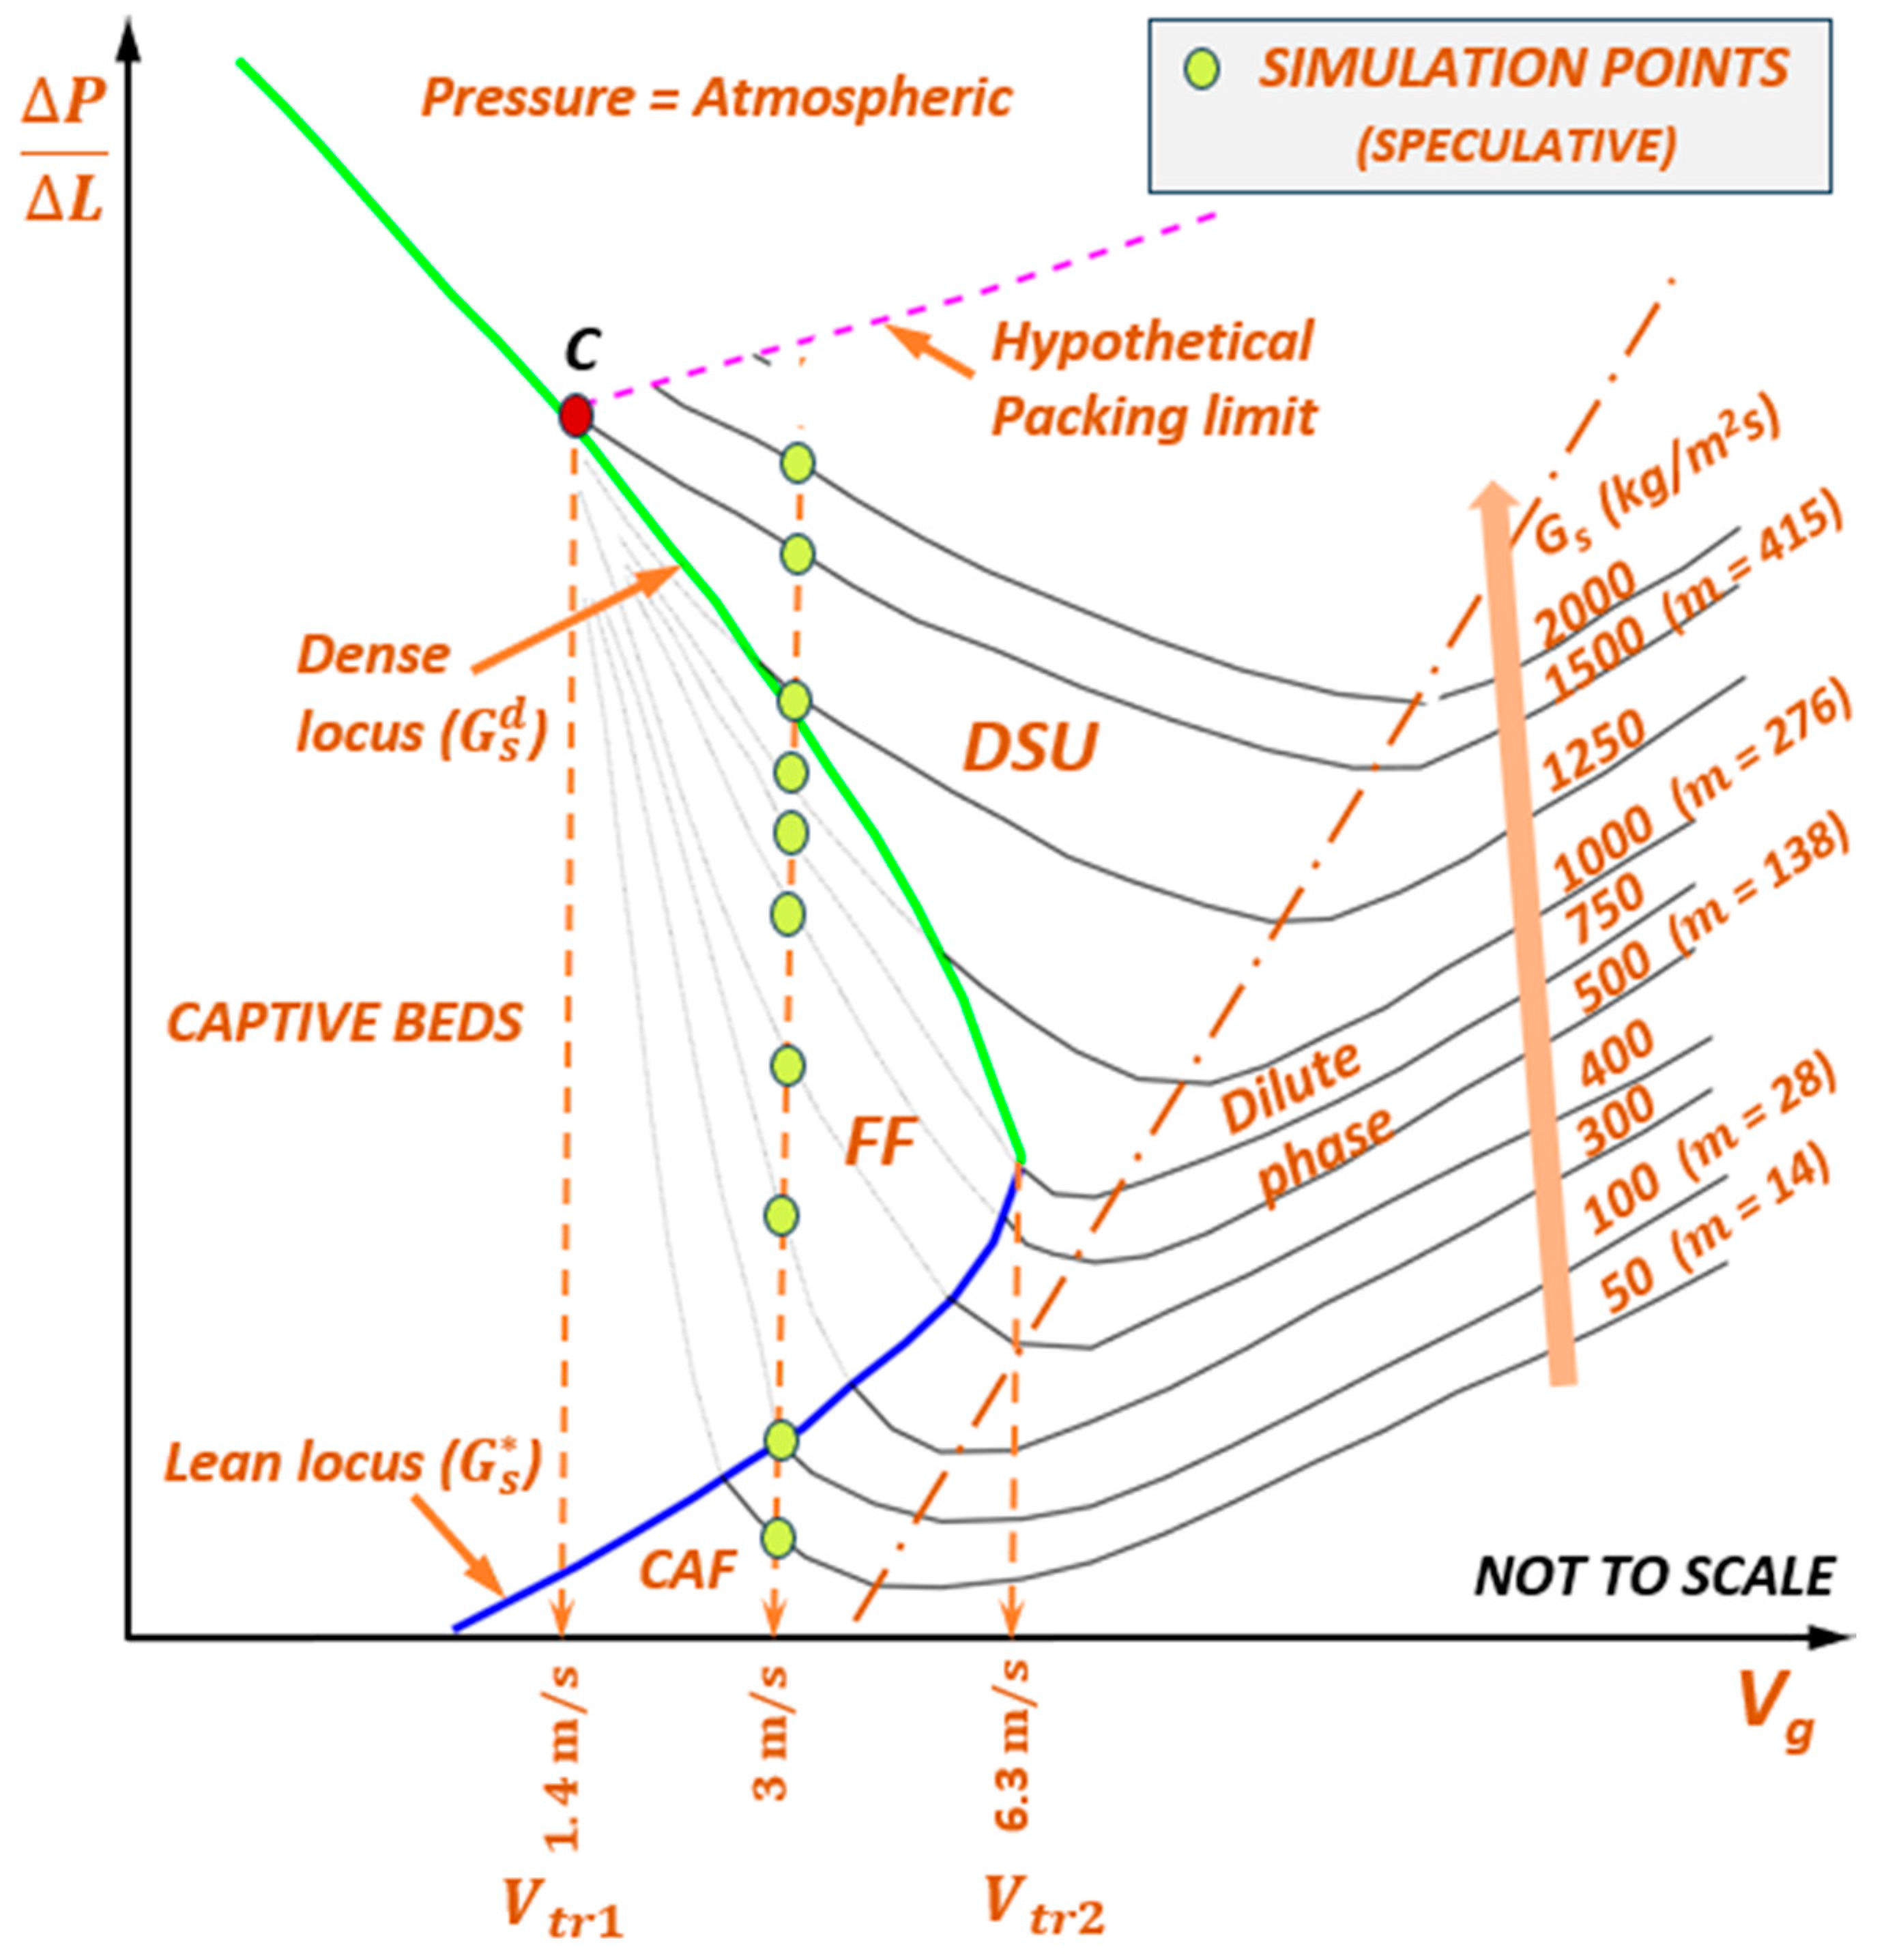
- The phase map in Figure 4 considers the criterion of Li and Kwauk [14] (based on vertical upflow experiments in straight pipes of uniform circular cross-section), which is the disappearance of SSP, for the transition from FF to DSU. The experiment of Wang et al. [16] suggests that, at , SSP most probably disappears at , when the riser attains gross upflow with little backmixing. However, there is some uncertainty in the axial profiles reported in [16] that needed clarification: the riser having attained , for example, at = 1400 kg/m2s and = 9 m/s in the Figure 6(d) of [16], appeared to show backmixing at lower elevations at of 1800 kg/m2s; the backmixing was probably due to the riser being unable to sustain gross upflow with the increased feed of low-velocity solids that required acceleration.
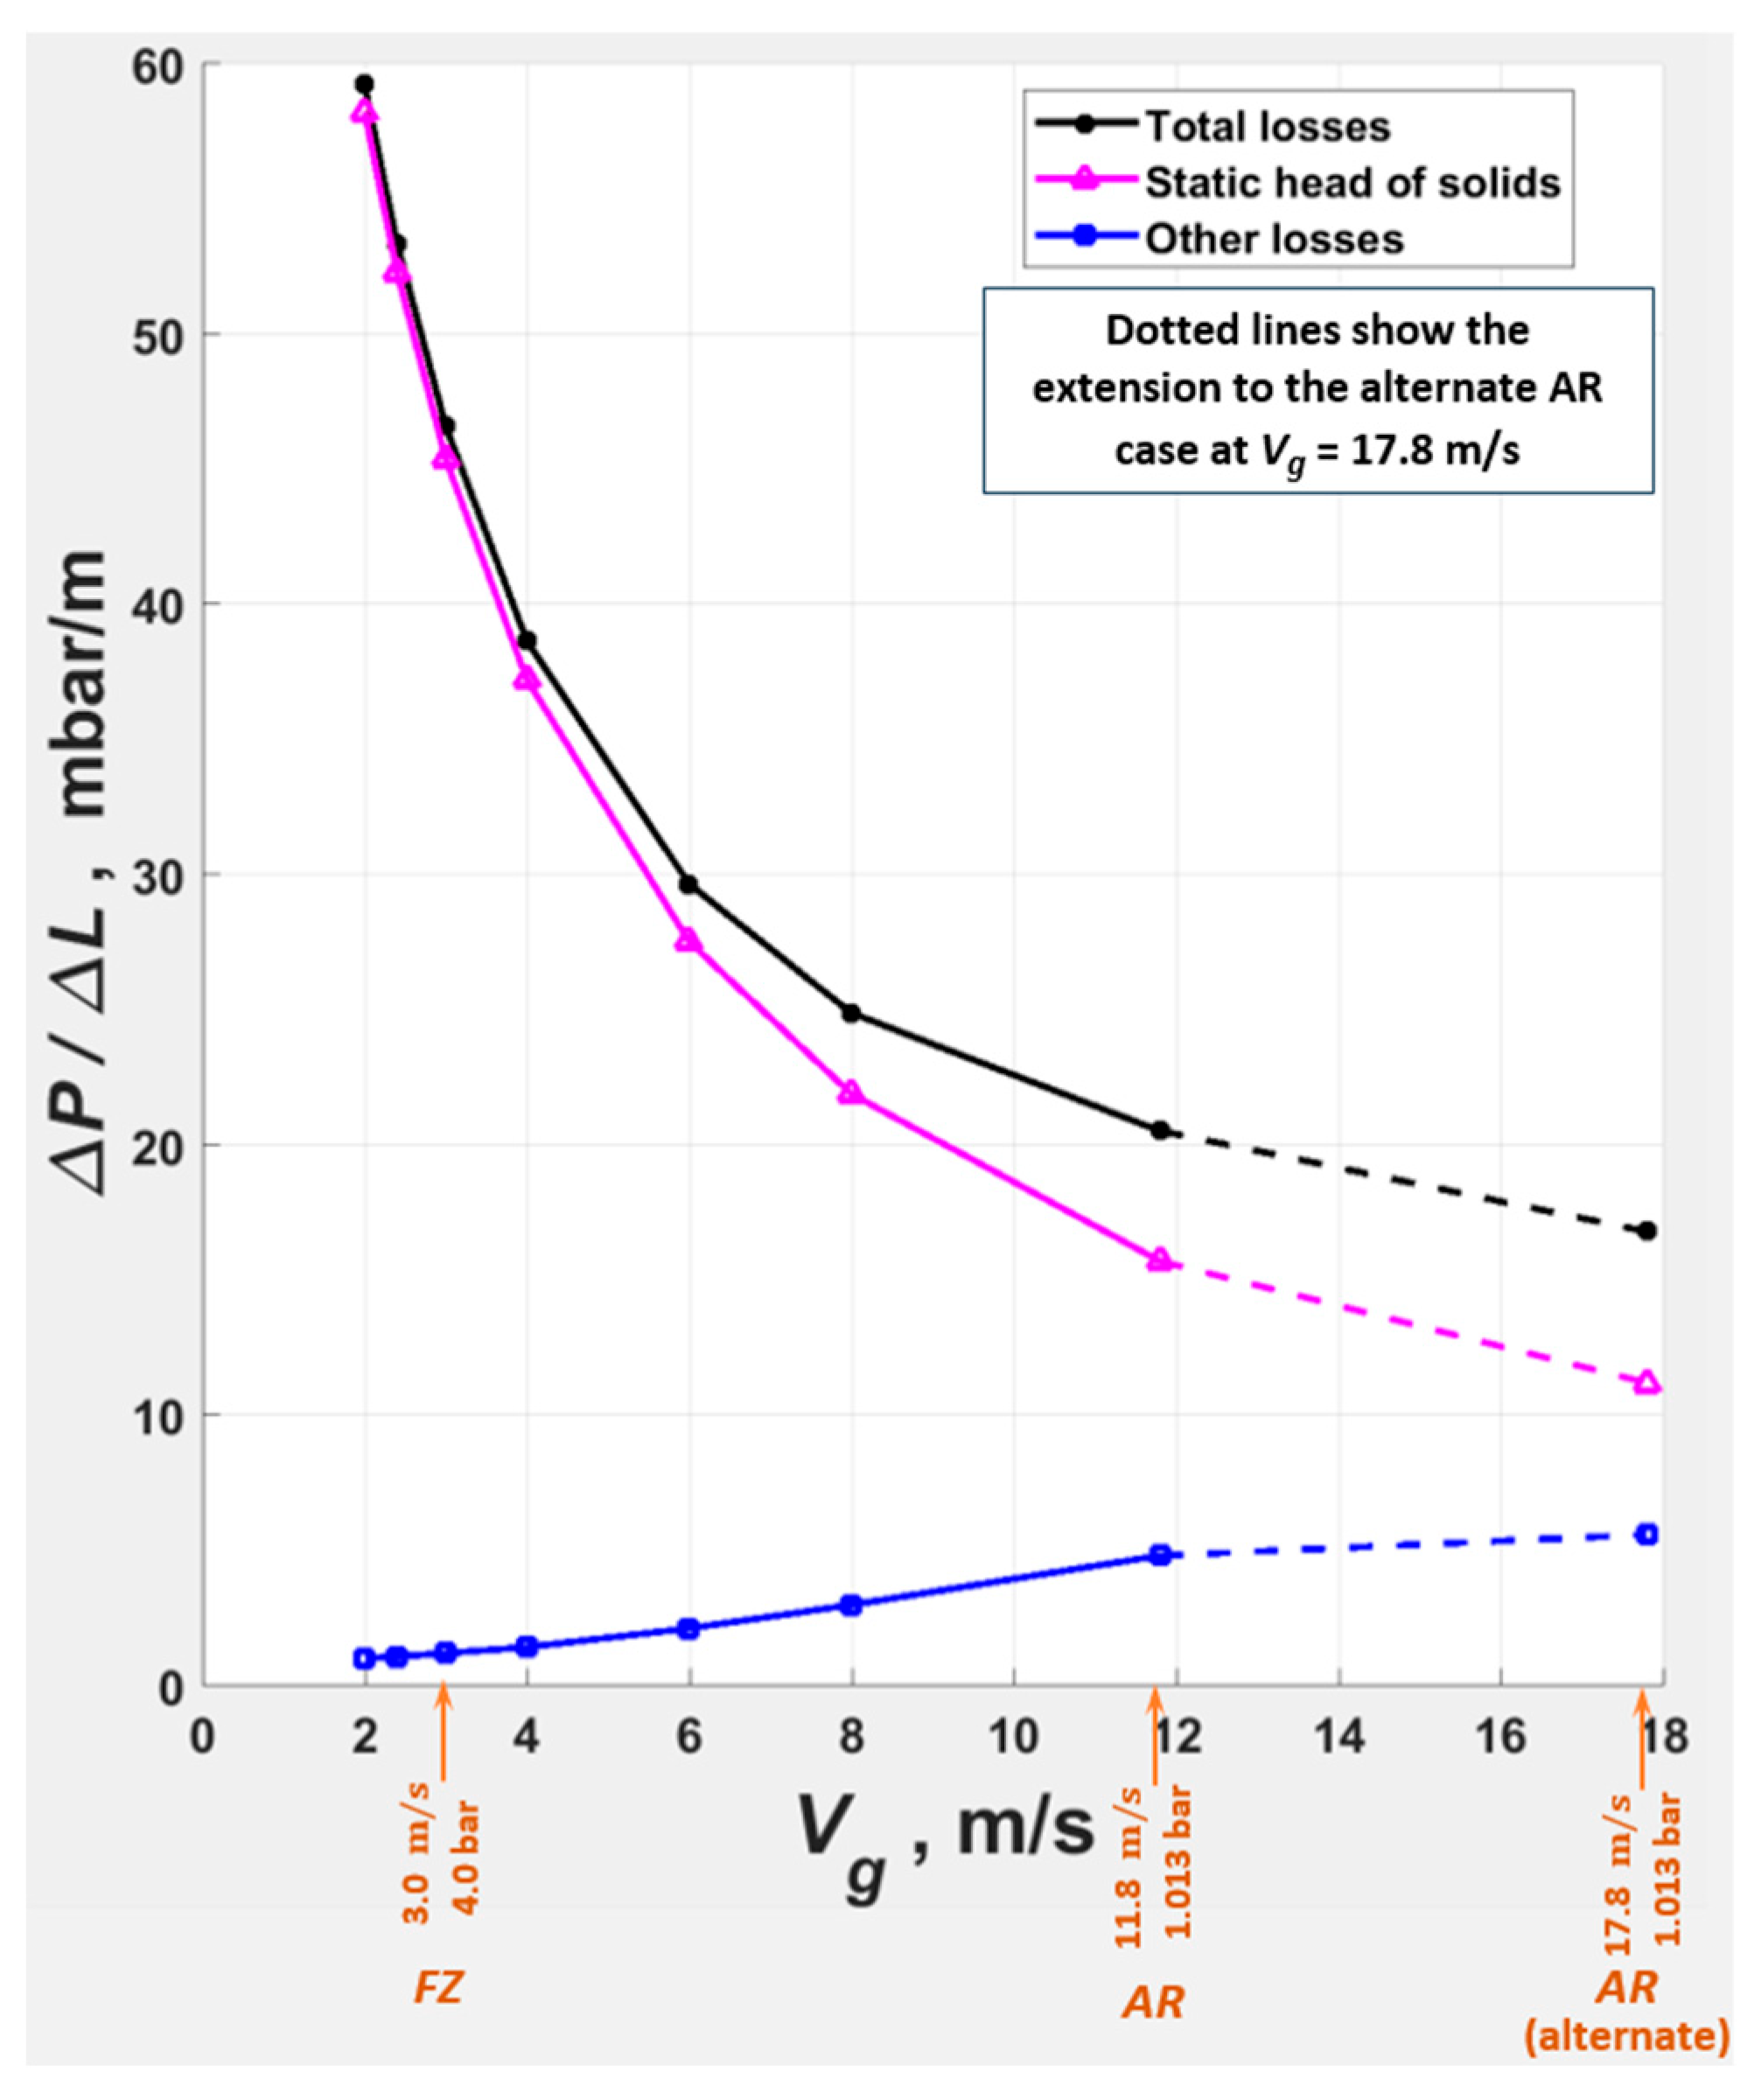
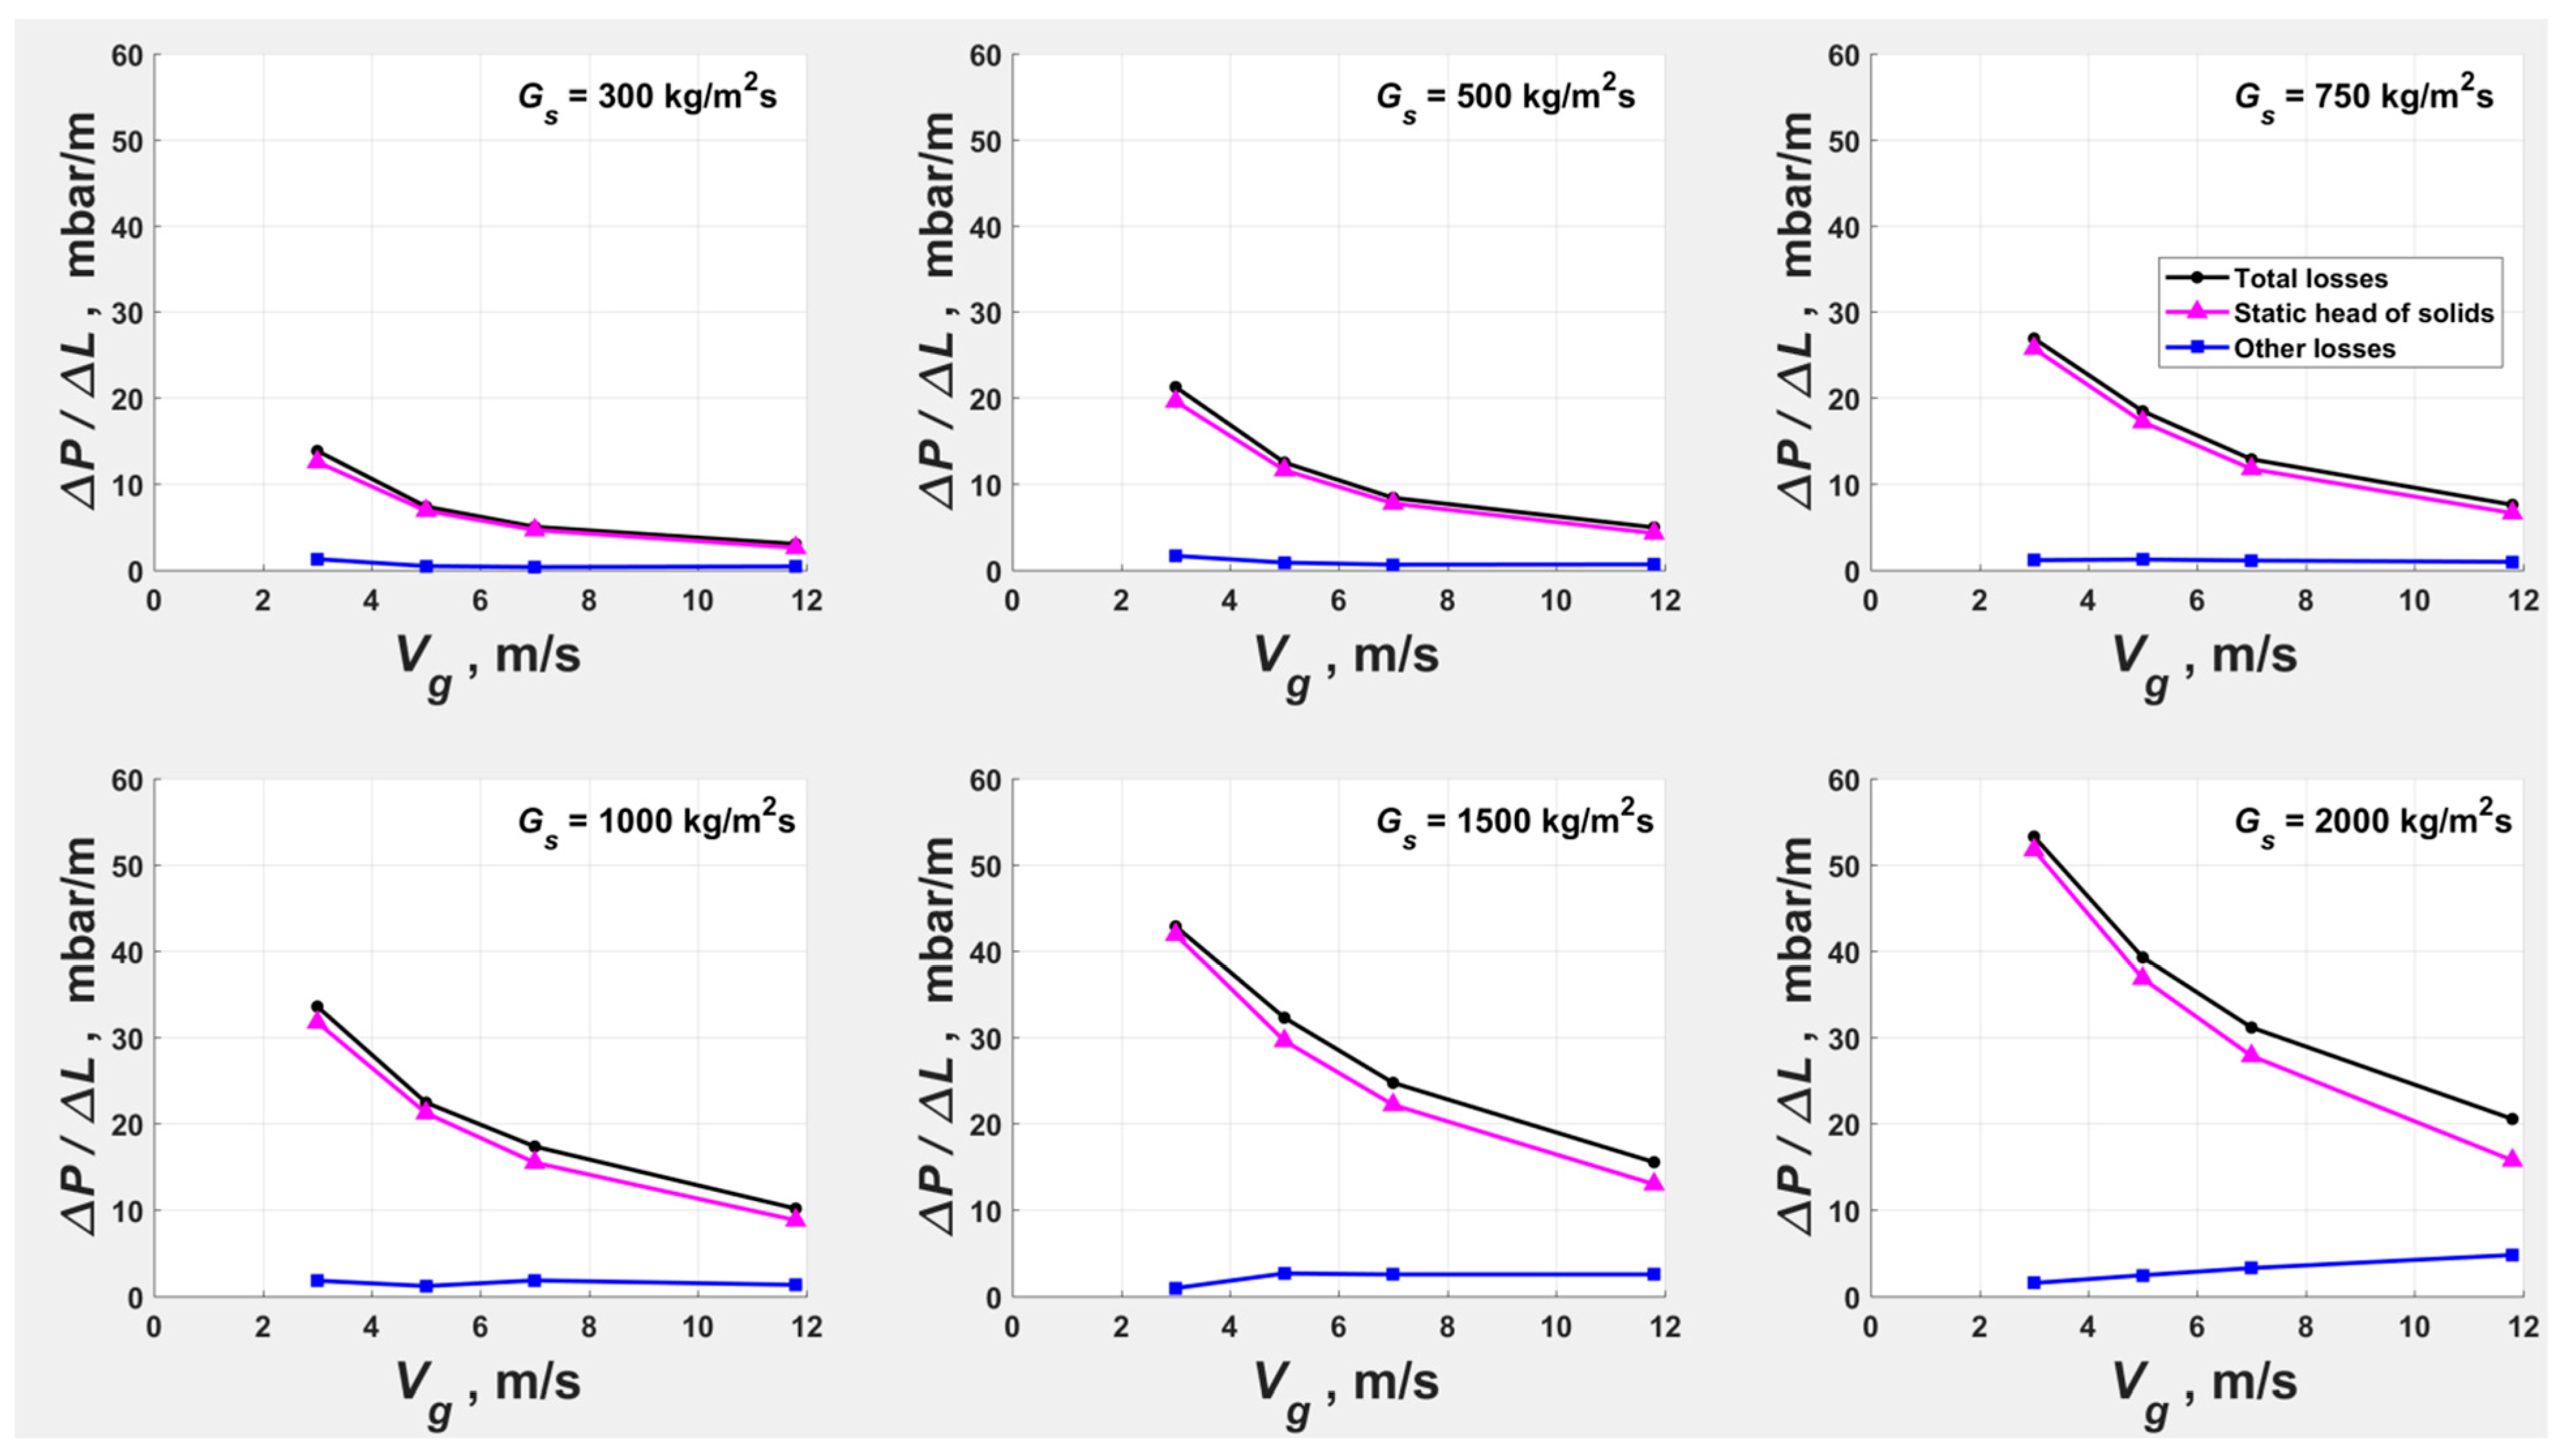
- Locus of is broadly accepted as the criterion for the dense–dilute transition at low [6,7] (wherein it is generally observed at 0.02). This criterion may be suitable at the high of DSU, too, at , considering that the static head of solids dominates at dense conditions (such as towards the FZ), and other losses take over at dilute conditions (such as near AR); however, this requires validation.
1.1.6. Slip Velocity
1.2. Study Objectives and Outline
- The transition from FF to DSU at , at a higher of 5 m/s.
- The transition from CAF to DSU at , at a of 7 m/s.
- The dense–dilute transition at , at = 11.8 and 17.8 m/s (i.e., at the same as the AR and alternate AR of the earlier work), but at lower .
2. Materials and Methods
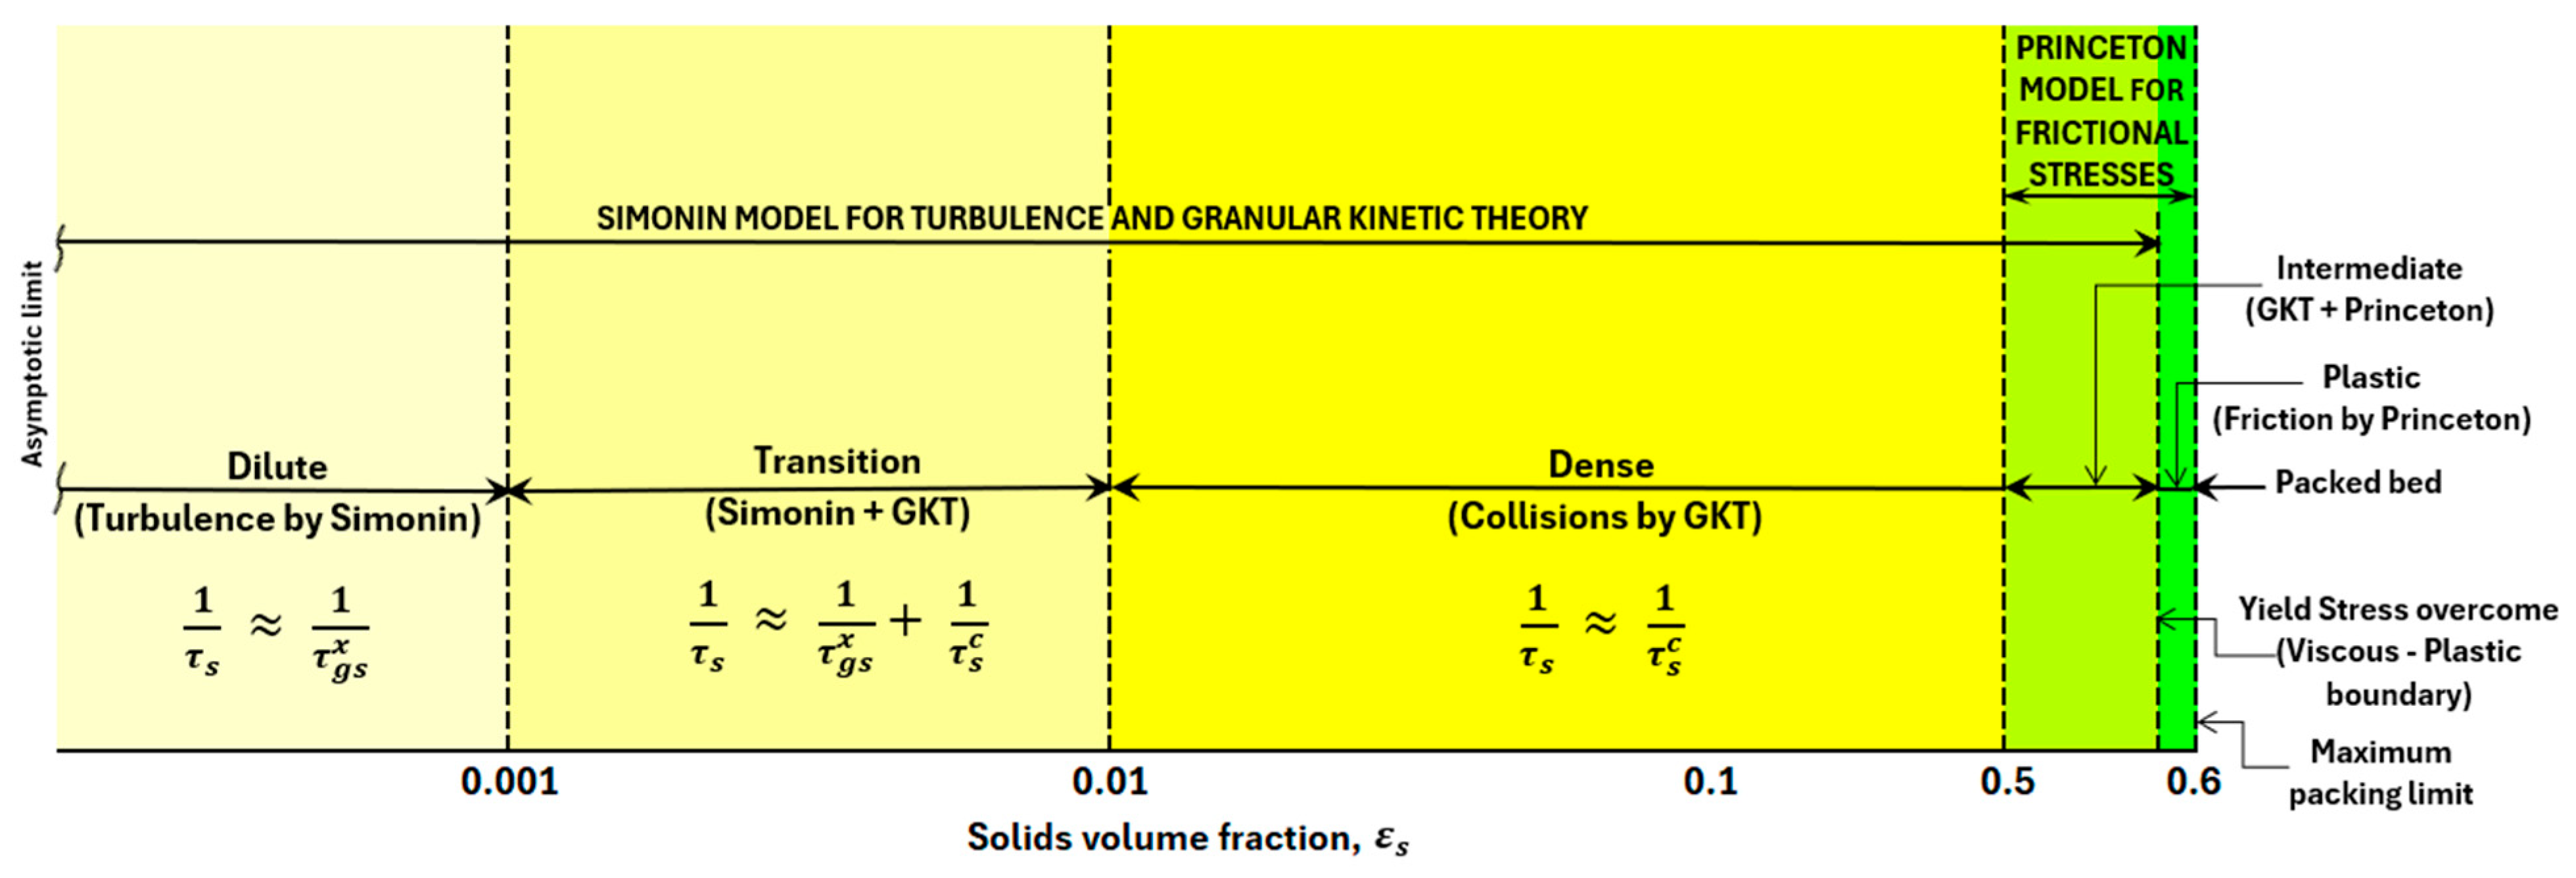
- The ‘Simonin, 1996’ viscous stress model [54,63,64,65] covers dilute turbulent through to the dense limit of the viscous regime by a dissipation time scale (), essentially a harmonic mean of collisional () and particle relaxation () time scales; the turbulence model of Simonin and the Granular Kinetic Theory are recovered at the dilute and dense limits, respectively (Figure 20).
- The turbulence model is essential for the turbulence model of Simonin; the code automatically uses the turbulence wall functions for the gas phase wall Boundary Conditions (BC) when the turbulence model is used.
- The Schiller and Naumann isolated sphere correlation used in the MFiX-TFM code for the Di Felice drag law was replaced with the Dalla Valle isolated sphere correlation, in line with Di Felice [67].
- Gas and solids flow rates specified for the mass inlet BC were steady and uniform across the inlet cross-section. was set at 1 × 10⁻⁸ m2/s2 at the BC and and at 0.01 m2/s2 and 0.1 m2/s3, respectively.
- A constant pressure was specified for the pressure outlet BC.
| Description | Option | Remarks |
|---|---|---|
| MFiX version | 22.3.1 | [70] |
| Viscous stress model | Simonin, 1996 | [54,63,64,65] |
| Turbulence model | ||
| Frictional stress model | Princeton | [66] |
| for frictional stresses | 0.5 | Model default |
| Drag model | Di Felice | [67] |
| Radial distribution function | Carnahan—Starling | Code default |
| Conveying medium | Air at 20 °C | |
| Air density | Ideal gas law | |
| Inlet—Outlet BC | Mass Inlet—Pressure Outlet | |
| Wall BC for gas phase | No-slip wall (Wall functions) | |
| Wall BC for solids phase | Free-slip wall | |
| Initial conditions | and all velocities set to zero) |
- Although atypical, a monodisperse powder was chosen, as polydisperse powders, which are typically modeled as multiple solid phases of monodisperse powders, increase the computational load and model complexity.
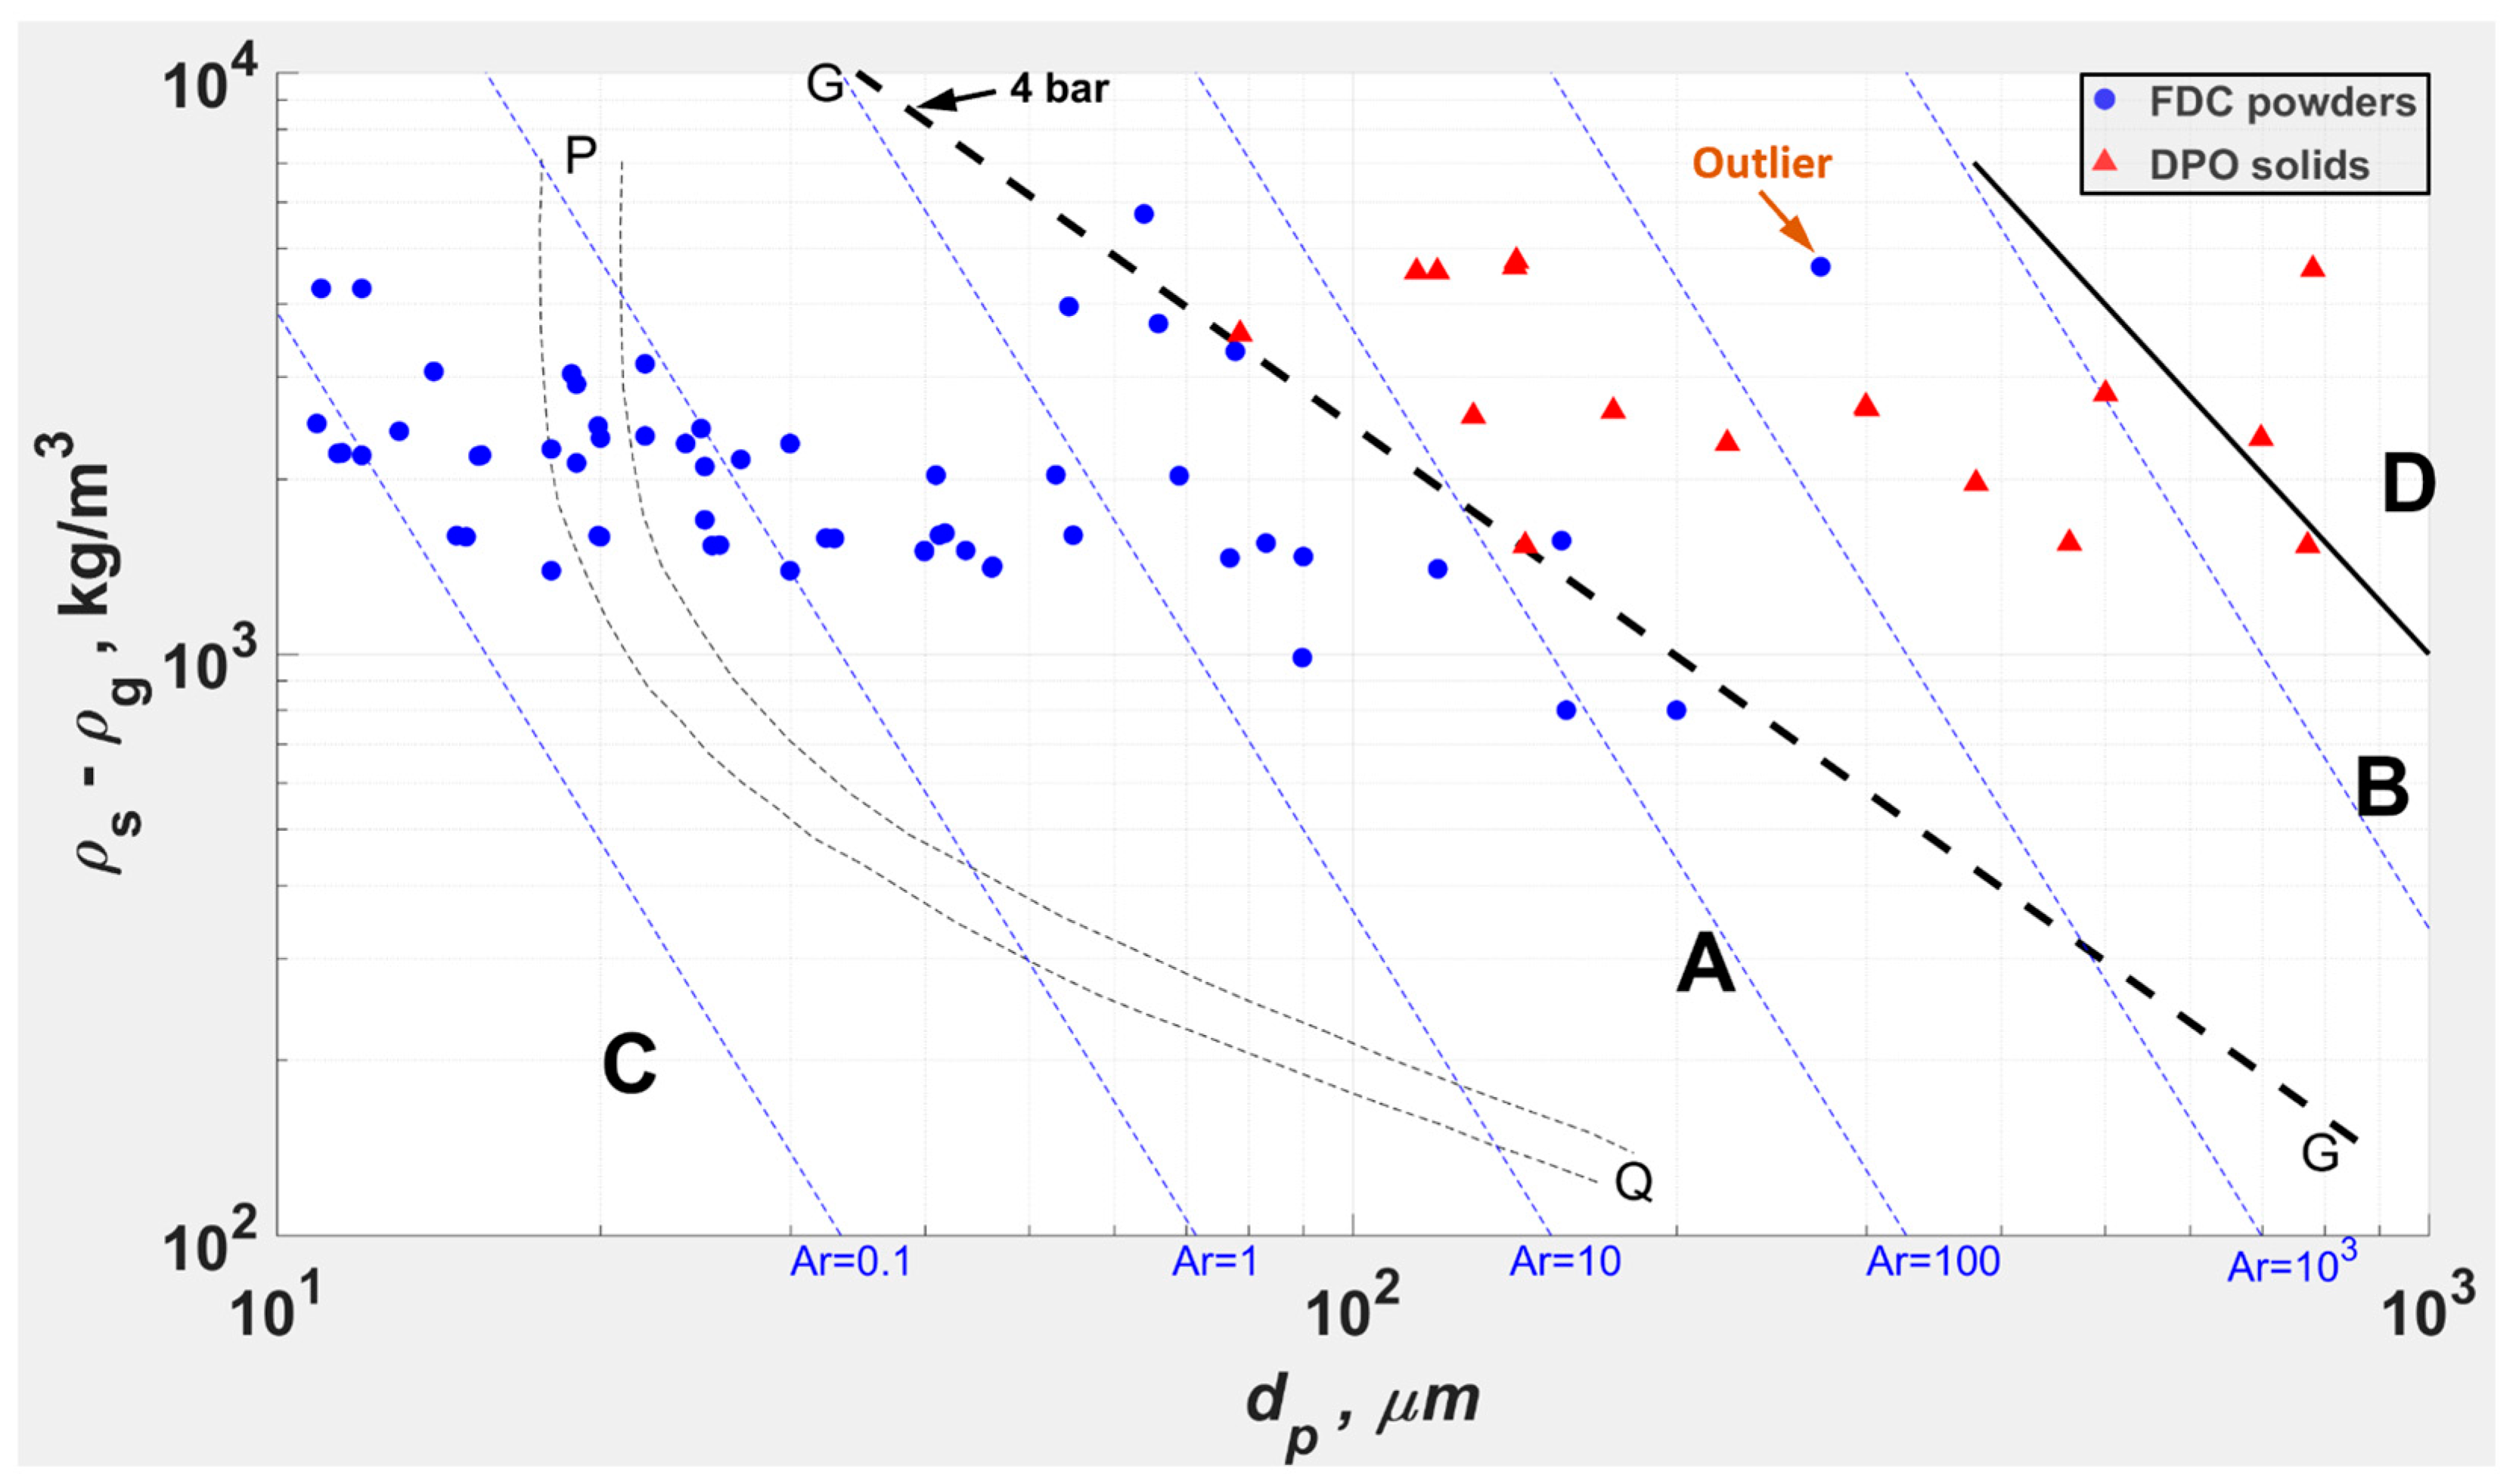
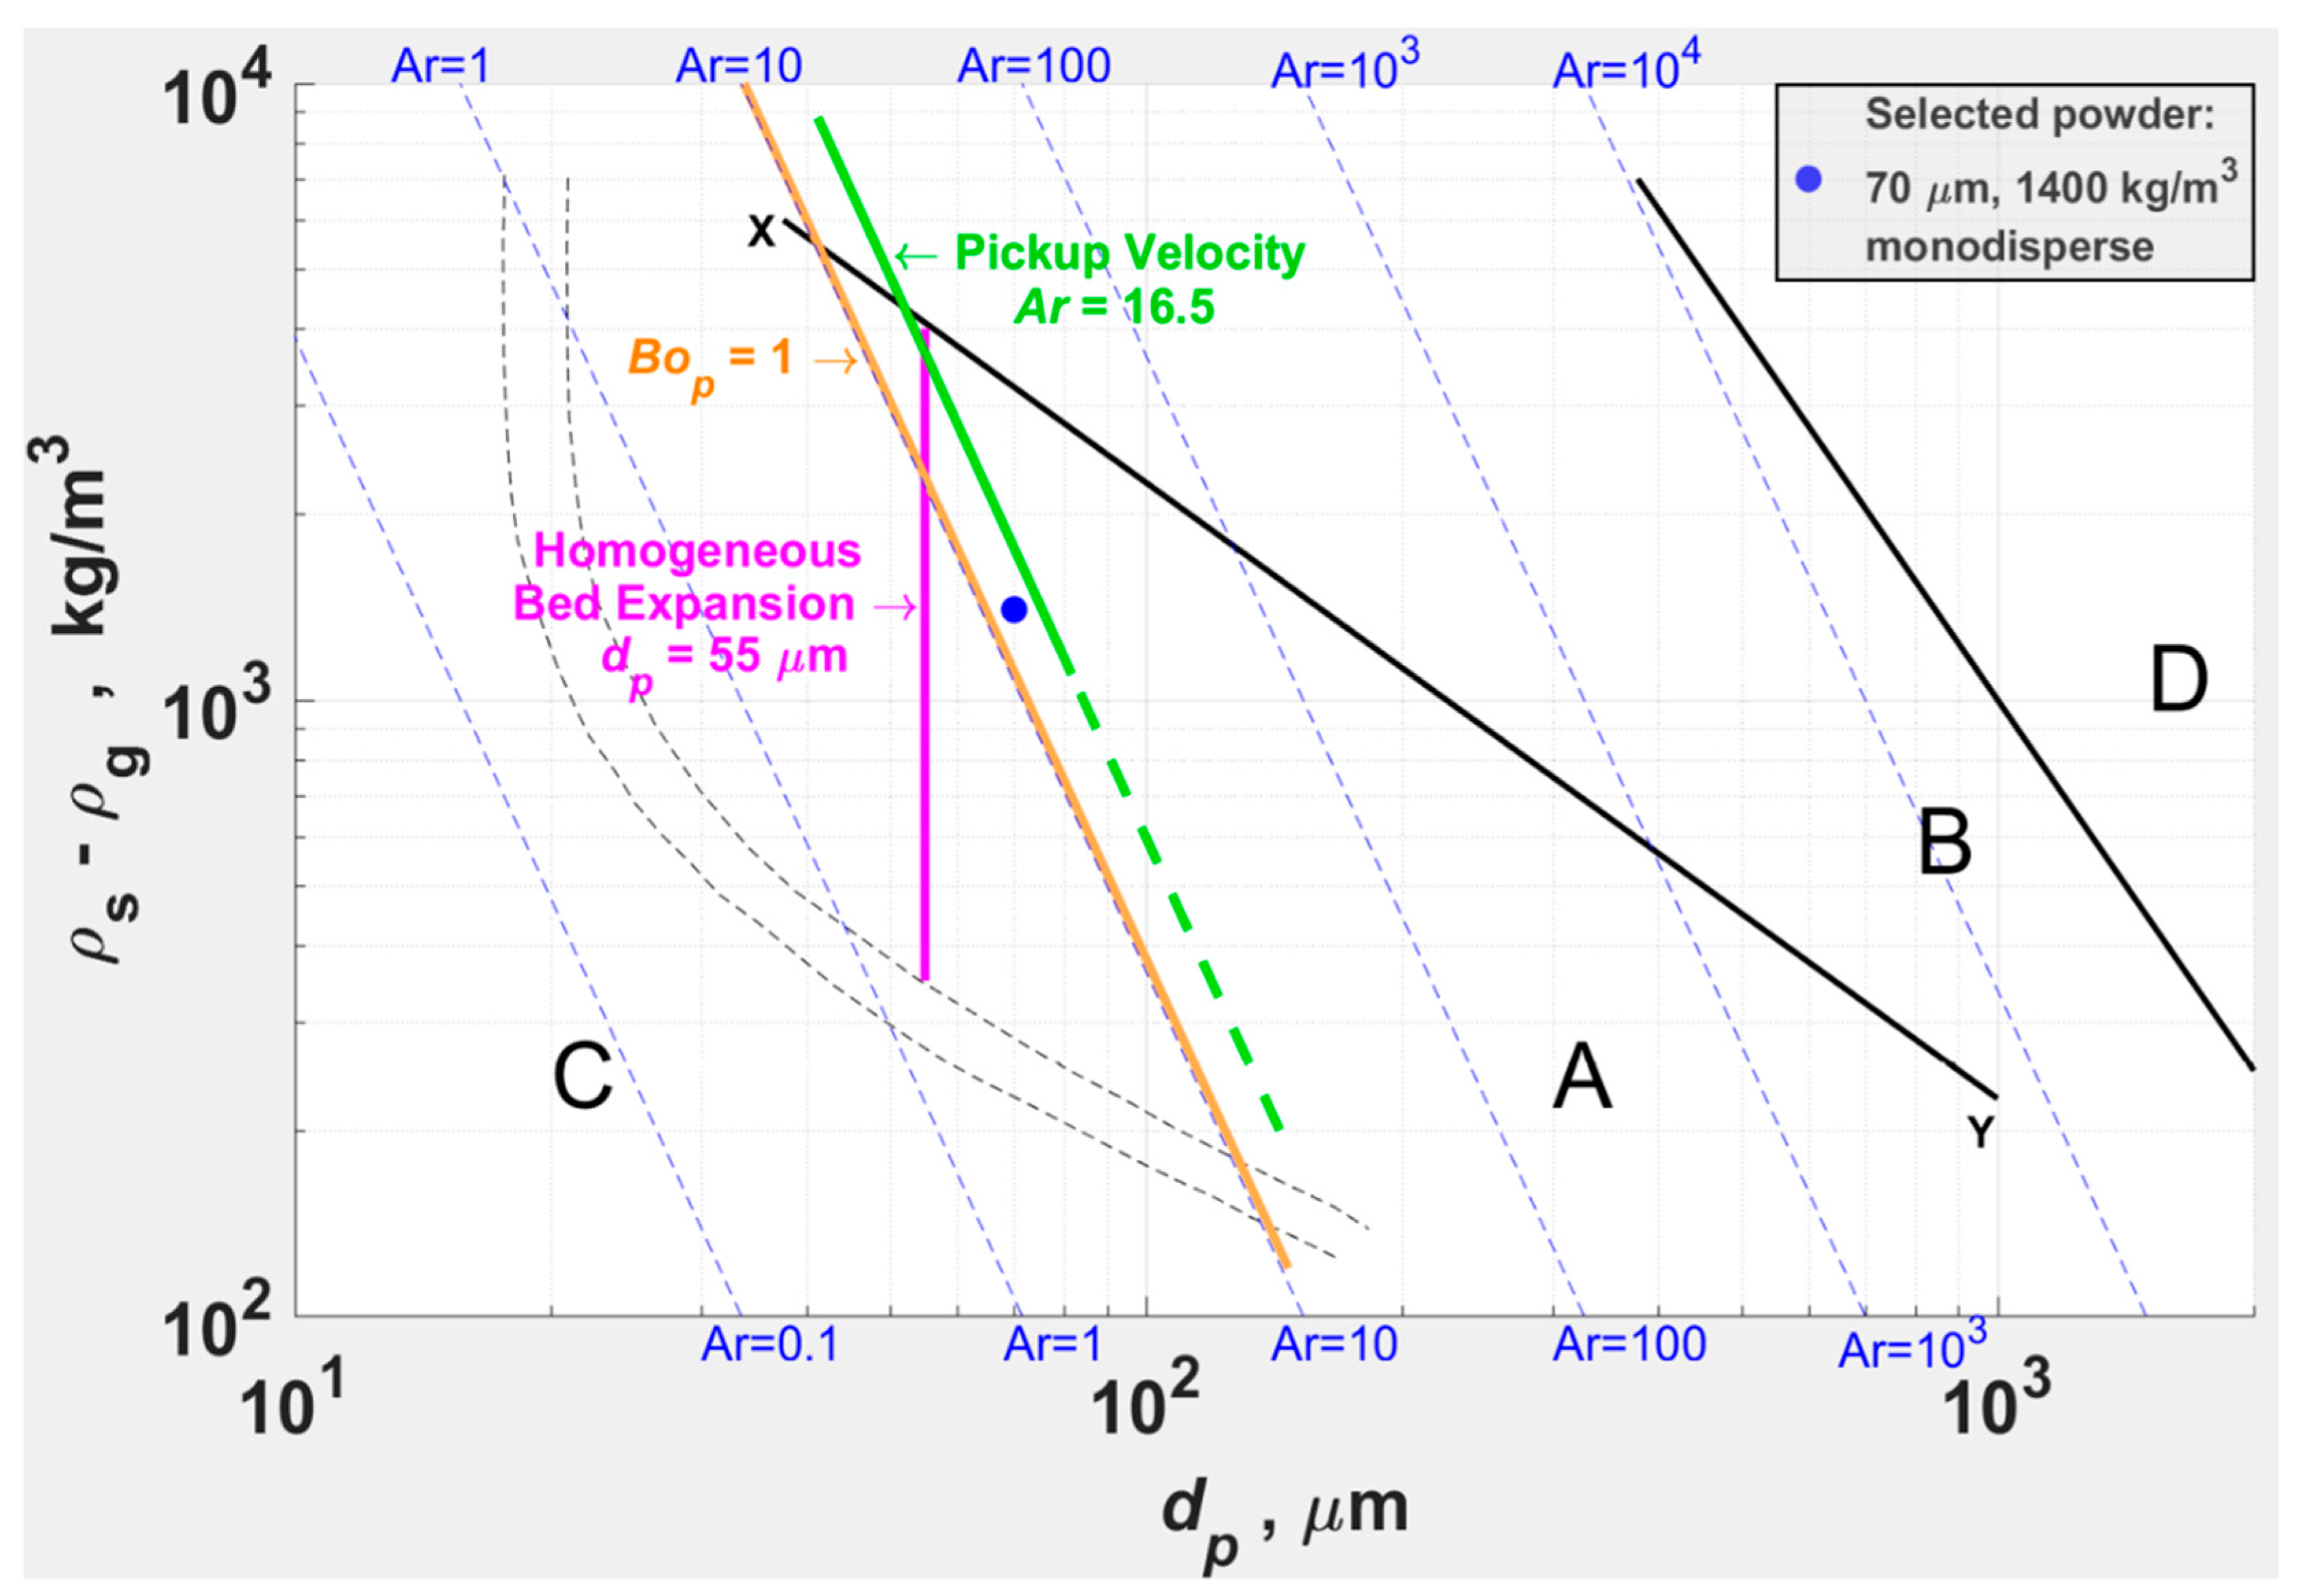
- Geldart A powders close to the A-B boundary may tend to Geldart B unless they are wide in PSD, including significant [3,71]. As it was opted to model a monodisperse powder with dominant gravity over , the powder had to be low in and to be sufficiently away from the A-B boundary and to clearly classify as Geldart A.
- Within the computing means, it may not have been possible to model a finer and/or polydisperse powder with significant , even if a model had been readily available. With the requirement for the cell size () ~ 10 for reliable predictions, computational load increases significantly with decreasing .
- The selected and correspond to typical FCC powders for which resolved CFB data was widely reported, including those at high (e.g., [6,16,19]), to enable model validation. However, the model validation [10] (pp. 252–267) was based on the shapes and trends in the radial profiles of and since a one-to-one correspondence cannot be expected between the monodisperse powder modeled and the experimental powders (polydisperse with significant ), and the differences between the numerical modeling and the experimental conditions (in , and ).
- Long-pipe models were used to capture the SSP of FF.
- Within the computing means, a Cartesian 2D slice through the axis models, with square cells of 29 for nominal grid and 14 for fine grid, were used.
- Nominal grid runs were used in general; confirmation runs at = 3 m/s were carried out with the fine grid.
- Tolerances for the nominal grid runs were the code defaults and were tightened by an order of magnitude for the fine grid runs.
- Simulation duration: Given the geometry and the relatively high and , that is, with little chance for dead pockets, initial transients were generally overcome within 2 residence times, as was verified by solids hold up and axial profiles. Data was averaged thereafter at 100 Hz over 5 s for the current study and over several residence times in the previous work for statistically steady results.
- Underrelaxation factors in Table 6 were optimized for the conditions by statistical experiments [10]. The results indicated that the problem of backflow observed frequently with pressure outlet BC may be overcome by setting the factors for the axial (V) momentum and turbulent kinetic energy at 1.0. Reasoning is intuitive: backflow may occur if the axial momentum is throttled relative to other factors.
- Parallel processing by Distributed Memory Parallel (DMP) was with maximum axial decomposition and no radial decomposition, for the geometry. Simulations were carried out in the Google Cloud with the Command Line Interface. Visualization and post-processing were carried out on the desktop, largely by the open-source VisIt software (version 3.1.4) and MATLAB (version R2017a/R2023b).
| Description | Vertical Upflow—Nominal Grid | Vertical Upflow—Fine Grid | ||
|---|---|---|---|---|
| Pipeline (riser) diameter | m | 0.04 | 0.04 | |
| Pipeline (riser) length: | m | |||
| = 3 m/s cases | 10.0 | 9.999 | ||
| > 3 m/s cases | 15.0 | -- | ||
| Coordinates | Cartesian 2D | Cartesian 2D | ||
| Grid: | ||||
| = 3 m/s cases | 20 × 5000 × 1 | 40 × 9999 × 1 | ||
| > 3 m/s cases | 20 × 7500 × 1 | -- | ||
| Cell size | m | 0.0020 | 0.0010 | |
| Cell size in particle diameters | 29 | 14 | ||
| Time step, maximum | s | 1 × 10⁻⁵–3 × 10⁻⁵ | 1 × 10⁻⁵ | |
| Parallel processing | ||||
| = 3 m/s cases | DMP (1-8-1) | DMP (1-16-1) | ||
| > 3 m/s cases | DMP (1-16-1) | -- | ||
| Spatial discretization | Superbee | Superbee | ||
| Temporal discretization | Implicit Euler | Implicit Euler | ||
| Underrelaxation Factor | Code Default | Selected | |
|---|---|---|---|
| UR_FAC(1) | Gas pressure | 0.8 | 0.8 |
| UR_FAC(2) | ) | 0.5 | 1.0 # |
| UR_FAC(3 & 5) | Radial (U & W) momentums | 0.5 | 0.5 |
| UR_FAC(4) | Axial (V) momentum | 0.5 | 1.0 |
| UR_FAC(8) | ) | 0.5 | 0.5 |
| UR_FAC(9) | & ) | 0.8 | 1.0 |
- Whereas typical SCA powders are polydisperse, containing significant , the modeled powder is monodisperse.Potential effects of PSD are as follows:
- -
- Widening the PSD with increasing results in (a) increased homogeneous bed expansion () [38,78]; (b) higher emulsion phase voidage [78] and smaller bubbles in bubbling beds [79]; and (c) lower [40] and [43]. While the influence of at higher , that is, under homogeneous bed expansion and bubbling beds, may be attributed to increased interparticle forces due to the increased interparticle contacts [71], that at lower , that is, the reduction in and , may be attributed to lower ‘effective cluster terminal velocity’ and hence a higher entrainment rate [18].
- -
- Closer to the A-B boundary, when considering a powder of negligible such that gravity is dominant over , widening the PSD, even without increasing , enhances Geldart A behavior due to the suppression of bubbles for the decreasing (per the criterion of Harrison et al. (1961), cited in [29], for bubble stability in liquid fluidized beds).
- A cohesion model for is not included. As discussed above, the modeled powder has dominant gravity over and a cohesion model is not considered necessary. Note that a cohesion model is not available within the standard MFiX-TFM code, and it may not be possible to incorporate a finer or a polydisperse powder within the computing means.
- Other cohesion mechanisms, namely liquid bridges and electrostatic and magnetic forces, are excluded too, as they result in flow patterns that are significantly different from those of the powders affected by (and gravitational forces) alone (reviewed in [10] (pp. 66–71)) and may require specific cohesion models.
- -
- Electrostatic charging of dry dielectric powders in gas–solids systems occurs mainly by contact and friction (tribocharging). Significant charge transfer from the pipe wall, uneven charge distribution within the powder bulk, space charge effects, interactions with flow dynamics, and localized corona discharges can lead to a highly irregular distribution of electrostatic charges over time and space. This nonuniformity, often involving regions of opposite polarity, promotes powder sticking, agglomeration, or buildup along the pipe wall (e.g., [80,81]). Research is underway for incorporating electrostatic forces in numerical models [81].
- -
- Magnetic forces, depending on the degree of magnetization, can be much stronger and longer in range than ; however, the order of magnitude of weak magnetic materials such as magnetite is probably more relevant here [82], especially given that there is no applied external magnetic field [29]. Mills [3] has reported an iron powder that showed divergent constant pressure drop curves in the conveying characteristics, as against typical powders that show a pressure drop minimum.
- -
- Liquid bridges affect the flowability of powders in general, with progressive deterioration at relative humidity of the air (RH) > 50% [1,38]. Hydrophilic powders may be affected at an even lower RH due to ‘capillary condensation’, the formation of liquid menisci around surface asperities that are in (near) contact. A meniscus attracts the particles together due to ‘capillary force’, that is, surface tension and Laplace pressure; the force may magnify with a film of adsorbed moisture and in softer materials, also due to the plastic deformation of the surface asperities [83]. Research is underway for incorporating liquid bridges in numerical models (e.g., [84]).
- Interfacial forces other than drag (viz., virtual mass, history, spin lift, and slip–shear lift) are not incorporated. Amongst them, the slip–shear lift force can be notable under strong gradients in .
- Cartesian 2D coordinates were used. Gas–solids two-phase flow is inherently 3D, and 2D models do not accurately represent the geometry [85,86]; however, Cartesian 2D TFM models are well established to predict vertical upflow phenomena at relatively low computational cost (enabling long pipe models within the computing means). They may not be suitable for asymmetric flows (such as side inlet and outlet) [87]; however, it is not a limitation for a project with a full-bore inlet and outlet. They may not accurately predict axial pressure and radial voidage profiles simultaneously [86].
- Resolved TFM models use homogeneous drag laws, which consider uniform distribution of particles, while the actual distribution can be highly inhomogeneous at all spatiotemporal scales. As the gas tends to bypass the clusters under inhomogeneous conditions, the predicted drag can be significantly higher than the actual. Therefore, fine grids with a cell size ~ 10 are required for reliable predictions [54,85], and > 40 may even produce qualitatively incorrect results [54].
- Within the computing means, ~ 29 for nominal grid runs and ~14 for fine grid confirmation runs were used for our work.
3. Results
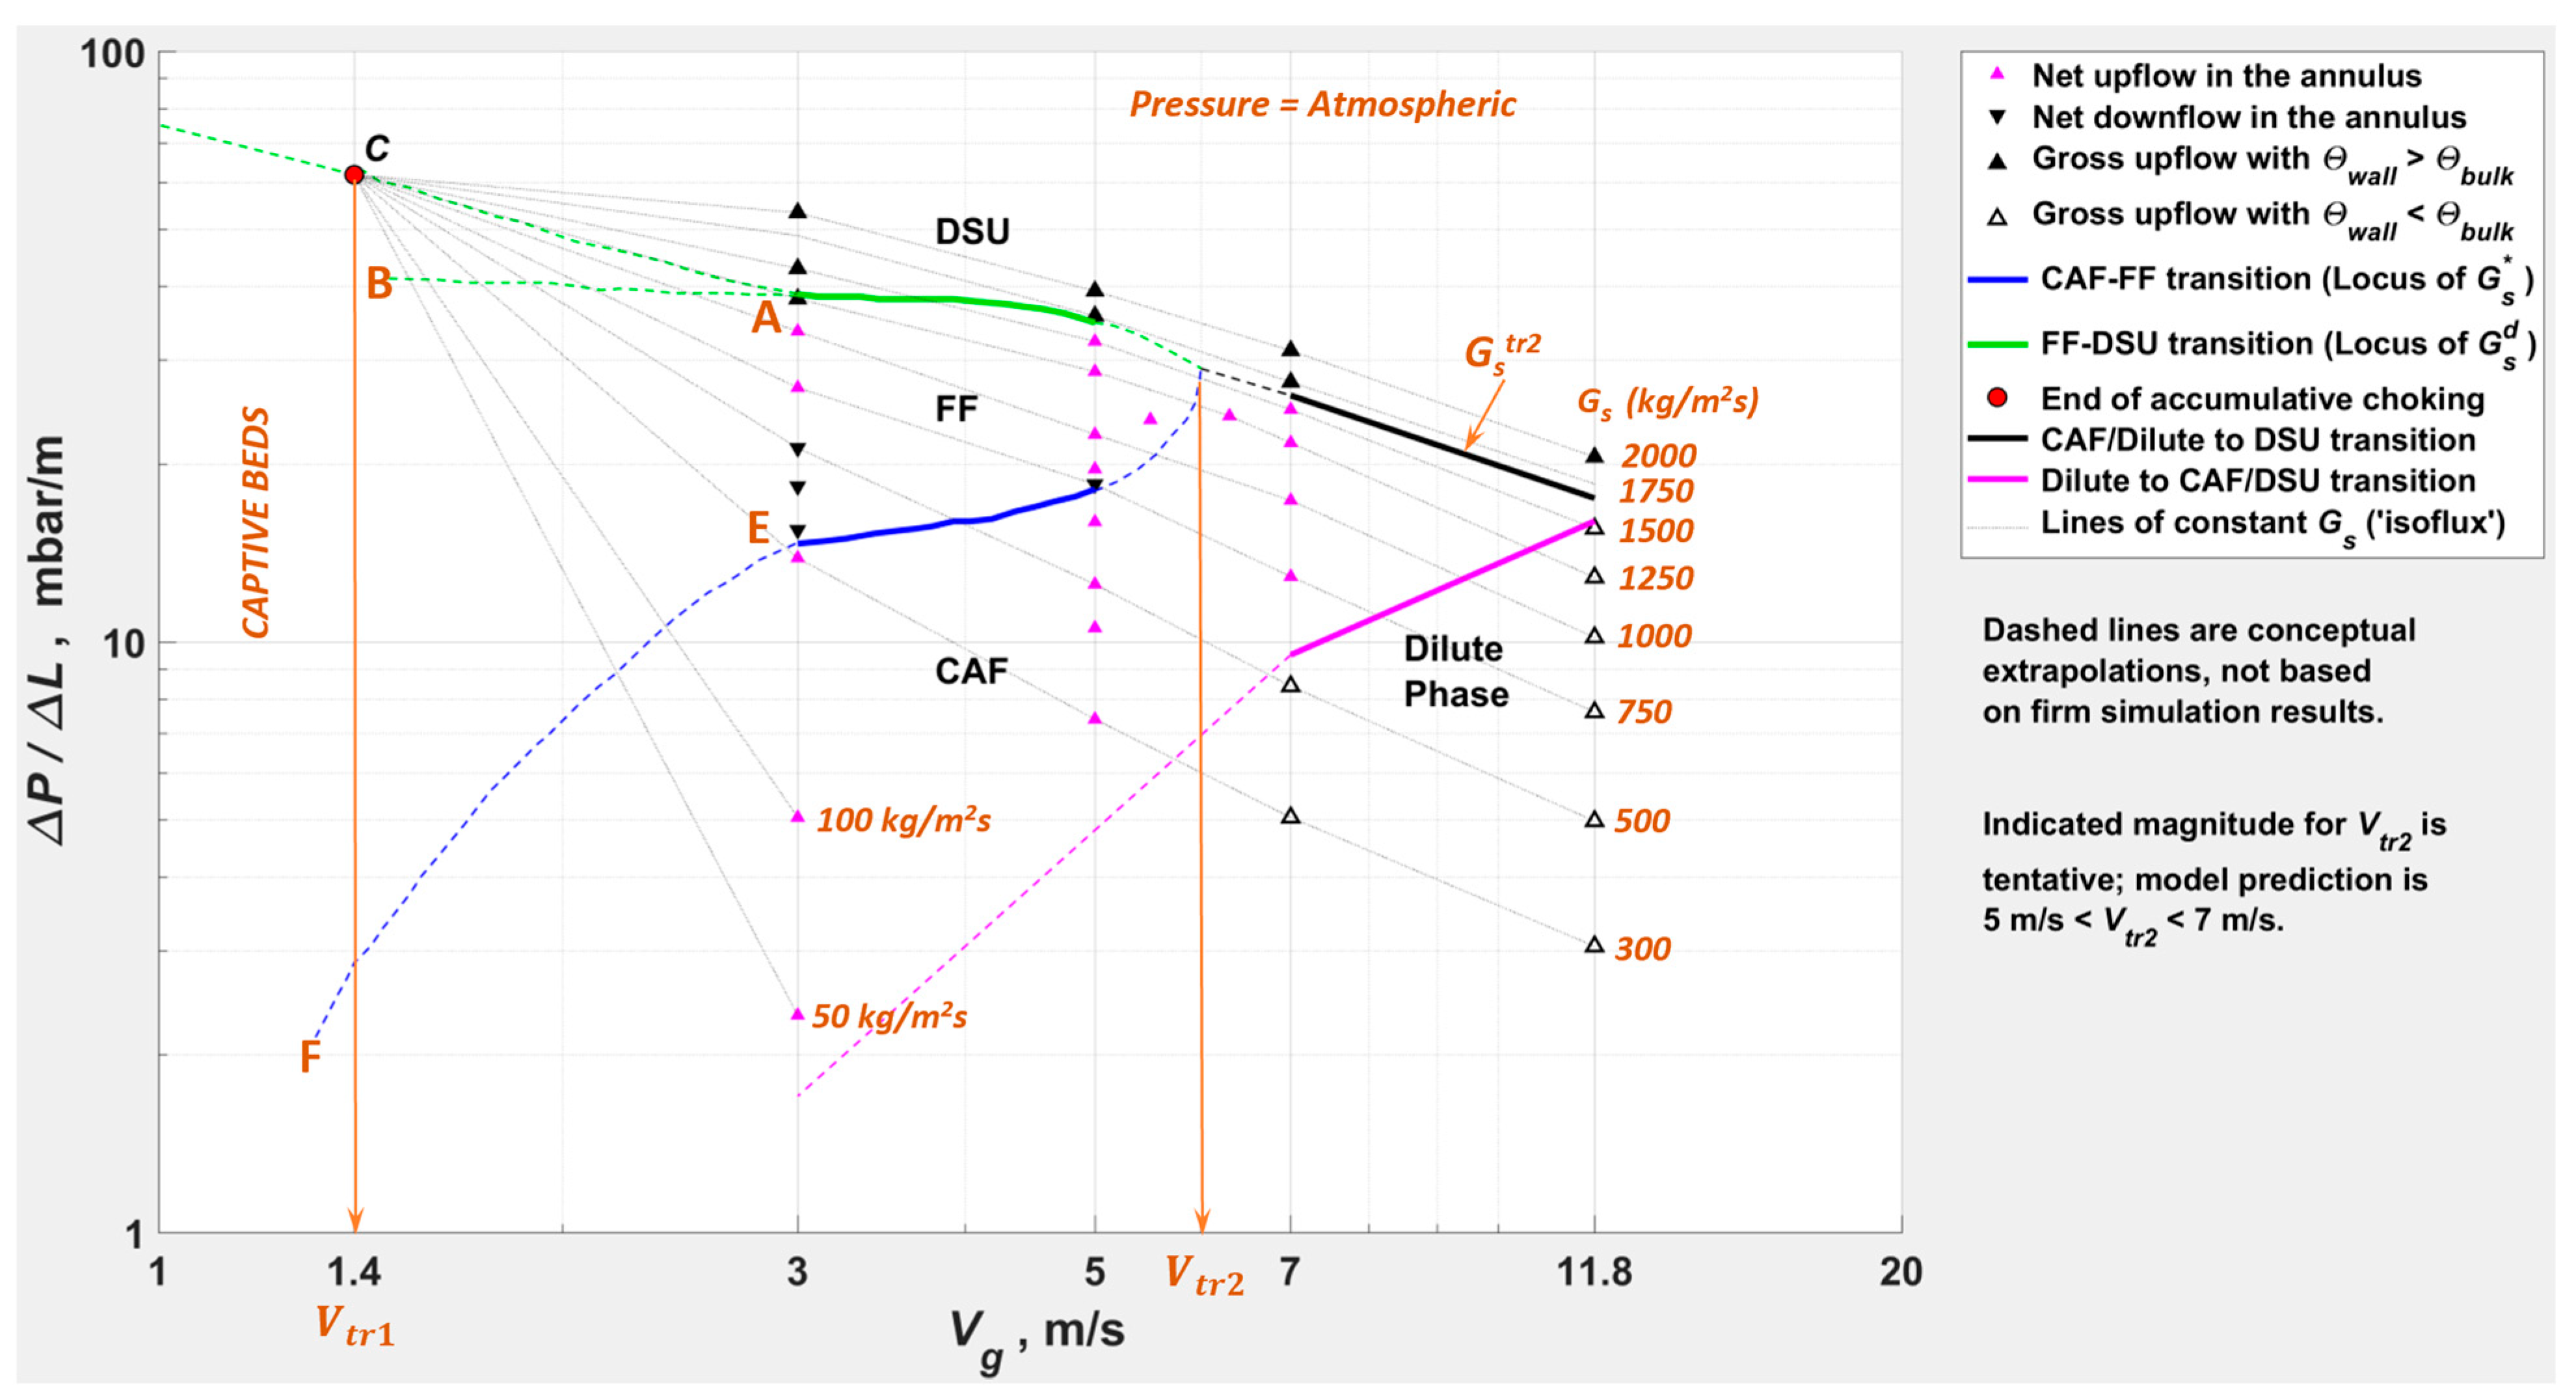
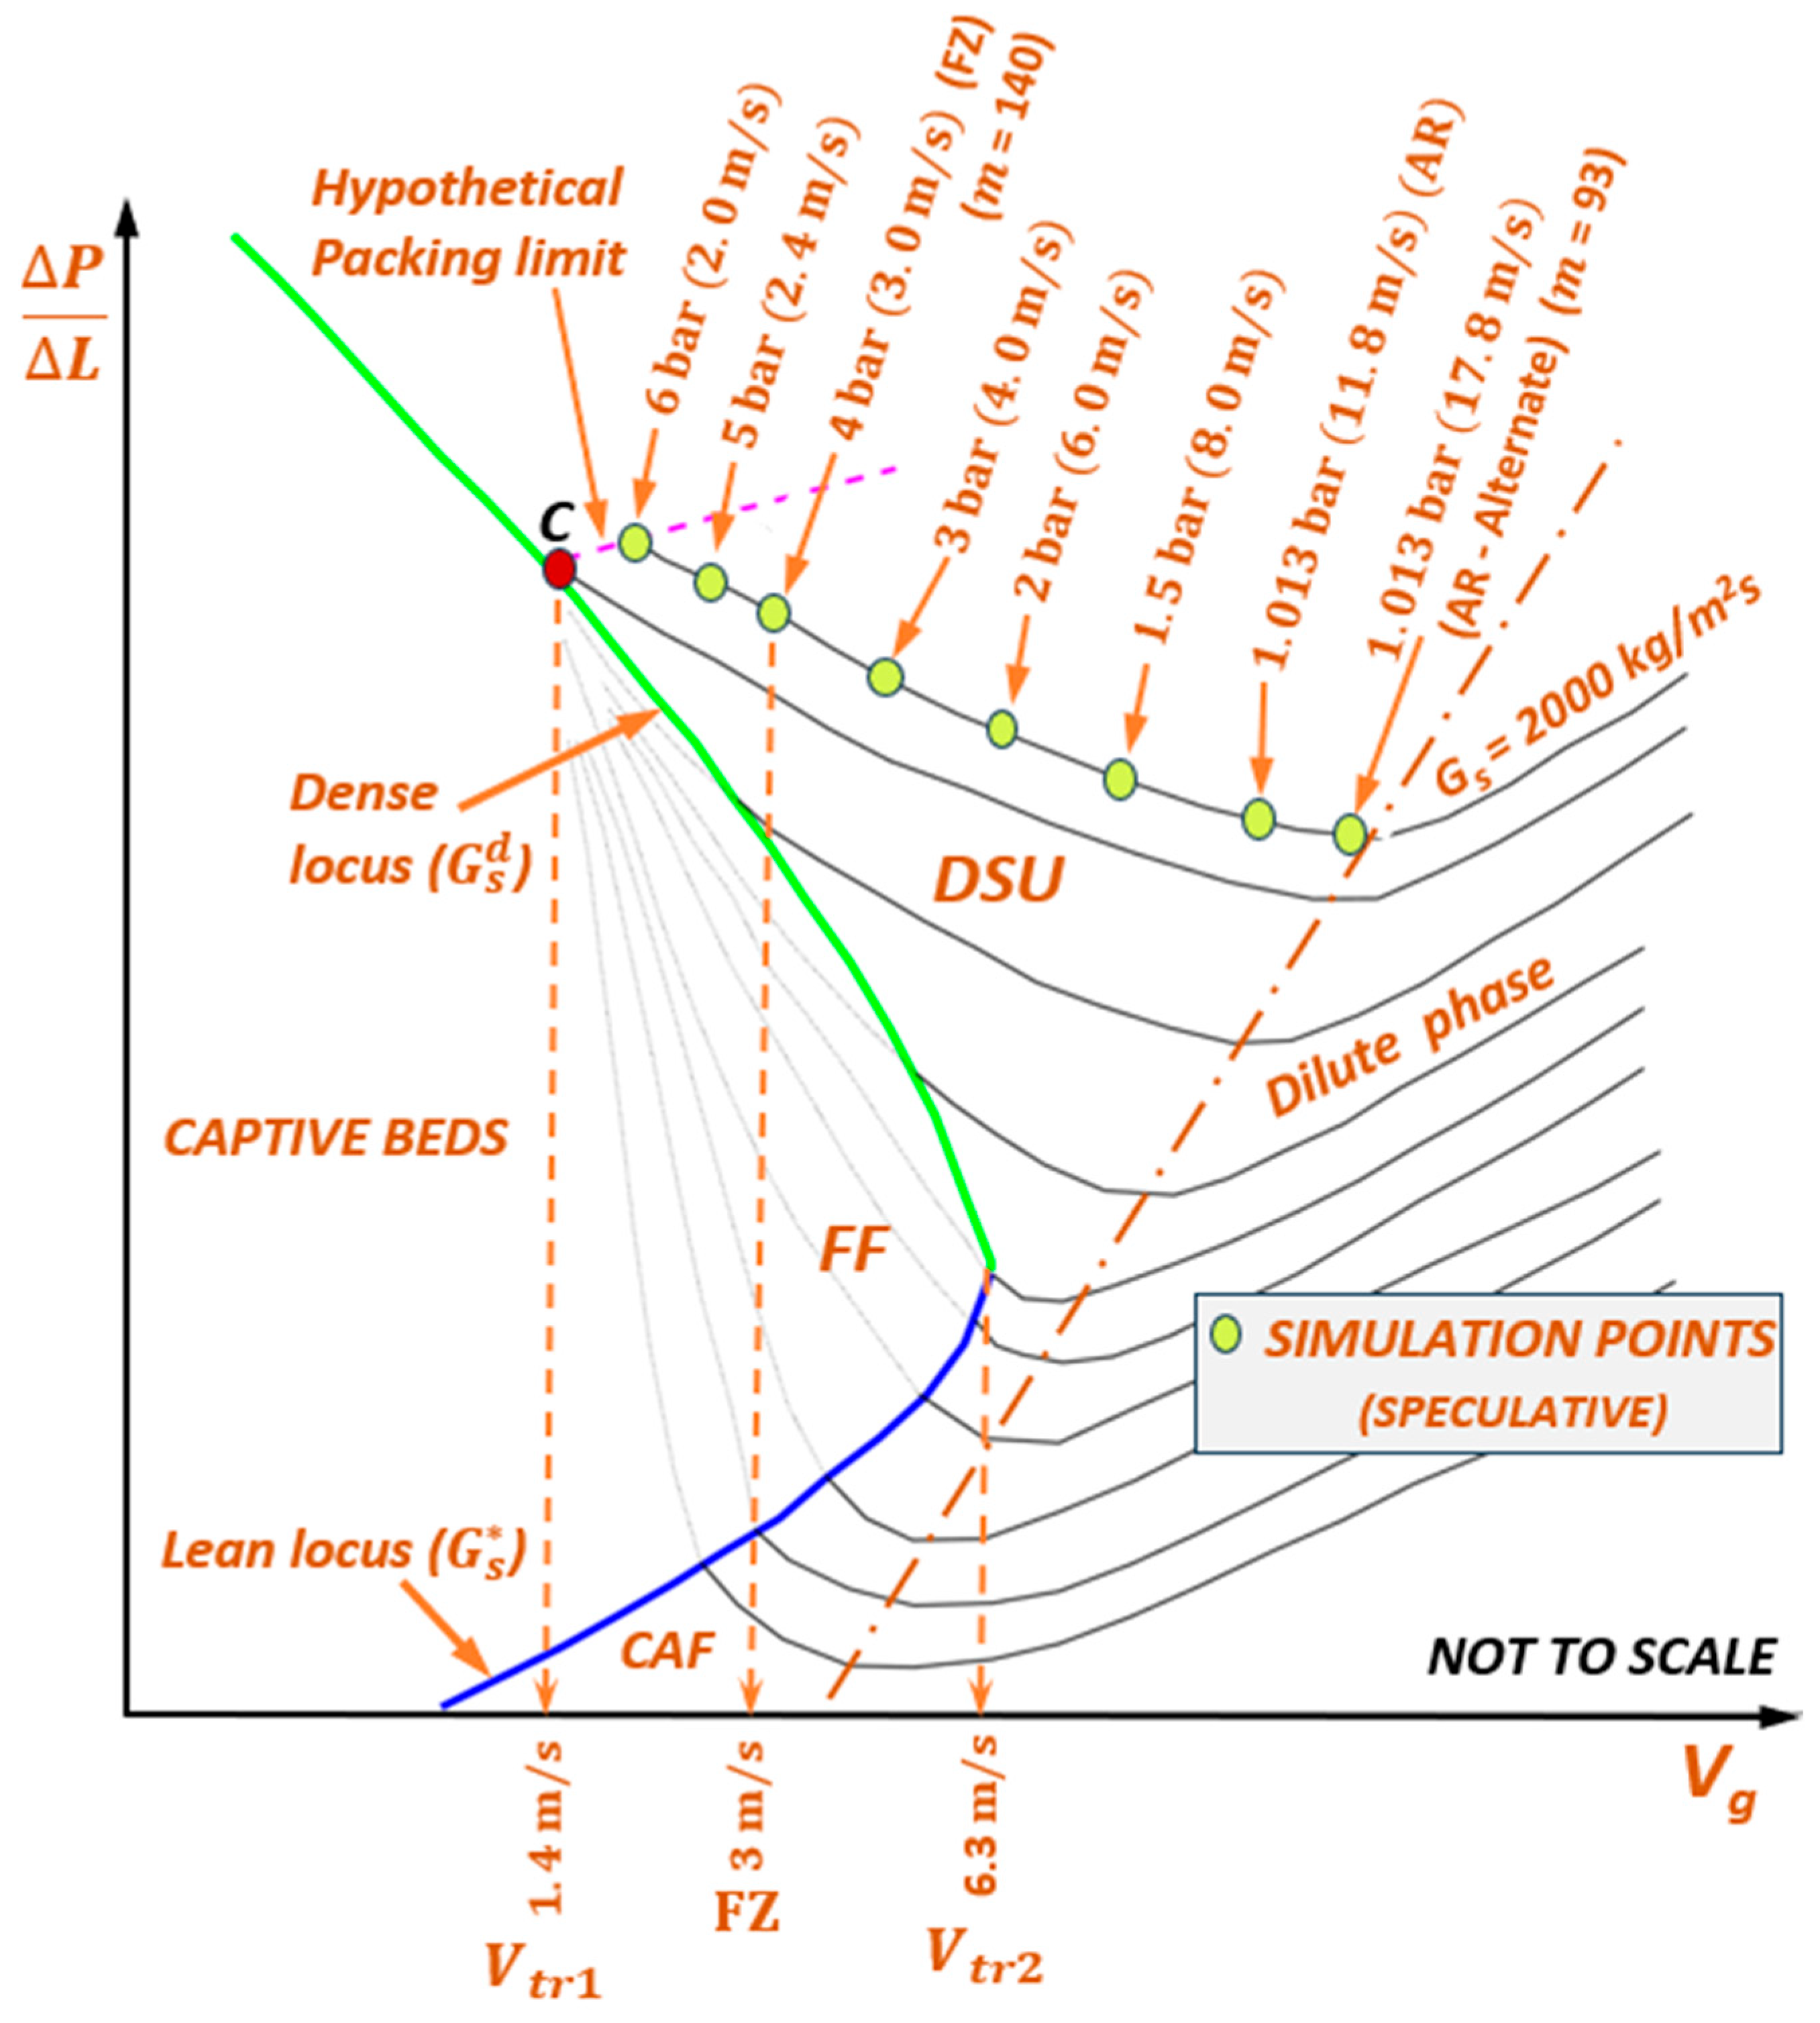
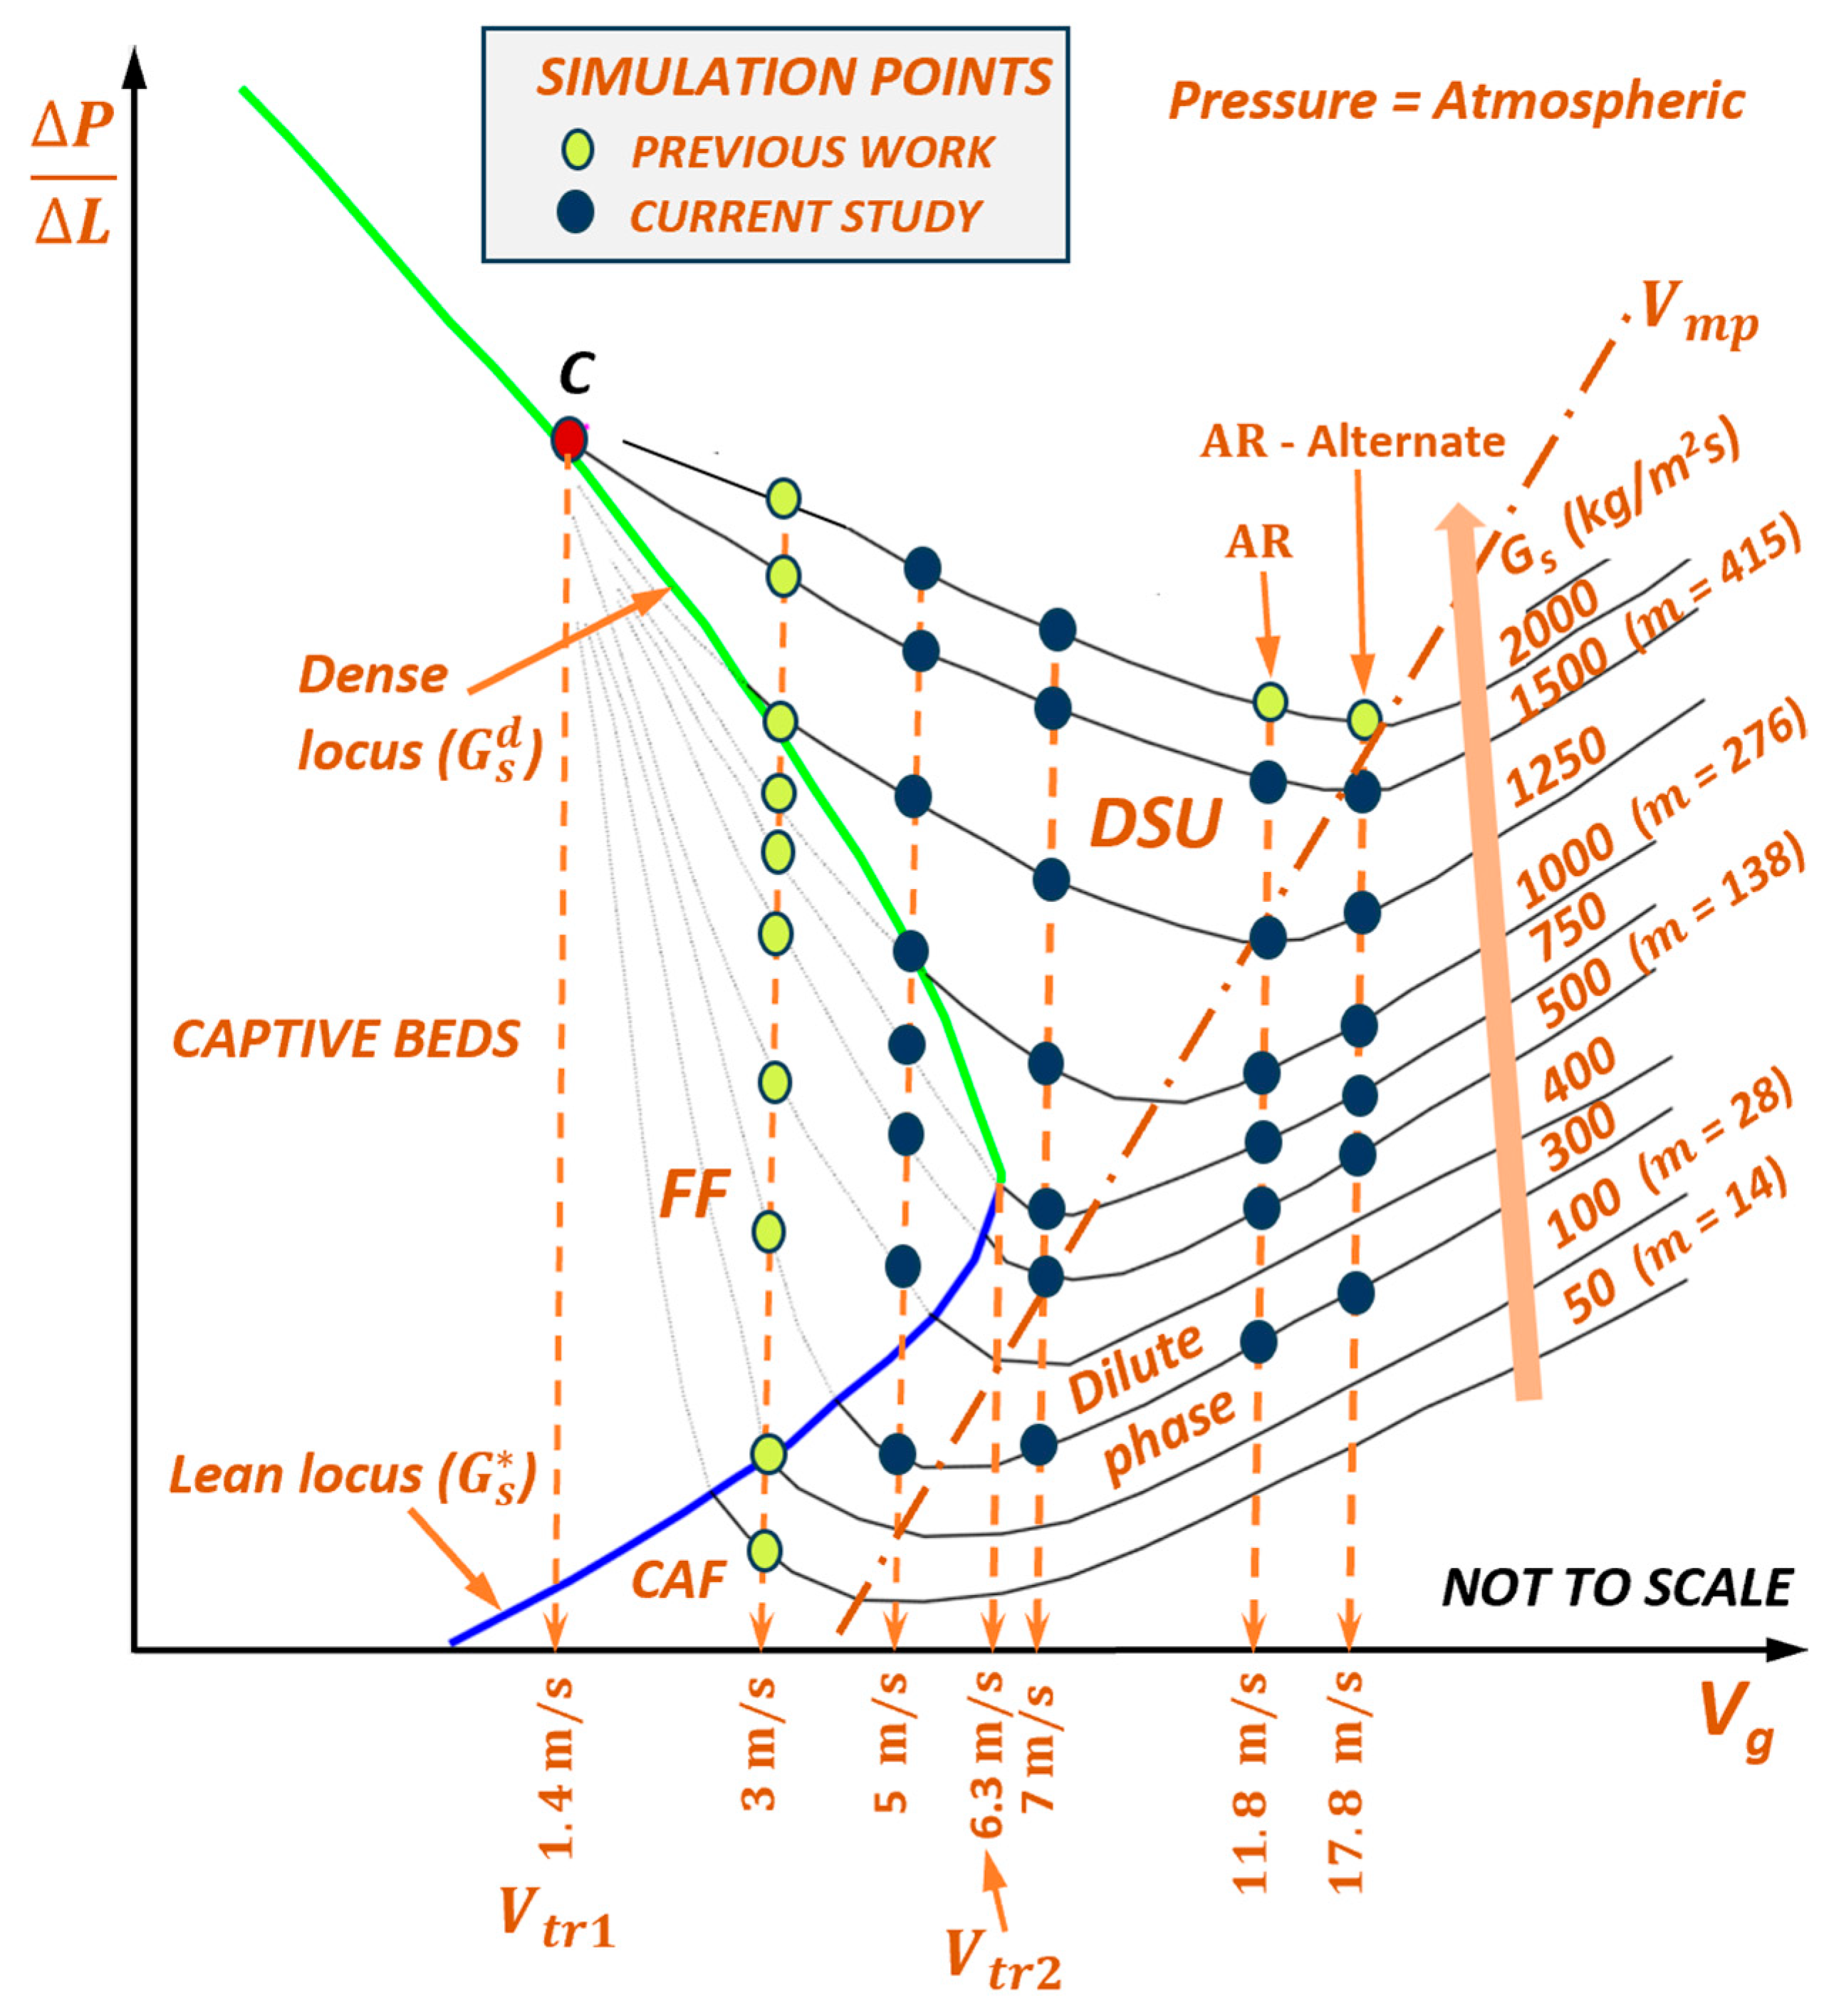
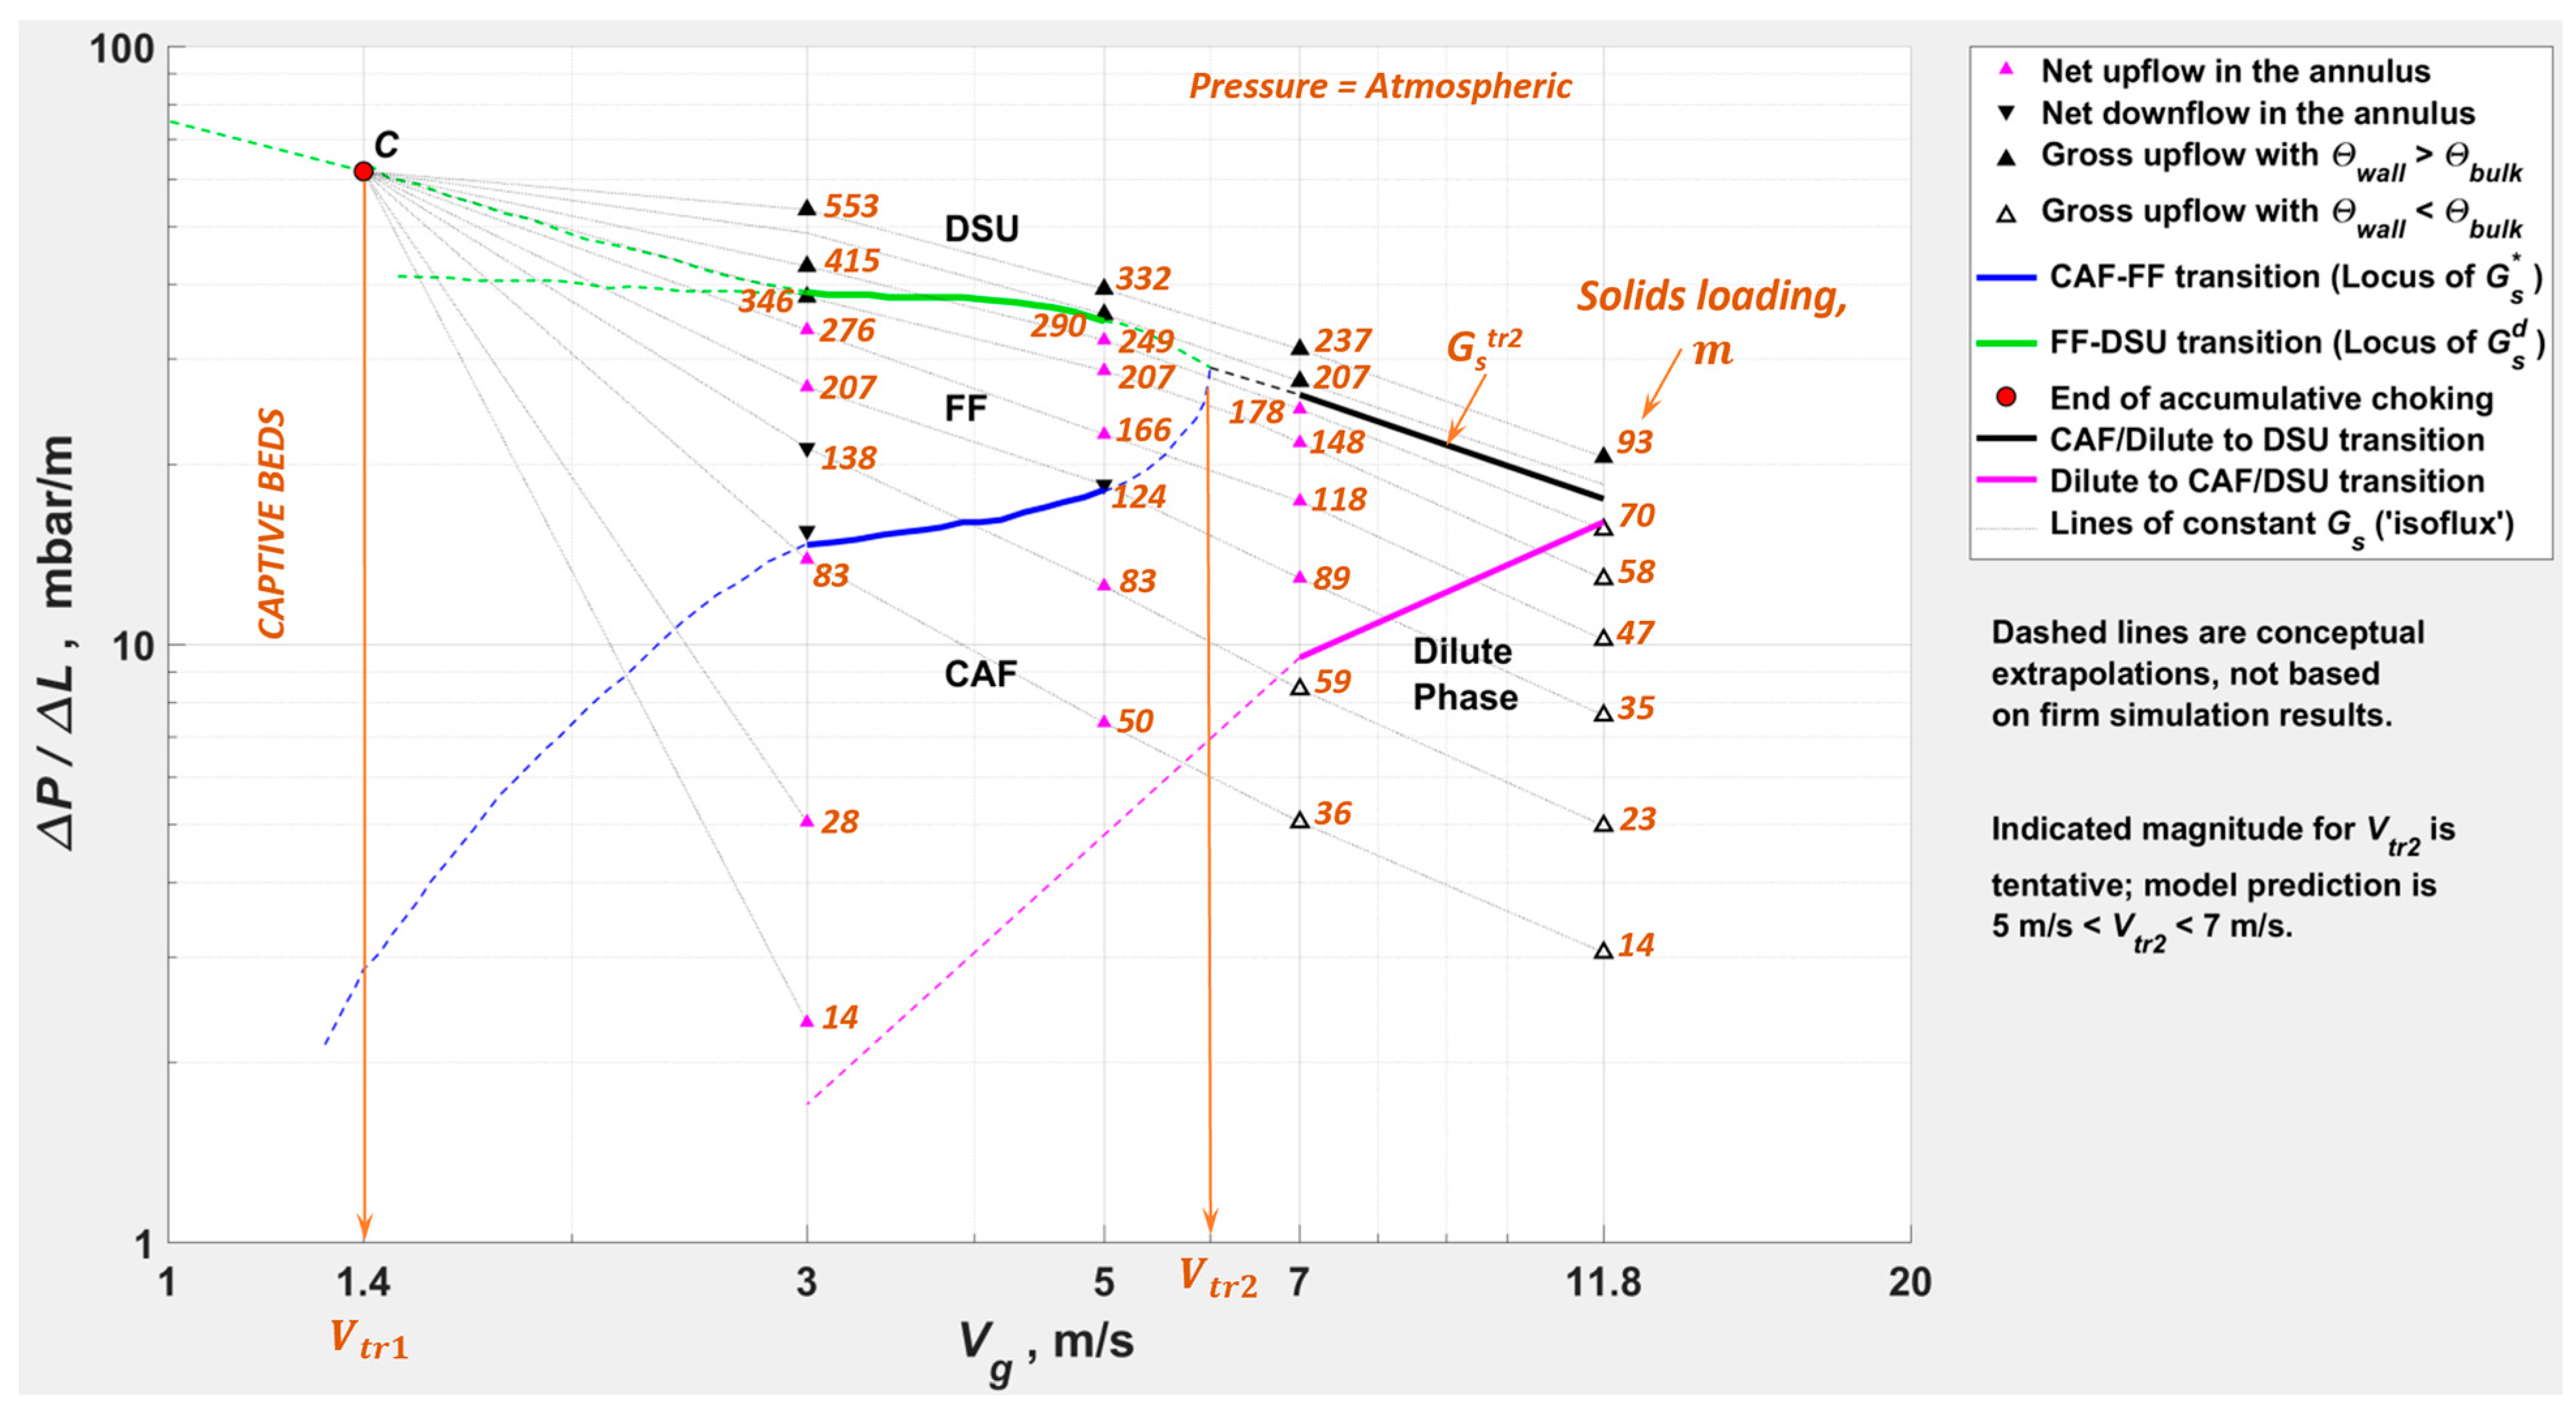
- DSU, FF, CAF, and dilute phase regimes are demarcated per the criteria in Table 2.
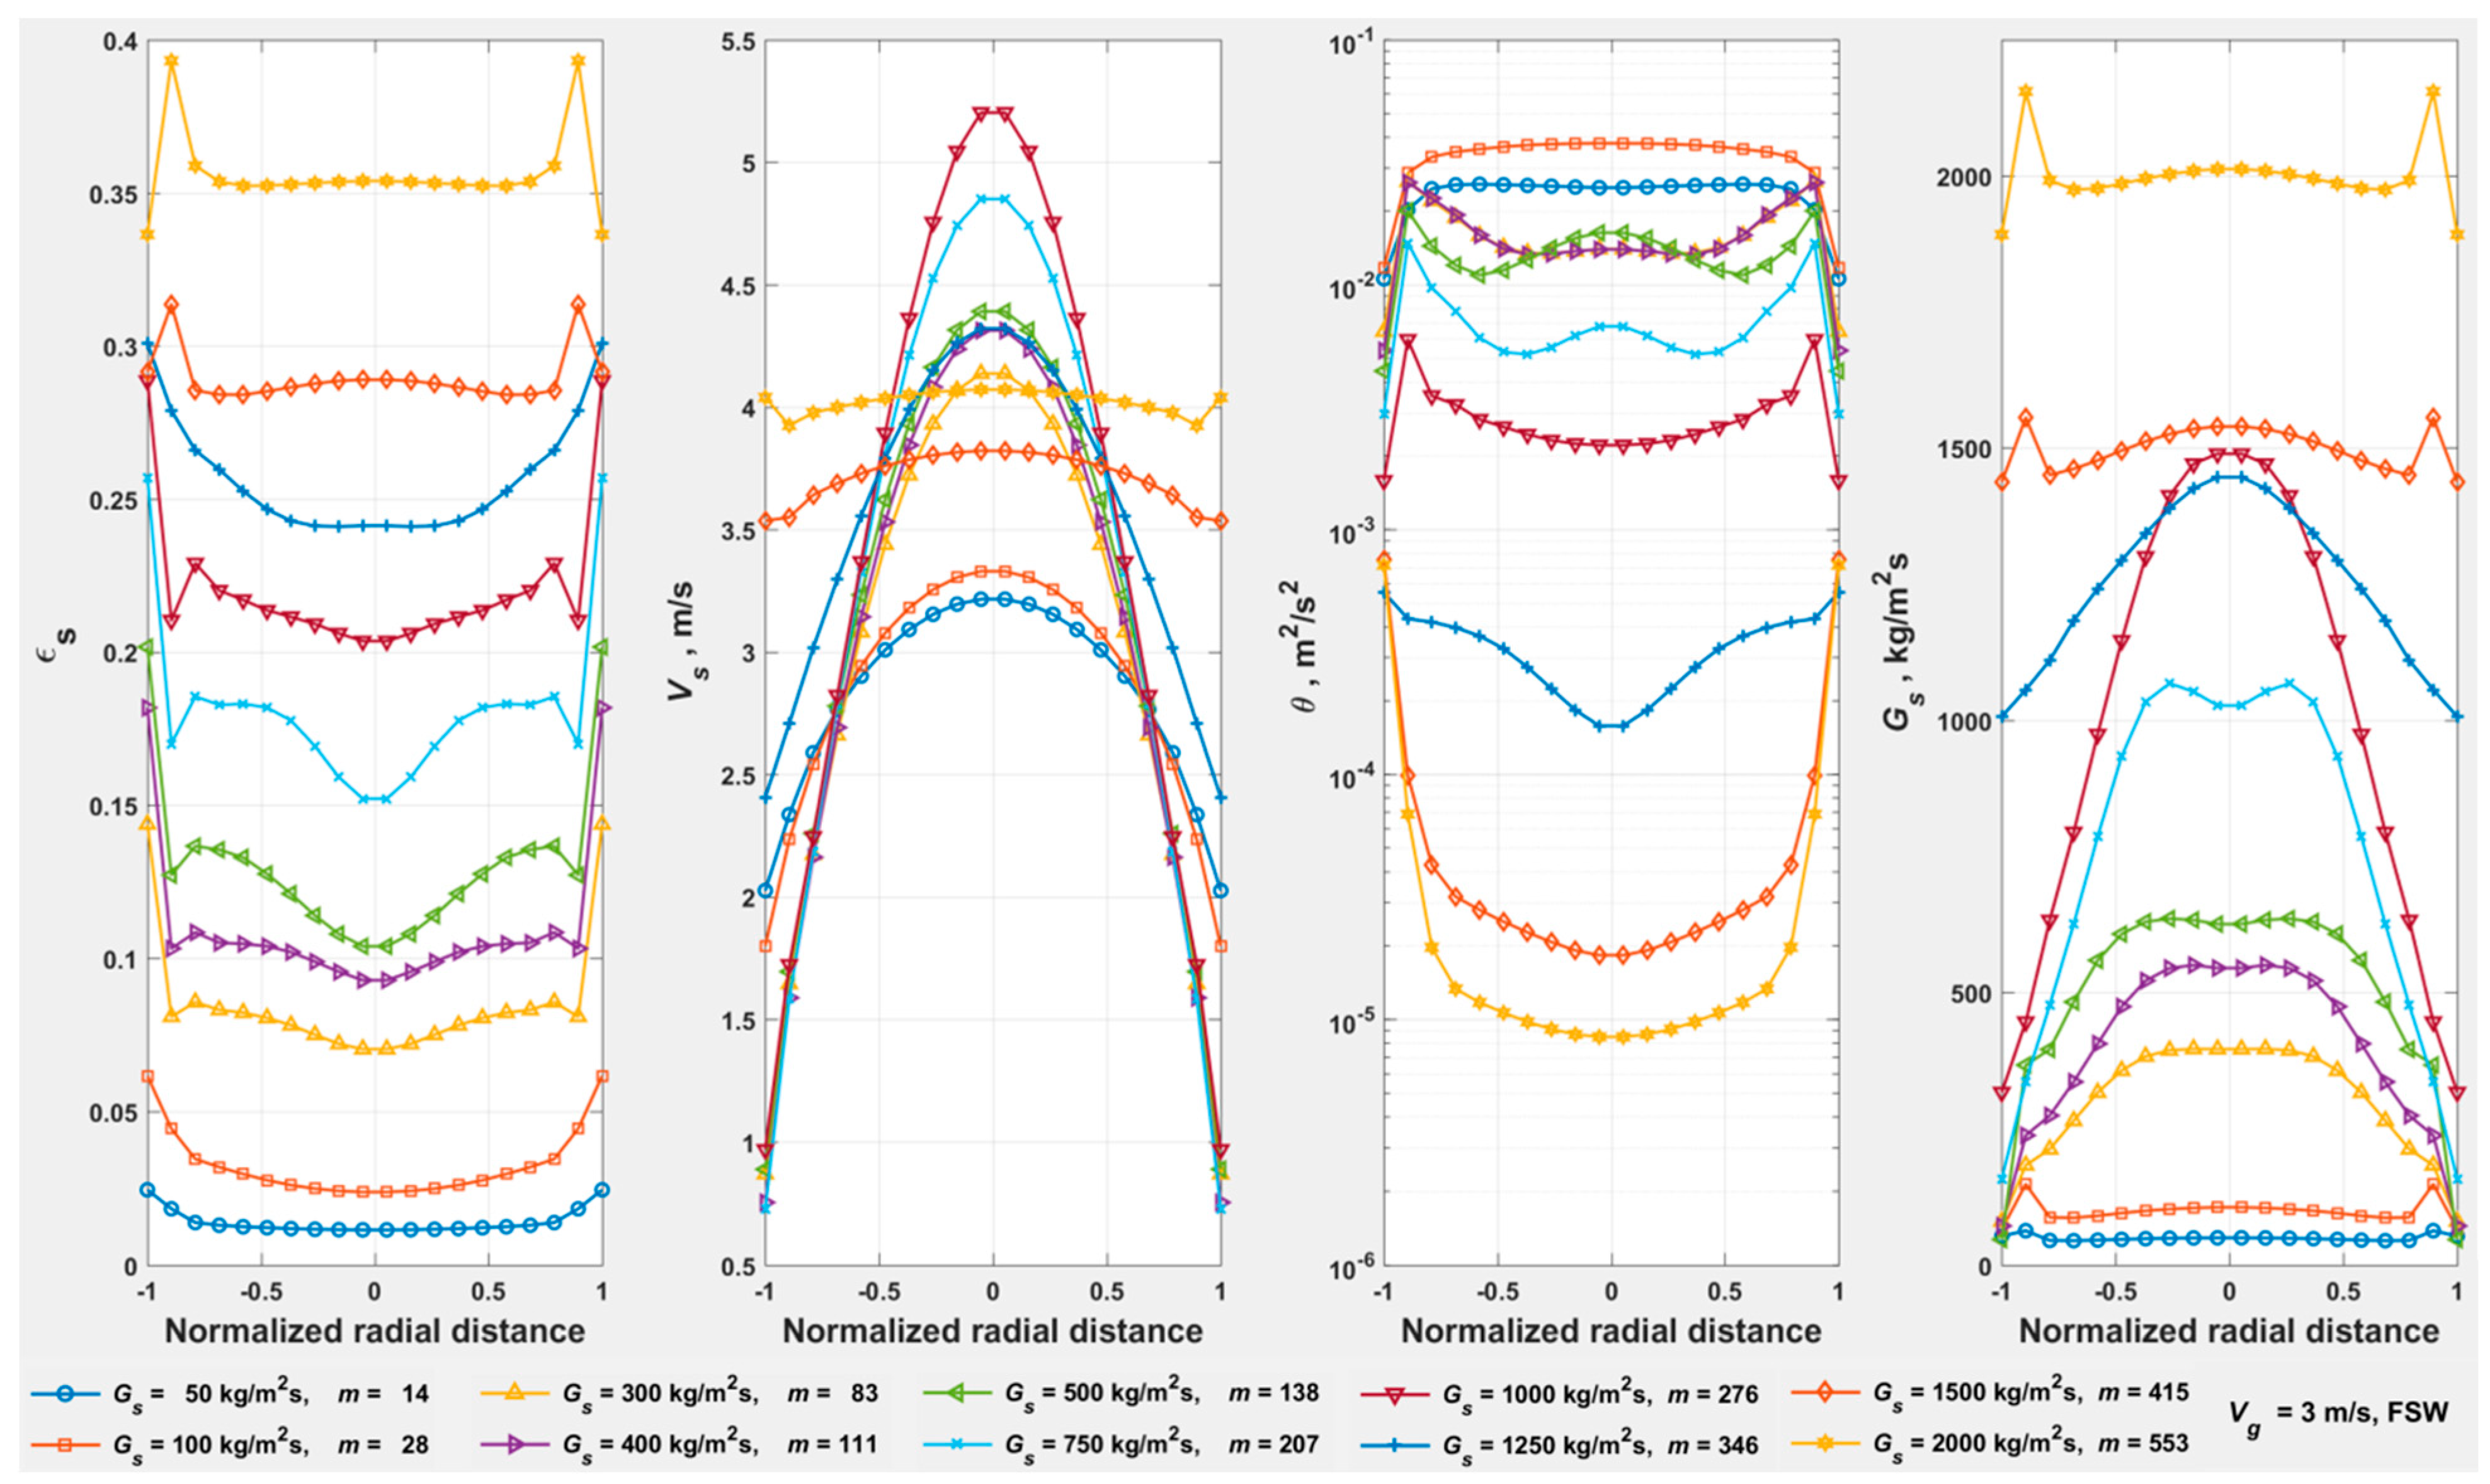
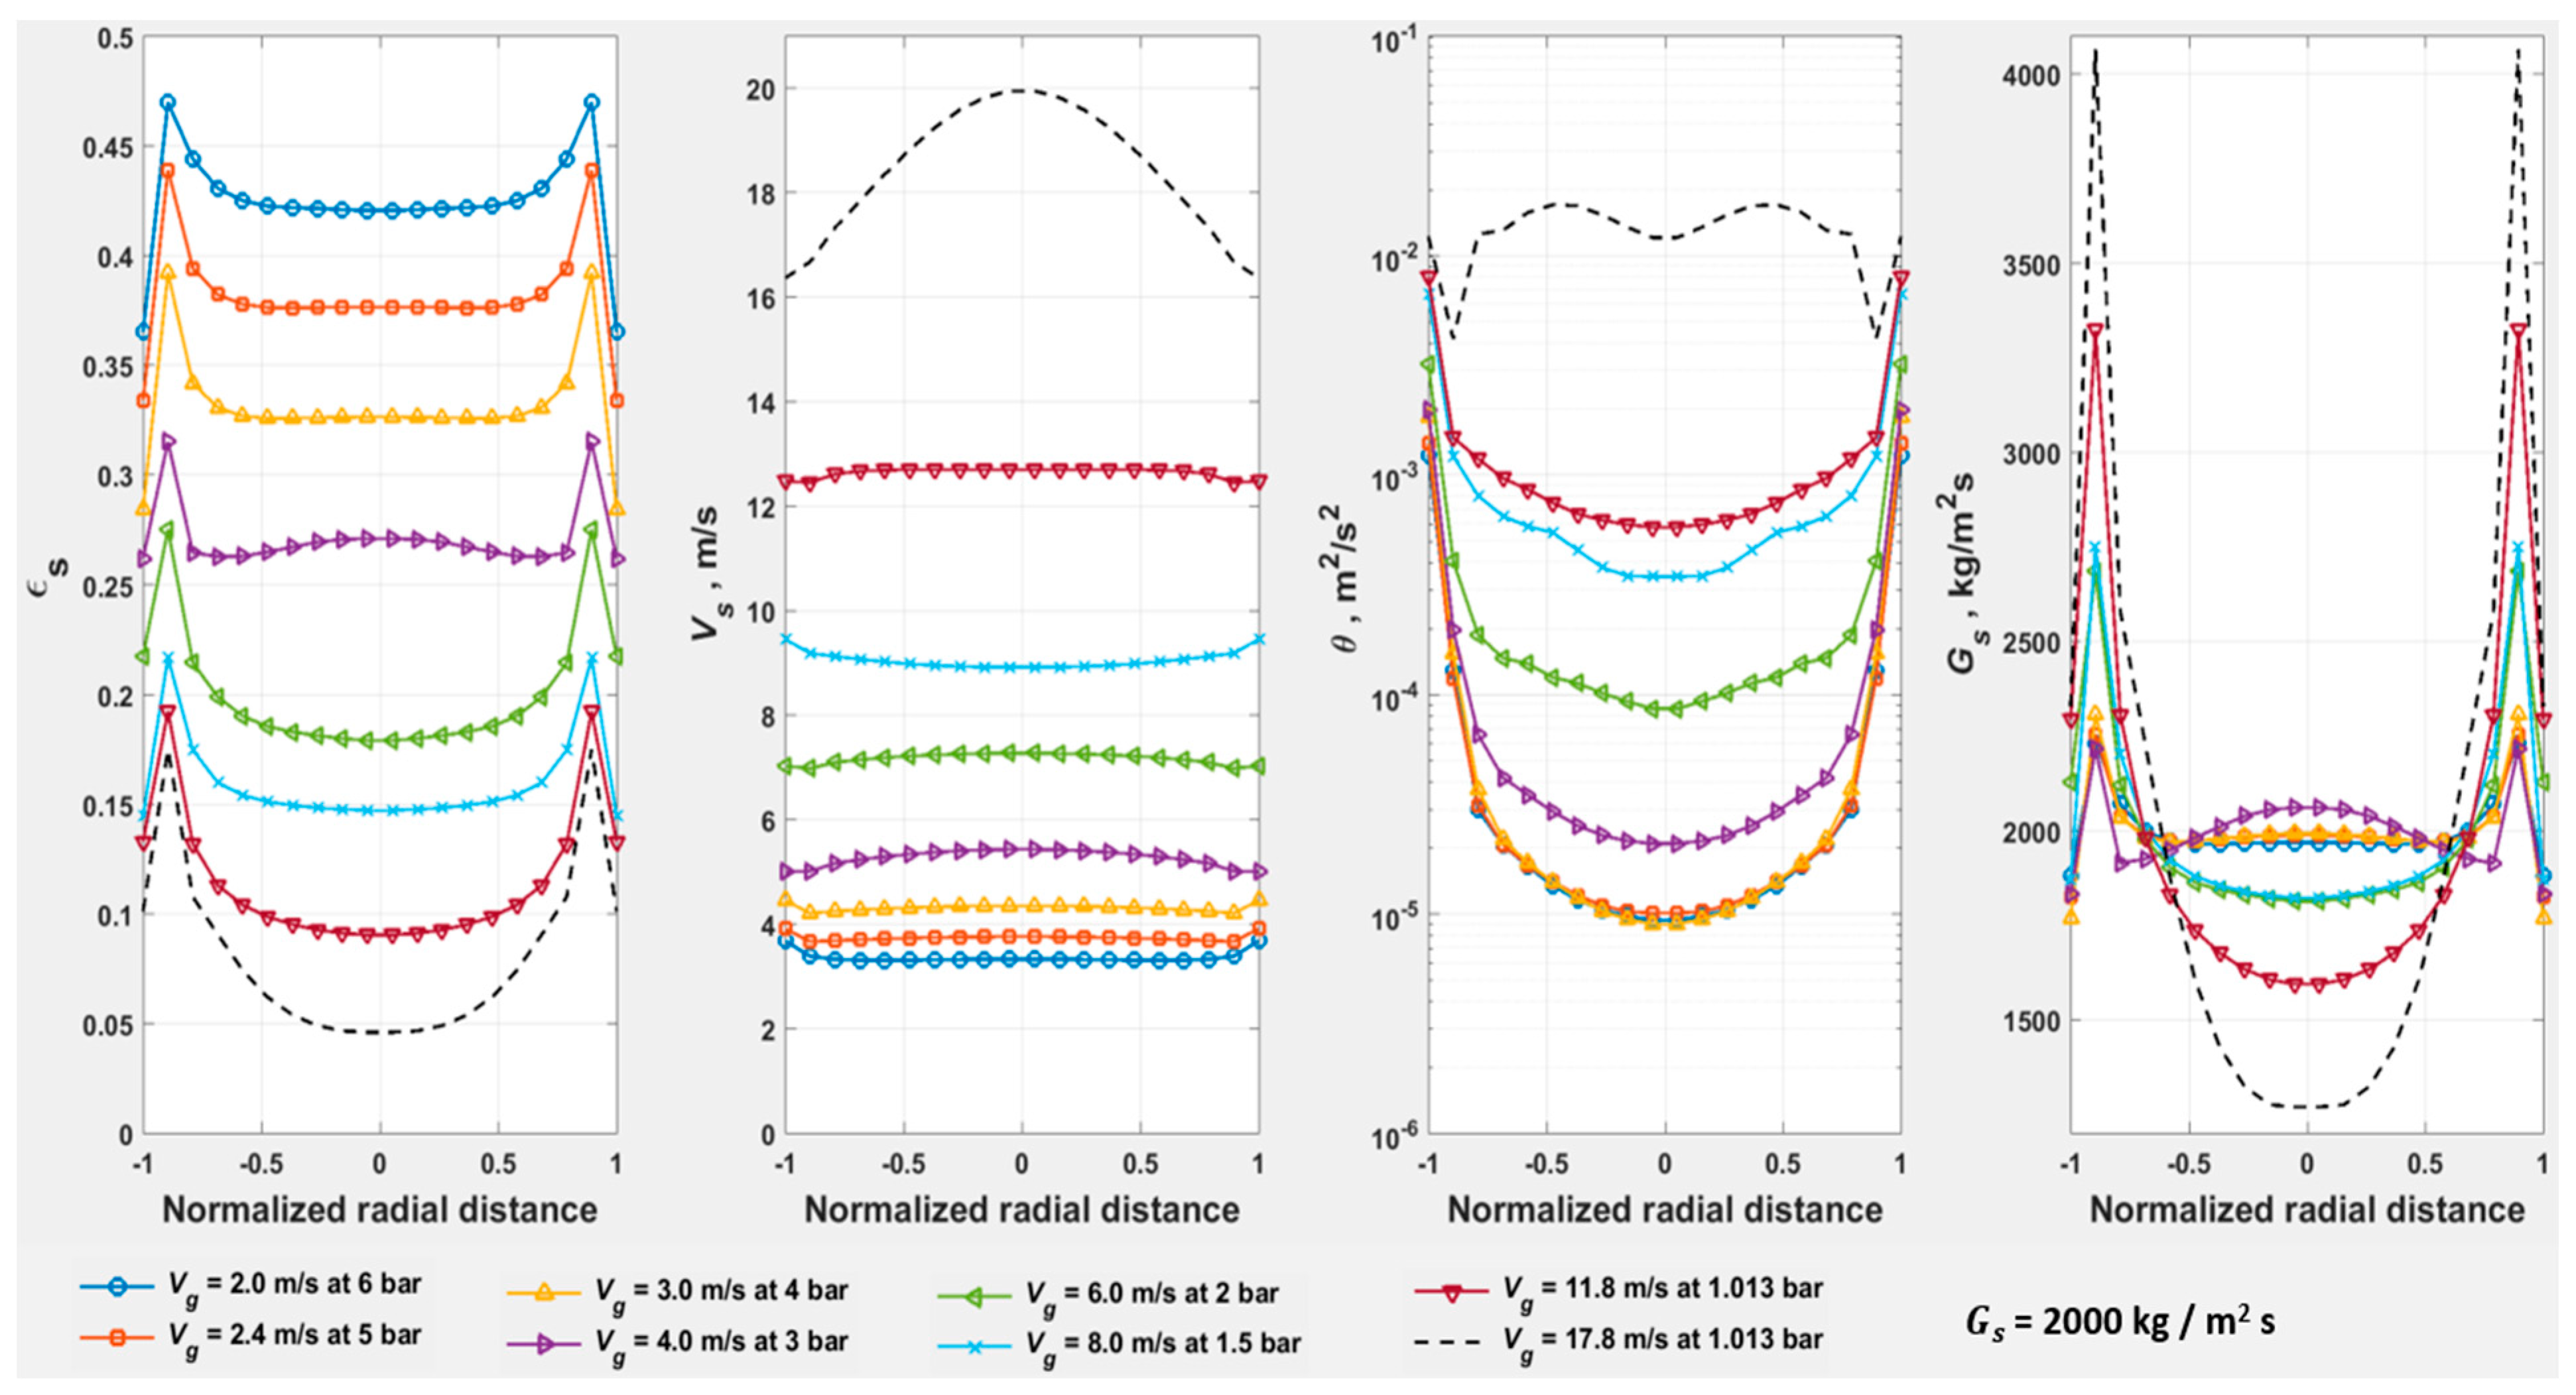
- The riser averaged radial profiles in Figure 23 and Figure 24 illustrate the transitions from FF to DSU at = 5.0 m/s and from CAF to DSU at = 7.0 m/s, respectively, based on the behavior of the flow field (in line with Table 2): (a) profiles of transition to show a pre-wall spike; (b) profiles of transition from to vice versa.
- Results for the simulations at = 17.8 m/s are omitted, as the simulated of 15 m is probably inadequate at the higher .
- The transition from DSU to dilute phase, perceived in Figure 16, in the radial profiles at = 17.8 m/s and of 2000 kg/m2s is also perceived at down to 1000 kg/m2s ( of 0.71) towards the top of the riser. However, the profiles at < 1000 kg/m2s are clearly spurious, with the inlet zone of flow development (in the simulation) occupying the entire = 15 m. Therefore, all the results at = 17.8 m/s are omitted in Figure 22 to avoid any uncertainty.
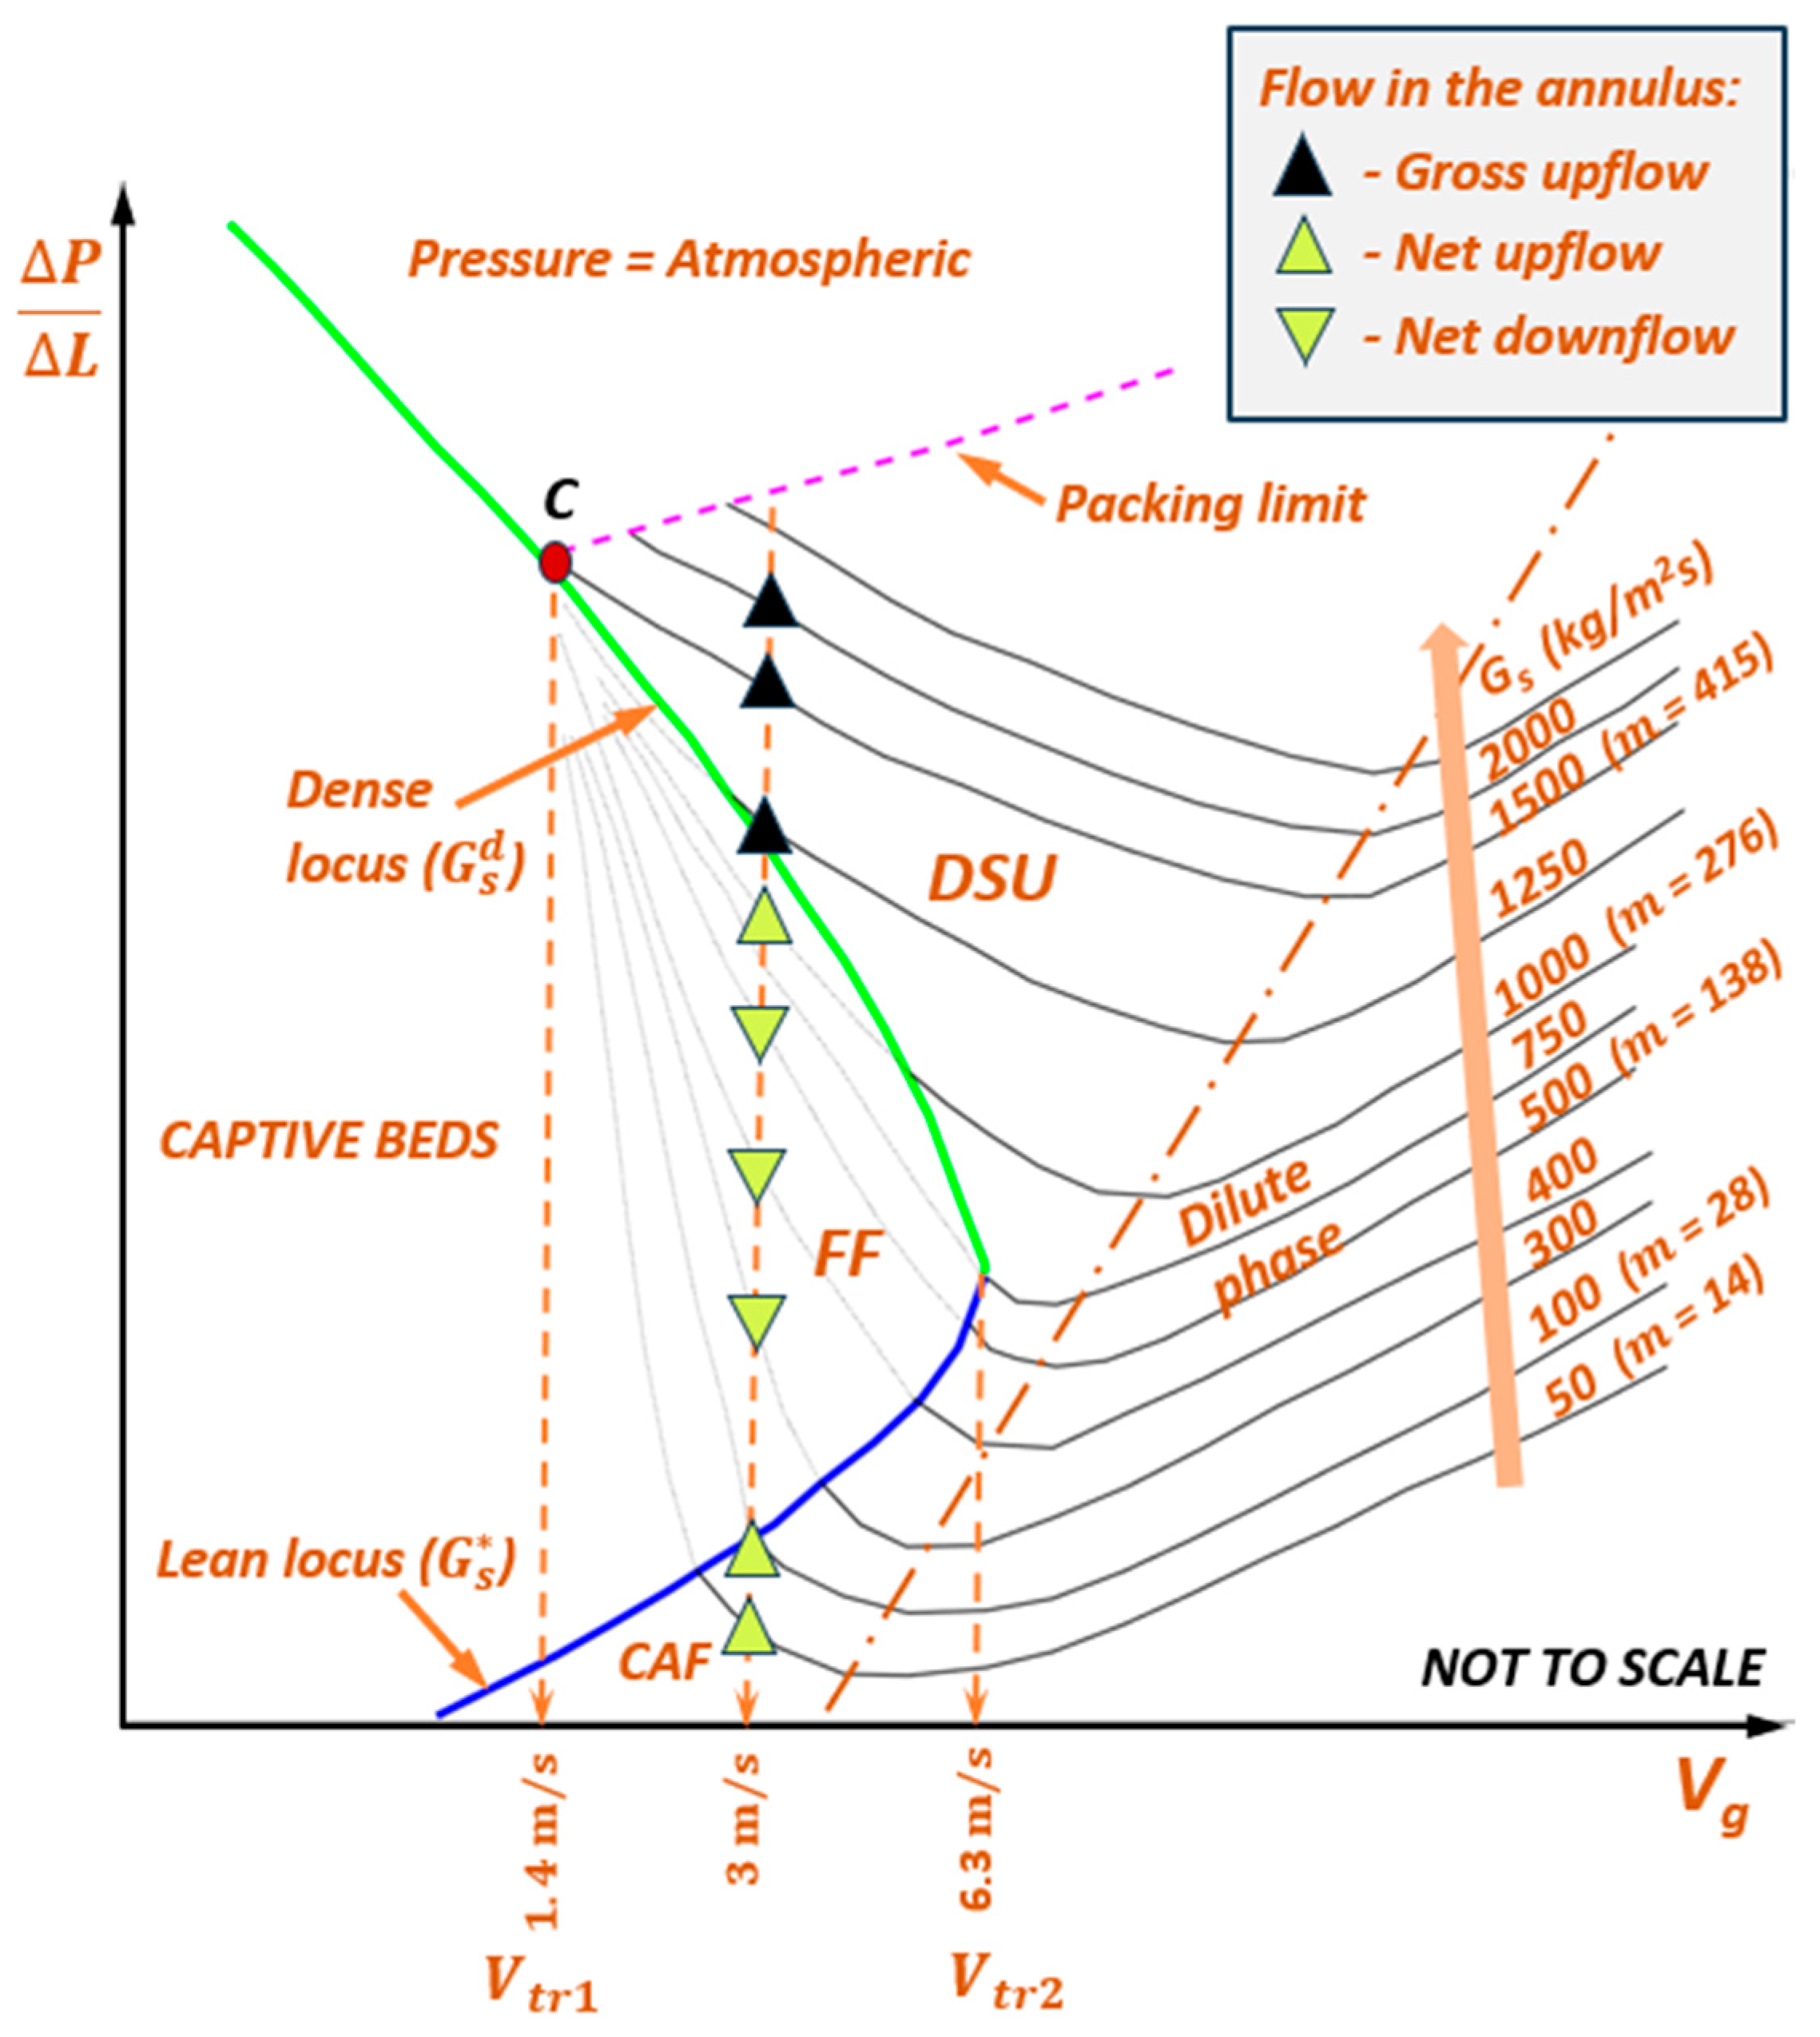
- The extent of FF at 5 m/s < < 7 m/s is not fully resolved by simulations. The indicated magnitude of (and the corresponding ) is tentative, based on conceptual extrapolation of the loci of (green), (blue), and the boundary between CAF/Dilute phase and DSU (black).
- The line EF is the conceptual extrapolation of the lean locus towards the onset of turbulent fluidization at (, ), with the (~1 mbar/m) being essentially the gas-only pressure drop at (~1 m/s).
- The transitions from dilute to CAF/DSU for the isofluxes at 300 < < 1500 kg/m2s for the simulated powder do not coincide with the locus of .
4. Discussion
- The powder chosen for numerical modeling—monodisperse spheres with dominant gravity over —is atypical. Typical SCA powders can be non-spherical and polydisperse with significant , often with dominant over gravity.
- Only one riser diameter () is modeled. As discussed in Section 1.1.3, key vertical upflow parameters such as and for SCA powders are dependent on .
5. Conclusions
- Adapted the vertical upflow phase map of Wirth to SCA powders to (a) define DSU as a separate transport regime characterized by gross upflow of solids, with ; and (b) identify that the operating regimes of vertical upflow at high for coarser powders occurs under DSU and/or FF, and for finer powders predominantly under DSU.
- Demonstrated that the upper transport velocity () for Geldart A powders can be significantly higher than hitherto predicted, by a new, provisional correlation (1).
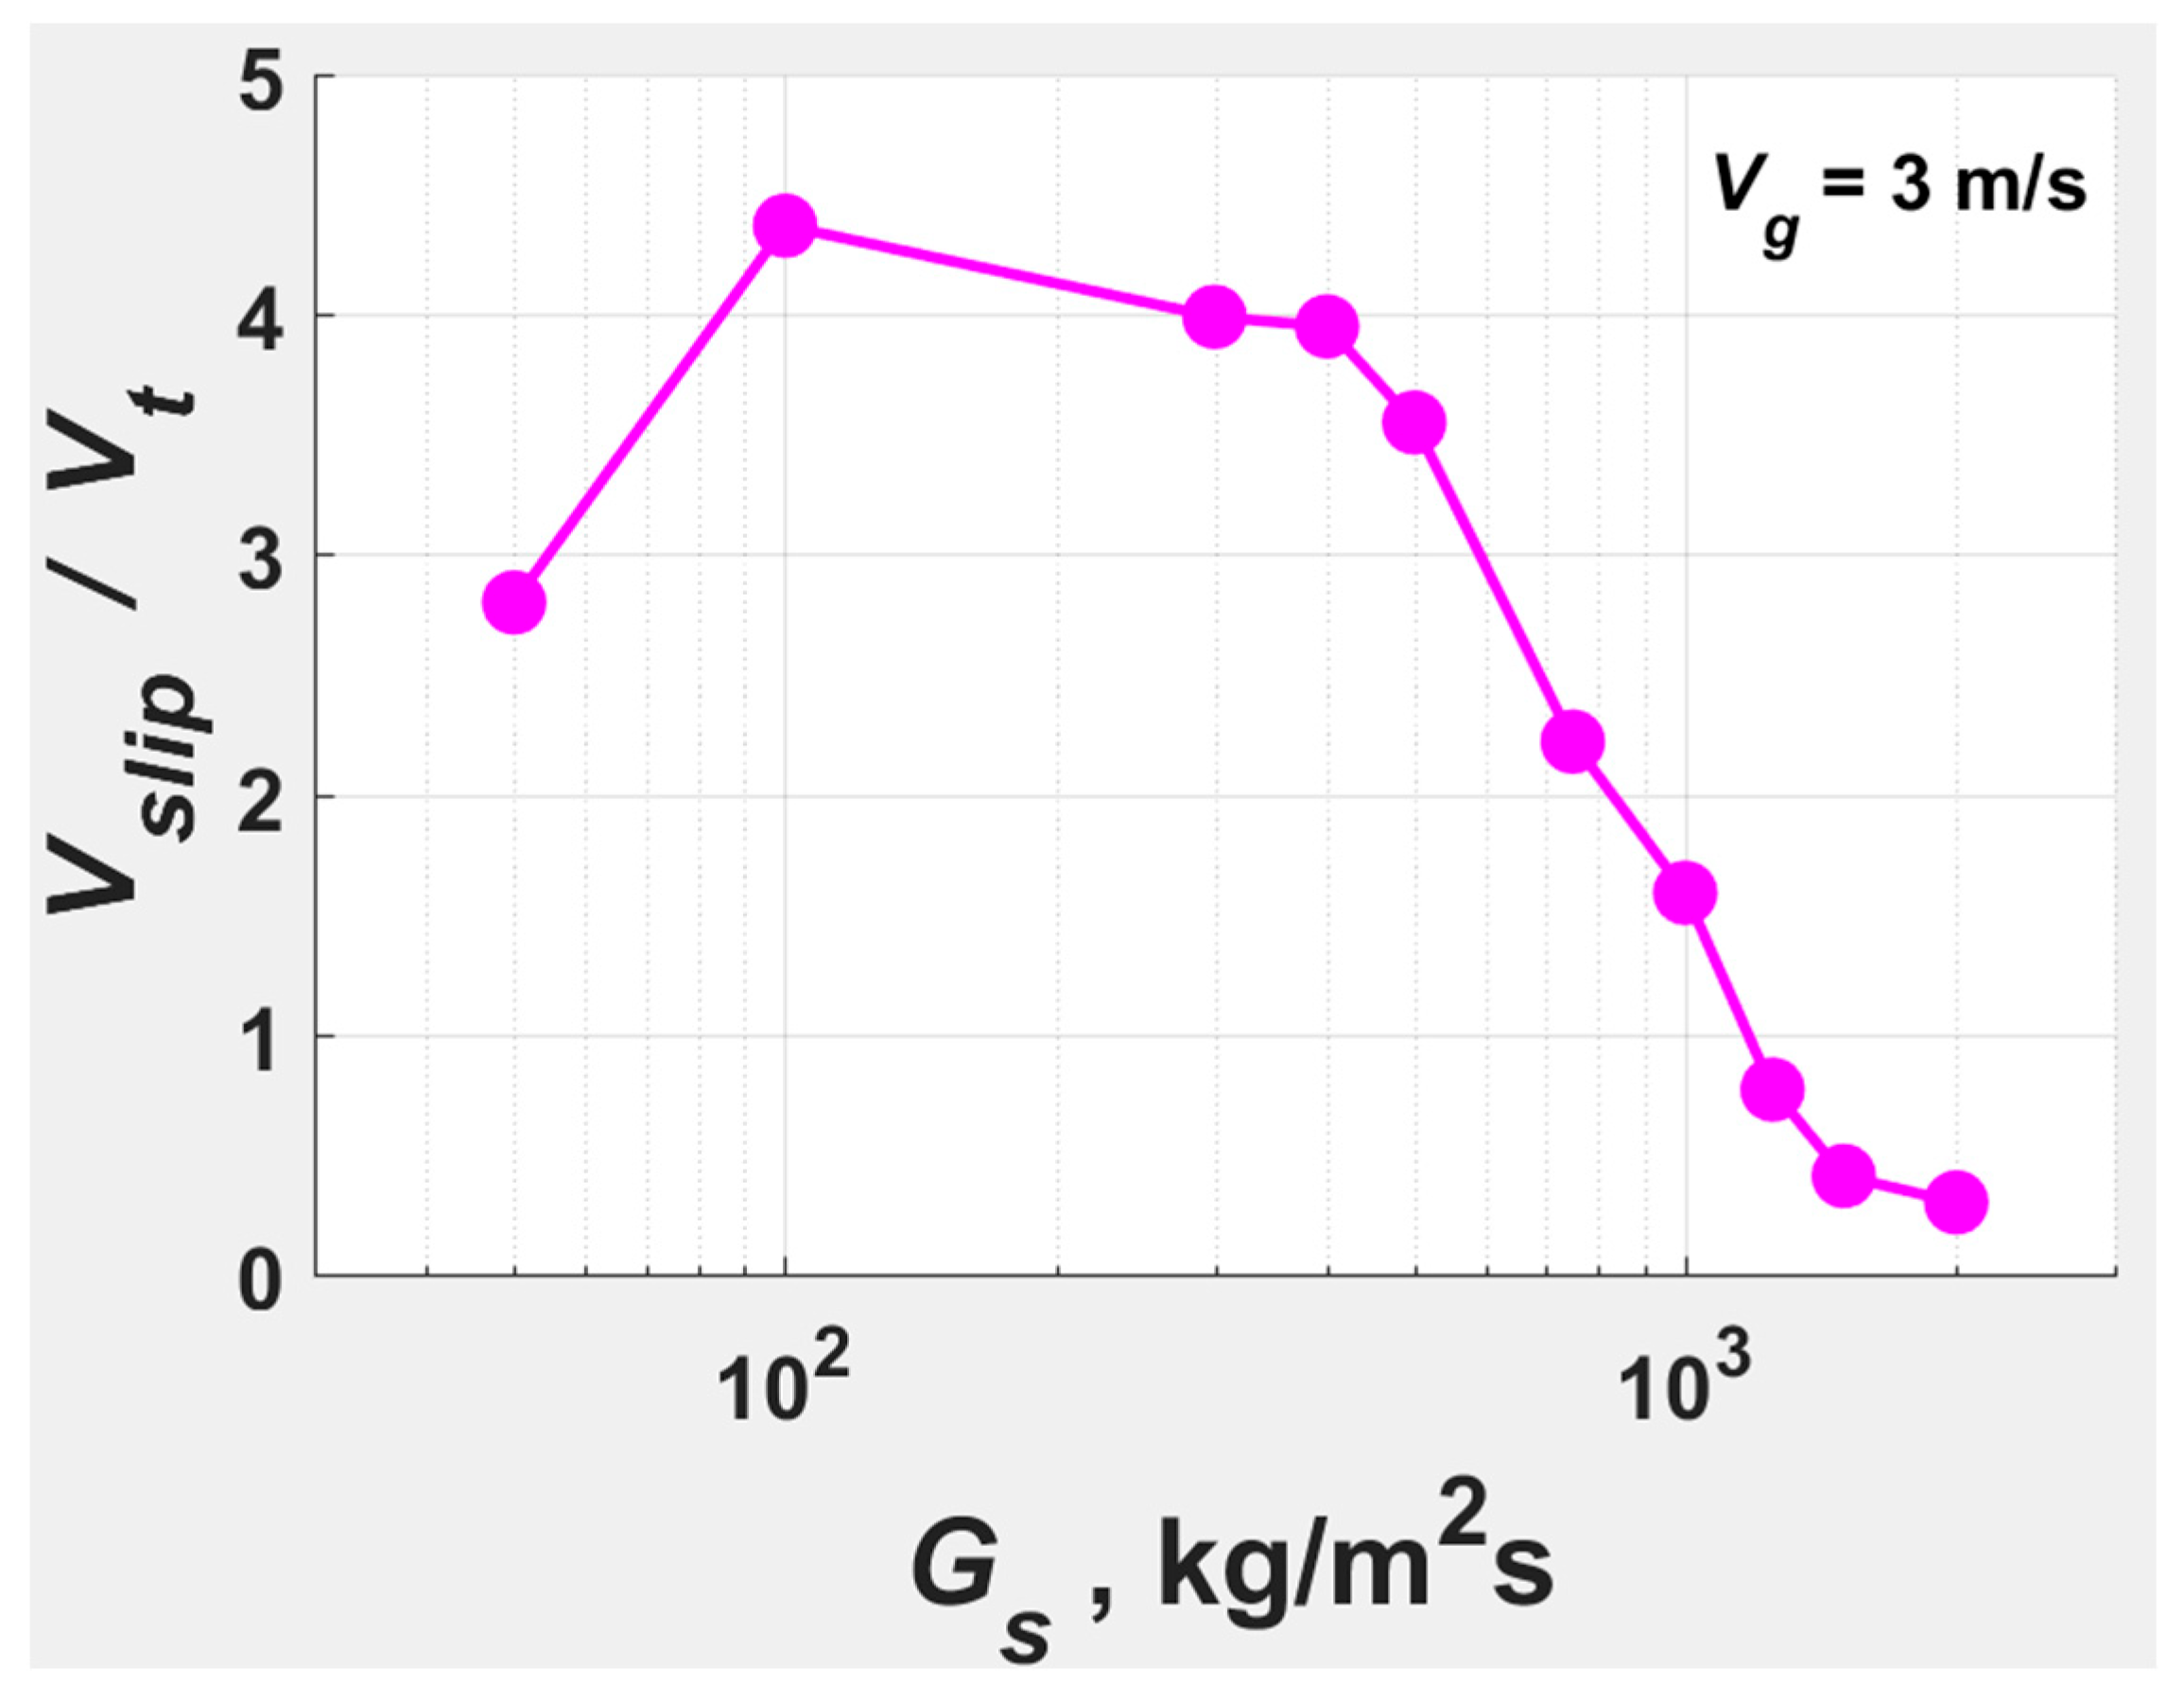
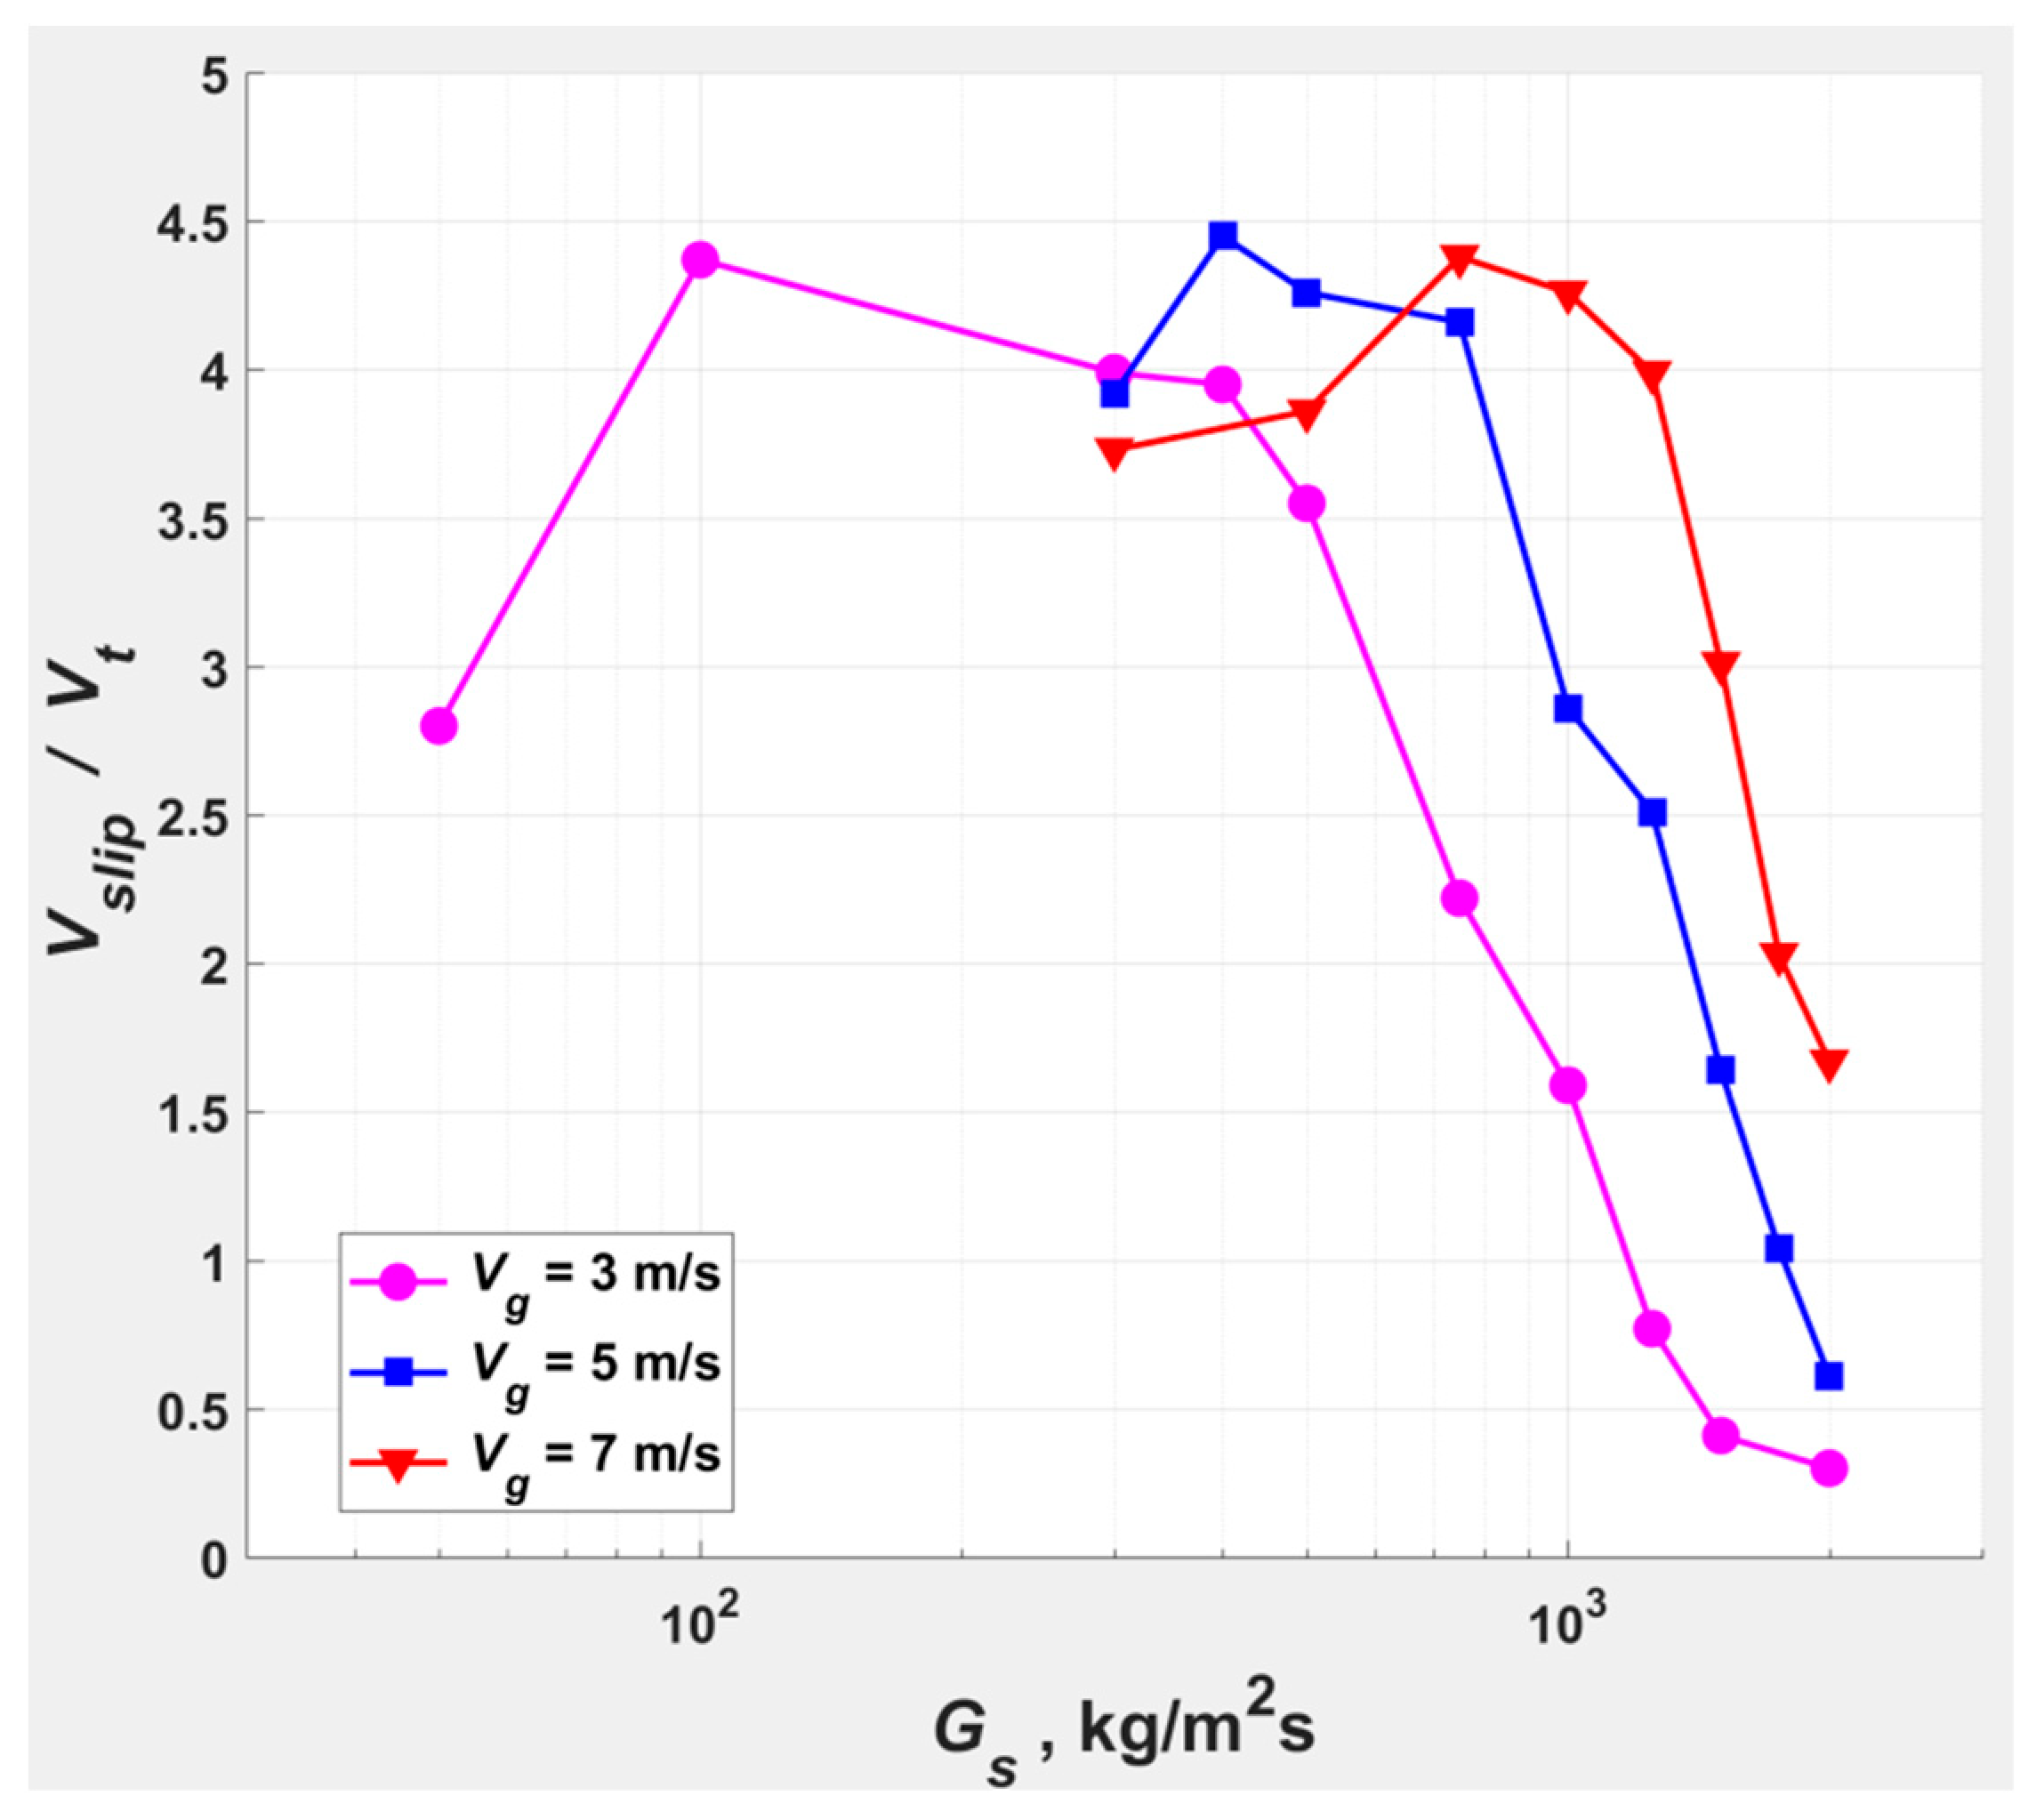
- Demonstrated that at and when increasing the gradually from a low value, increases initially to attain a maximum and falls thereafter to a low multiple of within DSU.
- Further experimental and numerical validation of the phase map with a range of SCA powders and various :
- -
- Possibility of a phase of DSU between FF and the turbulent regime at all .
- -
- Review of the suitability of the locus of as the dense–dilute transition boundary at high .
- -
- Investigation of the DSU–dilute transition at high with axially periodic BC, for example, by pseudo-2D models [54].
- -
- Suitability of as the boundary between CAF and DSU at .
- Further validation of DSU as a unique transport regime, based on the behavior of the flow field, such as by analyses of higher order moments or deterministic chaos parameters [53].
- A robust correlation for , incorporating and and based on CFB experiments with a range of Geldart A powders.
Supplementary Materials
Author Contributions
Funding
Institutional Review Board Statement
Informed Consent Statement
Data Availability Statement
Acknowledgments
Conflicts of Interest
Abbreviations
| AR | Ambient Receiver |
| BC | Boundary Condition |
| CAF | Core-Annular Flow |
| CFB | Circulating Fluidized Bed |
| DPO | Dilute Phase Only |
| DSU | Dense Suspension Upflow |
| FDC | Fluidized Dense phase Conveying |
| FF | Fast Fluidization |
| FZ | Feed Zone |
| HD-CFB | High Density Circulating Fluidized Bed |
| IPF | Impermeable Plug Flow |
| LD-CFB | Low Density Circulating Fluidized Bed |
| MFiX | ‘Multiphase Flow with Interphase Exchanges’—Opensource numerical modeling code for multiphase systems, by the National Energy Technology Laboratory, U.S. Department of Energy. |
| MFiX-TFM | TFM code offered within MFiX |
| NSF | Non-Slugging dense phase Flow |
| PMW | Phase Map of Wirth |
| PSD | Particle Size Distribution |
| RH | Relative Humidity |
| SCA | Slightly Cohesive Geldart A powders |
| SSP | S-shaped axial solids volume fraction profile |
| TDH | Transport Disengagement Height |
| TFM | Two-fluid model with constitutive relations of the Granular Kinetic Theory |
Nomenclature
| -- | Archimedes number (=) | |
| -- | Granular Bond number | |
| -- | End of accumulative choking | |
| m/s | Instantaneous velocity of a particle | |
| m/s | Peculiar velocity of a particle, . (Fluctuation of the particle velocity about the mean). | |
| m | Pipeline/riser internal diameter | |
| μm | Mean particle diameter | |
| -- | Coefficient of restitution for particle–particle collisions | |
| -- | Coefficient of restitution for particle–wall collisions | |
| N | Adhesion due to van der Waals forces | |
| m/s2 | Acceleration due to gravity, 9.81 m/s2 | |
| kg/m2s | Solids mass flux | |
| kg/m2s | Maximum solids mass flux | |
| kg/m2s | Saturation Carrying Capacity | |
| kg/m2s | Gross upflow solids mass flux | |
| kg/m2s | Minimum solids mass flux corresponding to the lower transport velocity, | |
| kg/m2s | Solids mass flux corresponding to the upper transport velocity, ; threshold for dense suspension upflow | |
| m2/s2 | Gas-phase turbulent kinetic energy | |
| m | Length of the pipeline/Height of the riser | |
| -- | Solids loading, i.e., solids to gas mass ratio | |
| -- | Maximum solids loading | |
| Pa or bar | Pressure | |
| -- | Mass fraction of fines < 45 μm | |
| bar | Pressure drop | |
| mbar/m | Pressure gradient | |
| -- | Particle Reynolds number () | |
| -- | Particle Reynolds number based on () | |
| s | Timestep in the numerical simulations | |
| m/s | Local average solids phase velocity | |
| m/s | Onset of turbulent fluidization | |
| m/s | Superficial gas velocity | |
| m/s | Superficial gas velocity at the feed zone | |
| m/s | Superficial gas velocity at minimum bubbling | |
| m/s | Superficial gas velocity at minimum fluidization | |
| m/s | Superficial gas velocity at minimum pressure (gradient) | |
| m/s | Local axial component of solids velocity | |
| m/s | Gas–solids slip velocity () | |
| m/s | Terminal settling velocity (based on mean size particle) | |
| m/s | Lower transport velocity | |
| m/s | Upper transport velocity | |
| m | Spatial coordinate in general | |
| m | Grid size in the numerical models | |
| Greek characters | ||
| -- | Void fraction | |
| -- | Solids volume fraction | |
| -- | Saturation solids volume fraction | |
| -- | Solids volume fraction at the lower transport velocity | |
| -- | Volume fraction of solids at maximum packing limit | |
| -- | Threshold volume fraction of solids for frictional stresses | |
| m2/s3 | Dissipation rate for the gas-phase turbulent kinetic energy | |
| m2/s2 | Granular temperature () | |
| kg/m s | Dynamic viscosity of the gas phase | |
| kg/m3 | Density of the gas | |
| kg/m3 | Particle density, accounting for any internal pores | |
| s | Residence time (= Volume/volumetric flowrate) | |
| s | Particle relaxation time | |
| s | Dissipative time scale | |
| s | Collisional time scale | |
| ° | Angle of internal friction | |
| ° | Angle of wall friction | |
| Subscripts | ||
| FZ | Feed Zone | |
| g | Gas phase | |
| max | maximum | |
| mb | Minimum bubbling | |
| mf | Minimum fluidization | |
| mp | Minimum pressure (gradient) | |
| p, s | Solids or particle | |
| slip | Gas–solids slip velocity | |
| t | Terminal settling velocity | |
| tr1 | Lower transport velocity | |
| tr2 | Upper transport velocity | |
| w | Wall | |
| Superscripts | ||
| max | -- | Maximum |
| min | -- | Minimum |
| tr1 | Lower transport velocity | |
| tr2 | Upper transport velocity | |
Appendix A
| Accumulative choking | ); the ‘end of accumulative choking’ (C) occurs at the transition to turbulent fluidization at the lower transport velocity. |
| Classical choking | The sharp, unstable choking observed with larger particles, typically Geldart B and D, at the transition to dense phase. |
| Core-Annular Flow (CAF) | . |
| Dense Suspension Upflow (DSU) | A vertical upflow pattern characterized by gross upflow of solids, with essentially uniform axial solids volume fraction profile and little backmixing; occurs at superficial gas velocities greater than the lower transport velocity and high solids mass flux, that is, at solids mass flux greater than the gross upflow flux corresponding to the superficial gas velocity. |
| Fast Fluidization (FF) | A vertical upflow pattern characterized by an S-shaped axial solids volume fraction profile, with a dense bottom zone, a lean top zone, and a transport disengagement height in between; includes risers with any backmixing at any elevation; probable at superficial gas velocities greater than the lower transport velocity but less than the upper transport velocity. |
| Fluid-like expansion | A component of homogeneous bed expansion characterized by hydrodynamically stabilized particulate expansion. Typically occurs with lighter particles when the interparticle forces are insignificant. May ensue directly at minimum fluidization or may follow when the yield stress of solid-like expansion is overcome. |
| ) | Solids mass flux corresponding to a superficial gas velocity (between lower and upper transport velocities) at which the entire riser turns to gross upflow of solids, with little backmixing. For a given superficial gas velocity in the range, this marks the transition from fast fluidization to dense suspension upflow. |
| High Density Circulating Fluidized Bed (HD-CFB) | A Circulating Fluidized Bed under Dense Suspension Upflow, that is, gross upflow of solids throughout the riser. |
| Homogeneous bed expansion | The phase of particulate fluidization, between minimum fluidization and minimum bubbling velocities; includes both solid-like and fluid-like stable bed expansions. |
| Impermeable plug flow (IPF) | Type of plug flow observed with fine powders (typically Geldart A and C), with plugs rendered essentially impermeable, separated by air gaps (the ‘Plug-1’ of Kalman and Rawat [44]). It is probable at lower levels of aeration, especially with relatively cohesive powders. |
| Isoflux | Lines of constant solids mass flux on phase maps. |
| Low Density Circulating Fluidized Bed (LD-CFB) | A Circulating Fluidized Bed under fast fluidization, or in general, with backmixing at any part of the riser. |
| ) | The velocity of transition from captive fluidized beds to transport regime, that is, from turbulent fluidization to fast fluidization/dense suspension upflow. |
| Minimum fluidization velocity | In a fluidization curve, that is, a plot of pressure drop across a bed of powder against superficial gas velocity, it is the intersection of the horizontal fluidized bed line and the sloping packed bed line [37]. |
| Non-slugging dense phase flow (NSF) | Vertical upflow patterns of Fluidized Dense phase Conveying of typically Geldart A powders, including core-annular flow, fast fluidization, and dense suspension upflow (but excludes turbulent fluidization). |
| Permeable Plug Flow (PPF) | The type of plug flow observed with coarse granular solids, typically; essentially, it is monodisperse Geldart D (or B) with good permeability. Solids are conveyed as intermittent full-bore plugs driven by the gas permeating through the interstices at velocities greater than that of the plugs. |
| Slightly cohesive (SCA) powders | , but liquid bridges and electrostatic and magnetic forces are excluded; show clear pressure minima in the conveying characteristics. |
| Solid-like expansion | A component of homogeneous bed expansion, typically observed with Geldart A powders, with the particles forming an expanded porous structure held together at their points of contact by interparticle forces in response to an increase in superficial gas velocity beyond minimum fluidization. May transition to a phase of fluid-like expansion or directly to a bubbling bed when the compressive/tensile yield stress of the porous structure is overcome. |
| ) | The high superficial gas velocity limit of fast fluidization, that is, the superficial gas velocity above which fast fluidization is not observed, irrespective of solids flux. |
References
- Geldart, D.; Harnby, N.; Wong, A.C. Fluidization of Cohesive Powders. Powder Technol. 1984, 37, 25–37. [Google Scholar] [CrossRef]
- Geldart, D.; Wong, A.C.Y. Fluidization of Powders Showing Degrees of Cohesiveness—I. Bed Expansion. Chem. Eng. Sci. 1984, 39, 1481–1488. [Google Scholar] [CrossRef]
- Mills, D. Pneumatic Conveying Design Guide, 2nd ed.; Elsevier: Amsterdam, The Netherlands; Butterworth Heinemann: Oxford, UK, 2004; ISBN 0-7506-5471-6. [Google Scholar]
- Breault, R.W. Scaling CFB Risers: Maintaining Microstructure Dynamics. Powder Technol. 2023, 415, 118191. [Google Scholar] [CrossRef]
- Grace, J.R.; Issangya, A.S.; Bai, D.; Bi, H.; Zhu, J. Situating the High-Density Circulating Fluidized Bed. AIChE J. 1999, 45, 2108–2116. [Google Scholar] [CrossRef]
- Cocco, R.A.; Karri, R.S.B.; Knowlton, T. Circulating Fluidized Beds. In Computational Gas-Solids Flows and Reacting Systems; Pannala, S., Syamlal, M., O’Brien, T.J., Eds.; IGI Global: Hershey, PA, USA, 2010. [Google Scholar]
- Rabinovich, E.; Kalman, H. Flow Regime Diagram for Vertical Pneumatic Conveying and Fluidized Bed Systems. Powder Technol. 2011, 207, 119–133. [Google Scholar] [CrossRef]
- Balasubramanian, P.; Cowell, A.; McGlinchey, D. Modelling Fluidized Dense Phase Conveying of Geldart A Powders with MFiX-TFM: A Case Study. In Proceedings of the NETL 2023 Virtual Workshop on Multiphase Flow Science, Virtual, 1–2 August 2023; National Energy Technology Laboratory, U.S. Department of Energy: Morgantown, WV, USA, 2023. Available online: https://mfix.netl.doe.gov/wp-content/uploads/2023/08/Presentation_Prabu-Balasubramanian_23Jul23.pdf (accessed on 1 August 2023).
- Balasubramanian, P.; Cowell, A.; McGlinchey, D. Adaptation of the Vertical Upflow Phase Map of Wirth to Fluidized Dense Phase Conveying of Geldart A Powders and Validation of the Transition Boundaries by Eulerian Modelling with MFiX-TFM. In Proceedings of the NETL 2024 Workshop on Multiphase Flow Science, Morgantown, WV, USA, 13–14 August 2024; National Energy Technology Laboratory, U.S. Department of Energy: Morgantown, WV, USA, 2024. Available online: https://mfix.netl.doe.gov/wp-content/uploads/2024/09/Balasubramanian_081324_940AM.pdf (accessed on 13 August 2024).
- Balasubramanian, P. Phase Maps for Fluidized Dense Phase Conveying and Validation by Eulerian Modelling. Ph.D. Thesis, Glasgow Caledonian University, Glasgow, UK, 2025. [Google Scholar] [CrossRef]
- Wirth, K.-E. Axial Pressure Profile in Circulating Fluidized Beds. Chem. Eng. Technol. 1988, 11, 11–17. [Google Scholar] [CrossRef]
- Bi, H.T.; Ellis, N.; Abba, I.A.; Grace, J.R. A State-of-the-Art Review of Gas-Solid Turbulent Fluidization. Chem. Eng. Sci. 2000, 55, 4789–4825. [Google Scholar] [CrossRef]
- Kim, S.W.; Kirbas, G.; Bi, H.; Jim Lim, C.; Grace, J.R. Flow Behavior and Regime Transition in a High-Density Circulating Fluidized Bed Riser. Chem. Eng. Sci. 2004, 59, 3955–3963. [Google Scholar] [CrossRef]
- Li, Y.; Kwauk, M. The Dynamics of Fast Fluidization. In Fluidization; Grace, J.R., Matsen, J.M., Eds.; Springer: Boston, MA, USA, 1980; pp. 537–544. ISBN 978-1-4684-1045-7. [Google Scholar]
- Monazam, E.R.; Shadle, L.J. Method and Prediction of Transition Velocities in a Circulating Fluidized Bed’s Riser. Ind. Eng. Chem. Res. 2011, 50, 1921–1927. [Google Scholar] [CrossRef]
- Wang, C.; Su, X.; Luo, M.; Lan, X.; Gao, J.; Xu, C.; Ye, M.; Zhu, J. Flow Characteristics in a Pilot-Scale Circulating Fluidized Bed with High Solids Flux up to 1800 Kg/m2 s. Powder Technol. 2022, 405, 117542. [Google Scholar] [CrossRef]
- Yerushalmi, J.; Cankurt, N. Further Studies of the Regimes of Fluidization. Powder Technol. 1979, 24, 187–205. [Google Scholar] [CrossRef]
- Avidan, A.A.; Yerushalmi, J. Bed Expansion in High Velocity Fluidization. Powder Technol. 1982, 32, 223–232. [Google Scholar] [CrossRef]
- Issangya, A.S.; Karri, S.B.R.; Cocco, R.A.; Knowlton, T.; Chew, J.W. Solids Flux Profiles of Geldart Group A Particles in High-Velocity Circulating Fluidized Bed Risers. Can. J. Chem. Eng. 2023, 101, 256–268. [Google Scholar] [CrossRef]
- Pan, R. Material Properties and Flow Modes in Pneumatic Conveying. Powder Technol. 1999, 104, 157–163. [Google Scholar] [CrossRef]
- Geldart, D. Types of Gas Fluidization. Powder Technol. 1973, 7, 285–292. [Google Scholar] [CrossRef]
- Grace, J.R. Contacting Modes and Behaviour Classification of Gas—Solid and Other Two-Phase Suspensions. Can. J. Chem. Eng. 1986, 64, 353–363. [Google Scholar] [CrossRef]
- Jones, M. Characterisation for Pneumatic Conveyor Design. In Characterisation of Bulk Solids; McGlinchey, D., Ed.; Blackwell Publishing: Oxford, UK, 2005. [Google Scholar]
- Jones, M.G.; Williams, K.C. Predicting the Mode of Flow in Pneumatic Conveying Systems—A Review. Particuology 2008, 6, 289–300. [Google Scholar] [CrossRef]
- Kaur, B.; Mittal, A.; Mallick, S.S.; Pan, R.; Jana, S. Numerical Simulation of Fluidized Dense-Phase Pneumatic Conveying of Powders to Develop Improved Model for Solids Friction Factor. Particuology 2017, 35, 42–50. [Google Scholar] [CrossRef]
- Mallick, S.S.; Wypych, P.W. Minimum Transport Boundaries for Pneumatic Conveying of Powders. Powder Technol. 2009, 194, 181–186. [Google Scholar] [CrossRef]
- Pan, R.; Mi, B.; Wypych, P. Pneumatic Conveying Characteristics of Fine and Granular Bulk Solids. KONA Powder Part. J. 1994, 12, 77–85. [Google Scholar] [CrossRef]
- Setia, G.; Mallick, S.S.; Pan, R.; Wypych, P.W. An Experimental Investigation into Modeling Solids Friction for Fluidized Dense-Phase Pneumatic Transport of Powders. Particuology 2017, 30, 83–91. [Google Scholar] [CrossRef]
- Valverde, J.M.M. Fluidization of Fine Powders: Cohesive Versus Dynamical Aggregation, 1st ed.; Particle Technology Series; Springer Nature: Dordrecht, The Netherlands, 2013; Volume 18, ISBN 978-94-007-5587-1. [Google Scholar]
- Bi, H.T.; Grace, J.R.; Zhu, J.-X.X. Types of Choking in Vertical Pneumatic Systems. Int. J. Multiph. Flow 1993, 19, 1077–1092. [Google Scholar] [CrossRef]
- Bi, H.T.; Grace, J.R. Flow Patterns in High-Velocity Fluidized Beds and Pneumatic Conveying. Can. J. Chem. Eng. 1999, 77, 223–230. [Google Scholar] [CrossRef]
- Klinzing, G.E.; Rizk, F.; Marcus, R.; Leung, L.S. Pneumatic Conveying of Solids A Theoretical and Practical Approach, 3rd ed.; Springer: Dordrecht, The Netherlands, 2010. [Google Scholar]
- Kunii, D.; Levenspiel, O. Fluidization Engineering, 2nd ed.; Butterworth-Heinemann: Oxford, UK, 1991. [Google Scholar]
- Liu, D.; Kwauk, M.; Li, H. Aggregative and Particulate Fluidization—The Two Extremes of a Continuous Spectrum. Chem. Eng. Sci. 1996, 51, 4045–4063. [Google Scholar] [CrossRef]
- Loezos, P.N.; Costamagna, P.; Sundaresan, S. The Role of Contact Stresses and Wall Friction on Fluidization. Chem. Eng. Sci. 2002, 57, 5123–5141. [Google Scholar] [CrossRef]
- Yerushalmi, J.; Avidan, A. High-Velocity Fluidization. In Fluidization; Davidson, J.F., Clift, R., Harrison, D., Eds.; Academic Press, Inc.: Orlando, FL, USA, 1985. [Google Scholar]
- Geldart, D. The Characterisation of Bulk Powders. In Characterisation of Bulk Solids; McGlinchey, D., Ed.; Blackwell Publishing: Oxford, UK, 2005. [Google Scholar]
- Geldart, D.; Wong, A.C.Y. Fluidization of Powders Showing Degrees of Cohesiveness—II. Experiments on Rates of de-Aeration. Chem. Eng. Sci. 1985, 40, 653–661. [Google Scholar] [CrossRef]
- Grace, J.R. Slug Flow. In Essentials of Fluidization Technology; Bi, X., Ellis, N., Grace, J.R., Eds.; Wiley-VCH: Weinheim, Germany, 2020; ISBN 3-527-69949-X. [Google Scholar]
- Bi, X. Turbulent Fluidization. In Essentials of Fluidization Technology; Grace, J.R., Ellis, N., Bi, X., Eds.; Wiley-VCH: Weinheim, Germany, 2020; ISBN 3-527-69949-X. [Google Scholar]
- Kim, S.W.; Kirbas, G.; Bi, H.; Lim, C.J.; Grace, J.R. Flow Structure and Thickness of Annular Downflow Layer in a Circulating Fluidized Bed Riser. Powder Technol. 2004, 142, 48–58. [Google Scholar] [CrossRef]
- Squires, A.M.; Kwauk, M.; Avidan, A.A. Fluid Beds: At Last, Challenging Two Entrenched Practices. Science 1985, 230, 1329–1337. [Google Scholar] [CrossRef]
- Bi, H.T.; Grace, J.R.; Zhu, J. Regime Transitions Affecting Gas-Solids Suspensions and Fluidized Beds. Chem. Eng. Res. Des. 1995, 73, 154–161. [Google Scholar] [CrossRef]
- Kalman, H.; Rawat, A. Flow Regime Chart for Pneumatic Conveying. Chem. Eng. Sci. 2020, 211, 115256. [Google Scholar] [CrossRef]
- Rawat, A.; Kalman, H. Modification and Validation of Particulate Plug-I Pressure Drop Model. Powder Technol. 2019, 347, 243–254. [Google Scholar] [CrossRef]
- Cong, X.; Guo, X.; Lu, H.; Gong, X.; Liu, K.; Sun, X.; Xie, K. Flow Patterns of Pulverized Coal Pneumatic Conveying and Time-Series Analysis of Pressure Fluctuations. Chem. Eng. Sci. 2013, 101, 303–314. [Google Scholar] [CrossRef]
- Kalman, H. Role of Reynolds and Archimedes Numbers in Particle-Fluid Flows. Rev. Chem. Eng. 2022, 38, 149–165. [Google Scholar] [CrossRef]
- Pita, J.A.; Sundaresan, S. Gas-Solid Flow in Vertical Tubes. AIChE J. 1991, 37, 1009–1018. [Google Scholar] [CrossRef]
- Breault, R.W.; Weber, J. Saturation Carrying Capacity for Group A Particles in a Circulating Fluidized Bed. Energies 2021, 14, 2809. [Google Scholar] [CrossRef]
- Hirama, T.; Chiba, T.; Takeuchi, H. Regime Classification of Macroscopic Gas-Solid Flow in a Circulating Fluidized Bed Riser. Powder Technol. 1992, 70, 215–222. [Google Scholar] [CrossRef]
- Matsen, J.M. Mechanisms of Choking and Entrainment. Powder Technol. 1982, 32, 21–33. [Google Scholar] [CrossRef]
- Mori, S.; Liu, D.; Kato, K.; Kobayashi, E. Flow Regimes and Critical Velocity in a Circulating Fluidized Bed. Powder Technol. 1992, 70, 223–227. [Google Scholar] [CrossRef]
- Breault, R.W.; Weber, J.; Shadle, L.J. The Development of a Generalized Riser Flow Regime Map Based upon Higher Moment and Chaotic Statistics Using Electrical Capacitance Volume Tomography (ECVT). Powder Technol. 2020, 365, 12–27. [Google Scholar] [CrossRef]
- Benyahia, S.; Syamlal, M.; O’Brien, T.J. Study of the Ability of Multiphase Continuum Models to Predict Core-Annulus Flow. AIChE J. 2007, 53, 2549–2568. [Google Scholar] [CrossRef]
- Sundaresan, S.; Ozel, A.; Kolehmainen, J. Toward Constitutive Models for Momentum, Species, and Energy Transport in Gas–Particle Flows. Annu. Rev. Chem. Biomol. Eng. 2018, 9, 61–81. [Google Scholar] [CrossRef]
- Issangya, A.S.; Bai, D.; Bi, H.T.; Lim, K.S.; Zhu, J.; Grace, J.R. Suspension Densities in a High-Density Circulating Fluidized Bed Riser. Chem. Eng. Sci. 1999, 54, 5451–5460. [Google Scholar] [CrossRef]
- Shaffer, F.; Gopalan, B.; Breault, R.W.; Cocco, R.A.; Karri, S.B.R.; Hays, R.; Knowlton, T.M. High Speed Imaging of Particle Flow Fields in CFB Risers. Powder Technol. 2013, 242, 86–99. [Google Scholar] [CrossRef]
- Arastoopour, H.; Gidaspow, D.; Abbasi, E. Computational Transport Phenomena of Fluid-Particle Systems; Springer: Cham, Germany, 2017; ISBN 978-3-319-45488-7. [Google Scholar]
- Zhu, K.; Wong, C.K.; Rao, S.M.; Wang, C.H. Pneumatic Conveying of Granular Solids in Horizontal and Inclined Pipes. AIChE J. 2004, 50, 1729–1745. [Google Scholar] [CrossRef]
- Miao, Z.; Kuang, S.; Zughbi, H.; Yu, A. Numerical Simulation of Dense-Phase Pneumatic Transport of Powder in Horizontal Pipes. Powder Technol. 2020, 361, 62–73. [Google Scholar] [CrossRef]
- McGlinchey, D.; Cowell, A.; Knight, E.A.; Pugh, J.R.; Mason, A.; Foster, B. Bend Pressure Drop Predictions Using the Euler-Euler Model in Dense Phase Pneumatic Conveying. Part. Sci. Technol. 2007, 25, 495–506. [Google Scholar] [CrossRef]
- Wang, Y.; Williams, K.C.; Jones, M.G.; Chen, B. Gas–Solid Flow Behaviour Prediction for Sand in Bypass Pneumatic Conveying with Conventional Frictional-Kinetic Model. Appl. Math. Model. 2016, 40, 9947–9965. [Google Scholar] [CrossRef]
- Balzer, G.; Simonin, O.; Boelle, A.; Lavieville, J. A Unifying Modelling Approach for the Numerical Prediction of Dilute and Dense Gas—Solid Two Phase Flow. In Proceedings of the CFB5, 5th International Conference on Circulating Fluidized Beds, Beijing, China, 28–31 May 1996. [Google Scholar]
- He, J.; Simonin, O. Non-Equilibrium Prediction of Particle-Phase Stress Tensor in Vertical Pneumatic Conveying. Gas-Solid. Flows ASME FED 1993, 166, 253–263. [Google Scholar]
- Benyahia, S.; Syamlal, M.; O’Brien, T.J. Evaluation of Boundary Conditions Used to Model Dilute, Turbulent Gas/Solids Flows in a Pipe. Powder Technol. 2005, 156, 62–72. [Google Scholar] [CrossRef]
- Srivastava, A.; Sundaresan, S. Analysis of a Frictional—Kinetic Model for Gas—Particle Flow. Powder Technol. 2003, 129, 72–85. [Google Scholar] [CrossRef]
- Di Felice, R. The Voidage Function for Fluid-Particle Interaction Systems. Int. J. Multiph. Flow 1994, 20, 153–159. [Google Scholar] [CrossRef]
- Andrews, A.T., IV; Loezos, P.N.; Sundaresan, S. Coarse-Grid Simulation of Gas-Particle Flows in Vertical Risers. Ind. Eng. Chem. Res. 2005, 44, 6022–6037. [Google Scholar] [CrossRef]
- Cloete, J.H.; Cloete, S.; Radl, S.; Amini, S. Evaluation of Wall Friction Models for Riser Flow. Powder Technol. 2016, 303, 156–167. [Google Scholar] [CrossRef]
- MFiX User Guide—Release 22.3. MFS Development Group, 27 September 2022. Available online: https://mfix.netl.doe.gov/products/mfix/mfix-documentation/ (accessed on 30 September 2022).
- Gu, Y.; Ozel, A.; Sundaresan, S. Numerical Studies of the Effects of Fines on Fluidization. AIChE J. 2016, 62, 2271–2281. [Google Scholar] [CrossRef]
- Gu, Y.; Ozel, A.; Kolehmainen, J.; Sundaresan, S. Computationally Generated Constitutive Models for Particle Phase Rheology in Gas-Fluidized Suspensions. J. Fluid Mech. 2019, 860, 318–349. [Google Scholar] [CrossRef]
- Askarishahi, M.; Salehi, M.; Radl, S. Capability of the TFM Approach to Predict Fluidization of Cohesive Powders. Ind. Eng. Chem. Res. 2022, 61, 3186–3205. [Google Scholar] [CrossRef]
- Wang, J.; van der Hoef, M.A.; Kuipers, J.A.M. The Role of Scale Resolution versus Inter-Particle Cohesive Forces in Two-Fluid Modeling of Bubbling Fluidization of Geldart A Particles. Chem. Eng. Sci. 2011, 66, 4229–4240. [Google Scholar] [CrossRef]
- Kalman, H.; Satran, A.; Meir, D.; Rabinovich, E. Pickup (Critical) Velocity of Particles. Powder Technol. 2005, 160, 103–113. [Google Scholar] [CrossRef]
- Mckeen, T.; Pugsley, T. Simulation and Experimental Validation of a Freely Bubbling Bed of FCC Catalyst. Powder Technol. 2003, 129, 139–152. [Google Scholar] [CrossRef]
- Foerster, S.F.; Louge, M.Y.; Chang, H.; Allia, K. Measurements of the Collision Properties of Small Spheres. Phys. Fluids 1994, 6, 1108–1115. [Google Scholar] [CrossRef]
- Abrahamsen, A.R.; Geldart, D. Behaviour of Gas-Fluidized Beds of Fine Powders. Pt. 1. Homogeneous Expansion. Powder Technol. 1980, 26, 35–46. [Google Scholar] [CrossRef]
- Brouwer, G.C.; Wagner, E.C.; van Ommen, J.R.; Mudde, R.F. Effects of Pressure and Fines Content on Bubble Diameter in a Fluidized Bed Studied Using Fast X-Ray Tomography. Chem. Eng. J. 2012, 207, 711–717. [Google Scholar] [CrossRef]
- Klinzing, G.E. Electrostatics in Pneumatic Conveying. In Handbook of Fluidization and Fluid-Particle Systems; Yang, W.-C., Ed.; CRC: Boca Raton, FL, USA, 2003. [Google Scholar]
- Sundaresan, S. Contact Charging in Particulate Flows. In Proceedings of the NETL 2023 Virtual Workshop on Multiphase Flow Science, Virtual, 1–2 August 2023; National Energy Technology Laboratory, U.S. Department of Energy: Morgantown, WV, USA, 2023. [Google Scholar]
- Visser, J. Particle Adhesion and Removal: A Review. Part. Sci. Technol. 1995, 13, 169–196. [Google Scholar] [CrossRef]
- Butt, H.-J.; Kappl, M. Surface and Interfacial Forces, 2nd ed.; Wiley-VCH: Weinheim, Germany, 2018; ISBN 978-3-527-80434-4. [Google Scholar]
- Boyce, C.M.; Ozel, A.; Kolehmainen, J.; Sundaresan, S. Analysis of the Effect of Small Amounts of Liquid on Gas–Solid Fluidization Using CFD-DEM Simulations. AIChE J. 2017, 63, 5290–5302. [Google Scholar] [CrossRef]
- Agrawal, K.; Loezos, P.N.; Syamlal, M.; Sundaresan, S. The Role of Meso-Scale Structures in Rapid Gas-Solids Flows. J. Fluid Mech. 2001, 445, 151–185. [Google Scholar] [CrossRef]
- Li, T.; Pannala, S.; Shahnam, M. CFD Simulations of Circulating Fluidized Bed Risers, Part II, Evaluation of Differences between 2D and 3D Simulations. Powder Technol. 2014, 254, 115–124. [Google Scholar] [CrossRef]
- Li, T.; Gel, A.; Pannala, S.; Shahnam, M.; Syamlal, M. CFD Simulations of Circulating Fluidized Bed Risers, Part I: Grid Study. Powder Technol. 2014, 265, 2–12. [Google Scholar] [CrossRef]
- Grace, J.R. Reflections on Turbulent Fluidization and Dense Suspension Upflow. Powder Technol. 2000, 113, 242–248. [Google Scholar] [CrossRef]
μm | kg/m3 | m/s | D m | L m | m/s | kg/m2s | m/s | m/s | kg/m2s | Reference | |
|---|---|---|---|---|---|---|---|---|---|---|---|
| (30) * | (1500) * | -- | 0.039 | 0.19 | 11.5 | 1–3 | 38 | ~1.0 | 1.8 | 38 | [11] |
| 85 | 1500 | ~0.1 | (0.33) * | 0.08 | 18.0 | 5–9 | 800–1800 | -- | 9.0 | 1400 | [16] |
| 79 | 1490 | 0.08 | (0.24) * | 0.303 | 20.4 | 12.2 | 285–690 | -- | >12.8 | -- | [19] |
| Regime | (m/s) | (kg/m2s) | (m2/s2) | Flow in the Annular Region |
|---|---|---|---|---|
| CAF | # | Net upflow with (at least some) downflow. | ||
| FF | , the annulus transitions from net downflow to net upflow (Figure 14). | |||
| DSU | Gross upflow. | |||
| # | ||||
| Dilute phase | $ | Gross upflow. |
| Property | Value | Remarks | ||
|---|---|---|---|---|
| Particle diameter | µm | 70 | Monodisperse spheres | |
| Particle density | kg/m3 | 1400 | ||
| Archimedes number | -- | 17.5 | ||
| Solids volume fraction—random loose-packed | -- | 0.6 | Maximum packing limit [33,76] | |
| Particle–particle restitution | -- | 0.95 | ||
| Particle–wall restitution | -- | 0.89 | [77] | |
| Angle of wall friction | ° | 11.86 | [77] | |
| Angle of internal friction | ° | 30 | [76] | |
| Terminal settling velocity | m/s | 0.186 | Haider and Levenspiel [33] | |
| Minimum fluidization velocity | m/s | 0.003 | Baeyens’ equation [37] | |
| Minimum bubbling velocity | m/s | 0.007 | Abrahamsen and Geldart [78] | |
| Lower transport velocity | m/s | 1.4 | Bi et al. [43] | |
| Upper transport velocity | m/s | 6.3 | Equation (1) | |
Disclaimer/Publisher’s Note: The statements, opinions and data contained in all publications are solely those of the individual author(s) and contributor(s) and not of MDPI and/or the editor(s). MDPI and/or the editor(s) disclaim responsibility for any injury to people or property resulting from any ideas, methods, instructions or products referred to in the content. |
© 2025 by the authors. Licensee MDPI, Basel, Switzerland. This article is an open access article distributed under the terms and conditions of the Creative Commons Attribution (CC BY) license (https://creativecommons.org/licenses/by/4.0/).
Share and Cite
Balasubramanian, P.; Cowell, A.; McGlinchey, D. A Phase Map for Vertical Upflow of Slightly Cohesive Geldart A Powders Focused on High Solids Mass Flux. Appl. Sci. 2025, 15, 12503. https://doi.org/10.3390/app152312503
Balasubramanian P, Cowell A, McGlinchey D. A Phase Map for Vertical Upflow of Slightly Cohesive Geldart A Powders Focused on High Solids Mass Flux. Applied Sciences. 2025; 15(23):12503. https://doi.org/10.3390/app152312503
Chicago/Turabian StyleBalasubramanian, Prabu, Andrew Cowell, and Don McGlinchey. 2025. "A Phase Map for Vertical Upflow of Slightly Cohesive Geldart A Powders Focused on High Solids Mass Flux" Applied Sciences 15, no. 23: 12503. https://doi.org/10.3390/app152312503
APA StyleBalasubramanian, P., Cowell, A., & McGlinchey, D. (2025). A Phase Map for Vertical Upflow of Slightly Cohesive Geldart A Powders Focused on High Solids Mass Flux. Applied Sciences, 15(23), 12503. https://doi.org/10.3390/app152312503


