Abstract
Edge detection is critical in various computer vision applications such as object recognition, segmentation, and scene understanding. The Canny edge detector remains widely used in traditional methods due to its balance between accuracy and computational efficiency. However, optimal performance depends heavily on carefully selecting three threshold parameters. Prior studies have proposed reinforcement learning-based approaches to automatically determine these parameters. Still, they rely on a supervised edge evaluation network that requires manually annotated high-quality edge labels—a costly and time-consuming prerequisite. This paper proposes a novel approach that eliminates the need for manually labeled data by introducing a weakly supervised reward scheme. We automatically generate weak edge labels from gradient information and use them as pseudo ground truth to compute reward values during the reinforcement learning process. The proposed method leverages an Actor-Critic algorithm to learn adaptive thresholds for the Canny edge detector without explicit supervision. Experimental results demonstrate that our method achieves comparable or superior edge detection performance compared to previous supervised methods and generalizes effectively to unseen datasets.
1. Introduction
Image edge can be used for object detection, image segmentation, motion analysis, and 3D reconstruction [,,,]. Initially, filter-based and statistical analysis-based edge detection algorithms emerged [,,]. After the emergence of deep learning, edge detection is also performed using CNN [,,]. The Canny algorithm [] remains widely used for detecting edges in images. It requires setting the values of three parameters related to the smoothing window size and two thresholds in the hysteresis process.
Our previous works [,] employed deep reinforcement learning to determine the three threshold values in the Canny algorithm. However, both methods relied on a supervised edge evaluation network, which required manually annotated edge labels. In this paper, we propose an algorithm that eliminates the need for an edge evaluation network to determine the values of three thresholds in the Canny algorithm, utilizing deep reinforcement learning. In our previous work [], we used the Deep Q-Network (DQN) [,] to determine the values of two thresholds in the Canny algorithm. We used a fixed value for a parameter related to the smoothing window size. In our previous work [], we proposed an algorithm that can automatically determine the three parameters in the Canny algorithm. We employed an actor-critic algorithm [,,] with continuous action spaces. Both approaches [,] require training of the edge evaluation network. We should prepare the correct edge image for each input image for training, which requires a significant amount of time. It is well known that supervised learning performs well in environments similar to the one in which it was trained. However, it results in poor performance in environments that differ from the training environment. One way to adapt to a new environment is to retrain using an image of the corresponding domain. Additionally, this requires the preparation of ground-truth labels. This paper proposes an algorithm for automatically selecting optimal values for three thresholds in the Canny algorithm, eliminating the need for edge labels, as compared to our previous algorithms [,].
The proposed algorithm makes three primary contributions.
(1) We introduce a weakly supervised reinforcement learning framework that eliminates the need for manually annotated edge labels by automatically generating pseudo edge maps from gradient information.
(2) We design a quantitative reward function based on Baddeley’s distance metric, enabling the agent to learn adaptive threshold parameters directly from weak labels without relying on a separate edge evaluation network.
(3) We demonstrate through extensive experiments that the proposed method achieves competitive or superior performance to supervised actor–critic models and exhibits strong generalization capability to unseen domains.
Together, these contributions provide a scalable and label-efficient solution to adaptive edge detection, making it highly practical for real-world scenarios where manual annotation is infeasible.
2. Related Works
Edge detection has long been a subject of study, and algorithms can be broadly classified into filter-based, learning-based, and deep learning-based approaches.
2.1. Filter-Based Algorithms
The proper reflection of intensity, color, and texture changes is studied in filter-based algorithms [,]. In the early stage, hand-crafted features are manually designed for use in learning-based algorithms. Manually designed features with information theory are used in statistical edges [], Pb [], and gPb []. Also, various learning-based methods, including BEL [], multi-scale [], sketch tokens [], and structured edges [], use manually designed features. Dollar et al. [] proposed an algorithm for detecting structured edges through joint learning, ground-truth clustering, and mapping image patches to clustered tokens. It demonstrated state-of-the-art performance on the BSDS500 dataset before the emergence of deep learning-based algorithms. These learning-based algorithms have the advantage of producing edge images in an automated way with structured information on images. However, their generality power is verified on several images compared to deep learning-based algorithms.
2.2. Deep Learning-Based Algorithms
Deep learning-based algorithms use features with convolutional neural networks (CNN) []. Bertasius et al. [] utilize a CNN to extract features from candidate contour points. Holistically Nested Edge Detection (HED) is proposed by Xie et al. [], which integrates the outputs from different intermediate layers through skip connections. Xu et al. [] employ a gated conditional random field to identify multi-scale features within a hierarchical model. He et al. [] propose a Bi-Directional Cascade Network (BDCN) structure to detect edges at different scales. The network is trained using corresponding edge labels at each scale. Recent algorithms for edge detection focus on accurately detecting object boundaries, which can be utilized for object detection, segmentation, and tracking.
This paper addresses the automatic selection of three threshold values in the Canny edge detection algorithm. Various algorithms have also been proposed. Lu et al. [] proposed an algorithm that uses the histogram of the gradient image for the automatic selection of thresholds for the Canny algorithm. In Fang et al. [], the Otsu method [] is employed to determine a high threshold for the Canny algorithm, but they are unable to select a low threshold. Huo et al. [] proposed an algorithm to determine high and low thresholds in the Canny algorithm, where a low threshold is determined with a probability model. In Lu et al. [], the assumptions of minimal meaningful gradient and maximal meaningless gradient magnitude are used in the adaptive selection of two thresholds in the Canny algorithm. Yitzhaky and Peli [] proposed a two-step approach to select the optimal edge parameters. First, they construct the Estimated Ground Truth (EGT) with different detection results. Finally, they determine the optimal parameter set using a Chi-square test.
Medina-Carnicer et al. [] proposed an algorithm for the unsupervised determination of hysteresis thresholds by integrating the advantages and disadvantages of two thresholding algorithms. They find the best hysteresis thresholds among a set of candidates. In Mediana-Carnicer et al. [], an algorithm is proposed for automatically selecting hysteresis thresholds in the Canny algorithm, which can be utilized as an unsupervised edge detector. Unsupervised methods have the advantage that they do not require a learning process. However, they only provide evaluation results for a limited number of images. To assess their performance objectively, they must be evaluated in diverse scenarios with numerous images, such as those used in deep learning.
Temporal decision-making problems can be solved with reinforcement learning []. An agent aims to learn a policy that maximizes accumulated reward from an environment in reinforcement learning. Following the emergence of deep learning, incorporating it into reinforcement learning has demonstrated human-level control [,,]. Deep Q-Networks (DQN) [,] showed that human-level control is possible on Atari games. Deep reinforcement learning has achieved impressive successes on various tasks, including playing the board game Go [,,], object localization [], region proposal [], and visual tracking [].
Our previous works [,] proposed algorithms for automatically selecting three good threshold values in the Canny algorithm with deep reinforcement learning. They [,] use an edge evaluation network that requires a manually selected edge label to determine reward. This paper proposes an algorithm that eliminates the need for manually selected edge labels by utilizing automatically generated edge images as pseudo labels to determine the reward.
3. Proposed Method
3.1. Actor and Critic Network
We employ the same actor and critic networks as those described in our previous paper [], which are illustrated in Figure 1 and Figure 2. These are included to help the reader understand and complete the paper.
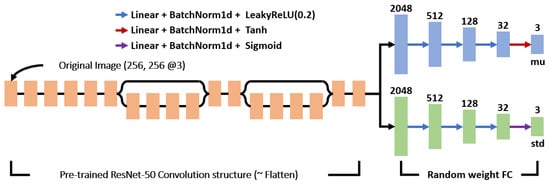
Figure 1.
The structure of the actor network used in [].
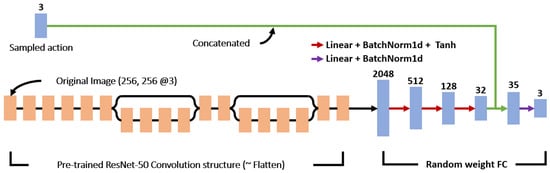
Figure 2.
The structure of the critic network used in [].
In the A2C (Advantage Actor-Critic) [,,], an actor network evaluates actions performed by an agent, and a critic network evaluates the accumulated return from the current state. There are two kinds of actor and critic network configurations in the A2C algorithm. The first method uses the same backbone and has two branch outputs for the actor and critic networks. The second method utilizes two distinct networks: the actor network and the critic network. Through experiments, we found that the first method, which uses the same backbone, gives inconsistent results, including divergence during training. Therefore, our previous work utilized separate actor and critic networks [].
The A2C algorithm has the advantage of dealing with continuous actions compared to the DQN. The policy will have a continuous output if it follows a normal distribution.
and is the mean and standard deviation of the Gaussian distribution. and is state and action. represents the parameters of the policy network .
Figure 1 shows the structure of the proposed actor network. We use an original image as the input to the network. The actor network determines the mean and variance of the Gaussian distribution. The network output corresponds to the mean and variance of three actions. We select threshold values randomly from the Gaussian distribution.
We extract features of the original image using a pre-trained CNN of the ResNet50 structure. Then, they are used to yield the mean and standard deviation of the Gaussian distribution. Parameters related to the fully connected (FC) layers are trained after random initialization. We use the tanh activation function at the last layer to ensure the mean has a value between −1 and 1. We use the sigmoid function as the activation function in the last layer to provide a standard deviation that has a value between 0 and 1. The output of the actor network is continuous real values, and it is necessary to convert them into the range used in the Canny algorithm. For the high and low thresholds, we convert the actor network’s output into an integer ranging from 0 to 500. For the filter size of the smoothing window, we convert the output of the actor network into an integer value between 3 and 9.
Figure 2 shows the structure of the critic network used in []. The input of the critic network is composed of an original image and action values, while a typical critic network uses only the current state as input. We randomly select action values from the normal distribution provided by the actor network and then use them as input for the actor network. The output of the critic network corresponds to the state value function . Since the critic network is a model that approximates the value according to each action, we use action values as the input of the critic network. Through this, we can guarantee that training will increase the probability of selecting proper actions from the normal distribution of the actor network. We do not use an activation function at the output layer in the critic network. It is based on the consideration that the critical network evaluates the accumulated return from the current state. In addition, we concatenate three action values with features from the pre-trained model in the middle of the fully connected layer to prevent them from being reflected in a small proportion.
3.2. Computing Reward Using Weak Labels
The authors’ previous methods [,] used a supervised learning-based method to calculate the reward value. In [], edge images are used as inputs to the edge evaluation network. In [], the original image and edge images are used as inputs to the edge evaluation network, and the reward value is determined based on the network’s output. To train the edge evaluation network, it is necessary to manually classify a large number of edge images. This training data preparation has the disadvantage of requiring a lot of time.
In this paper, we propose a method to overcome this disadvantage. Unlike previous studies, the proposed method does not use an edge evaluation network. The automatically generated edge images are considered weak labels. The reward value is determined by comparing the edge images with the weak labels and the agent’s output values. Although the weak labels have lower quality than manually selected edge images, they can be automatically generated, which gives them the advantage of being flexible in responding to new environments.
Figure 3 shows the automatic generation process of the proposed weak labels. Figure 3a shows the entire process. The gradient magnitude and direction are calculated for the input image using the change in brightness value for each pixel. In this process, the rate of change is calculated for each color channel, and the average value is used for each pixel. It is assumed that the gradient magnitude obtained in this way will show a Gaussian distribution in a sufficiently large number of data points. Based on this, the pixel with a value corresponding to 30% of the distribution of the gradient magnitude values is determined as the boundary point. This is implemented so that the pixel is defined as the boundary point if the difference between the average of the gradient magnitude and the pixel value exceeds 0.5 times the variance of the gradient magnitude. Comparing the boundary point and its surrounding values was applied to generate a more detailed boundary image.
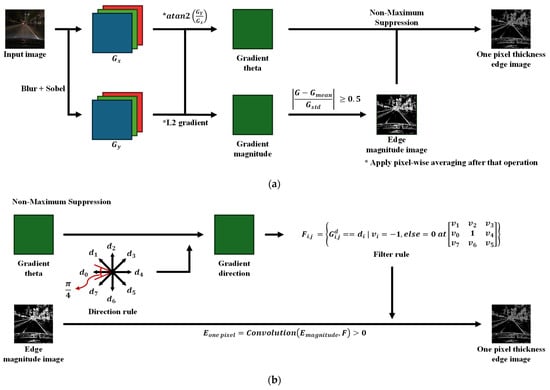
Figure 3.
Edge image generation for use as a weak label (a) Overall process (b) Non-maximum suppression process.
As shown in Figure 3b, the gradient direction with eight directions was calculated based on the gradient theta. Based on this, the direction filter to be applied to each boundary point was determined, and the cases where the filtered value was zero or more were collected to generate a one-pixel edge image. In this study, the Sobel filter was used to obtain the gradient magnitude, and the gradient path was determined by applying arctan2, as shown in Figure 3b, and by dividing the eight directions into equal intervals.
The evaluation of edge images during the training process is performed as follows. First, check whether the high and low thresholds of the Canny edge among the three thresholds determined through the actor network are inverted. Threshold reversal refers to the case where the low threshold value exceeds the high threshold, resulting in incorrect hysteresis behavior. Such configurations are assigned the lowest reward during training.
If the two thresholds are not inverted, the reward value is determined by comparing the edge image generated with the three thresholds determined through the actor network with the automatically generated weak label edge image. Baddeley’s evaluation method [] compares the two edges.
Baddeley’s measure [] is used to quantify the performance of each method. It is defined as follows.
denotes the shortest distance from to . is a continuous function with concave and strictly increasing properties. can have a value from 0 to 1. For similar images A and B, gives a value close to 0. Baddeley used the transformation for a fixed . We denote H and W as the width and height of an image. The values and were used in the evaluation.
Table 1 shows two reward determination methods using the proposed Baddeley evaluation method. Determining rewards using the value obtained through the Baddeley evaluation involves two methods: absolute and relative evaluation.

Table 1.
Two types of methods to reflect Baddeley’s measure.
In both methods, the evaluation is applied equally, based on the inversion of the Canny edge’s high and low threshold values. If the threshold value is not inverted, it is classified into three categories; if it is, it is classified into Section 4. The absolute evaluation method divides the evaluation of each image into four fixed ranges. It is divided into four sections based on the value, and the inversion of the two threshold values is also considered. The relative evaluation method selects sections based on the recent evaluation scores generated during training. The Gaussian distribution is calculated using the 160 most recent results to find the sections. and represent the mean and standard deviation of 160. It is divided into four ranges, similar to the absolute evaluation method, with the top 3%, top 15%, and top 50% used as reference points.
Table 2 shows the final reward value configuration. It consists of four cases, and the reward values from Section 1, Section 2 and Section 3 are the same. Section 4 consists of four cases, each corresponding to a distinct reward value. In the case of the reward value, since the four cases in Table 2 are used in each of the two methods in Table 1, a total of eight combinations are possible. The optimal reward value configuration is obtained through experiments.
Table 2.
Reward value setting reflecting Baddeley’s measure and threshold reversal.
4. Experimental Results
The training was conducted on a system equipped with an Intel Core i9-10900 processor and two NVIDIA GeForce RTX 3090 GPUs. During the training process, pseudo ground-truth data for each image were pre-generated and utilized. In this process, the input image size was 256(H) × 256(W) × 3(C), and the average processing time per image was approximately 10 ms. Table 3 presents the hyperparameters and their corresponding values used in the training.
Table 3.
Hyperparameters and their values used in the training.
4.1. Weak Label Creation Result
Figure 3 shows the generation process of weak labels used in the proposed training. It was generated by applying 0.5 as the threshold of z () applied to the normalized gradient array. For the image sized 256(H) × 256(W) × 3(C) used as input, it takes about 10 ms on average. The edge image generated by the proposed process, as shown in Figure 3, is presented in Figure 4.
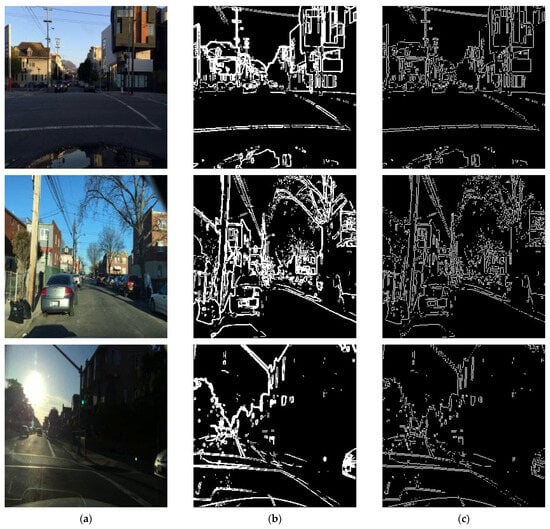
Figure 4.
Examples of weak labels based on images (a) original image (b) edge image (c) edge image with a one-pixel thickness.
4.2. Result of the Proposed Method
Because the proposed method utilizes weakly generated edge maps for reward computation, a direct comparison with supervised reward models [,] may introduce bias. Thus, we employ a model-agnostic evaluation metric to ensure fair and consistent performance comparison. Therefore, a universally comparable evaluation factor is needed. In general, the change in the brightness value of the image at the boundary of an object appears to be larger than in other areas. Therefore, if the model generates an edge image effectively, the average gradient magnitude of the selected edge points is significant. In this paper, the evaluation index was chosen to reflect this. It is determined by reflecting the degree of change in the brightness value of each pixel of the edge image generated by the model. The model performance is assessed using a gradient-weighted average edge strength (), which captures both the edge intensity and the proportion of detected edge pixels in the image.
represents the gradient magnitude of point (i, j) on the image. represents the edge degree of point (i, j) on the image and it represents whether the pixel is edge or not.
Figure 5 shows the training results for case 2 of fixed-value learning, which yielded the best results among the proposed models, and compares them with the existing A2C model []. Quantitatively, the weakly supervised method achieves = 0.979 (Case 2, Absolute Evaluation), which outperforms the best supervised baseline ( = 0.921). Additionally, the ratio of successful threshold configurations (i.e., no reversal) improved from 96.7% to 98.8%. Additionally, we can observe that more diverse output values are present in the results for each image. Detailed comparisons are summarized in Table 4.
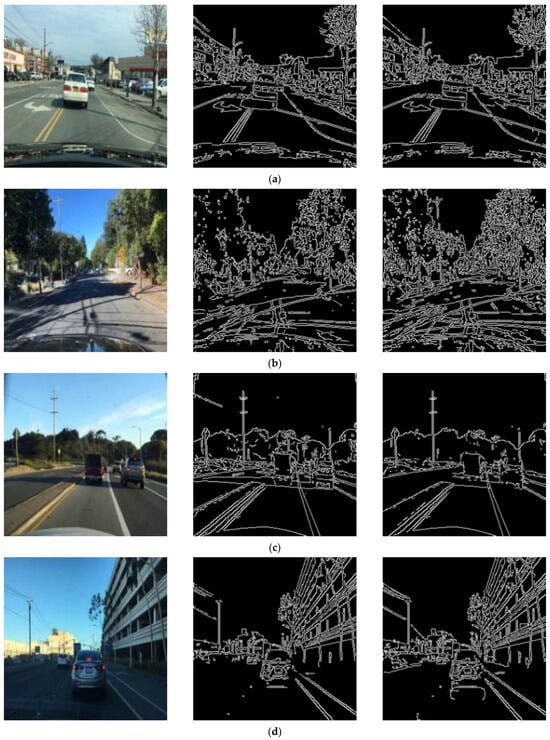
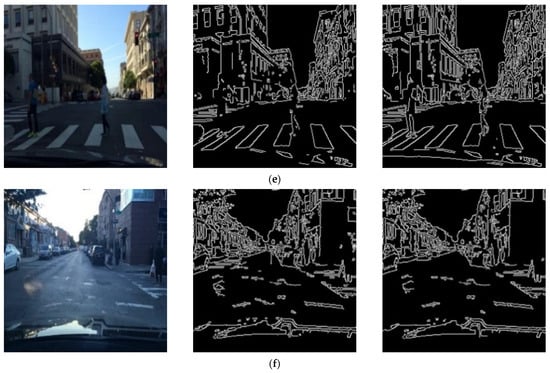
Figure 5.
Training model and comparison model test image results. From left to right column, original image, result by the proposed algorithm and result by continuous A2C []. (a) Proposed: (H, L, FS, V) = (265, 100, 4, 1.0), []: (H, L, FS, V) = (315, 72, 4, 1.0) (b) Proposed: (H, L, FS, V) = (187, 136, 4, 1.0), []: (H, L, FS, V) = (114, 68, 4, 1.0) (c) Proposed: (H, L, FS, V) = (128, 77, 3, 1.0), []: (H, L, FS, V) = (187, 136, 4, 1.0) (d) Proposed: (H, L, FS, V) = (151, 95, 4, 1.0), []: (H, L, FS, V) = (164, 18, 3, 1.0) (e) Proposed: (H, L, FS, V) = (132, 90, 4, 1.0), []: (H, L, FS, V) = (96, 50, 3, 1.0) (f) Proposed: (H, L, FS, V) = (187, 75, 4, 1.0), []: (H, L, FS, V) = (259,77, 4, 1.0) (H: High Threshold, L:Low Threshold, FS: Filter Size, V: Value).
Table 4.
Comparison results of the proposed algorithm with our previous algorithm [].
Figure 6 shows the distribution of high and low threshold values determined by each method for 1000 randomly selected images. As shown in Figure 6, the model’s results, trained according to the method proposed in this study, exhibit diverse distributions similar to those of the model trained using the A2C method []. This result suggests that the weakly supervised model successfully learns image-dependent threshold values with a distribution comparable to the supervised A2C model, demonstrating the effectiveness of weak labels in guiding parameter selection.
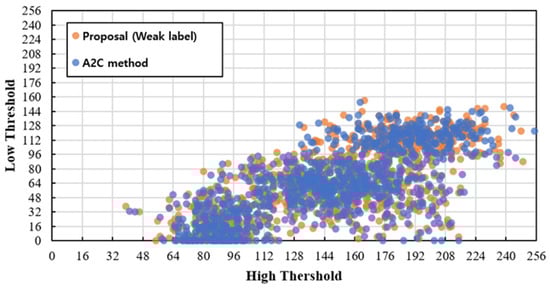
Figure 6.
Comparison of the distribution of two thresholds by the proposed algorithm (yellow) and our previous algorithm [] (blue).
4.3. Result on Unseen Images
The generalization ability was tested by applying it to a different dataset from the one used for training. To evaluate the generalization ability of the trained model and the potential of the model learning method to respond to additional data, it was applied to YTVOS [] images obtained in a different environment from the BDD-100K [] images used for training. Further training was performed using a new dataset of 1070 images, without modifying the environment configuration or the reward generation method, based on the results of learning each model with the existing dataset. As shown in Table 5 and Figure 7, on the YTVOS dataset, the proposed method achieved an of 0.878 after fine-tuning, compared to 0.822 for the supervised baseline. Furthermore, the no-threshold-reversal ratio reached 99.5%, a notable 4.8% improvement over the best prior model. This demonstrates superior generalization and adaptability to unseen domains without requiring manual annotations.
Table 5.
Results in unseen images of the YTVOS dataset [].
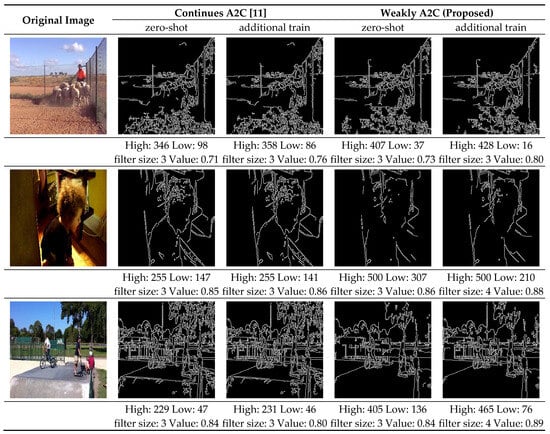
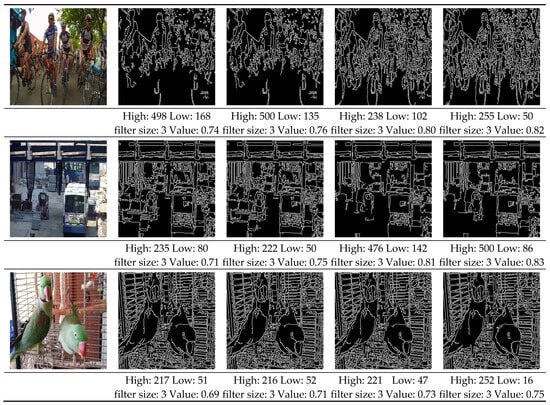
Figure 7.
Comparison results of the proposed algorithm with our previous algorithm [] on the unseen environment. (high, low: threshold, value: magnitude average).
Overall, the proposed weakly supervised reinforcement learning method not only matches but, in several configurations, surpasses the supervised baseline in edge quality, parameter robustness, and cross-domain adaptability. The experimental results confirm that weak labels, when systematically generated and evaluated, can serve as an effective alternative to manual annotations.
5. Conclusions
The Canny edge algorithm requires selecting suitable values for three thresholds to produce a good edge image. This problem can be solved in various ways. This paper proposes an algorithm that utilizes automatically generated edge images as pseudo labels for computing rewards through deep reinforcement learning. Though automatically generated edge images are not optimal, we can obtain competitive results compared to the method that requires manually selected good edge images in training. In this study, we addressed the limitation of previous reinforcement learning-based Canny edge detection methods that require supervised training with manually annotated edge images. To overcome this, we introduced a weakly supervised learning approach that uses automatically generated edge maps as pseudo labels for reward computation. By doing so, we eliminated the need for a dedicated edge evaluation network, which significantly reduced the annotation cost and enhanced the model’s adaptability to new environments. The proposed method is based on an Actor-Critic reinforcement learning framework, where the agent learns to generate optimal threshold parameters by maximizing a reward derived from the similarity between the generated edge and a weak label. Using Baddeley’s metric, we designed both absolute and relative reward functions to ensure robustness, allowing the agent to learn from noisy but informative signals.
We demonstrated that the proposed algorithm outperforms prior supervised approaches in terms of accuracy and generalization ability through comprehensive experiments on diverse datasets, including those from unseen domains. Notably, the model maintains high edge detection quality without requiring any retraining of an evaluation network when deployed in new environments. Additional experiments showed that our approach supports continual learning by leveraging weak labels from new domains. In conclusion, our method offers a scalable and label-efficient solution to adaptive edge detection. It is especially valuable for real-world applications where access to clean, annotated data is limited or unavailable. Future work includes exploring more sophisticated weak label generation techniques and extending the approach to other vision tasks requiring adaptive parameter tuning.
Author Contributions
Conceptualization, K.-H.C. and J.-E.H.; implementation, K.-H.C.; analysis, K.-H.C. and J.-E.H.; writing, original draft preparation, K.-H.C.; draft modification, K.-H.C. and J.-E.H.; funding acquisition, J.-E.H. All authors have read and agreed to the published version of the manuscript.
Funding
This study was supported by the Research Program funded by the SeoulTech (Seoul National University of Science and Technology).
Institutional Review Board Statement
Not applicable.
Informed Consent Statement
Not applicable.
Data Availability Statement
Data available in a publicly accessible repository.
Conflicts of Interest
The authors declare no conflicts of interest.
References
- Arbelaez, P.; Pont-Tuset, J.; Barron, J.; Marques, F.; Malik, J. Multi-scale combinatorial grouping. In Proceedings of the IEEE Conference on Computer Vision and Pattern Recognition, Columbus, OH, USA, 24–27 June 2014; pp. 328–335. [Google Scholar]
- Chen, L.C.; Barron, J.T.; Papandreou, G.; Murphy, K.; Yuille, A.L. Semantic image segmentation with task-specific edge detection using CNNs and a discriminatively trained domain transform. In Proceedings of the IEEE Conference on Computer Vision and Pattern Recognition, Las Vegas, NV, USA, 27–30 June 2016; pp. 4545–4554. [Google Scholar]
- Modava, M.; Akbarizadeh, G. Coastline extraction from SAR images using spatial fuzzy clustering and the active contour method. Int. J. Remote Sens. 2017, 38, 355–370. [Google Scholar] [CrossRef]
- Hermosilla, T.; Palomar-Vazquez, J.; Balaguer-Beser, A.; Balsa-Barreiro, J. Using street based metrics to characterize urban topologies. Comput. Environ. Urban Syst. 2014, 44, 68–79. [Google Scholar] [CrossRef]
- Canny, J.F. A computational approach to edge detection. IEEE Trans. Pattern Anal. Mach. Intell. 1986, 8, 34–43. [Google Scholar] [CrossRef]
- Konishi, S.; Yuille, A.L.; Coughlan, J.M.; Zhu, S.C. Statistical edge detection: Learning and evaluating edge cues. IEEE Trans. Pattern Anal. Mach. Intell. 2003, 25, 57–74. [Google Scholar] [CrossRef]
- Shen, W.; Wang, X.; Wang, Y.; Bai, X.; Zhang, Z. Deepcontour: A deep convolutional feature learned by positive sharing loss for contour detection. In Proceedings of the IEEE Conference on Computer Vision and Pattern Recognition, Boston, MA, USA, 7–12 June 2015; pp. 3982–3991. [Google Scholar]
- Bertasius, G.; Shi, J.; Torresani, L. Deepedge: A multi-scale bifurcated deep network for top-down contour detection. In Proceedings of the IEEE Conference on Computer Vision and Pattern Recognition, Boston, MA, USA, 7–12 June 2015; pp. 4380–4389. [Google Scholar]
- Xie, S.; Tu, Z. Holistically-nested edge detection. In Proceedings of the IEEE International Conference on Computer Vision (ICCV), Santiago, Chile, 7–13 December 2015; pp. 1395–1403. [Google Scholar]
- Choi, K.H.; Ha, J.E. An adaptive threshold for the Canny algorithm with deep reinforcement learning. IEEE Access 2021, 9, 156846. [Google Scholar] [CrossRef]
- Choi, K.H.; Ha, J.E. An adaptive threshold for the Canny edge with actor-critic algorithm. IEEE Access 2023, 11, 67058–67069. [Google Scholar] [CrossRef]
- Mnih, V.; Kavukcuoglu, K.; Silver, D.; Rusu, A.A.; Veness, J.; Bellemare, M.G.; Graves, A.; Riedmiller, M.; Fidjeland, A.K.; Ostrovski, G.; et al. Human-level control through deep reinforcement learning. Nature 2015, 518, 529–533. [Google Scholar] [CrossRef]
- Mnih, V.; Kavukcuoglu, K.; Silver, D.; Graves, A.; Antonoglou, I.; Wierstra, D.; Riedmiller, M. Playing atari with deep reinforcement learning. arXiv 2013, arXiv:1312.5602. [Google Scholar] [CrossRef]
- Williams, R.J. Simple statistical gradient-following algorithms for connectionist reinforcement learning. Mach. Learn. 1992, 8, 229–256. [Google Scholar] [CrossRef]
- Degris, T.; Pilarski, P.M.; Sutton, R.S. Model-free reinforcement learning with continuous action in practice. In Proceedings of the American Control Conference (ACC), Montreal, QC, Canada, 27–29 June 2012; pp. 2177–2182. [Google Scholar]
- Mnih, V.; Badia, A.P.; Mirza, M.; Graves, A.; Harley, T.; Lillicrap, T.P.; Silver, D.; Kavukcuoglu, K. Asynchronous method for deep reinforcement learning. In Proceedings of the International Conference on Machine Learning (ICML), New York City, NY, USA, 19–24 June 2016. [Google Scholar]
- Martin, D.R.; Fowlkes, C.C.; Malik, J. Learning to detect natural image boundaries using local brightness, color and texture cues. IEEE Trans. Pattern Anal. Mach. Intell. 2004, 26, 530–549. [Google Scholar] [CrossRef]
- Arbelaez, P.; Maire, M.; Fowlkes, C.; Malik, J. Contour detection and hierarchical image segmentation. IEEE Trans. Pattern Anal. Mach. Intell. 2011, 33, 898–916. [Google Scholar] [CrossRef]
- Dollar, P.; Tu, Z.; Belongie, S. Supervised learning of edges and object boundaries. In Proceedings of the IEEE Conference on Computer Vision and Pattern Recognition, New York City, NY, USA, 17–22 June 2006; pp. 1964–1971. [Google Scholar]
- Ren, X. Multi-scale improves boundary detection in natural images. In Proceedings of the European Conference on Computer Vision, Marseille, France, 12–18 October 2008; pp. 533–545. [Google Scholar]
- Lim, J.J.; Zitnick, C.L.; Doll´ar, P. Sketch tokens: A learned mid-level representation for contour and object detection. In Proceedings of the IEEE Conference on Computer Vision and Pattern Recognition, Portland, OR, USA, 23–28 June 2013; pp. 3158–3165. [Google Scholar]
- Doll´ar, P.; Zitnick, C.L. Fast edge detection using structured forests. IEEE Trans. Pattern Anal. Mach. Intell. 2015, 37, 1558–1570. [Google Scholar] [CrossRef] [PubMed]
- Xu, D.; Ouyang, W.; Alameda-Pineda, X.; Ricci, E.; Wang, X.; Sebe, N. Learning deep structured multi-scale features using attention-gated crfs for contour prediction. In Proceedings of the Conference on Neural Information Processing Systems, Long Beach, CA, USA, 4–9 December 2017; pp. 3964–3973. [Google Scholar]
- He, J.; Zhang, S.; Yang, M.; Shan, Y.; Huang, T. Bi-directional cascade network for perceptual edge detection. In Proceedings of the IEEE Conference on Computer Vision and Pattern Recognition, Long Beach, CA, USA, 15–20 June 2019; pp. 3828–3837. [Google Scholar]
- Lu, J.W.; Ren, J.C.; Lu, Y. A modified Canny algorithm for detecting sky-sea line in infrared images. Isda J. 2006, 2, 16–18. [Google Scholar]
- Fang, M.; Yue, G.X.; Yu, Q.C. The study on an application of Otsu method in Canny operator. In Proceedings of the ISIP ‘09, Geneva, Switzerland, 10–12 June 2009; pp. 109–112. [Google Scholar]
- Ostu, N. Threshold selection method from gray-level histograms. IEEE Trans. Syst. Man Cybern. 1979, 9, 62–66. [Google Scholar]
- Huo, Y.K.; Wei, G.; Zhang, Y.D.; Wu, L.N. An adaptive threshold for the Canny operator of edge detection. In Proceedings of the International Conference on Image Analysis and Signal Processing, Trois-Rivières, QC, Canada, 30 June–2 July 2010; pp. 371–374. [Google Scholar]
- Lu, X.; Yao, J.; Li, K.; Li, L. Cannylines: A parameter-free line segment detector. In Proceedings of the IEEE International Conference on Image Processing, Québec City, QC, Canada, 27–30 September 2015; pp. 507–511. [Google Scholar]
- Yitzhaky, Y.; Peli, E. A method for objective edge detection evaluation and detector parameter selection. IEEE Trans. Pattern Anal. Mach. Intell. 2003, 25, 1027–1033. [Google Scholar] [CrossRef]
- Medina-Carnicer, R.; Carmona-Poyato, A.; Munoz-Salinas, R.; Madrid-Cuevas, F.J. Determining hysteresis thresholds for edge detection by combining the advantages and disadvantages of threshold methods. IEEE Trans. Image Process. 2010, 19, 165–173. [Google Scholar] [CrossRef]
- Medina-Carnicer, R.; Munoz-Salinas, R.; Yeguas-Bolivar, E.; Diaz-Mas, L. A novel method to look for the hysteresis thresholds for the Canny edge detector. Pattern Recognit. 2011, 44, 1201–1211. [Google Scholar] [CrossRef]
- Sutton, R.S.; Barto, A.G. Introduction to Reinforcement Learning, 2nd ed.; MIT Press: Cambridge, MA, USA, 2018. [Google Scholar]
- LeCun, Y.; Bengio, Y.; Hinton, G. Deep learning. Nature 2015, 521, 436–444. [Google Scholar] [CrossRef]
- Silver, D.; Huang, A.; Maddison, C.J.; Guez, A.; Sifre, L.; Van Den Driessche, G.; Schrittwieser, J.; Antonoglou, I.; Panneershelvam, V.; Lanctot, M.; et al. Mastering the game of go with deep neural networks and tree search. Nature 2016, 529, 484–489. [Google Scholar] [CrossRef]
- Silver, D.; Schrittwieser, J.; Simonyan, K.; Antonoglou, I.; Huang, A.; Guez, A.; Hubert, T.; Baker, L.; Lai, M.; Bolton, A.; et al. Mastering the game of go without human knowledge. Nature 2017, 550, 354–359. [Google Scholar] [CrossRef]
- Silver, D.; Hubert, T.; Schrittwieser, J.; Antonoglou, J.I.; Lai, M.; Guez, A.; Lanctot, M.; Sifre, L.; Kumaran, D.; Graepel, T.; et al. A general reinforcement learning algorithm that masters chess, shogi, and go through self-play. Science 2018, 362, 1140–1144. [Google Scholar] [CrossRef]
- Caicedo, J.C.; Lazebnik, S. Active object localization with deep reinforcement learning. In Proceedings of the International Conference on Computer Vision, Santiago, Chile, 7–13 December 2015; pp. 2488–2496. [Google Scholar]
- Jie, Z.; Liang, X.; Feng, J.; Jin, X.; Lu, W.; Yan, S. Tree-structured reinforcement learning for sequential object localization. Adv. Neural Inf. Process. Syst. 2016, 29, 127–135. [Google Scholar]
- Yun, S.; Choi, J.; Yoo, Y.; Yun, K.; Young Choi, J. Action-decision networks for visual tracking with deep reinforcement learning. In Proceedings of the IEEE Conference on Computer Vision and Pattern Recognition, Honolulu, HI, USA, 21–26 July 2017; pp. 2711–2720. [Google Scholar]
- Baddeley, A.J. An error metric for binary images. In Robust Computer Vision: Quality of Vision Algorithms; Wichmann Verlag: Karlsruhe, Germany, 1992; pp. 59–78. [Google Scholar]
- Xu, N.; Yang, L.; Fan, Y.; Yang, J.; Yue, D.; Liang, Y.; Price, B.; Cohen, S.; Huang, T. YouTube-VOS: Sequence-to-sequence video object segmentation. In Proceedings of the European Conference on Computer Vision, Munich, Germany, 8–14 September 2018; pp. 585–601. [Google Scholar]
- Yu, F.; Chen, H.; Wang, X.; Xian, W.; Chen, Y.; Liu, F.; Madhavan, V.; Darrel, T. BDD100K: A diverse driving database for heterogeneous multitask learning. arXiv 2018, arXiv:1805.04687. [Google Scholar]
Disclaimer/Publisher’s Note: The statements, opinions and data contained in all publications are solely those of the individual author(s) and contributor(s) and not of MDPI and/or the editor(s). MDPI and/or the editor(s) disclaim responsibility for any injury to people or property resulting from any ideas, methods, instructions or products referred to in the content. |
© 2025 by the authors. Licensee MDPI, Basel, Switzerland. This article is an open access article distributed under the terms and conditions of the Creative Commons Attribution (CC BY) license (https://creativecommons.org/licenses/by/4.0/).