Abstract
The importance of and demand for lithium are high and are expected to further increase. Therefore, efficient lithium exploitation processes are essential, for example, Li extraction from brines. Powerful analytical methods are needed, especially with an inline capability. Nuclear Magnetic Resonance is a widely used analytical tool with extensive possibilities. Low-field NMR is particularly suitable for inline quality control thanks to its customizable applications. This study investigates the possibilities of measuring the lithium content in aqueous solutions and brines using 1H and 7Li NMR based on transverse relaxation measurements, using two different low-field NMR instruments. Both static and measurements under flow are presented. The influence of other parameters, such as sample temperature and sodium content of the brine, has also been investigated. The results demonstrate the proof of concept of quantifying lithium content by low-field NMR and provide detailed insights, whilst showing the prerequisites for future industrial applications for inline quality control in lithium extraction processes.
1. Introduction
Lithium is significantly important due to its use in lithium-ion batteries, which is linked to its large and growing demand. The limited availability of lithium raw material and the dependence on only a few suppliers have led to economic challenges; thus, alternative routes are of interest regarding the extraction and purification processes of Li+ from brine, which are linked to a large consumption of water and soil. The optimization of existing processes and innovative new developments should also be sought against the background of CO2 emissions []. The development of a customized analytical method for measuring the lithium content in raw, intermediate, and finished products has the potential to make a significant contribution to conserving resources and protecting the environment during lithium production. Compared to offline methods, inline monitoring methods offer the advantage of the measured results and values being available almost in real time, and, therefore, the process control time constants can be drastically reduced, allowing feedback to be faster and more direct [].
Although Nuclear Magnetic Resonance (NMR) is a well-known analytical method in chemical structure elucidation [], various applications in industrial quality control are also known [,,,]. Low-field NMR is particularly suitable for quality control applications due to its smaller and relaxed space requirements, ease of operation, and lower operating costs. The use of permanent magnets eliminates the need for cryogenic cooling. Even without spectral resolution due to the low homogeneity of the instrument’s static magnetic field, measurements of NMR relaxation provide high quantitative information content. The number of nuclear spins in the sensitive area of the instrument is directly correlated with the measured signal amplitude.
Other than the most commonly used 1H-NMR, which is sensitive to the hydrogen nucleus, 7Li-NMR has also been used [,,,]. The signal to noise ratio of the 7Li NMR is smaller as a result of the gyromagnetic ratio γ, being a factor of 2.573 smaller than that of 1H, the spin quantum number of 3/2, and the only slightly lower natural abundance [,,]. Depending on the specific application and the lithium concentration in the product stream to be analyzed, this circumstance is not a “no go” but requires optimization and technically different approaches, making 7Li low-field NMR a promising and industrially viable solution to determine the lithium concentration in lithium extraction and purification processes. The possibility of performing inline measurements with low-field NMR opens up a significant potential for process optimization and cost reduction. Inline NMR measurements are thereby well known in the literature [,,,,,,,].
This study provides a proof-of-concept demonstration of low-field NMR relaxation measurements in a lithium extraction and purification process using both a modified commercial low-field NMR instrument (Bruker the minispec mq20) and an NMR sensor that was developed in collaboration with the Bruker micro imaging group (V sensor). In addition to 7Li measurements in aqueous lithium-containing solutions, the influence of lithium ions on 1H relaxation was also investigated for the reasons outlined above. Static measurements were performed as proof-of-concept, whereas inline, flow-through measurements were performed to establish a foundation for potential industrial application. Furthermore, the influence and benefits of a pre-polarizer in inline measurements were investigated. In addition to prepared samples with a defined LiCl concentration, samples from a real lithium extraction process were also investigated, revealing the impact of (super-)paramagnetic species via paramagnetic relaxation enhancement.
2. Materials and Methods
The Bruker the minispec mq20 (Bruker BioSpin GmbH & Co. KG, Ettlingen, Germany) is a commercially available low-field NMR instrument for relaxation and diffusion measurements. It operates at a 1H Larmor frequency of 20.02 MHz using permanent magnets. For control and pulse generation, an electronic unit of the minispec ND-series was used. The instrument was equipped with a home-built probe for measurements at moderate temperatures. As the capacitors in the tank circuit are tunable over a wide range, the range of the radio frequency (rf) is sufficiently large to allow the same probe to be used at the 7Li Larmor frequency of 7.77 MHz in the same magnetic field of the mq20. Only the appropriate preamplifier for the respective frequency had to be installed. The maximum sample diameter is 12 mm for both nuclei.
The V sensor is a low-field NMR sensor with a V-shaped magnet arrangement (Figure 1) with a magnetic field gradient, resulting in a pronounced sensitivity of transverse relaxation measurements to diffusion []. Different V sensor probes are available for a wide range of possible applications. Two closed probes with solenoidal coils and maximum sample diameters of 12 and 42 mm are well suited for static measurements or—with minor modifications—for flow-through operations. An inline-capable probe with a slit enables completely non-invasive measurements on a pipe without opening the fluidic path which required a special coil geometry in the form of a bent figure-8 surface coil []. The 1H Larmor frequency for the 12 mm and the inline-capable probe is around 22.2 MHz corresponding to a 7Li frequency of 8.64 MHz. To reach this frequency with the rf circuit, the trim capacitors of the 12 mm probe were replaced by models with larger capacitance ranges while maintaining the same coil geometry. The above-mentioned minispec ND electronic unit was used for pulse generation with a suitable preamplifier for 7Li signal detection.
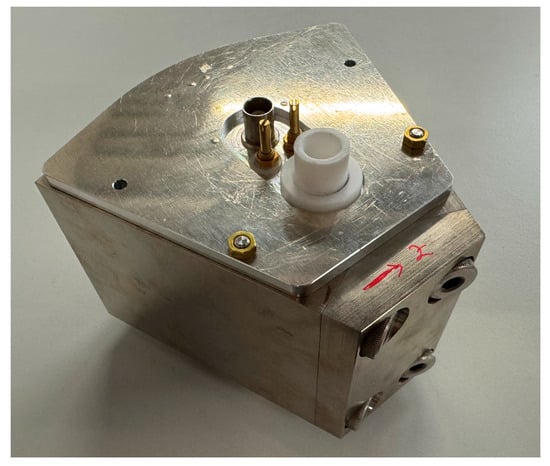
Figure 1.
Picture of the V sensor with the 12 mm probe used for the 7Li measurements. For details, we refer to [].
The multi-echo pulse sequence CPMG was selected for the transverse NMR relaxation measurements on 1H and 7Li nuclei to acquire complete magnetization decays after a single excitation pulse [,]. Fast measurements were possible, which are crucial in quality control applications. The measured magnetization decays were modeled using a mono-exponential fit to extract the signal amplitude and the effective transverse relaxation rate R2,eff. Representative studies confirmed that the mono-exponential model adequately describes the measured 1H and 7Li data of the investigated liquid samples.
For the static measurements, the samples were filled into NMR tubes with a diameter of 10 mm and filling level (>20 mm) sufficient to cover the sensitive area of the probe in the instrument. A fluidic circuit was built through the sensor for the flow measurements with the V sensor. This circuit comprised a reservoir, a peristaltic pump (Ismatec IPC-N-8 V3.01, Ismatec SA, Glattbrugg-Zürich, Switzerland), and a connecting hose/tube system (Figure 2). The eight parallel channels of the pump were combined with hoses of different lengths to dampen pulsation and to increase the volumetric flow rate. The maximum volume flow was achieved by connecting the channels downstream of the pump. A PMMA (poly(methyl methacrylate)) tube with an inner diameter of 8 mm and a wall thickness of 1 mm was positioned in the rf-probe of the V sensor and connected to the experimental setup. Long experiments with a relatively small sample volume of 125 mL are possible by recirculating the liquid back to the reservoir. Measurements on samples with slow longitudinal relaxation can be negatively affected by the well-known inflow effect, as the residence time in the static magnetic field B0 before reaching the sensitive area of the sensor may be insufficient for adequate longitudinal magnetization build-up. The longitudinal relaxation time T1 of 7Li in the investigated samples is approximately 8 s, indicating that a significant inflow effect is expected in the relevant flow velocity range. To counteract this, a pre-polarizer with a length of 270 mm was installed, which was described in []. It consists of several Halbach arrays through which the sample flows before reaching the sensor. Magnetization will be built up at least partially, enabling flow measurements on the samples presented here. The effect and necessity of the pre-polarizer are discussed in detail in Section 3.3.
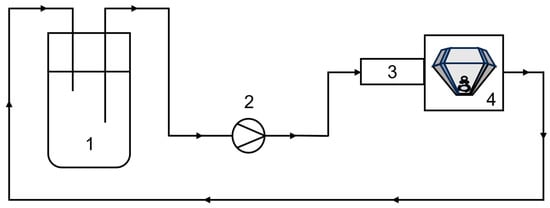
Figure 2.
Scheme of the experimental setup for flow measurements. The sample is provided in the reservoir (1) and is pumped with a peristaltic pump (2) through the pre-polarizer (3) and the V sensor (4) back to reservoir.
To demonstrate the feasibility of the measurements and the achievable detection limits with the available hardware, measurements were made on aqueous lithium chloride (LiCl) solutions with varying LiCl concentrations (Table 1). These solutions were prepared by mixing crystalline LiCl with deionized water using a magnetic stirrer. The concentrations were adjusted by weighing, neglecting the water bound in the powder due to the pronounced hygroscopicity of LiCl. The reported mass concentrations therefore refer only to the Li+ content in the solutions. To investigate the influence of bound water, a sample containing 55 g/L Li+ was measured using inductively coupled plasma—optical emission spectrometry (ICP-OES). The Li+ concentration determined in this way was 46 g/L.

Table 1.
List of transverse relaxation measurements performed on the 1H and 7Li nuclei with the two low-field NMR instruments.
In addition, the influence and impact of other ions on 1H relaxation were examined by measurements with the mq20 on samples from different steps of an industrial lithium extraction process. These measurements were made at sample temperatures of 35 °C (Bruker the minispec magnet temperature) and 70 °C (preferred industrial process temperature) to investigate the temperature dependence of transverse relaxation and to demonstrate the applicability of the analysis under process conditions. The process samples were analyzed using ICP-OES for 23 elements to determine the ion content and assess the influence of paramagnetic components (Table 2).

Table 2.
Process samples and included chemical elements in mg/L, measured with ICP-OES.
7Li-NMR flow measurements with the V sensor were made at various mean flow velocities vmean between 0 cm/s and 1.72 cm/s. Furthermore, the effect of the pre-polarizer and its installation orientation were investigated (Section 3.3).
The employed NMR parameters depend on the purpose of the experiments due to the specific properties of the instruments and samples. For clarity, the parameters are specified and listed in Section 3 “Results” for each respective experiment.
3. Results
3.1. Transverse 1H Relaxation Measurements
Transverse Relaxation of Aqueous LiCl Solutions
1H NMR measurements were performed with the minispec mq20 to investigate the influence of Li+ on the transverse relaxation of 1H magnetization in water. For this purpose, aqueous LiCl solutions with eight concentrations ranging from 0 g/L to 55 g/L Li+ were prepared. The sample with 0 g/L Li+ was pure deionized water. The most important NMR parameters are listed in Table 3.

Table 3.
List of NMR parameters of the 1H relaxation measurements on aqueous LiCl solutions with the minispec mq20.
The measured 1H magnetization decays show a pronounced sensitivity to the LiCl concentration (Figure 3). This is even more evident when the decays are described using a mono-exponential model with the fit parameters signal amplitude A and the effective transverse relaxation rate R2,eff as a function of lithium concentration (Figure 4).
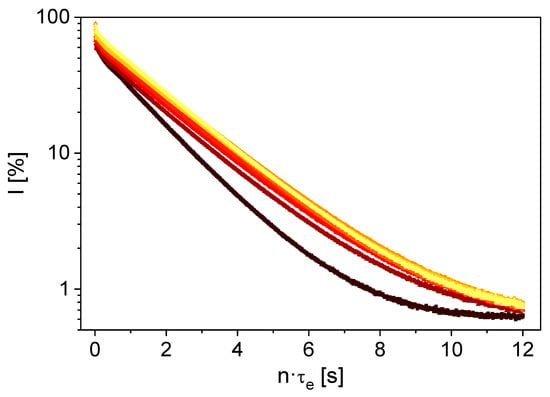
Figure 3.
1H magnetization decays of aqueous LiCl solutions with Li+ concentrations of ▲ 0 g/L, ■ 1 g/L, ⬤ 2 g/L, ▲ 4 g/L, ■ 8 g/L, ⬤ 16 g/L, ▲ 30 g/L, ■ 55 g/L. The influence of the LiCl on 1H relaxation behavior is evident.
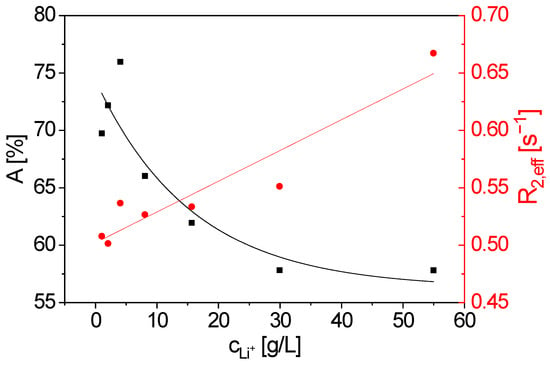
Figure 4.
Signal amplitude A (■) and effective transverse relaxation rate R2,eff (⬤) as a function of lithium concentration cLi+. A decreases almost exponentially with increasing cLi+, whereas R2,eff increases. The lines are visual guides.
R2,eff increases with increasing LiCl concentration. This can be attributed to enhanced fluctuating homo- and heteronuclear interactions between the dissolved ions and the 1H nuclei. Furthermore, A decreases with increasing LiCl concentration due to the reduced effective number of 1H nuclei in the instrument’s sensitive volume as a result of the added LiCl volume. At the maximum concentration, LiCl accounts for approximately 16 % of the total sample volume.
1H relaxation measurements on aqueous LiCl solutions show that the LiCl concentration affects the relaxation behavior and that the sensitive and therefore fast measurements of 1H transverse relaxation can be used, at least, to estimate lithium concentration in these samples. However, due to the diamagnetic nature of Li+ ions, the influence is relatively small. In the context of lithium extraction from thermal waters, the effects of other ions, including paramagnetic species causing paramagnetic relaxation enhancement, must be considered. Thus, a variety of samples from different stages of a lithium extraction process were examined using 1H transverse relaxation measurements. The samples differ both in their lithium concentration and in the type and concentration of other ions. The influence of temperature on the relaxation behavior was also investigated. Measurements were performed at 35 °C, corresponding to the magnet temperature of the mq20, and at 70 °C using a Bruker BVT unit (Bruker BioSpin GmbH & Co. KG, Ettlingen, Germany) to temper the samples in the rf probe. The temperature of 70 °C was chosen because the lithium extraction process occurs under similar temperature conditions, providing insights into the applicability of the method for future industrial applications.
The measurement parameters listed in Table 3 were also used for the measurements on samples from the industrial process. The magnetization decays clearly reflect compositional differences in the relaxation behavior of these process samples (Figure 5). In addition, a pronounced influence of the sample temperature is evident.
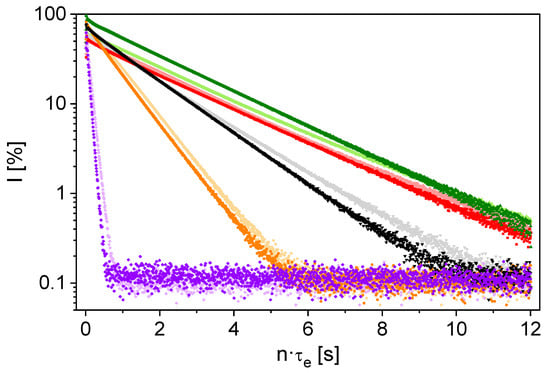
Figure 5.
1H measurements of transverse relaxation with the mq20 on process samples at 35 (dark colors) and 70°C (light colors): 1 (■, ■), 2 (⬤, ⬤), 3 (▲, ▲), 4 (▼, ▼), 5 (⯁, ⯁) with the ion contents listed in Table 2. The faster the decay, the larger the content of paramagnetic ions in the samples.
The two samples with the fastest transverse relaxation (samples 2 and 5 in Figure 5) also show the highest concentration of paramagnetic ions, inducing paramagnetic relaxation enhancement on 1H nuclei. The concentration of paramagnetic components is therefore decisive for the 1H relaxation behavior of a sample. A unique influence of the lithium concentration in the presence of the variety of ions in industrial solutions is thus not observed. The temperature dependent measurements show that R2,eff is larger at 35 °C. This can be explained by the fact that higher temperatures lead to increased intrinsic mobility with a higher influence on the local magnetic field fluctuations and thus a smaller R2,eff. The relaxation differences between 35 °C and 70 °C are systematic but small. The results indicate that with regard to future applications, the hardware is suitable for measurements under process conditions, but for laboratory investigations, the temperature can be maintained at ambient conditions.
These investigations on the 1H nucleus show that no definitive conclusion can be drawn from these fast and reliable NMR measurements regarding the lithium concentration in process samples. The sensitivity towards paramagnetic moieties can nevertheless be used to monitor impurities. In addition, the dependence of 1H relaxation on Li+ concentration was observed in samples lacking paramagnetic components.
3.2. Transverse 7Li Relaxation Measurements
3.2.1. Static Measurements with the Minispec mq20
Tuning of the custom-built broadband probe of the mq20 enables relaxation measurements at the 7Li frequency of 7.77 MHz. Transverse relaxation was measured on a series of aqueous LiCl solutions with Li+ concentrations ranging from 0 g/L to 15.66 g/L. The aim was to quantitatively determine the lower detection limit of 7Li with the given setup of the mq20. The measurement parameters are listed in Table 4.

Table 4.
List of NMR parameters of the 7Li relaxation measurements on aqueous LiCl solutions with the minispec mq20.
Due to limitations of the acquisition software, only the initial part of the decays was measured (Figure 6 left). Nevertheless, the data can be modeled based on the reasonable assumption of a mono-exponential progression to determine A and R2,eff as a function of cLi+ (Figure 6 right).
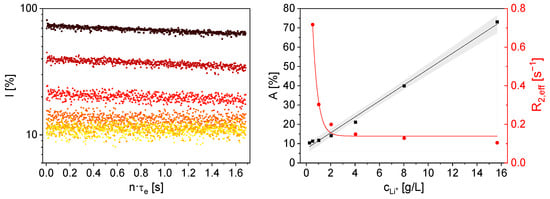
Figure 6.
Left: Initial 7Li magnetization decays of aqueous LiCl solutions as a function of Li+ concentration, measured with the mq20 (★ 0 g/L, ⯁ 1.02 g/L, ▼ 2.04 g/L, ▲ 4.04 g/L, ⬤ 8.03 g/L, ■ 15.66 g/L). Right: A (■) and R2,eff (⬤) from the mono-exponential decay model as a function of cLi+. Lines are visual guides. With increasing cLi+ A increases and R2,eff decreases significantly. The gray area indicates the 95 % confidence interval of a linear fit for A(cLi+).
A increases linearly with cLi+ above the detection limit, which is consistent with physical expectations due to the proportionality between the signal intensity and the number of 7Li nuclei in the sensitive volume. The definition of a lower limit of detection (LOD) depends on the number of averages and, consequently, the experiment duration. For 16 averages and a measurement duration of 5.78 min, the LOD is cLi+ = 4.04 g/L. A signal to noise ratio of 2 was set as the detection limit. An LOD of cLi+ = 2.04 g/L could be calculated for 128 averages respectively 46.25 min measurement time. For 1280 averages and a duration of 7.71 h, the LOD is cLi+ = 0.52 g/L under the given setup, demonstrating the principle and the feasibility of the approach. For potential application in an industrial environment, a compromise between the measurable minimum 7Li concentration and time resolution of the method must be considered. Additionally, the quality factor of the rf circuit could be optimized, and the sample volume could be increased, so that the number of nuclear spins in the sensitive area of the NMR instrument is larger.
R2,eff decreases with increasing cLi+ (Figure 6 right). This behavior cannot be explained by the increase in the viscosity of the solution with the increasing concentration of LiCl. The rotational correlation time, which is a measure of ion mobility in solutions, is proportional to viscosity []. According to BBP theory, an increase in R2,eff would be expected with increasing viscosity. However, the measurements show the opposite trend. It is therefore hypothesized that at high LiCl concentrations, the ion density affects the electric field gradients in the solution, and consequently, the fluctuating quadrupole interactions, differently than represented by the simple relaxation model that only considers solution viscosity.
The concentration-dependent 7Li measurements demonstrate the sensitivity of the signal amplitude to lithium concentration within technically relevant ranges. The method is therefore fundamentally well suited for use as a quantitative analytical technique in a lithium extraction plant.
The thermal waters used in lithium extraction often contain a high proportion of sodium. To assess the suitability of 7Li NMR for relaxation measurements to determine lithium concentration, the influence of sodium content on the 7Li relaxation must be investigated. For this purpose, 7Li measurements were performed on aqueous LiCl solutions with cLi+ = 29.91 g/L and different sodium concentrations between 0 g/L and 60 g/L Na+. The signal intensity and relaxation behavior remained identical for all samples measured. This indicates that heteronuclear dipolar interactions, for example via Na+ ions, have no significant influence on 7Li transverse relaxation at the given Larmor frequency. Thus, the signal intensity in 7Li NMR measurements can be interpreted as directly proportional to lithium concentration, making the method suitable for quantitative analysis in lithium extraction processes.
3.2.2. Static Measurements with the V Sensor
In addition to the measurements on the mq20, measurements were also performed with the V sensor and a probe adapted for 7Li NMR. With its compact design and ease of adaptation to different environmental conditions, this sensor has already proven its suitability in quality control applications [,,,]. Similar to the mq20 investigations, measurements were first carried out with the V sensor on the aqueous LiCl solutions with varying concentrations to assess measurability and determine the detection limit. The following NMR parameters were applied in the measurements (Table 5).

Table 5.
List of NMR parameters of the 7Li relaxation measurements on aqueous LiCl solutions with the V sensor.
In contrast to the measurements with the mq20, the complete magnetization decays down to the noise level were captured due to the larger magnetic field gradient and the associated faster effective transverse relaxation due to diffusion (Figure 7 left). The magnetization decays were smoothed using a Savitzky–Golay filter to better visualize the dependencies.
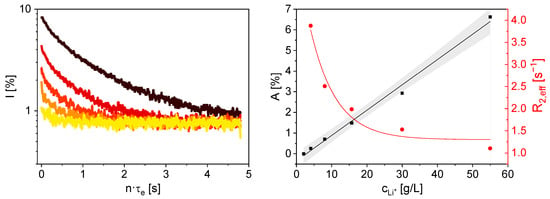
Figure 7.
Left: Smoothed 7Li magnetization decays of aqueous LiCl solutions with varying Li+ concentrations, measured with the V sensor (⯁ 4.04 g/L, ▼ 8.03 g/L, ▲ 15.66 g/L, ⬤ 29.91 g/L, ■ 54.96 g/L). Right: A (■) and R2,eff (⬤) as a function of cLi+. With increasing cLi+ A increases linearly and R2,eff decreases almost exponentially. The gray area indicates the 95 % confidence interval of a linear fit for A(cLi+).
A is proportional to cLi+, as expected. The smallest lithium concentration at which a usable 7Li signal could still be detected with the chosen NMR parameters is cLi+ = 4.04 g/L. Furthermore, R2,eff indicates that relaxation proceeds significantly faster at lower cLi+ (Figure 7 right). This correlation was also observed in the transverse relaxation measurements of the LiCl solutions with the mq20 (Figure 6). The higher value of R2,eff is attributed to the static magnetic field gradient in the sensor. Consequently, the measurements are sensitive to diffusion [,]. The experiments on the LiCl solutions demonstrate that the V sensor can be used effectively to measure Li+ concentration, laying the foundation for potential applications in quality control in lithium extraction processes.
3.3. Inline Measurements on Flowing Lithium-Containing Samples
For further investigation of potential applications, relaxation measurements were also made on an aqueous LiCl solution with cLi+ = 55 g/L using the V sensor in the described flow-through setup without the pre-polarizer. The mean flow velocity vmean was varied between 0 cm/s and 1.72 cm/s. The measurement parameters are identical to those in Table 5, except that the number of averages was set to 80. The magnetization decays were smoothed using a Savitzky–Golay filter (Figure 8 left).
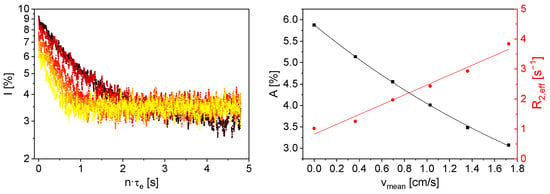
Figure 8.
Left: Smoothed 7Li magnetization decays of an aqueous LiCl solution with cLi+ = 55 g/L for inline measurements on a flowing sample with different vmean (■ 0 cm/s, ⬤ 0.36 cm/s, ▲ 0.7 cm/s, ▼ 1.03 cm/s, ⯁ 1.36 cm/s, ⯇ 1.72 cm/s). Right: A (■) and R2,eff (⬤) as a function of vmean. A decreases with increasing vmean, whereas R2,eff increases. The lines are visual guides.
The inline measurements show a monotonic effect of flow velocity on the magnetization decays. A can be modeled with a mono-exponential approach, clearly reflecting that A decreases with increasing vmean. This can be attributed to the inflow effect [,]. The inflow effect occurs when the residence time of the nuclear spins in the static magnetic field B0 of the sensor, here with a polarization length of 30 mm in the flow direction, is insufficient for the build-up of the longitudinal magnetization at the given longitudinal relaxation time. As a result, only partially magnetized volume elements enter the sensitive volume, leading to a smaller signal intensity compared to vmean = 0 cm/s. This circumstance is particularly relevant for samples with a large T1. Additionally, R2,eff increases with increasing vmean (Figure 8). This effect is referred to as the outflow effect. The nuclear spins excited by the excitation pulse partially flow out of the sensitive volume before the echo is detected. This results in a smaller integral signal intensity and, due to the echo train in a CPMG experiment, in a larger R2,eff, even though the true R2 of 7Li is independent of flow velocity.
The flow measurements show that even in a flowing sample, it is possible to determine the lithium content. However, the influence of flow velocity must be taken into account. This effect can partially be mitigated by using a pre-polarizer in front of the sensor, through which the sample flows. Due to the longer residence time in a static magnetic field, the longitudinal magnetization is larger at the time of excitation, resulting in a smaller decrease in signal intensity at higher vmean. For effective pre-polarization, it is crucial to minimize the distance between the pre-polarizer and the sensor, thus avoiding zero-crossing of the magnetic field and correctly orienting the magnetic fields relative to each other. In addition to reducing the inflow effect, the use of a pre-polarizer in conjunction with sample flow allows the recycle delay to be shortened accordingly, even more pronounced than in the single V sensor measurement in flow-through mode. The nuclear spins entering the sensitive volume have a fully developed longitudinal magnetization, allowing the transverse relaxation to be measured. In simple terms, after detection of an echo train, new nuclear spins with complete longitudinal magnetization are already available for excitation due to the flow and corresponding exchange of volume elements in the pipe. The recycle delay is thus determined not only by NMR relaxation but also by vmean. Using a shorter recycle delay allows more averages to be acquired within the same measurement time, thereby improving the signal to noise ratio for a given time period.
The investigations of the pre-polarizer in the experimental setup were carried out with an aqueous LiCl solution with cLi+ = 55 g/L and three different vmean values of 0 cm/s, 0.86 cm/s and 1.72 cm/s. The NMR parameters are listed in Table 5; the number of averages was set to 80. The pre-polarizer was arranged in a series of experiments so that the magnetic field was oriented parallel to the sensor’s B0. In another series, the magnetic field was arranged antiparallel to B0. It should be noted that the Larmor frequency shifts due to the pre-polarizer to 8.56 MHz with antiparallel orientation and 8.71 MHz with parallel orientation. The magnetization decays were smoothed using a Savitzky–Golay filter and compared to measurements without the pre-polarizer (Figure 9a–c). The signal amplitudes A for each decay were normalized to the corresponding A at vmean = 0 cm/s and plotted as a function of vmean to illustrate the influence of the pre-polarizer on the inflow effect (Figure 9d).
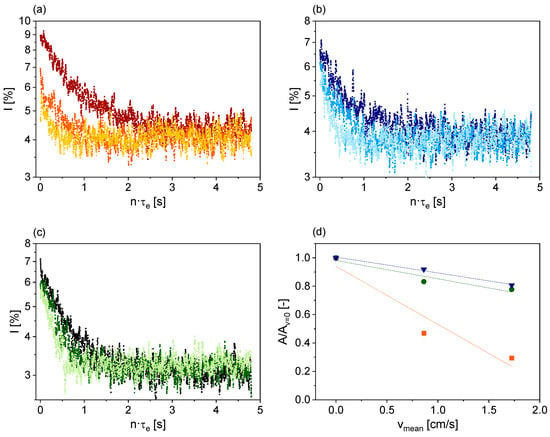
Figure 9.
Smoothed 7Li magnetization decays of measurements at vmean = 0 cm/s (■, ■, ■), vmean = 0.86 cm/s (⬤, ⬤, ⬤) and vmean = 1.72 cm/s (▼, ▼, ▼): Without the pre-polarizer (a), with the pre-polarizer in parallel orientation (b), and the pre-polarizer in antiparallel orientation (c). (d) Normalized signal magnitudes as a function of vmean for the sensor without the pre-polarizer (■), with the pre-polarizer in parallel orientation (▼), and with the pre-polarizer in antiparallel orientation (⬤). The dotted lines are visual guides.
The measured magnetization decays for the series without the pre-polarizer (Figure 9a) show a pronounced decrease in signal intensity with increasing vmean due to the inflow effect. In the series with the pre-polarizer (Figure 9b,c), the signal reduction with increasing vmean is significantly less pronounced. This dependence can be quantified by analyzing the normalized signal amplitudes (Figure 9d). These decrease much more for the setup without the pre-polarizer than for the two series with the pre-polarizer. The parallel or antiparallel orientation of the pre-polarizer’s magnetic field has almost no effect on its performance. However, the signal to noise ratio is slightly better with parallel alignment, making this configuration preferable. The decrease in signal intensity with increasing vmean can be attributed to the limited length of the pre-polarizer and the laminar flow profile. Further improvement could be achieved by lengthening the pre-polarizer, resulting in longer mean residence times of the nuclear spins, or by using stronger magnetic fields for pre-polarization, while minimizing the gap between the magnets.
The investigations show that the use of the pre-polarizer is highly effective and further enables inline measurements with the sensor, especially for samples with long T1. Additionally, the recycle delay can be reduced because polarized spins continuously flow into the sensitive area. This allows faster measurements or an improved signal to noise ratio by increasing the number of averages.
4. Discussion and Conclusions
The potential of low-field NMR for quantifying lithium content in aqueous solutions and brines was investigated for possible quality control applications in a lithium extraction process. Both a modified commercial minispec mq20 and an NMR sensor developed for quality control in research environment were available for this purpose. Various methods were used in both static experiments and under flow conditions to investigate their applicability in laboratory and process environments. Although 1H NMR offers a good signal to noise ratio, the relaxation measurements are not solely selectively sensitive to the influence of Li+ ions, but are particularly influenced by paramagnetic ions and their specific concentrations. The implemented hardware modifications achieved high sensitivity for the 7Li nucleus on both NMR instruments, enabling quantitative measurements of lithium concentration in solutions with technically relevant compositions. This approach can also be implemented for measurements in flow-through mode. The use of a pre-polarizer significantly expands the range of applications and enables measurements with improved time resolution or enhanced signal quality. The investigations carried out as part of this study provide a robust and reliable basis for the application of low-field NMR in inline quality control within a lithium extraction process, helping to improve efficiency and reduce rejects. Of course, calibration needs to be redone in the context of an actual process environment, taking into account process variations and performing a thorough statistical analysis. Future investigations should include inline flow measurements on process samples under realistic process conditions and consider environmental factors such as temperature and pressure variations, vibrations, and electromagnetic interferences in a process plant.
Author Contributions
Conceptualization, E.S. and G.G.; methodology, E.S. and G.G.; validation, E.S., R.L., T.R., and G.G.; formal analysis, E.S., R.L., T.R., and G.G.; investigation, E.S. and R.L.; resources, H.N. and G.G.; data curation, E.S. and R.L.; writing—original draft preparation, E.S. and G.G.; writing—review and editing, E.S., R.L., T.R., H.N., and G.G.; visualization, E.S., R.L., and G.G.; supervision, G.G.; project administration, G.G.; funding acquisition, H.N. and G.G. All authors have read and agreed to the published version of the manuscript.
Funding
This research received no external funding.
Institutional Review Board Statement
Not applicable.
Informed Consent Statement
Not applicable.
Data Availability Statement
The data are available on request to the authors.
Acknowledgments
The authors thank the Bruker BioSpin GmbH, µ-imaging application group, and the Bruker minispec development group for their support during the development and adaptation of the sensor. The Deutsche Forschungsgemeinschaft is thanked for the substantial financial contribution in form of NMR instrumentation and Sachbeihilfe within the instrumental facility Pro2NMR.
Conflicts of Interest
Author Thomas Rudszuck was employed by the company Vulcan Energie Ressourcen GmbH. The remaining authors declare that the research was conducted in the absence of any commercial or financial relationships that could be construed as a potential conflict of interest.
Abbreviations
The following abbreviations are used in this manuscript:
| CPMG | Carr–Purcell–Meiboom–Gill pulse sequence |
| ICP-OES | Inductively coupled plasma—optical emission spectrometry |
| NMR | Nuclear Magnetic Resonance |
| rf | Radio frequency |
References
- Steiger, K.; Hilgers, C.; Kolb, J. Lithiumbedarf Für Die Batteriezellen-Produktion in Deutschland Und Europa Im Jahr 2030; KIT: Karlsruhe, Germany, 2022. [Google Scholar]
- Bowler, A.L.; Bakalis, S.; Watson, N.J. A review of in-line and on-line measurement techniques to monitor industrial mixing processes. Chem. Eng. Res. Des. 2020, 153, 463–495. [Google Scholar] [CrossRef]
- Wüthrich, K. NMR studies of structure and function of biological macromolecules. Biosci. Rep. 2003, 23, 119–153. [Google Scholar] [CrossRef]
- Chinn, S.C.; Cook-Tendulkar, A.; Maxwell, R.; Wheeler, H.; Wilson, M.; Xie, Z.H. Qualification of Automated Low-Field NMR Relaxometry for Quality Control of Polymers in a Production Setting. Polym. Test. 2007, 26, 1015–1024. [Google Scholar] [CrossRef]
- Kern, S.; Wander, L.; Meyer, K.; Guhl, S.; Mukkula, A.R.G.; Holtkamp, M.; Salge, M.; Fleischer, C.; Weber, N.; King, R.; et al. Flexible automation with compact NMR spectroscopy for continuous production of pharmaceuticals. Anal. Bioanal. Chem. 2019, 411, 3037–3046. [Google Scholar] [CrossRef] [PubMed]
- Mitchell, J.; Gladden, L.F.; Chandrasekera, T.C.; Fordham, E.J. Low-field permanent magnets for industrial process and quality control. Prog. Nucl. Magn. Reson. Spectrosc. 2014, 76, 1–60. [Google Scholar] [CrossRef] [PubMed]
- Fan, K.; Zhang, M. Recent developments in the food quality detected by non-invasive nuclear magnetic resonance technology. Crit. Rev. Food Sci. Nutr. 2019, 59, 2202–2213. [Google Scholar] [CrossRef]
- Markert, A.; Rudszuck, T.; Gerasimov, M.; Krewer, U.; Nirschl, H.; Guthausen, G. Lithium Mobility in Graphite Anodes at Different States of Charge as Observed by NMR. J. Phys. Chem. C 2025, 129, 3951–3958. [Google Scholar] [CrossRef]
- Letellier, M.; Chevallier, F.; Béguin, F.; Frackowiak, E.; Rouzaud, J.-N. The first in situ 7Li NMR study of the reversible lithium insertion mechanism in disorganised carbons. J. Phys. Chem. Solids 2004, 65, 245–251. [Google Scholar] [CrossRef]
- Zaghib, K.; Tatsumi, K.; Sawada, Y.; Higuchi, S.; Abe, H.; Ohsaki, T. 7Li - NMR of Well-Graphitized Vapor-Grown Carbon Fibers and Natural Graphite Negative Electrodes of Rechargeable Lithium-Ion Batteries. J. Electrochem. Soc. 1999, 146, 2784–2793. [Google Scholar] [CrossRef]
- Appelt, S.; Kuhn, H.; Häsing, F.W.; Blümich, B. Chemical analysis by ultrahigh-resolution nuclear magnetic resonance in the Earths magnetic field. Nat. Phys. 2006, 2, 105–109. [Google Scholar] [CrossRef]
- Fukushima, E.; Roeder, S.B.W. Experimental Pulse NMR, A Nuts and Bolts Approach; Addison-Wesley Publishing Company Inc.: London, UK, 1981. [Google Scholar]
- Abragam, A. Principles of Nuclear Magnetism; Oxford University Press: Oxford, UK, 1961. [Google Scholar]
- Blümich, B.; Blümich, P.; Pauly. Essential NMR; Springer Nature: Cham, Switzerland, 2005. [Google Scholar]
- Schmid, E.; Rondeau, S.; Rudszuck, T.; Nirschl, H.; Guthausen, G. Inline NMR via a Dedicated V-Shaped Sensor. Sensors 2023, 23, 2388. [Google Scholar] [CrossRef]
- Schmid, E.; Pertzel, T.O.; Nirschl, H.; Guthausen, G. Characterization of Flow with a V-Shaped NMR Sensor. Sensors 2024, 24, 6163. [Google Scholar] [CrossRef]
- Herold, H.; Hardy, E.H.; Ranft, M.; Wassmer, K.H.; Nestle, N. Online Rheo-TD NMR for analysing batch polymerisation processes. Microporous Mesoporous Mater. 2013, 178, 74–78. [Google Scholar] [CrossRef]
- Corver, J.; Guthausen, G.; Kamlowski, A. In-line non-contact check weighing (NCCW) with nuclear magnetic resonance (NMR) presents new opportunities and challenges in process control. Pharm. Eng. 2005, 25, 18–30. [Google Scholar]
- Colnago, L.A.; Andrade, F.D.; Souza, A.A.; Azeredo, R.B.V.; Lima, A.A.; Cerioni, L.M.; Osan, T.M.; Pusiol, D.J. Why is Inline NMR Rarely Used as Industrial Sensor? Challenges and Opportunities. Chem. Eng. Technol. 2014, 37, 191–203. [Google Scholar] [CrossRef]
- Foley, D.A.; Bez, E.; Codina, A.; Colson, K.L.; Fey, M.; Krull, R.; Piroli, D.; Zell, M.T.; Marquez, B.L. NMR flow tube for online NMR reaction monitoring. Anal. Chem. 2014, 86, 12008–12013. [Google Scholar] [CrossRef]
- Keifer, P.A. Flow techniques in NMR spectroscopy. Annu. Rep. NMR Spectrosc. 2007, 62, 1–47. [Google Scholar] [CrossRef]
- Rudszuck, T.; Zick, K.; Groß, D.; Nirschl, H.; Guthausen, G. Dedicated NMR sensor to analyze relaxation and diffusion in liquids and its application to characterize lubricants. Magn. Reson. Chem. 2021, 59, 825–834. [Google Scholar] [CrossRef]
- Carr, H.Y.; Purcell, E.M. Effects of Diffusion on Free Precession in Nuclear Magnetic Resonance Experiments. Phys. Rev. 1954, 94, 630–638. [Google Scholar] [CrossRef]
- Meiboom, S.; Gill, D. Modified spin-echo method for measuring nuclear relaxation times. Rev. Sci. Instrum. 1958, 29, 688–691. [Google Scholar] [CrossRef]
- Herold, H.; Hardy, E.H.; Wassmer, K.H.; Nestle, N. Towards Online-Rheo-TD-NMR in Bypass Lines for Analysing of Batch Polymerization Processes. Chem. Ing. Tech. 2012, 84, 93–99. [Google Scholar] [CrossRef]
- Schmid, E.; Kontschak, L.; Nirschl, H.; Guthausen, G. NMR in Battery Anode Slurries with a V-Shaped Sensor. Sensors 2024, 24, 3353. [Google Scholar] [CrossRef] [PubMed]
- Hürlimann, M.; Griffin, D. Spin dynamics of Carr–Purcell–Meiboom–Gill-like sequences in grossly inhomogeneous B0 and B1 fields and application to NMR well logging. J. Magn. Reson. 2000, 143, 120–135. [Google Scholar] [CrossRef] [PubMed]
- Callaghan, P.T. Principles of Nuclear Magnetic Resonance Microscopy; Oxford University Press: New York, NY, USA, 1991. [Google Scholar]
- Pope, J.M. Quantitative NMR Imaging of Flow. Concept Magn. Res 1993, 5, 281–302. [Google Scholar] [CrossRef]
- Gao, J.-H.; Liu, H.-L. Inflow effects on functional MRI. NeuroImage 2012, 62, 1035–1039. [Google Scholar] [CrossRef]
Disclaimer/Publisher’s Note: The statements, opinions and data contained in all publications are solely those of the individual author(s) and contributor(s) and not of MDPI and/or the editor(s). MDPI and/or the editor(s) disclaim responsibility for any injury to people or property resulting from any ideas, methods, instructions or products referred to in the content. |
© 2025 by the authors. Licensee MDPI, Basel, Switzerland. This article is an open access article distributed under the terms and conditions of the Creative Commons Attribution (CC BY) license (https://creativecommons.org/licenses/by/4.0/).