Article

Impact of Near-Fault Seismic Inputs on Building Performance: A Case Study Informed by the 2023 Maras Earthquakes

1
Engineering Faculty, Department of Civil Engineering, Istanbul Arel University, Campus Tepekent, Türkoba Mahallesi, Erguvan Sokak, No. 26, 34537 Büyükçekmece, Turkey
2
Engineering Faculty, Department of Civil Engineering, Istanbul Arel University, Campus Sefaköy Kemalpaşa Mahallesi, Halkalı Caddesi, No. 101, 34295 Küçükçekmece, Turkey
*
Author to whom correspondence should be addressed.
Appl. Sci. 2025, 15(18), 10142; https://doi.org/10.3390/app151810142
Submission received: 22 August 2025 / Revised: 10 September 2025 / Accepted: 16 September 2025 / Published: 17 September 2025
(This article belongs to the Special Issue Advances in Earthquake Engineering and Seismic Resilience)

Abstract

This study investigates the seismic performance of existing reinforced concrete (RC) buildings, focusing on the influence of near-fault ground motions caused by proximity to fault lines. Compared to ordinary or far-fault earthquakes, near-fault earthquakes may have diverse effects on the response of buildings resulting from directivity and intense velocity pulses, which significantly amplify seismic demands. For this purpose, nonlinear time history analyses were carried out on a seven-story RC residential building that was subjected to near-fault effects and sustained heavy damage during the Kahramanmaraş earthquakes on 6 February 2023. The analyses used both near-fault and far-fault ground motion records, and four structural models were developed by gradually reducing the number of shear wall elements to assess the impact of diminishing lateral-load-resisting capacity. The results revealed that near-fault ground motions led to significant increases in base shear, inter-story drift ratios, and structural damage levels. Furthermore, a reduction in shear wall content resulted in a noticeable decline in seismic performance. These findings underscore the necessity of accounting for near-fault effects in seismic design and the critical role of lateral stiffness. The study emphasizes that considering near-fault characteristics is essential for ensuring the seismic resilience of RC buildings located in active seismic zones.

1. Introduction

Response spectra constitute a fundamental tool in both the seismic design of new buildings and the assessment of existing structures. Initially systematized by Housner and Trifunac [1], the response spectrum method has evolved into a cornerstone of modern earthquake engineering, allowing for the estimation of maximum elastic structural responses without the need for time-consuming time history analyses. Somerville [2] further emphasized the practicality of this method in predicting structural behavior based on the frequency content and energy characteristics of ground motions.
However, standard design spectra frequently fall short in accurately representing ground motions in near-fault conditions. In particular, they fail to capture critical features such as velocity pulses, which are often observed in near-fault recordings and are primarily attributed to rupture directivity effects [3,4,5,6]. When fault rupture propagates toward a site, forward directivity can generate large-amplitude, short-duration velocity pulses that impose highly concentrated demands on structural systems [7,8,9], often exceeding those anticipated by far-field design assumptions.
To better characterize these pulse-like ground motions, researchers have proposed various analytical and signal-processing-based models. Mavroeidis et al. [10] and He et al. [11] developed mathematical models to simulate near-fault pulses, although they acknowledged that such models are sensitive to soil and source assumptions, which limits generalizability. In contrast, Baker [12] introduced a wavelet-based framework incorporating a “pulse index” to classify near-fault records, along with spectral tools to identify the dominant pulse period.
On the signal processing front, Huang et al. [13] proposed the Hilbert-Huang Transform (HHT), enabling decomposition of ground motion signals into intrinsic mode functions for time-frequency analysis. Building on this, Chen et al. [14] demonstrated that HHT-based methods outperform traditional Fourier and wavelet approaches in detecting near-fault pulse features. More recently, Chang et al. [15] utilized Gabor wavelet filtering to isolate low-frequency content and introduced the Energy of Velocity Pulse (EVP) metric, where EVP > 0.35 was found to reliably indicate pulse-like behavior.
The structural implications of such near-fault ground motions have also been widely studied. Numerous investigations [16,17,18,19,20] have shown that pulse-like motions lead to significantly increased interstory drift ratios, base shear forces, and inelastic deformation demands, particularly in mid- and high-rise buildings. Anderson and Bertero [21] highlighted that when the structural period coincides with the pulse period, resonance effects can critically amplify these responses. Similar findings by Yaray [22] and Mazza et al. [23] further confirmed that period alignment increases lateral deformation demands. Moreover, fling-step effects—resulting in permanent ground displacements—have been shown to exacerbate structural demand [24,25].
Additional research [26,27] has shown that such pulse-like ground motions tend to concentrate seismic demand in the lower stories of buildings, especially when compared with far-field events. Sehhati et al. [28] demonstrated that structures subjected to such inputs require higher ductility capacities using 54 near-fault ground motion records. Champion and Liel [29] found that near-fault pulse effects could increase collapse probability by up to 6% in newly constructed reinforced concrete (RC) buildings.
Another critical yet often overlooked aspect is the role of vertical ground motion. Studies [30,31,32] have shown that vertical components can significantly increase axial forces, decrease flexural and shear capacities, and in some cases, directly contribute to structural failure. Kim et al. [33] observed that vertical motions can elevate axial demands in first-story columns by as much as 240%, although their impact on interstory drift remains limited. Traditional Ground Motion Prediction Equations (GMPEs) also exhibit limitations when applied to near-fault conditions. To address this, researchers have developed new GMPEs that incorporate directivity and pulse effects [6,34,35,36], distinguishing between broadband and narrowband spectral demands—the latter associated with dominant pulse periods.
The 2023 Kahramanmaraş earthquake sequence tragically highlighted the significance of near-fault effects. Post-earthquake field studies by Baltzopoulos et al. [37] and others [38,39,40,41,42,43,44] confirmed the prevalence of velocity pulses, fling-step displacements, and strong directional effects. Structural damage surveys [45,46,47,48,49] revealed widespread destruction in buildings located near the rupture zones. Spectral comparisons by Altunsu et al. [50] and Yaghmaei-Sabegh et al. [51] emphasized the necessity of integrating both horizontal and vertical near-fault effects into seismic design frameworks. In conclusion, the growing body of research clearly emphasizes the importance of consideration of near-fault effects and vertical ground motions to accurate determination of seismic performance and hence, more resilient urban RC building designs in seismically active zones.
Based on the information above, this study evaluates the seismic performance of real a reinforced concrete building, designed according to Turkish Earthquake Code of 2007 TEC-2007 [52], using as built structural data that subjected to actual ground motion records which experienced severe damage during the 2023 Kahramanmaraş earthquakes. Actual ground motions were subject to building in all orientations of the motion. In addition, this study investigates how near-fault effects interact with the presence or absence of shear wall systems by comparing the seismic performance of buildings with adequate and reduced shear wall configurations. The results clearly demonstrated the importance of near-fault characteristics for the seismic resilience of a case study building that is designed according to a modern seismic code, such as TEC-2007 [52].

2. Materials and Methods

The devastating earthquakes that struck the Kahramanmaraş region in February 2023 caused widespread structural damage across southeastern Türkiye. Among the severely affected areas was the Ekinci district of Antakya, where numerous buildings suffered from the intense ground motions generated by the proximity to active fault segments. This study focuses on the seismic performance assessment of a reinforced concrete building that became unusable following the earthquakes. Although the structure did not experience a total collapse during the event, significant damage occurred within its load-bearing system. The severity of the observed damage ultimately led to the building’s controlled demolition shortly after the earthquake. The case presents a valuable opportunity to evaluate the influence of near-fault effects on structural performance and to identify critical vulnerabilities in existing building stock under extreme seismic demand.

2.1. Test Materials

The analyzed building is a newly constructed reinforced concrete structure, completed in 2018. It features a slab-beam system with a dual lateral load-resisting system composed of reinforced concrete frames and shear walls, designed to achieve high ductility in accordance with seismic design principles. The building was designed according to the TEC-2007, which classifies seismic zones based on geographic location. The site is located in Seismic Zone 1, with an effective ground acceleration coefficient of 0.4. The local soil classification is Z3 in TEC-2007, corresponding to ground type C3 in the Turkish Building Earthquake Code 2018 (TBEC-2018) [53].
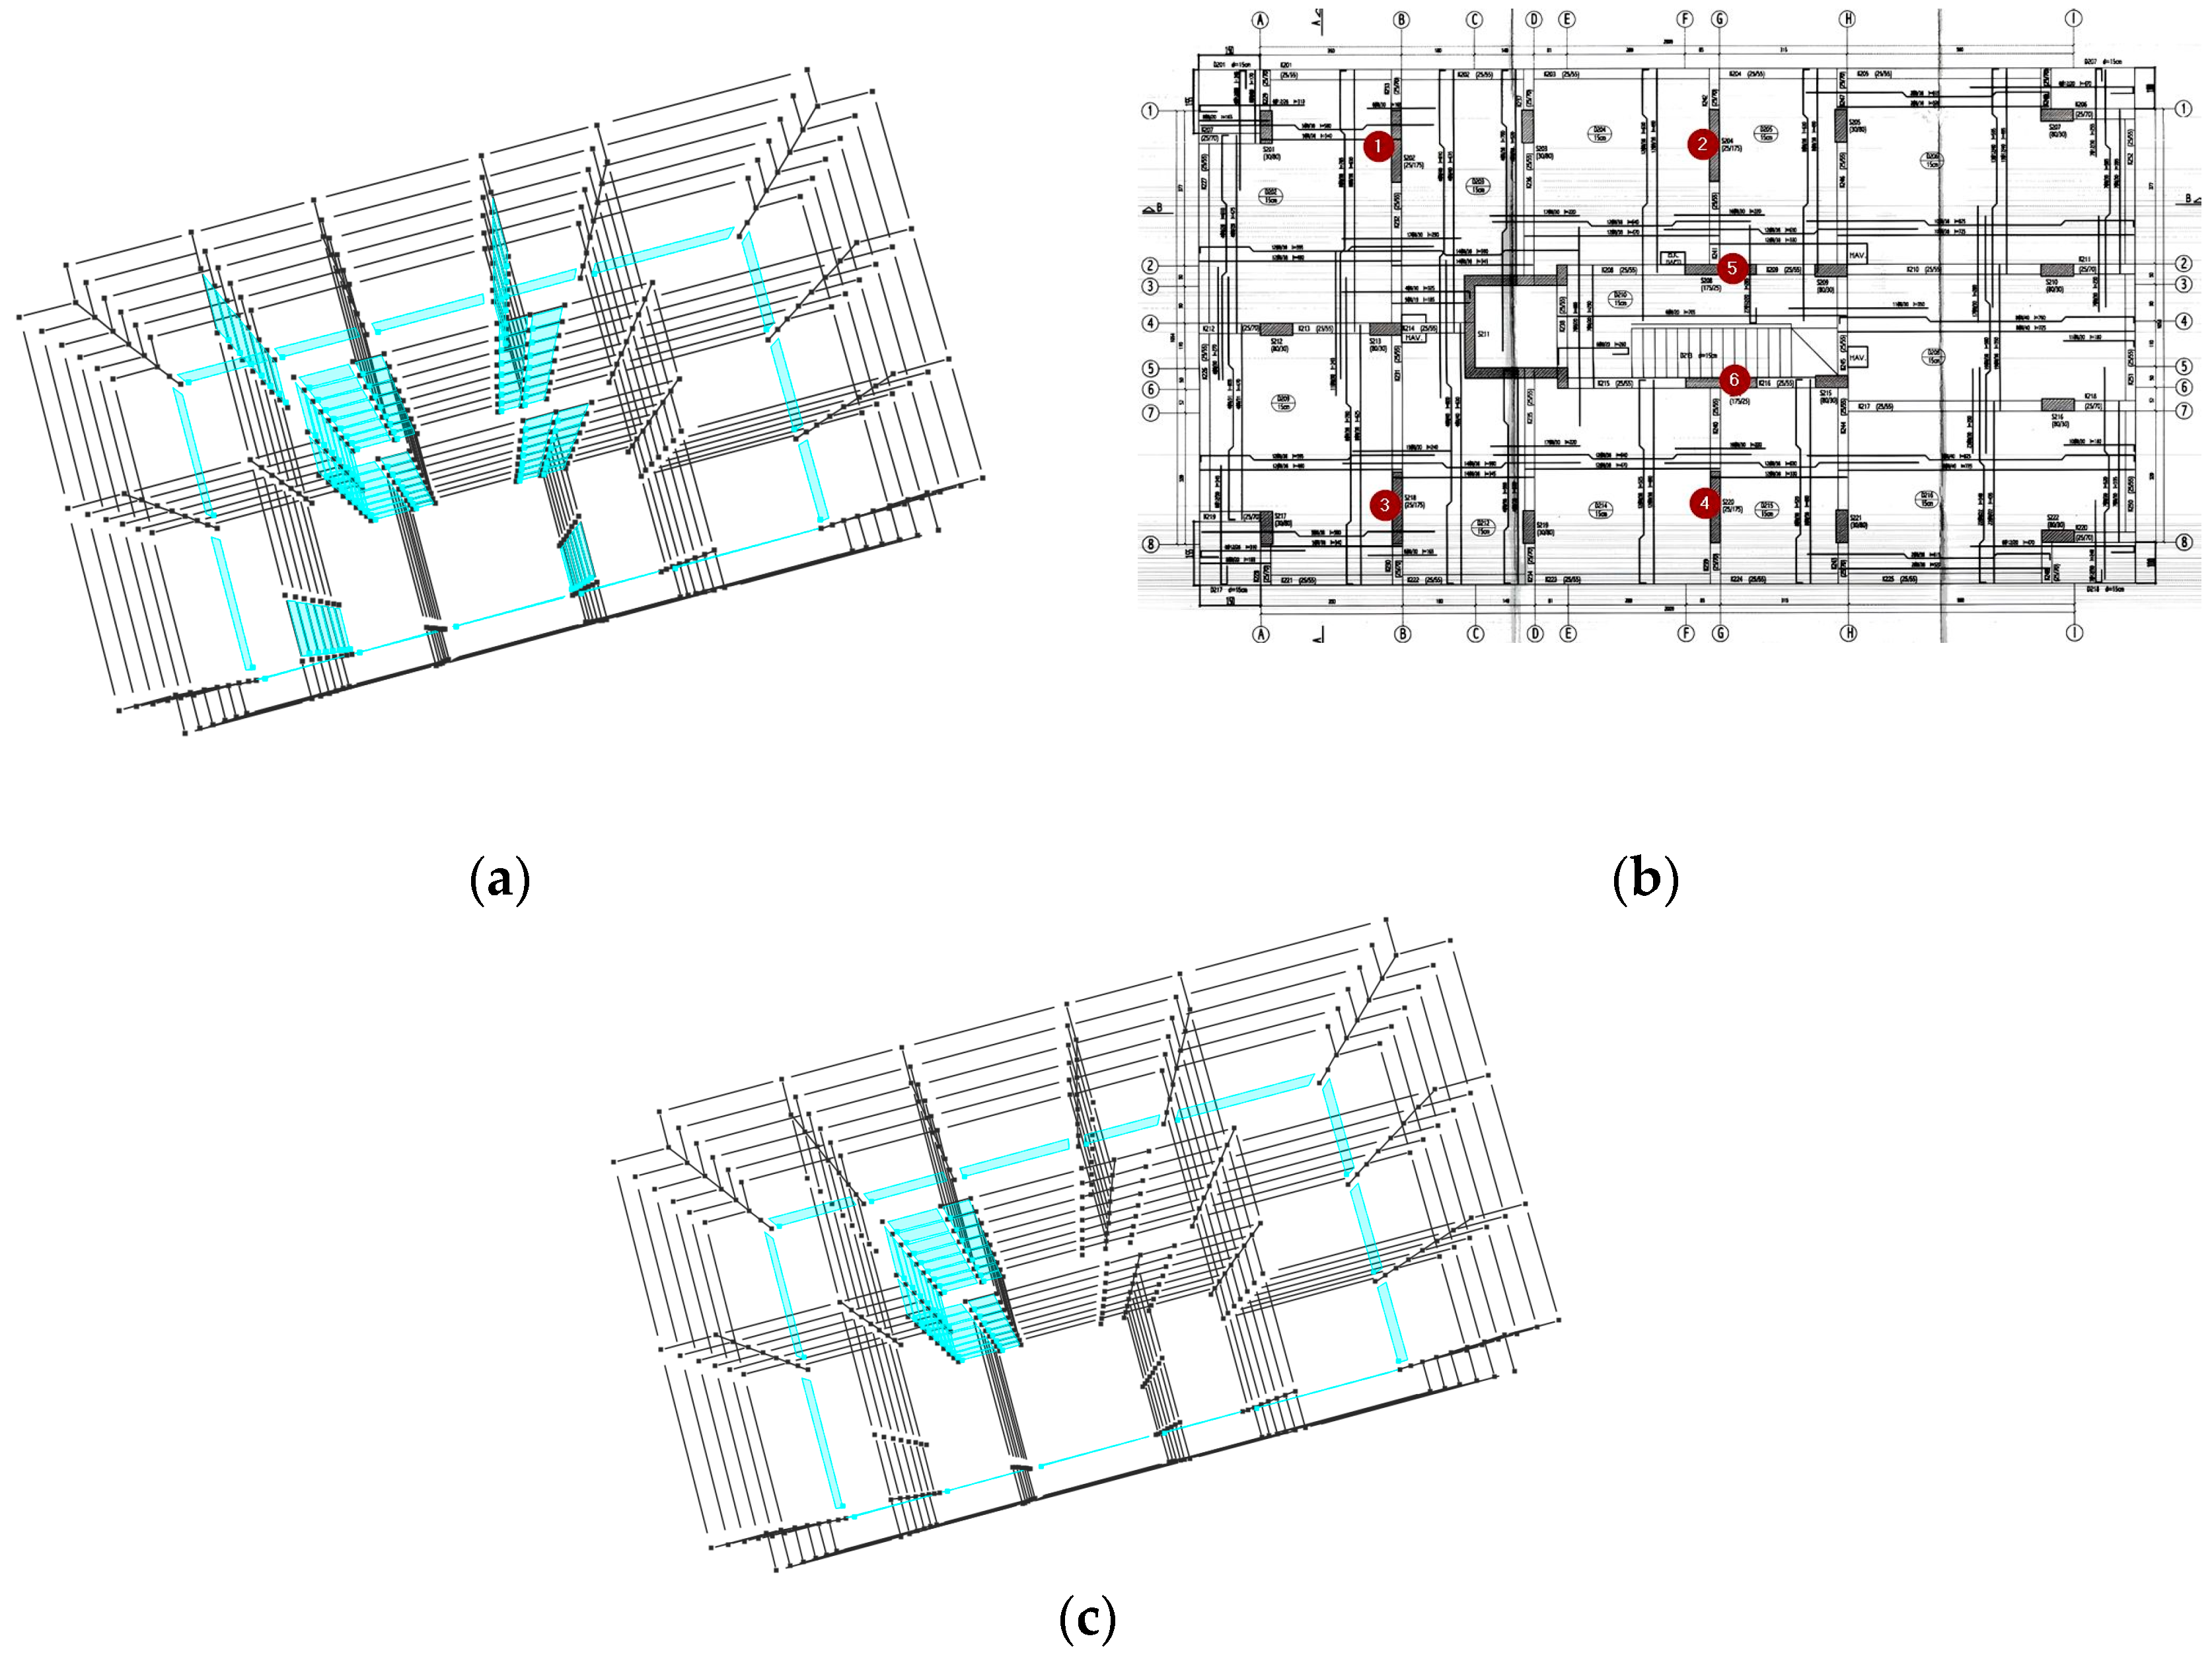
The building consists of one basement floor, a ground floor, five typical stories, and a roof story. The basement story has a floor height of 2.7 m, while all other floors have a typical height of 3.0 m. The existing structural drawings of the building were available only in digital format. Figure 1 presents the slab formwork and reinforcement plan of the typical floors. The only difference in the basement floor plan is that the building is surrounded by basement walls along all four sides.
The compressive strength of concrete (fc) was 30 MPa (i.e., C30) and yield strength of reinforcement (fsy) was 420 Mpa (i.e., S420 grade). Beams in the moment-resisting frames were generally 25 × 55 cm in cross-section, while cantilever beams were 25 × 70 cm. The diameter of the stirrup was 8 mm and stirrup spacing in both end regions of the beams was 10 cm. Dimensions of columns were 30 × 80 cm or 80 × 30 cm, placed in floor plan, as shown in Figure 1, for both principal directions. Each column contained 12 longitudinal bars with a diameter of 16 mm (reinforcement ratio 1%). The diameter of transverse reinforcement in the columns was 8 mm and spacing in the confined regions were 70 mm or 100 mm. Depending on the reinforcement layout, there are six different column types. The number of crossties, which in turn affects the confinement, along short and long direction was three and one, respectively. The stirrup hooks were bent at 135°. The thickness of the shear walls was 25 cm. A centrally located U-shaped core wall serves as the elevator shaft, and basement shear walls also have a thickness of 25 cm. The floor slabs were 15 cm thick.
Removal of exterior beams along the façade frames of the typical floors creates structural irregularity due to architectural constraints. This design practice, though structurally undesirable, is commonly encountered in buildings within the region and may have contributed to the building’s vulnerability during seismic excitation.

2.2. Finite Element Models

To evaluate the effects of near-fault ground motions, two types of analyses were conducted on a building: one using ground motion records obtained from a station located very close ( 5 km to a fault compatible with the building’s location, and another using records from a station farther from the fault ( 38 km). Additionally, to examine the importance of the structural system, the contribution of shear walls under near-fault earthquakes was assessed by removing all shear walls from the building model, except for the U-shaped elevator wall. Columns measuring 30 cm × 80 cm were provided to replace the removed walls. Consequently, four different models and analyses were generated. To facilitate the understanding of these results in the following sections, the naming conventions provided in Table 1 are used. According to this naming, the numbers 1 and 2 indicate different structural system configurations, while the letters ‘a’ and ‘b’ represent near-fault and far-fault earthquake scenarios, respectively.
A three-dimensional view of Model 1 is presented in Figure 2a. Model 2 represents the case in which the number of shear walls is reduced. The six walls indicated in Figure 2b were modeled as columns in this version of the model. This modification aims to investigate the impact of shear walls on the seismic performance of the structure. A three-dimensional view of Model 2 in Perform3D is presented in Figure 2c.
Structural modeling and analyses were carried out using the Perform3D V.10 software. Beams and columns were modeled as frame (line) elements, while slabs and shear walls were modeled using shell elements. Nonlinear behavior was represented using a concentrated plastic hinge approach for beams and a distributed plasticity approach for columns and walls. Moment–rotation relationships for each beam section type were determined using the Xtract V.3.0.8 software and assigned to the model. The material parameters recommended by TBEC-2018 were considered in obtaining the moment–curvature (rotation) relationships. For the plastic hinge length, half of the section depth, as suggested in TBEC-2018, was used. For columns and shear walls, unconfined and confined Mander models [54] were utilized in the fiber section modeling as provided in TBEC-2018, Section 5. Typical representation of fiber section and plastic hinges illustrated in Figure 3. Slabs and basement walls were modeled using the linear elastic method with effective section stiffness values permitted by TBEC-2018. The applied loads in the model include 1.8 kN/m2 for floor covers, 2.0 kN/m2 for live floor loads, and wall loads transferred through slabs and beams. Additionally, a snow load of 0.75 kN/m2 was considered for roof levels.

2.3. Nonlinear Analysis

The seismic station data used in the analysis were selected based on the proximity to the building and the compatibility of local soil conditions. Among the available stations, Station No. 3124 in Antakya was identified as the closest and most compatible with the building site. For the far-fault condition, Station No. 3115 located in the İskenderun region was chosen. Station location and soil information, along with earthquake data, were obtained from the Disaster and Emergency Management Authority (AFAD) [55] under the Ministry of Interior of the Republic of Turkey. The selected ground motions were initially subjected to preprocessing. To refine the raw signals, a baseline adjustment was carried out, followed by the application of a first-order Butterworth filter. The filtering process employed lower and upper frequency limits of 0.025 Hz and 40 Hz, respectively.
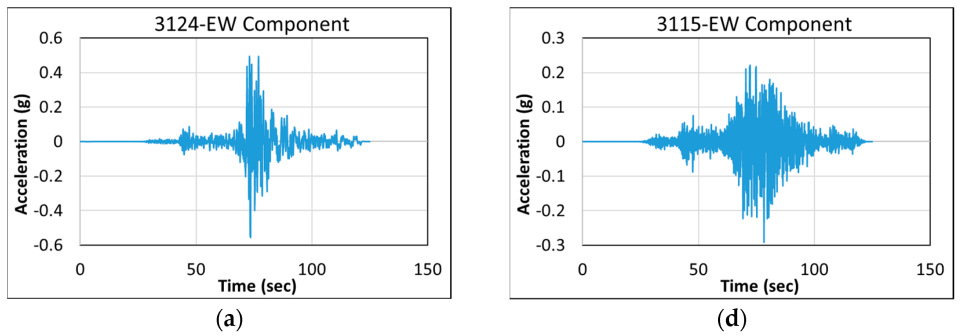
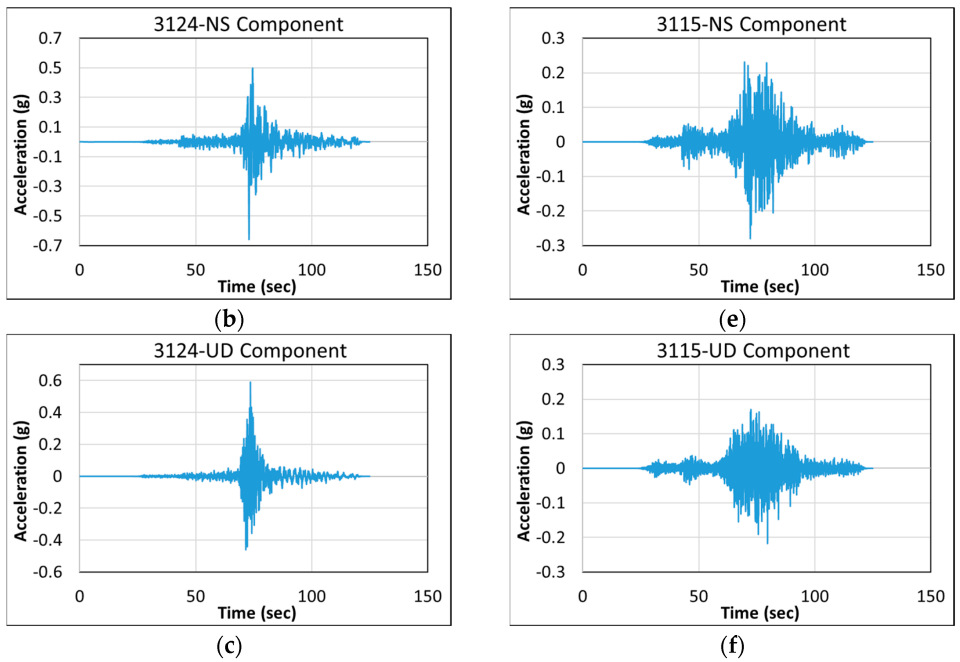
Acceleration data from the station records were obtained as two horizontal components (east–west (EW) and north–south (NS)) and one vertical component (UD) over time. To match the building’s plan orientation, the horizontal acceleration records were rotated by 31° before the analyses. The acceleration–time histories of the rotated station data (3124 and 3115) are presented in Figure 4.
Nonlinear analyses were performed on both Model 1 and Model 2 using the ground motions given in Figure 3. In these analyses, the vertical component of the earthquake was also included based on actual recorded ground motions. To more accurately capture the real structural behavior and the post-earthquake damage state of the building, the acceleration records were used in their original, unscaled form rather than being matched to the design spectrum. Rayleigh damping, defined in relation to the natural periods of the structure, was adopted for damping representation.
Plastic rotation and deformation capacities were assigned within the software for each cross-section individually. Using the demand values obtained from the analyses, the damage levels of the structural elements were evaluated. The capacities for assessing the damage levels were calculated in accordance with Section 5 of the TBEC-2018 [53]. For determining the deformation limits, the Collapse Prevention (CP) limit is first calculated. The Controlled Damage (CD) limit is then obtained by multiplying the CP limit by 0.75, while the Limited Damage (LD) limit is directly specified in the code.
The deformation capacity equations corresponding to the Collapse Prevention (CP) limit are presented in Equation (1) for concrete and Equation (2) for reinforcing steel. In Equation (1), the parameter ω w e denotes the effective confinement reinforcement mechanical ratio, calculated based on cross-sectional dimensions and reinforcement detailing. In Equation (2), ε s u represents the ultimate tensile strain limit, which depends on the grade of the reinforcing steel. The necessary input values for reinforcement modeling are summarized in Table 2.
ε c c ( C P ) = 0.0035 + 0.04 ω w e 0.018
ε s ( C P ) = 0.4 ε s u
Equation (3) was used to calculate the plastic rotation capacities. In this equation, Φ u denotes the ultimate curvature before collapse, Φ y is the yield curvature, L p is the plastic hinge length, and L s represents the shear span (taken approximately as half of the clear span). The parameter d b refers to the average diameter of the tension reinforcement bars.
θ p ( C P ) = 2 3 Φ u Φ y L p 1 0.5 L p L s + 4.5 Φ u d b
The Controlled Damage (CD) limit values for both deformation and plastic rotation are given in Equations (4)–(6). For the Limited Damage (LD) limit, the deformation capacity is constant for both concrete and steel, with values of 0.0025 and 0.0075, respectively. At the LD limit, the plastic rotation value is zero, indicating that no plastic rotation is permitted.
ε c c ( C D ) = 0.75 ε c c ( C P )
ε s ( C D ) = 0.75 ε s ( C P )
θ p ( C D ) = 0.75 θ p ( C P )

3. Results

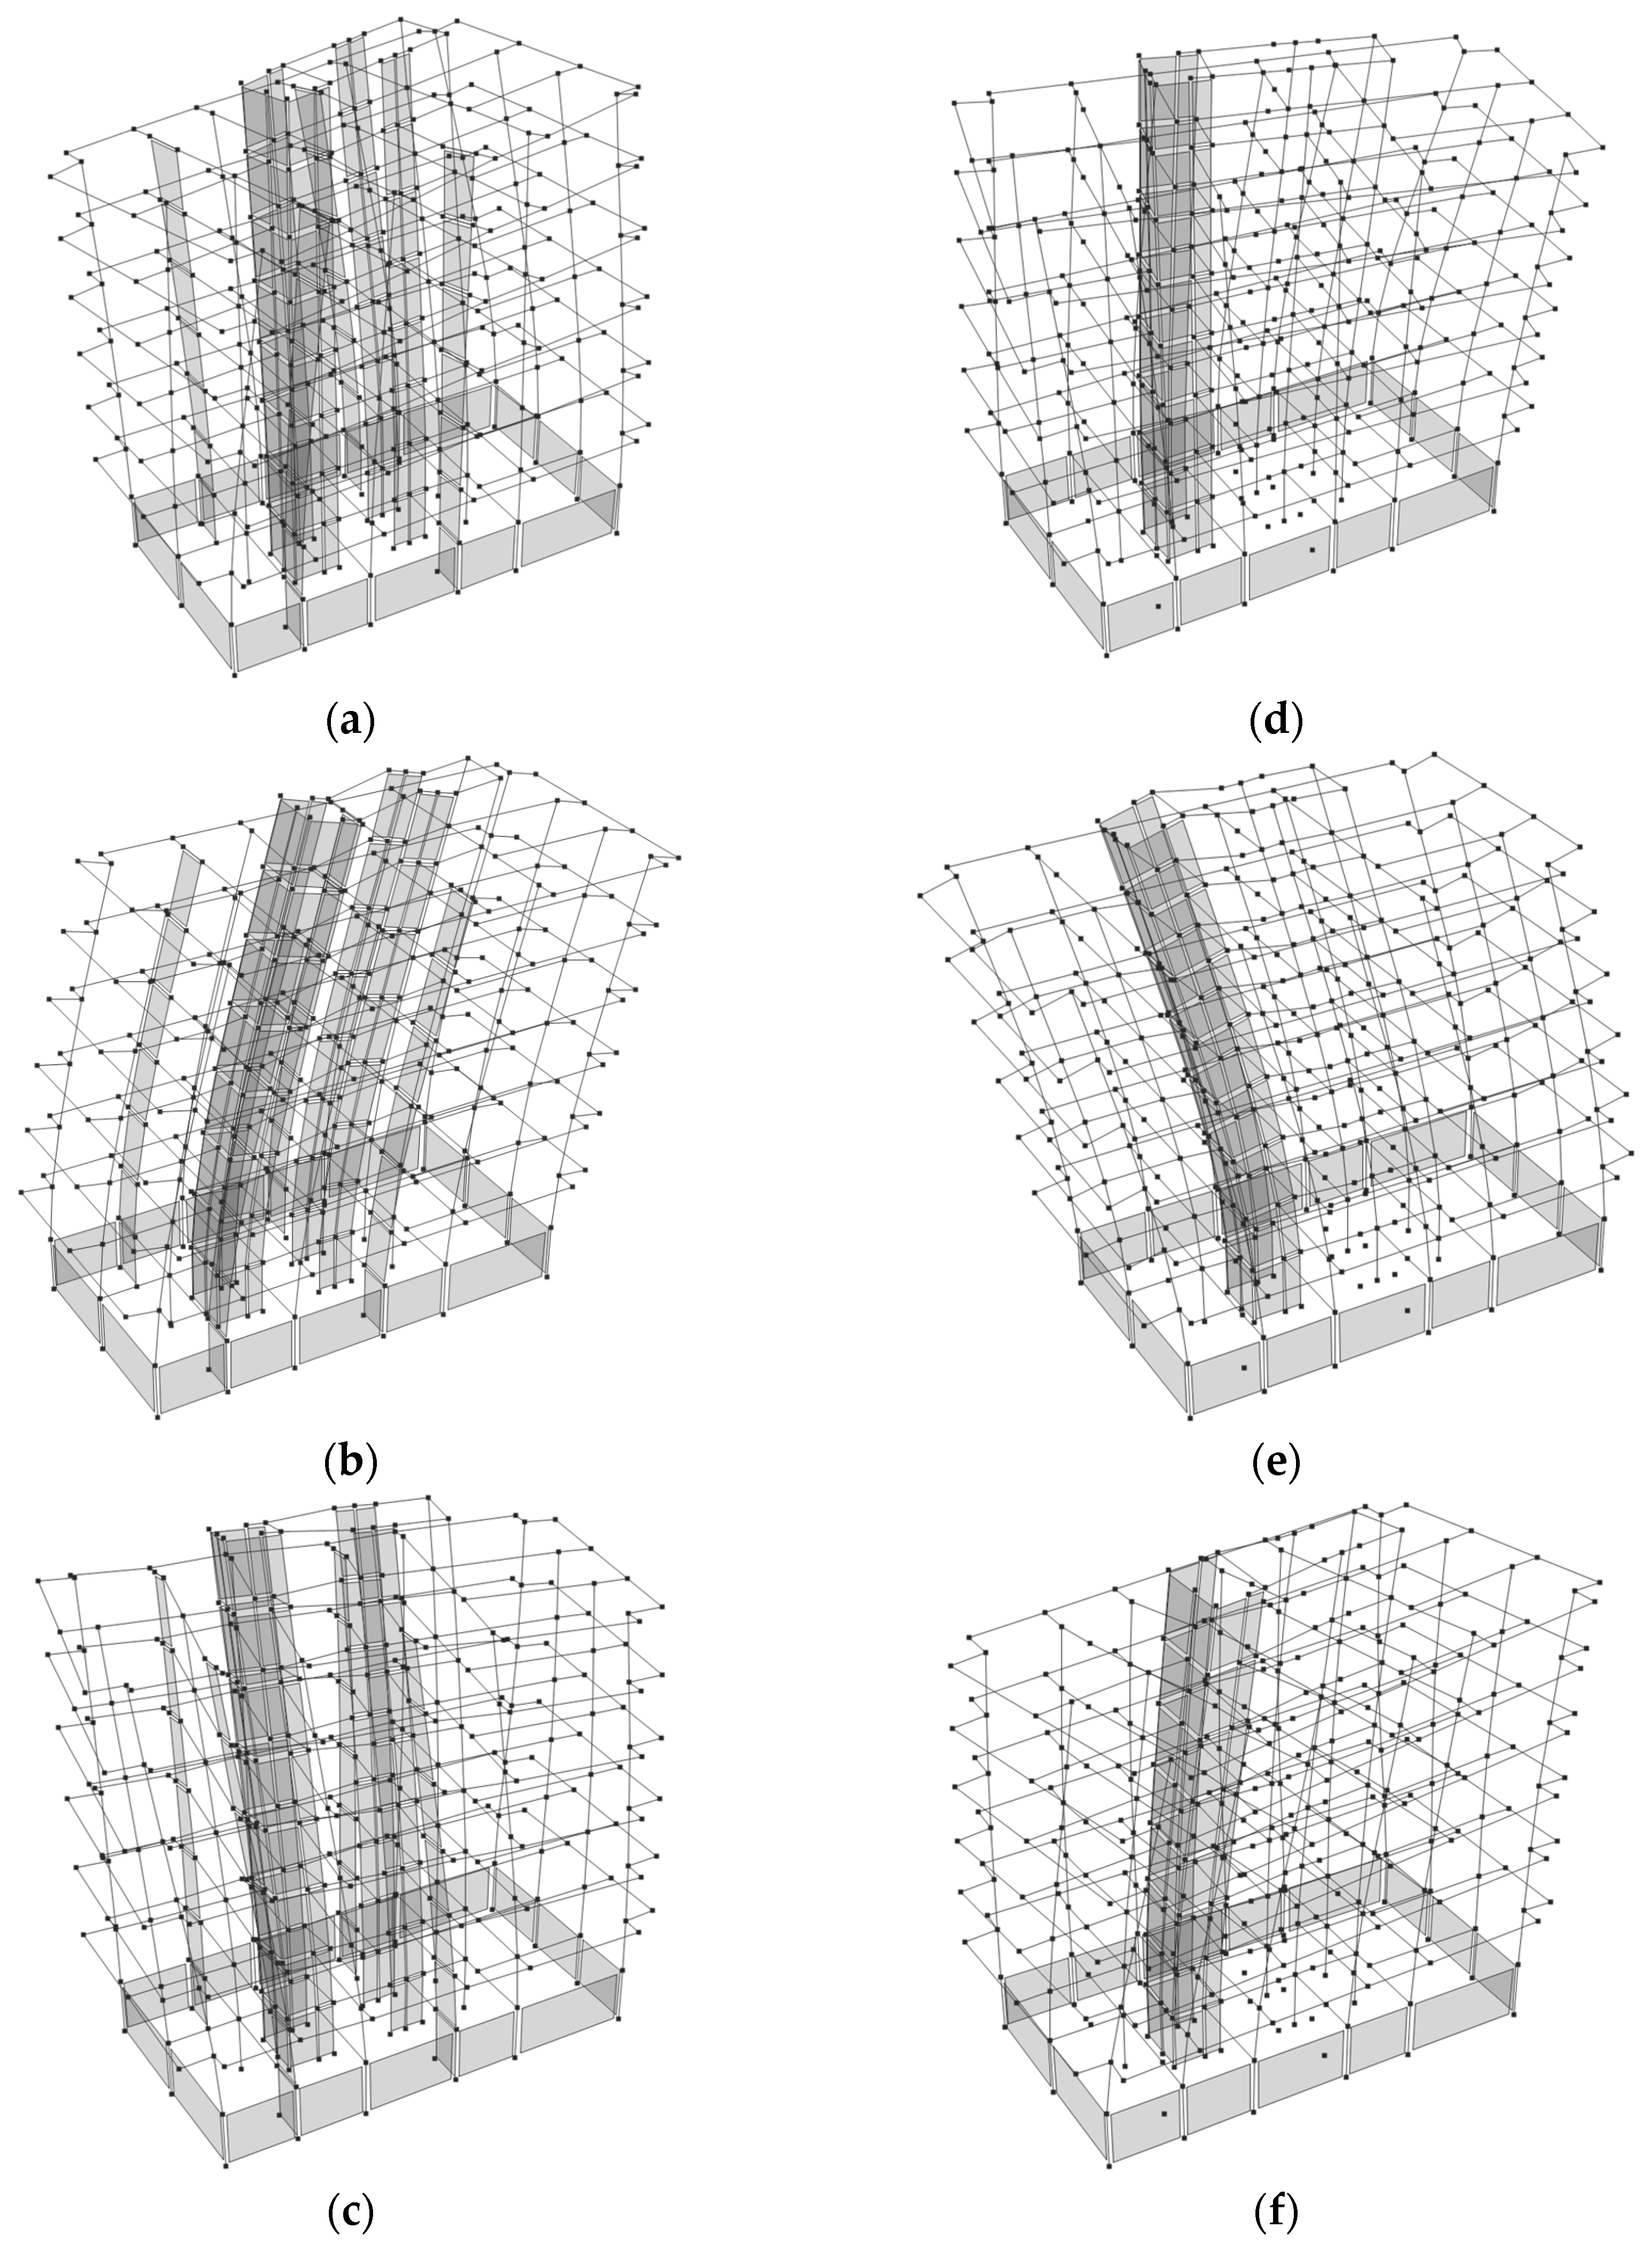
The results of the nonlinear time history analyses are presented below. The dominant three mode shapes of Model 1 and Model 2 are shown in Figure 5. Considering the mode shapes, the first mode exhibits a torsional behavior dominated by the Y-direction. The second mode shows a clear translational movement in the X-direction, while the third mode again demonstrates a torsional behavior in the Y-direction. The mode shapes of Model 2 are similar in form to those of Model 1. The periods and mass participation ratios of the dominant modes for both models are presented in Table 3. In Model 2, an elongation of the periods in the dominant modes is observed. Although the mass participation ratios do not change significantly, a notable period elongation occurs, especially in the first mode. This elongation results in Model 1 and 2 being subjected to different spectral accelerations during an earthquake. As a general observation, the dominant period obtained for the 7–8 story building is relatively high even for Model 1, indicating the lateral stiffness difference in both structural systems. The main reasons for this include the number, length, thickness, and arrangement of shear walls, as well as the beam–column frame configuration. In Model 2, further reduction in the shear walls increased the period to approximately 3.3 s, which is considerably high. These results emphasize the importance of structural system stiffness.
A comparison of the base shear forces is presented in Table 4. When comparing the near-fault (a) and far-fault (b) cases, it is observed, as expected, that the base shear forces under near-fault effects are significantly higher. In fact, except for the Y-direction of Model 2, the near-fault base shears in the other cases (Model 1 X–Y and Model 2 X) exceed more than twice those of the far-fault earthquake. From a structural system perspective, base shear forces in Model 1 are higher than those in Model 2 for all cases and directions. These results are related to the period elongations in Model 2, which correspond to lower spectral accelerations. The lower system stiffness in Model 2 results in reduced accelerations being transmitted to the structure, thereby producing lower base shear forces but increased lateral displacements, which in turn may lead to greater deformations.
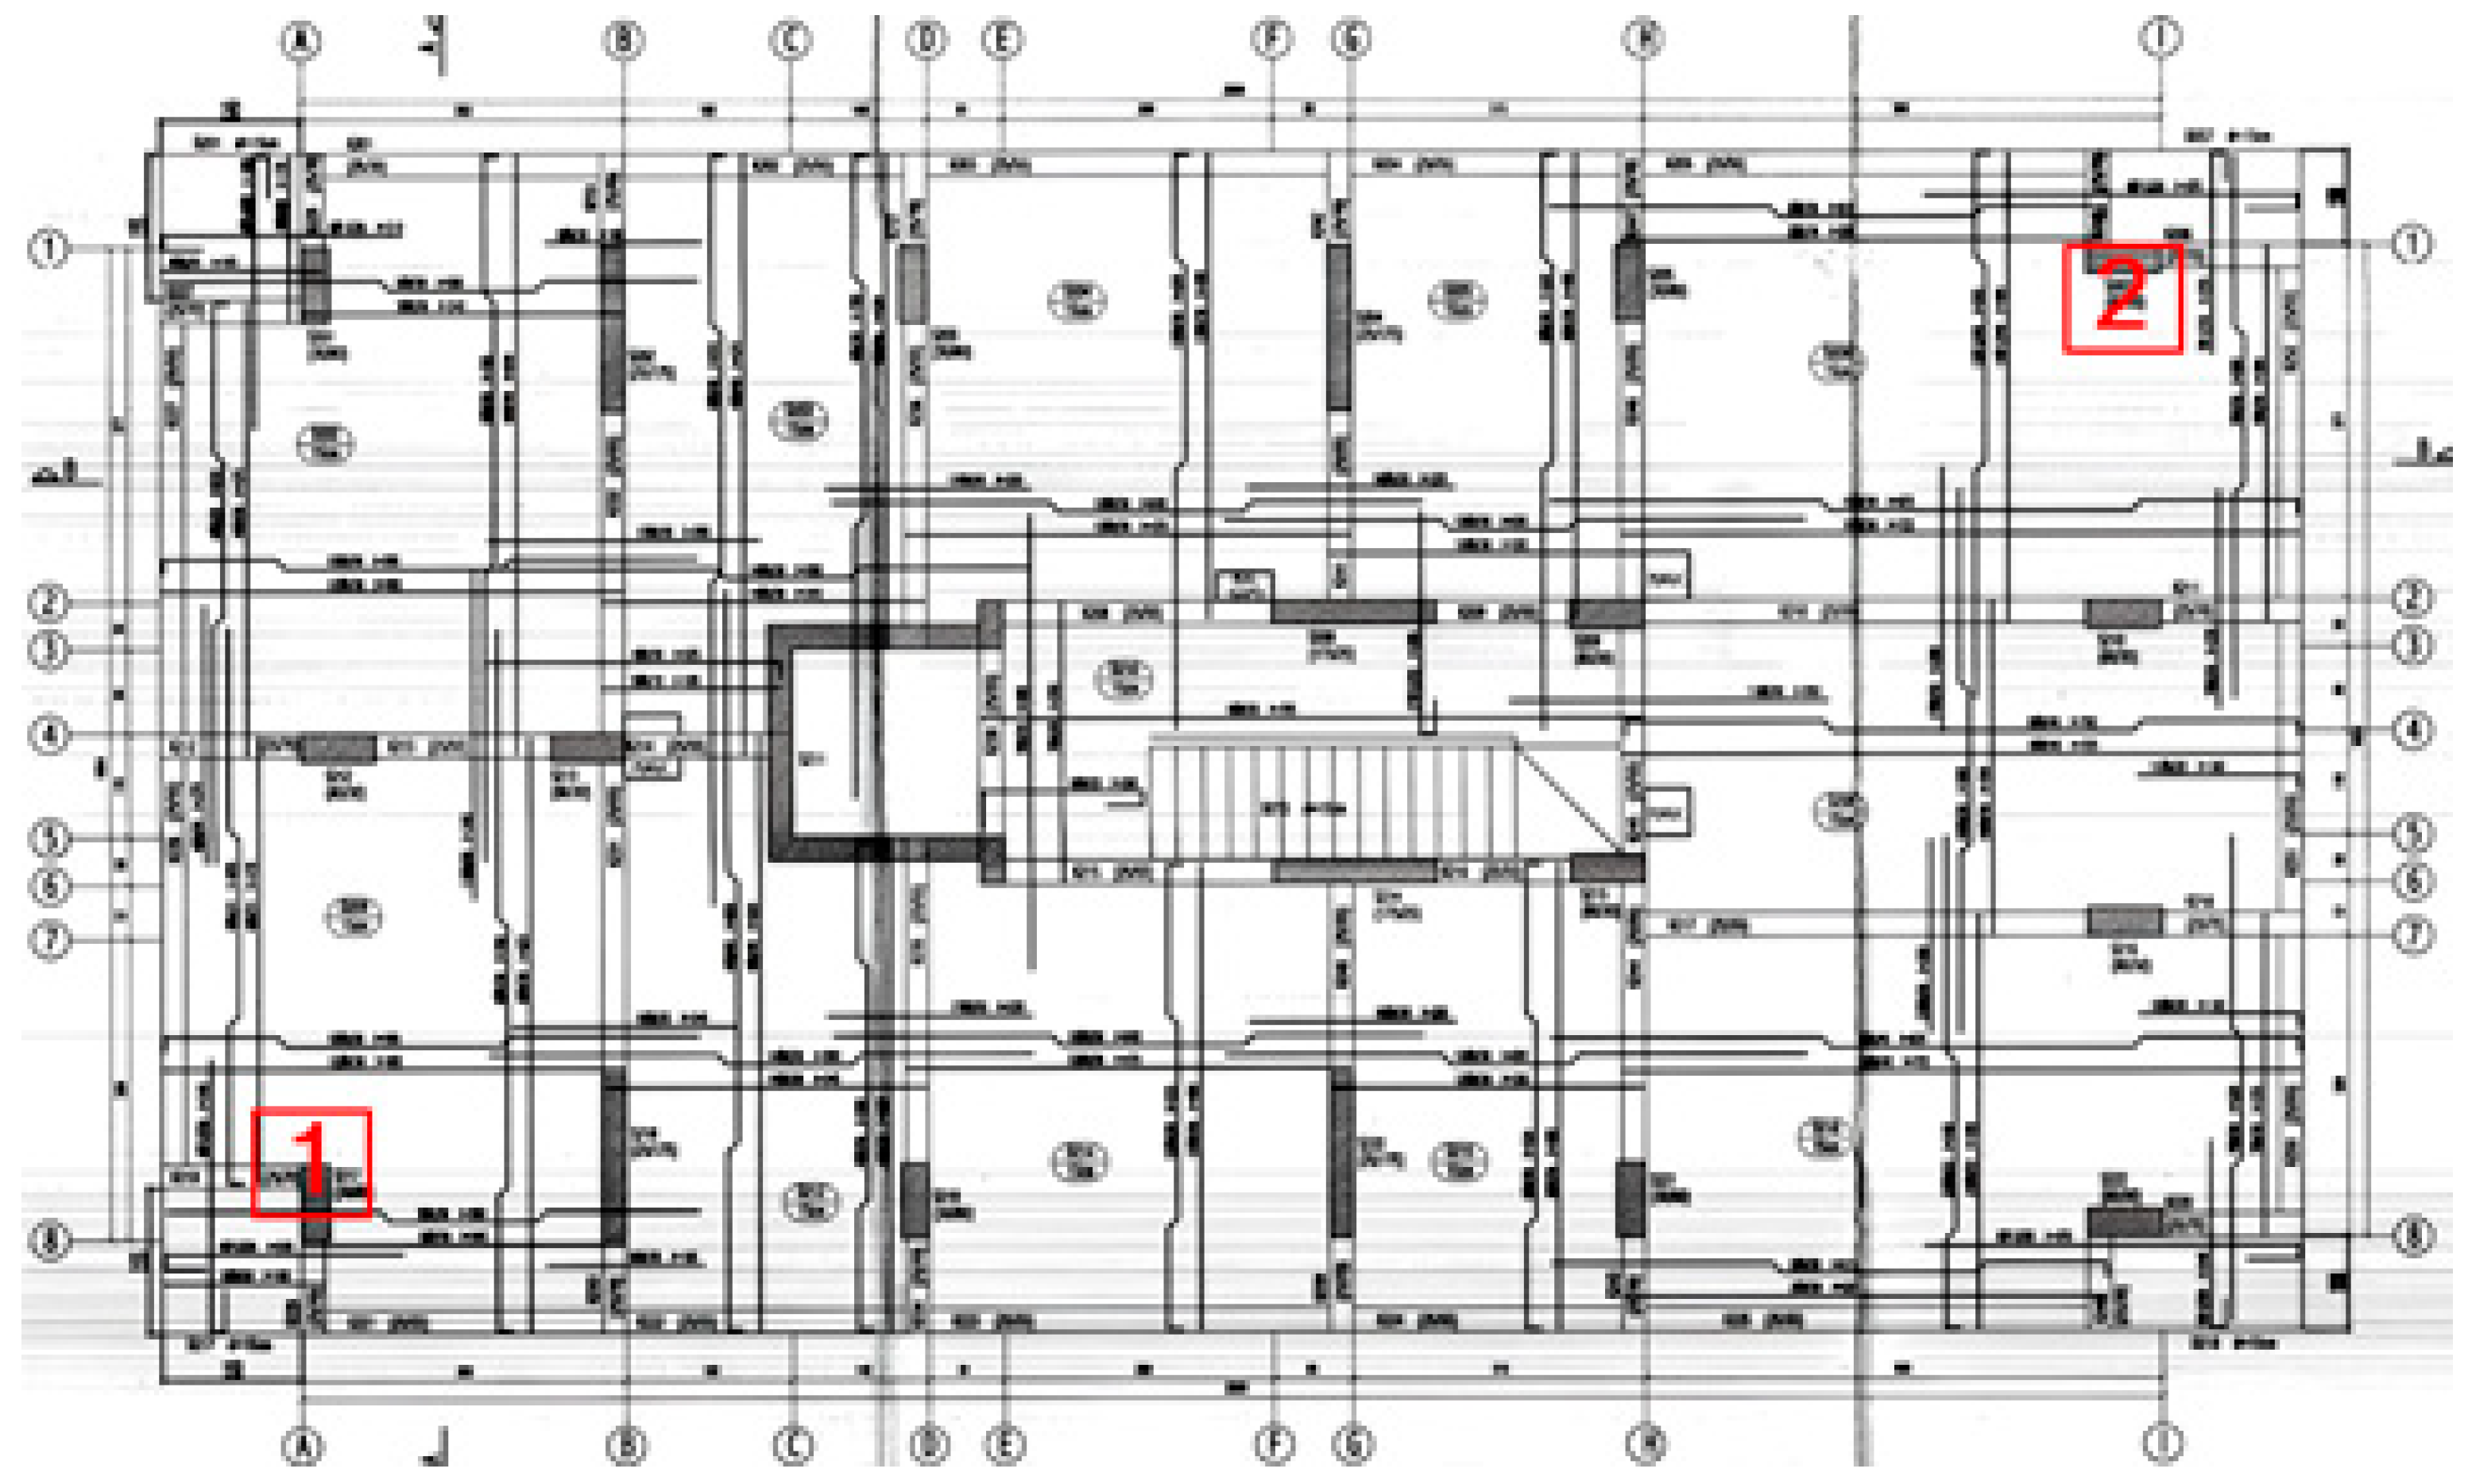
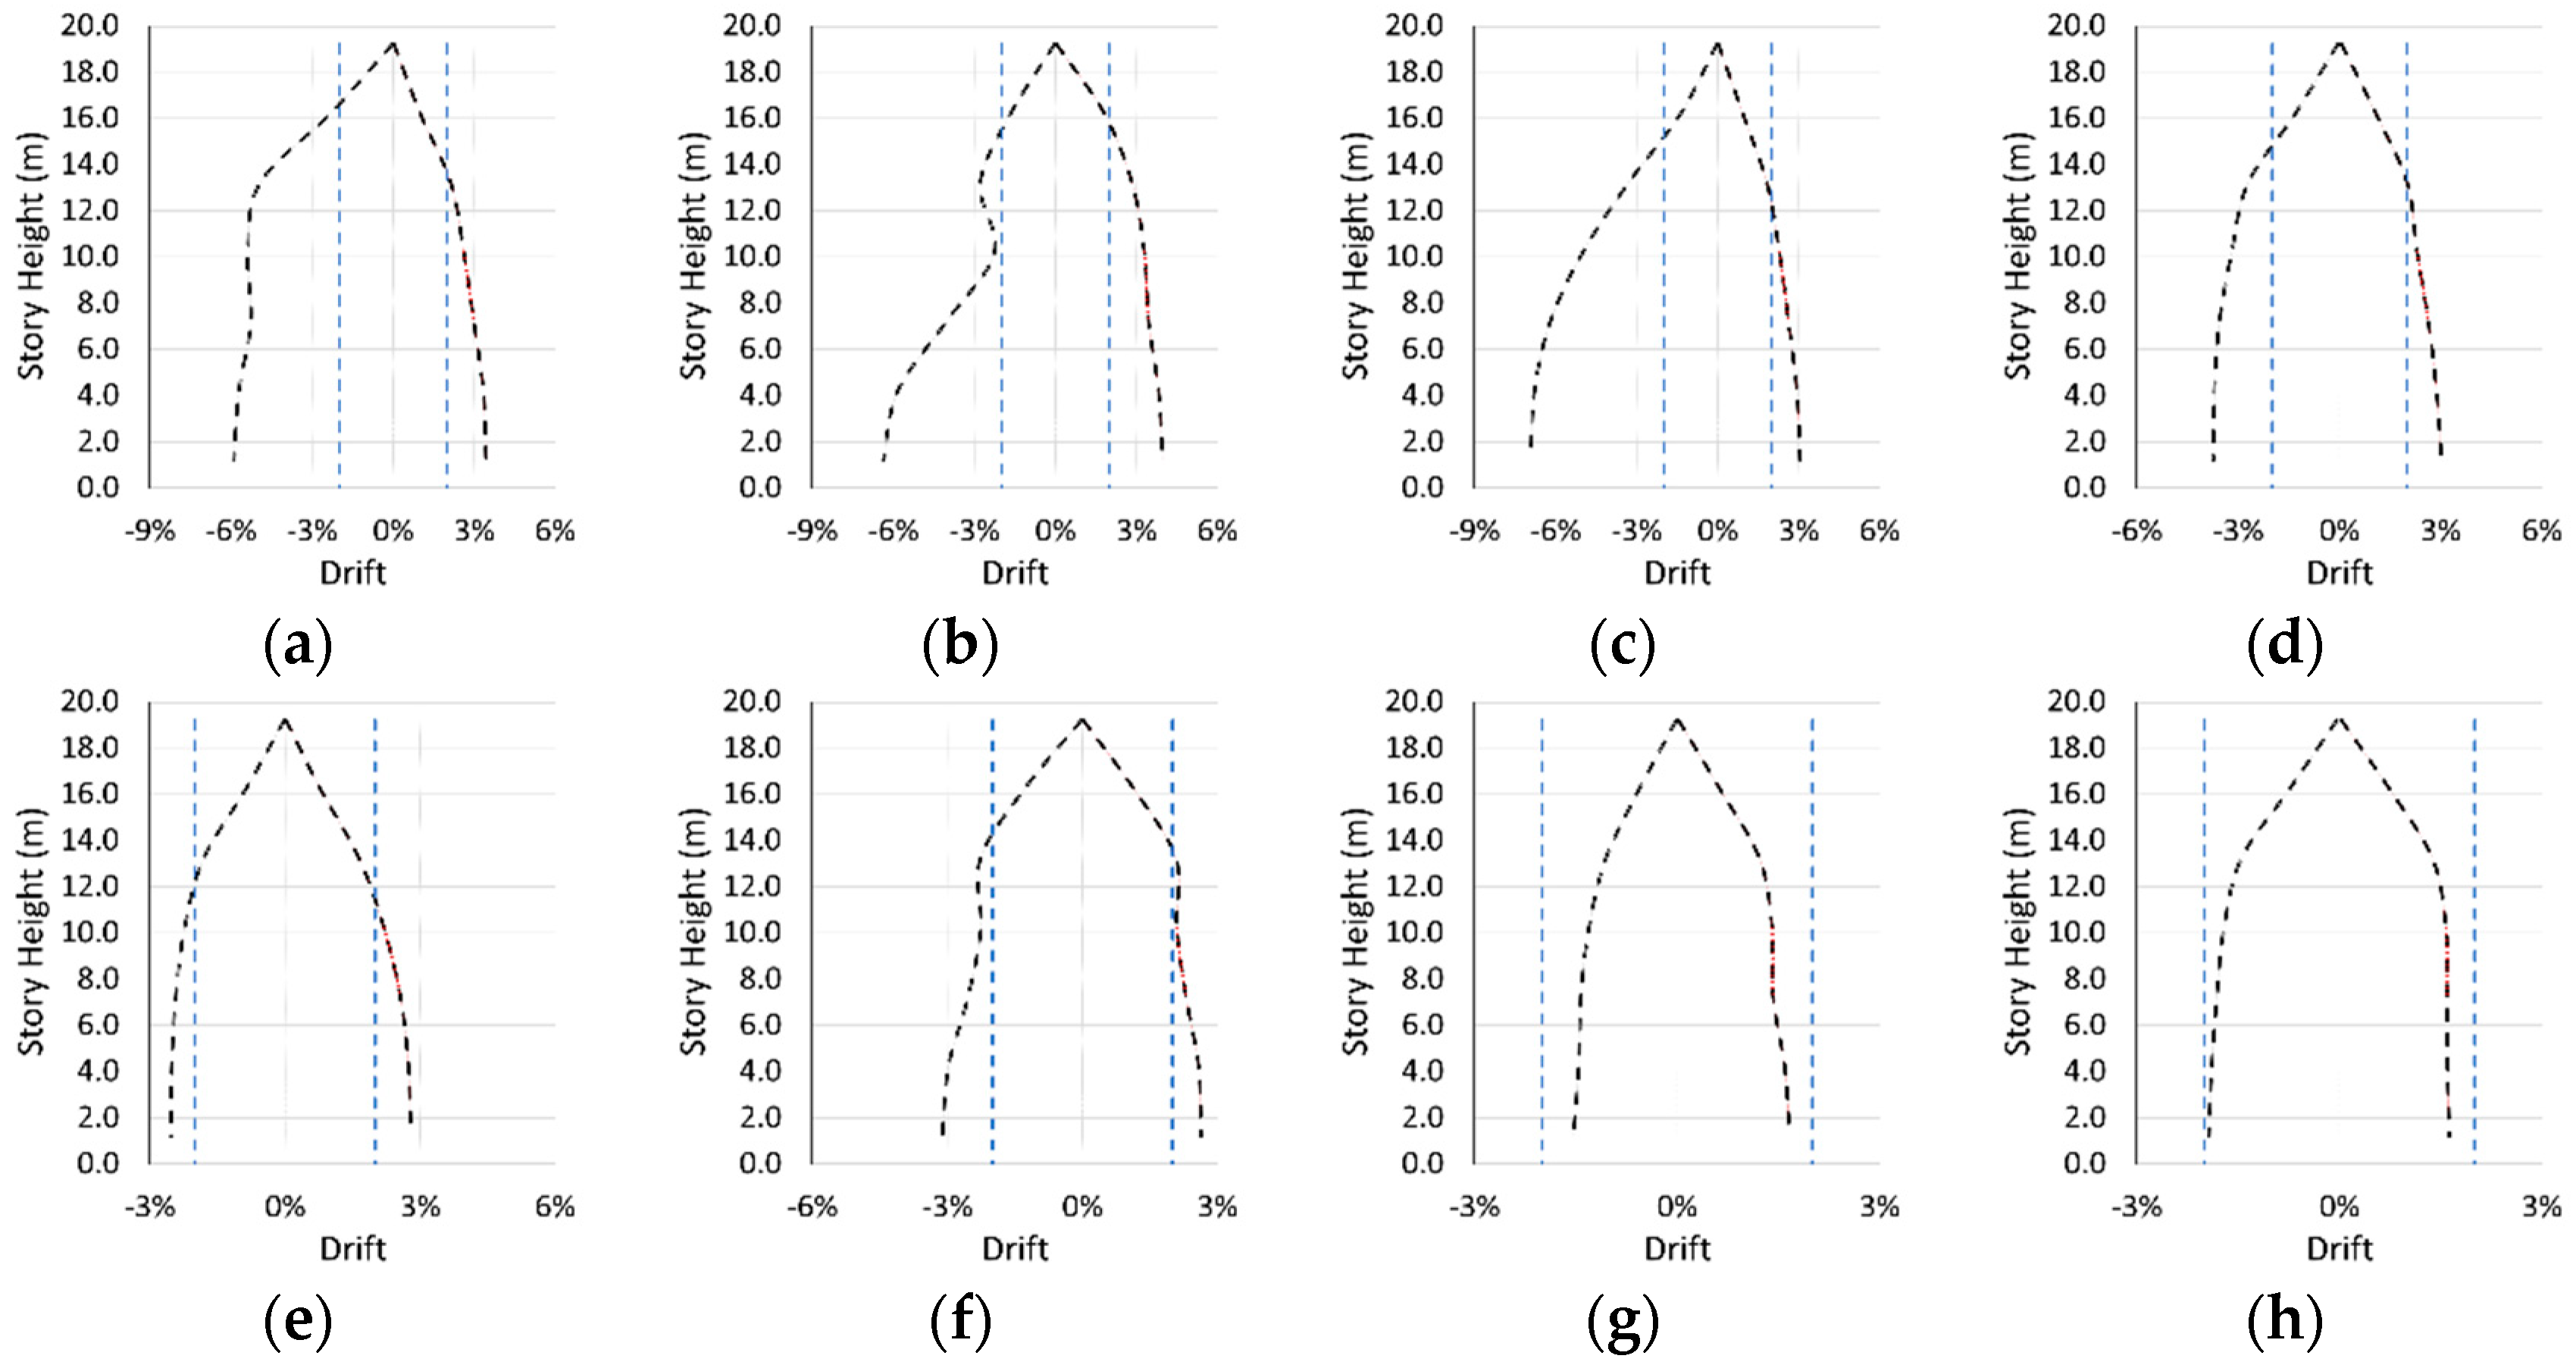
Story drift control provides valuable insights into building behavior. Since drift values are directly related to damage formation, they serve as important indicators of the seismic performance of structures. To evaluate drift demands, Points 1 and 2 illustrated in Figure 6 were selected. Owing to their significant distance from each other, these points are appropriate for assessing the structural response in different regions of the building. To compare the relative drift values under different conditions, the drifts were plotted with respect to story heights, as shown in Figure 7 and Figure 8. In these graphs, the blue vertical lines indicate the drift limit, taken as 0.02. The maximum and minimum values correspond to different directions of motion.
A detailed comparison of the inter-story drift values reveals that the results obtained from the near-fault station 3124 are consistently higher than those recorded at the far-fault station 3115, as seen in Figure 7. This difference is particularly pronounced under near-fault excitation, where the maximum inter-story drift ratio in Model 1 reaches 0.068 in the X-direction and 0.063 in the Y-direction. In contrast, for the far-fault station 3115, the corresponding values are 0.028 and 0.031, respectively. These results indicate that the inter-story drifts under near-fault ground motions exceed those of the far-fault case by more than a factor of two. Such a significant increase is attributed to the pulse-like ground motion characteristics and higher energy input typically associated with near-fault events, which amplify lateral displacements in the structure.
In Model 2, where the number of shear walls was reduced, a similar trend is observed between the near-fault and far-fault cases, with the near-fault inter-story drifts being considerably larger as seen in Figure 8. Moreover, when directly comparing Model 1 and Model 2 under identical near-fault conditions, it is evident that Model 2 exhibits greater inter-story drift values. This increase is related to the reduction in lateral stiffness due to the removal of shear walls, which results in longer fundamental periods and, consequently, higher displacement demands.
It is also important to note that in both structural models, the maximum inter-story drift values substantially exceed the drift limit of 0.02 specified in seismic design provisions. Exceeding this limit suggests a high probability of significant structural and nonstructural damage, as excessive lateral deformations can lead to cracking, yielding, and potential instability in both gravity and lateral-load-resisting elements. These findings underline the critical role of lateral stiffness to control displacement demands, particularly in regions susceptible to near-fault ground motion.
Assessing the damage levels in structural elements is also essential for comparing the seismic performance of buildings. Based on the element capacities defined in Perform3D, the damage states were determined directly from the software output. Elements in red indicate those that have exceeded the Collapse Prevention (CP) limit. Since the Severe Damage (SD) level is related to the CP limit by a factor of 0.75, elements in yellow represent members within the SD range, obtained by applying the 0.75 multiplier to the CP limit. Blue and green elements correspond to the Significant Damage (SiD) level, with multipliers of 0.25 and 0.5, respectively.
Figure 9 presents the element damage distribution for Model 1a. According to the results, a considerable number of columns have reached the SD or CP damage states. Severe damage is also observed in the elevator shear wall, and many other shear walls fall within the SiD range. According to TBEC-2018, the determination of damage states requires reductions in deformation and rotation capacities depending on shear force demands which are primarily used in the design stage. It can be said that application of these reductions would likely result in an even greater number of elements reaching higher damage levels.
In Model 1b, no elements were found to have reached the Collapse Prevention (CP) damage state, and only one shear wall exhibited Severe Damage (SD). Compared to Model 1a, these results are significantly different. Analysis from the far-fault station 3115 indicated that Model 1a experienced substantially greater demand under near-fault effects.
It was observed in Model 2a that numerous columns reached the Severe Damage (SD) and Collapse Prevention (CP) states. Severe damage is also evident in the elevator shear wall, while many other shear walls fall within the Significant Damage (SiD) range. When compared to Model 1a, it is observed, for instance, that column I-2, which was at the SD level in Model 1a, has reached the CP level in Model 2a. Similarly, several columns fall beyond the SiD in Model 1a and found in SD state in Model 2a. These results clearly demonstrate the importance of lateral stiffness on structural behavior.
No structural elements reached the Collapse Prevention (CP) damage state in Model 2b, and only one column located along axis I-1 exhibited increased deformations. It is evident from the comparison of Model 2a and Model 2b that the severity of Model 2a is higher, as the building sustained substantially greater damage. The near-fault effect in this model also caused a significant increase in damage compared to the earthquake record from the far-fault station 3115. Furthermore, when comparing Model 1b and Model 2b, it was again observed that damage levels were higher in Model 2b.
Performance levels achieved by all four models confirm the adverse influence of near-fault effects on structural performance. As presented in Table 5, both Model 1 and Model 2 reached the ‘Collapse Prevention’ (CP) performance level under near-fault earthquake excitations, indicating extensive structural damage that close to its stability limits. In contrast, under far-fault excitations, the performance level is classified as ‘Controlled Damage’ (CD), where damage remains more localized and overall stability is preserved.
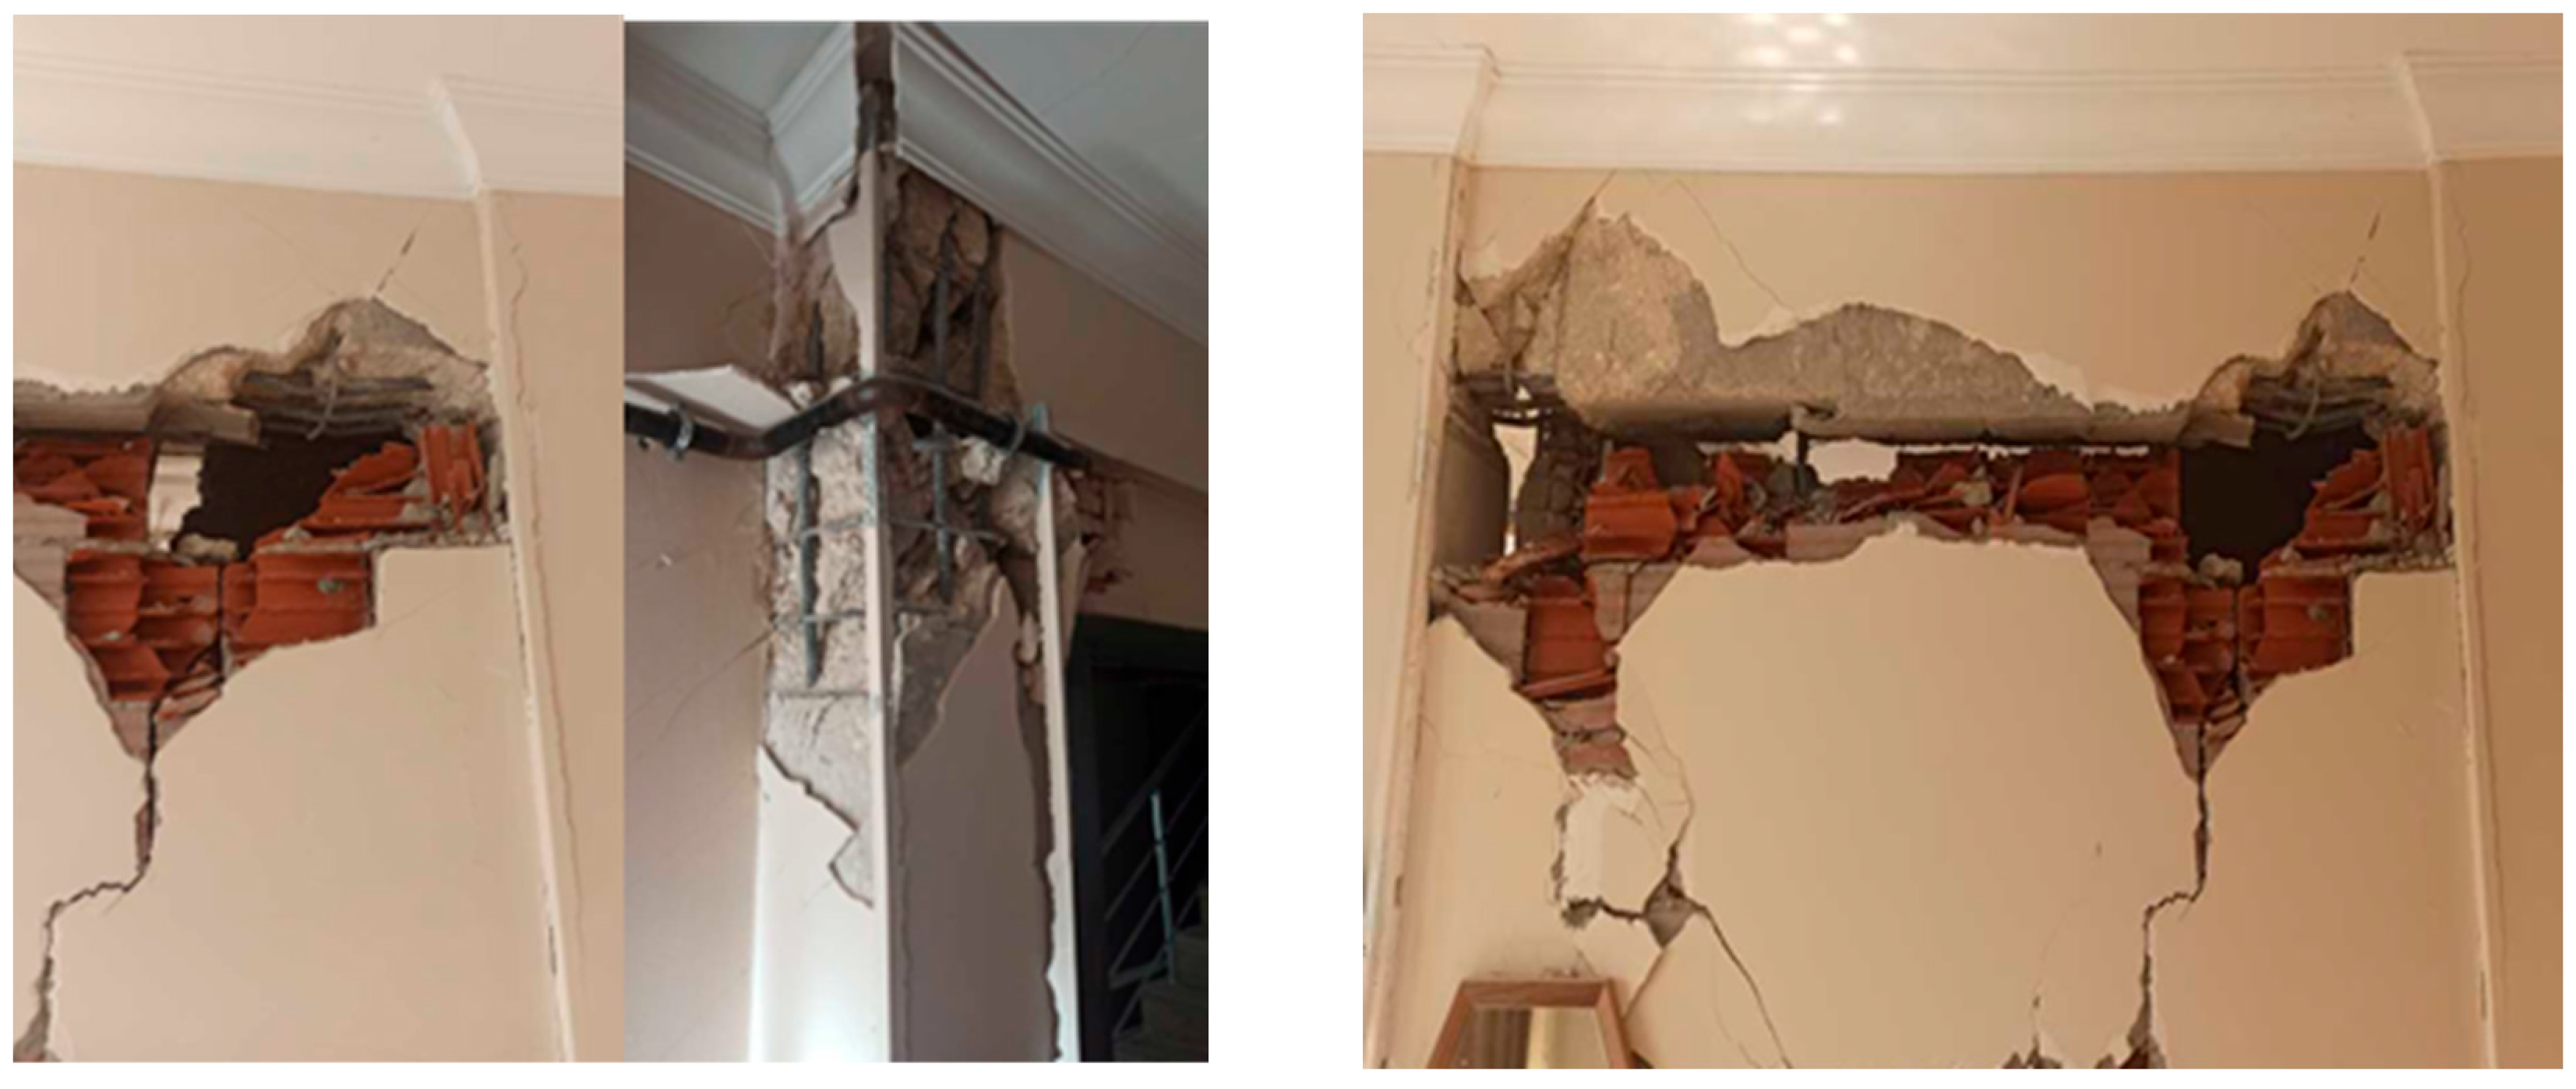
The analyzed building was demolished in a controlled manner due to the severe damage after the 2023 Kahramanmaraş earthquakes. Examples of column and beam damages observed in the building are presented in Figure 10. These element damages indicate that the results of Model 1a are consistent with the actual observed conditions. Therefore, it can be stated that the developed finite element model and the adopted analysis assumptions produced results are in good agreement with the real behavior determined after post-earthquake field studies. A more detailed comparison of Model1a with the actual damage conditions was not possible, as the building was demolished after an earthquake, and detailed field observations could not be conducted. In Figure 10, it can be seen that the collapse-limit deformation values in the beams and columns were exceeded to a very large extent. Therefore, it is assumed that the post-earthquake deformations in the structural members of the building were quite high and caused excessive damage in many columns and shear walls; hence, the building was demolished urgently by the authorities.
The ductile/brittle behavior check was performed by comparing the shear demands and shear capacities of the elements. Performance levels were determined considering only ductile elements, as brittle elements were excluded from the deformation-based assessment. In shear-governed evaluations, a reduction in the number of shear walls leads to a higher proportion of brittle elements, as observed in cases with fewer walls. This highlights the importance of ensuring an adequate number and proper arrangement of shear walls, especially in near-fault regions, to reduce brittle shear failure.

4. Discussion

The results of the numerical analysis indicate that the building under consideration did not meet the targeted performance criteria. The case study building is not an old structure, and it had quite high material quality, such as compressive concrete strength and reinforcement, and during the design phase, it was intended to retain its Life Safety status after an earthquake. However, in the Antakya region, many newly constructed buildings were excessively damaged or collapsed following the 6 February Kahramanmaraş earthquakes, as revealed by the post-earthquake damage assessment studies conducted by the Ministry of Environment and Urbanization [55]. It can be readily stated that the primary cause of the very severe consequences observed in the region after the earthquake is the effect of nearby faults, which also increased seismic demands [56,57]. This inference can also be made for case study buildings.
The analyzed building is close to the 3124 station. The acceleration spectra of the horizontal components of ground motions at Station 3124 and the TBEC-2018 elastic acceleration spectrum for the same location are compared in Figure 10. In the comparison, the spectrum labeled as “Building Design Spectra” represents the design spectrum of TEC-2007 [52], which has a return period of 475 years that corresponds to the DD2 level of design acceleration spectrum recommended by TBEC-2018 [53]. It can be observed that the spectral values of the recorded ground motions differ significantly from those of the designed earthquake. This discrepancy can be attributed to the effects of nearby faults and site amplification. As emphasized by many researchers, the Antakya station records of the Kahramanmaraş earthquakes of 6 February 2023, contain forward-directivity velocity pulses. Pulse effects amplify ground accelerations and induce very high lateral displacement demands in structures. The records from Station 3124 also include such velocity pulses [58,59,60,61]. In addition to the velocity pulses, researchers have also suggested that this station record shows evidence of super-shear rupture and basin effects [62,63]. The near-fault and basin effects and the potential role of their combination in structural damages is explained in detail by Gani et al. [64]. In light of all these studies, the ground motion records from Station 3124 can be considered an example of near-fault and basin effects. Therefore, performing a seismic performance assessment using the 3124 records allows the impact of these phenomena on the response of the building to be observed. For example, the periods of the first three dominant modes of the building under consideration are 1 s or longer. When the spectral accelerations for this period range are examined, it can be seen that the building was subjected to accelerations even higher than the spectral accelerations of DD1 (i.e., return period of 2475 years) defined TBEC-2018. Consequently, it can be implied that high accelerations had a decisive influence on the seismic behavior of the building owing to near-fault effects and site amplifications.
Figure 11a clearly demonstrates the spectral difference between the near-field and far-field records used in the analysis. It can be seen from the spectra that for both horizontal directions (i.e., EW and NS), spectral accelerations of near-field records are almost 2–4 times higher than far-field spectral accelerations around building-dominant periods. The damage distribution of buildings according to near-field and far-field records can be attributed to the difference between the spectral shapes [65,66]. The other important observation is about the spectral shape difference. Figure 11b provides a striking example of the difference between the design spectrum and the actual earthquake record. This comparison raises two questions. First, will the design of buildings located in the proximity of faults (i.e., near fault) be sufficient to meet the target performance according to prescribed earthquake design? Second, can elastic design spectra represent future earthquakes for retrofit purposes? These questions are critically important to ensure intended performance criteria are met and loss of life is prevented in a future near-fault earthquake. By considering special conditions, such as forward-directivity effects, super-shear rupture, and basin effects more thoroughly within the probabilistic procedures, the credibility of predictions can be increased. Therefore, it is highly appropriate to design a structural system to enhance strength, stiffness, and ductility during near-fault earthquakes. The results of Model 2 illustrate this situation and the importance of shear walls.
It is well known that Soil Structure Interaction (SSI) and/or Soil Foundation Structure Interaction (SFSI) significantly affect dynamic behavior, and displacement demands are more pronounced when SSI and/or SFSI [67] are considered. The velocity pulses observed in near-fault earthquakes are also important from a soil behavior perspective. Nonlinear soil behavior influences the spectral accelerations transmitted to the superstructure. On the other hand, based on the analyses, it was found that the damage distribution of buildings and observed damages according to post-earthquake damage surveys (see Figure 10) are comparable in reflecting building performance state after an earthquake. It is also worth noting that the effect of infill walls is not considered in this study; recent studies confirm that these elements may dramatically influence overall behavior, especially under seismic loading conditions [67]. Accordingly, authors will further investigate SSI, SFSI, and infill wall effects as future research to expand upon the scope of this study.
Another important point is that the results obtained from numerical analyses are based on a single building. Consequently, there are clearly not enough examples or analyses to draw conclusions regarding code revisions or the entire building stock. Nevertheless, based on both studies and post-earthquake observations, it can be argued that the situation illustrated in this example is valid for many buildings in the region. Similar discrepancies, as seen in Figure 11, are observed in all records from the Antakya region [64]. Therefore, both observational and numerical results, even for new buildings, indicate that near-fault earthquakes can exceed the spectral values anticipated by design codes, and the effects of near-fault motions play a significant role in building seismic performance. A more detailed future investigation of results requires a much larger number of examples and more comprehensive analyses, including code compatible record selection, with or without scaling or the effect of hysteresis models [65,68]. In addition, damage state evaluation of the case study can be made according to TBEC-2018 limits; other international standards can be used to further clarify whether similar performance classifications could be reached [69]. Accordingly, the findings of this study cannot be generalized to all RC building types or be interpreted as code proposals.

5. Conclusions

The key findings derived from the analyses are summarized as follows:
  • Model 1a results align well with the observed post-earthquake damage, confirming the validity of the finite element model and analysis approach.
  • The modal shapes of Models 1 and 2 are similar, but the period values in Model 2 are notably higher, and this situation significantly increases seismic demands.
  • Inter-story drift ratios and base shear forces in Model 1a are substantially higher than in Model 1b, due to intense ground accelerations in the near-fault scenario earthquake.
  • Plastic deformations in Model 1a are higher than Model 1b. The performance levels further confirm that Model 1a reaches Collapse Prevention, while Model 1b remains at Controlled Damage. A similar trend observed between Models 2a and 2b in terms of base shear, inter-story drifts, and damage levels is that near-fault conditions caused substantially more demand.
  • Comparing Model 1 and Model 2 shows the critical role of shear walls. Under near-fault conditions, the reduced stiffness owing to lack of shear walls (Model 2) experienced higher damage and larger displacements in both directions.
  • Models 1 and 2 produce similar drift results for far-fault conditions due to the limited plastic deformation demands.
  • A more realistic estimation of design spectra could potentially be achieved if specific phenomena such as forward directivity, super-shear rupture, and basin effects are more thoroughly incorporated into probabilistic procedures. In this context, further advancements in ground motion prediction models and the development of techniques that better capture near-fault effects may be beneficial, suggesting that additional research in this direction would be valuable.
  • Analysis results highlighted that structures with higher energy dissipation capacity should be prioritized for design of buildings located near fault zones. Considering this aspect, practicing engineering could help foster measures that contribute to reducing the risks of life and property losses in future earthquakes.
It is worth noting that while the findings of this study provide meaningful conclusions for a case study building, more comprehensive results would require broader investigation. Due to the complex interaction of numerous structural and seismic parameters in damage and collapse mechanisms, additional case studies considering various structural systems and hysteresis models are essential for better understanding the effects of near-fault ground motions.

Author Contributions

Conceptualization, methodology, software, validation, formal analysis; M.Ö.; investigation, resources, data curation; M.A.K., writing—original draft preparation; M.A.K., writing—review and editing, visualization M.A.K., supervision, project administration; M.Ö. All authors have read and agreed to the published version of the manuscript.

Funding

This research received no external funding.

Conflicts of Interest

The authors declare no conflict of interest.

References

  1. Housner, G.W.; Trifunac, M.D. Analysis of accelerograms—Parkfield earthquake. Bull. Seismol. Soc. Am. 1967, 57, 1193–1220. [Google Scholar]
  2. Somerville, P.G. Magnitude scaling of the near fault rupture directivity pulse. Phys. Earth Planet. Interiors. 2003, 137, 201–210. [Google Scholar]
  3. Mukhopadhyay, S.; Gupta, V.K. Directivity pulses in near-fault ground motions—II: Estimation of pulse parameters. Soil Dyn. Earthq. Eng. 2013, 50, 38–52. [Google Scholar]
  4. Tang, Y.; Zhang, J. Response spectrum-oriented pulse identification and magnitude scaling of forward directivity pulses in near-fault ground motions. Soil Dyn. Earthq. Eng. 2011, 31, 59–76. [Google Scholar] [CrossRef]
  5. Bernard, P.; Herrero, A.; Berge, C. Modeling directivity of heterogeneous earthquake ruptures. Bull. Seismol. Soc. Am. 1996, 86, 1149–1160. [Google Scholar]
  6. Somerville, P.G.; Smith, N.F.; Graves, R.W.; Abrahamson, N.A. Modification of empirical strong ground motion attenuation relations to include the amplitude and duration effects of rupture directivity. Seismol. Res. Lett. 1997, 68, 199–222. [Google Scholar]
  7. Luo, Q.; Dai, F.; Jiang, R.; Xu, W.; Zhang, G. Quantitative evaluation of velocity pulse-like ground motions using spatial rotation technique. J. Seismol. 2024, 28, 209–227. [Google Scholar] [CrossRef]
  8. Xin, C.; Zeng, L.; Wang, Z.; Feng, W.; Yang, F.; Hajirasouliha, I.; Yu, X. Characterizing Dynamic Responses of Rock Slopes to Near-Fault Pulse-Like Ground Motions: C. Xin et al. Rock Mech. Rock Eng. 2025, 1–41. [Google Scholar] [CrossRef]
  9. Shaohui, L.; Lizhong, J.; Wangbao, Z.; Jian, Y.; Yulin, F.; Zhenbin, R. Influence of velocity pulse effect on earthquake-induced track irregularities of high-speed railway track–bridge system under near-fault ground motions. Arch. Civ. Mech. Eng. 2024, 24, 70. [Google Scholar]
  10. Mavroeidis, G.P.; Papageorgiou, A.S. A mathematical representation of near-fault ground motions. Bull. Seismol. Soc. Am. 2003, 93, 1099–1131. [Google Scholar] [CrossRef]
  11. He, W.; Agrawal, A.K. Analytical model of ground motion pulses for the design. J. Struct. Eng. 2008, 134, 1177–1188. [Google Scholar] [CrossRef]
  12. Baker, J.W. Quantitative classification of near-fault ground motions using wavelet analysis. Bull. Seismol. Soc. Am. 2007, 97, 1486–1501. [Google Scholar] [CrossRef]
  13. Huang, N.E.; Shen, Z.; Long, S.R.; Wu, M.C.; Shih, H.H.; Zheng, Q.; Yen, N.C.; Tung, C.C.; Liu, H.H. The empirical mode decomposition and the Hilbert spectrum for nonlinear and non-stationary time series analysis. Proc. R. Soc. A Math. Phys. Eng. Sci. 1998, 454, 903–995. [Google Scholar]
  14. Chen, X.; Wang, D.; Zhang, R. Identification of pulse periods in near-fault ground motions using the HHT method. Bull. Seismol. Soc. Am. 2019, 109, 2384–2398. [Google Scholar]
  15. Chang, Z.; Wu, H.; Goda, K. Automated parameterization of velocity pulses in near-fault ground motions. Earthq. Eng. Struct. Dyn. 2024, 53, 1006–1027. [Google Scholar]
  16. Hall, J.F.; Heaton, T.H.; Halling, M.W.; Wald, D.J. Near source ground motion and its effects on flexible buildings. Earthq. Spectra 1995, 11, 569–605. [Google Scholar] [CrossRef]
  17. Malhotra, P.K. Response of buildings to near-field pulse-like ground motions. Earthq. Eng. Struct. Dyn. 1999, 28, 1309–1326. [Google Scholar] [CrossRef]
  18. Zhang, S.; Wang, G. Effects of near-fault and far-fault ground motions on nonlinear dynamic response and seismic damage of concrete gravity dams. Soil Dyn. Earthq. Eng. 2013, 53, 217–229. [Google Scholar] [CrossRef]
  19. Jangid, R.S. Optimum friction pendulum system for near-fault motions. Eng. Struct. 2005, 27, 349–359. [Google Scholar] [CrossRef]
  20. Alavi, B.; Krawinkler, H. Effects of Near Fault Ground Motions on Frame Structures; Stanford University: Stanford, CA, USA, 2001. [Google Scholar]
  21. Anderson, J.C.; Bertero, V.V. Uncertainties in establishing design earthquakes. J. Struct. Eng. 1987, 113, 1709–1724. [Google Scholar] [CrossRef]
  22. Yaray, B. Sismik yalıtımlı binaların yakın fay etkisi altında davranışı. Yüksek Lisans Tezi, Sivas Cumhuriyet Üniversitesi Fen Bilimleri Enstitüsü, Sivas, Türkiye, 2019. [Google Scholar]
  23. Mazza, F.; Vulcano, A. Nonlinear dynamic response of R.C. framed structures subjected to near-fault ground motions. Bull. Earthq. Eng. 2010, 8, 1331–1350. [Google Scholar] [CrossRef]
  24. Ventura, C.E.; Kharrazi, M.H.K.; Ventura, C.E.; Finn, W.D.L. Large coseismic displacements and tall buildings. Struct. Des. Tall Spec. Build. 2011, 20, 85–99. [Google Scholar] [CrossRef]
  25. Hamidi, H.; Karbassi, A.; Lestuzzi, P. Seismic response of RC buildings subjected to fling—Step in the near—Fault region. Struct. Concr. 2020, 21, 1919–1937. [Google Scholar] [CrossRef]
  26. Daei, A.; Poursha, M. On the accuracy of enhanced pushover procedures for seismic performance evaluation of code-conforming RC moment-resisting frame buildings subjected to pulse-like and non-pulse-like excitations. Structures 2021, 32, 929–945. [Google Scholar] [CrossRef]
  27. Zhai, C.; Chang, Z.; Li, S.; Chen, Z.; Xie, L. Quantitative identification of near—Fault pulse—Like ground motions based on energy. Bull. Seismol. Soc. Am. 2013, 103, 2591–2603. [Google Scholar] [CrossRef]
  28. Sehhati, R.; Adrian, R.M.; ElGawady, M. Effects of near-fault ground motions and equivalent pulses on multi-story structures. Eng. Structures. 2011, 33, 767–779. [Google Scholar] [CrossRef]
  29. Champion, C.; Liel, A. The effect of near-fault directivity on building seismic collapse risk. Earthq. Eng. Struct. Dyn. 2012, 41, 1391–1409. [Google Scholar] [CrossRef]
  30. Papazoglou, A.J.; Elnashai, A.S. Analytical and field evidence of the damaging effect of vertical earthquake ground motion. Earthq. Eng. Struct. Dyn. 1996, 25, 1109–1137. [Google Scholar] [CrossRef]
  31. Elnashai, A.S.; Di Sarno, L. Fundamentals of Earthquake Engineering: From Source to Fragility, 2nd ed.; John Wiley and Sons, Ltd.: West Sussex, UK, 2015. [Google Scholar]
  32. Mwafy, A.; Elnashai, A.S. Vulnerability of code-compliant RC buildings under multi-axial earthquake loading. In Proceedings of the 4th International Conference on Earthquake Engineering, Taipei, Taiwan, 12–13 October 2006. [Google Scholar]
  33. Kim, S.; Kim, S.J.; Chang, C. Analytical assessment of the effect of vertical ground motion on RC frames designed for gravity loads with various geometric configurations. J. Adv. Civ. Eng. 2018, 2018, 4029142. [Google Scholar] [CrossRef]
  34. Abrahamson, N.A. Effects of rupture directivity on probabilistic seismic hazard analysis. In Proceedings of the 6th International Conference on Seismic Zonation, Palm Springs, CA, USA, 12–15 November 2000; Volume 1, pp. 151–156. [Google Scholar]
  35. Tothong, P.; Luco, N. Probabilistic seismic demand analysis using advanced ground motion intensity measures. Earthq. Eng. Struct. Dyn. 2007, 36, 1837–1860. [Google Scholar] [CrossRef]
  36. Campbell, K.W.; Bozorgnia, Y. NGA-West2 ground motion model for the average horizontal components of PGA, PGV, and 5% damped linear acceleration response spectra. Earthq. Spectra 2014, 30, 1087–1115. [Google Scholar] [CrossRef]
  37. Baltzopoulos, G.; Baraschino, R.; Chioccarelli, E.; Cito, P.; Vitale, A.; Iervolino, I. Near-source ground motion in the M7.8 Gaziantep (Turkey) earthquake. Earthq. Eng. Struct. Dyn. 2023, 52, 3903–3912. [Google Scholar] [CrossRef]
  38. Chen, G. Report on Pulse-Like Ground Motions in the Feb 2023 Turkey Earthquakes; Institute for Risk and Reliability Leibniz University: Hannover, Germany, 2023. [Google Scholar]
  39. Güneş, N. Effects of near-fault pulse-like ground motions on seismically isolated buildings. J. Build. Eng. 2022, 52, 104508. [Google Scholar] [CrossRef]
  40. Quaranta, G.; Mollaioli, F. Analysis of near-fault pulse-like seismic signals through Variational Mode Decomposition technique. Eng. Struct. 2019, 193, 121–135. [Google Scholar] [CrossRef]
  41. Alonso-Rodríguez, A.; Miranda, E. Assessment of building behavior under near-fault pulse-like ground motions through simplified models. Soil Dyn. Earthq. Eng. 2015, 79, 47–58. [Google Scholar] [CrossRef]
  42. Işık, E.; Hadzima-Nyarko, M.; Avcil, F.; Büyüksaraç, A.; Arkan, E.; Alkan, H.; Harirchian, E. Comparison of seismic and structural parameters of settlements in the east Anatolian fault zone in light of the 6 February Kahramanmaraş earthquakes. Infrastructures 2024, 9, 219. [Google Scholar] [CrossRef]
  43. Wang, B.; Karavasilis, T.L.; Chen, P.; Dai, K. Seismic modeling and performance evaluation of seismically isolated building considering large strain effects under near-fault earthquakes. J. Build. Eng. 2024, 90, 109339. [Google Scholar] [CrossRef]
  44. Chen, X.; Zhou, B.; Liu, X.; Lu, J. An Investigation into the Effect of Near-Fault Ground Motion Duration Parameters on the Nonlinear Seismic Response of Intake Towers. Buildings 2024, 14, 580. [Google Scholar] [CrossRef]
  45. Li, S.; Gao, Y.; Jin, H. Upper crustal deformation characteristics in the northeastern Tibetan Plateau and its adjacent areas revealed by GNSS and anisotropy data. Earthq. Sci. 2023, 36, 297–308. [Google Scholar] [CrossRef]
  46. Duan, Y.; Bo, J.; Peng, D.; Li, Q.; Wan, W.; Qi, W. Analysis of Peak Ground Acceleration and Seismogenic Fault Characteristics of the Mw7.8 Earthquake in Turkey. Appl. Sci. 2023, 13, 10896. [Google Scholar] [CrossRef]
  47. Ivanov, M.L.; Chow, W.K. Structural damage observed in reinforced concrete buildings in Adiyaman during the 2023 Türkiye Kahramanmaraş earthquakes. Structures 2023, 58, 105578. [Google Scholar] [CrossRef]
  48. Kazaz, İ.; Avşar, Ö.; Dilsiz, A. Importance of building inspection on the seismic response of a severely damaged RC structure during the February 6, 2023 Kahramanmaraş earthquake sequence. Eng. Fail. Anal. 2024, 162, 108410. [Google Scholar] [CrossRef]
  49. Öztürk, S.; Altunsu, E.; Güneş, O.; Sarı, A. Investigation of industrial structure performances in the Hatay and Gaziantep provinces during the Türkiye earthquakes on 6 February 2023. Soil Dyn. Earthq. Eng. 2024, 179, 108569. [Google Scholar] [CrossRef]
  50. Altfunsu, E.; Güneş, O.; Öztürk, S.; Sorosh, S.; Sarı, A.; Beeson, S.T. Investigating the structural damage in Hatay province after Kahramanmaraş-Türkiye earthquake sequences. Eng. Fail. Anal. 2024, 157, 107857. [Google Scholar] [CrossRef]
  51. Yaghmaei-Sabegh, S.; Neekmanesh, S.; Ruiz-García, J. Evaluation of vertical-to-horizontal spectral acceleration ratio for the 2023 Turkey–Syria seismic sequences. Soil Dyn. Earthq. Eng. 2024, 182, 108747. [Google Scholar]
  52. Turkish Earthquake Code, TEC-2007. In Specifications for Buildings to be Built in Seismic Areas; Ministry of Public Works and Settlement: Ankara, Turkey, 1998.
  53. Republic of Turkey Ministry of Environment and Urbanization. Turkish Building Earthquake Code (TBEC-2018); Republic of Turkey Ministry of Environment and Urbanization: Ankara, Turkey, 2018. [Google Scholar]
  54. Mander, J.B.; Priestley, M.J.N.; Park, R. Theoretical Stress-Strain Model for Confined Concrete. J. Struct. Eng. 1998, 114, 1804–1826. [Google Scholar] [CrossRef]
  55. Disaster and Emergency Management Authority (AFAD). Earthquake Database—Event Detail; Ministry of Interior: Ankara, Turkey, 2007. [Google Scholar]
  56. Sakarya, A.; Akın, O.; Kılıç, A. Investigating the damage from the February 6, 2023 earthquakes in terms of building characteristics in the Antakya and Defne districts of Hatay province. Int. J. Disaster Risk Reduct. 2024, 112, 104783. [Google Scholar] [CrossRef]
  57. Senel, S.M.; Kayhan, A.H.; Palanci, M.; Demir, A. Assessment of Damages in Precast Industrial Buildings in the Aftermath of Pazarcık and Elbistan Earthquakes. J. Earthq. Eng. 2024, 1–30. [Google Scholar] [CrossRef]
  58. Ertuncay, D.; Costa, G. Analysis of impulsive ground motions from February 2023 Kahramanmaraş earthquake sequence. Bull. Earthq. Eng. 2025, 23, 965–999. [Google Scholar] [CrossRef]
  59. Ucar, T.; Merter, O. Ductility demands for stiffness—Degrading SDOF systems under pulse—Like ground motions of the 2023 Pazarcık (Kahramanmaraş) earthquake. Bull. Earthq. Eng. 2024, 90, 3243–3260. [Google Scholar] [CrossRef]
  60. Wu, F.; Xie, J.; An, Z.; Lyu, C.; Taymaz, T.; Irmak, T.S.; Li, X.; Wen, Z.; Zhou, B. Pulse-like ground motion observed during the 6 February 2023 MW7.8 Pazarcık Earthquake (Kahramanmaraş, SE Türkiye). Earthq. Sci. 2023, 36, 328–339. [Google Scholar] [CrossRef]
  61. Hu, J.; Liu, M.; Taymaz, T.; Ding, L.; Irmak, T.S. Characteristics of strong ground motion from the 2023 Mw 7.8 and Mw 7.6 Kahramanmaraş earthquake sequence. Bull. Earthq. Eng. 2025, 23, 1225–1254. [Google Scholar] [CrossRef]
  62. Abdelmeguid, M.; Zhao, C.; Yalcinkaya, E.; Gazetas, G.; Elbanna, A.; Rosakis, A. Dynamics of episodic supershear in the 2023 M7.8 Kahramanmaraş/Pazarcık earthquake, revealed by near-field records and computational modeling. Commun. Earth Env. 2023, 4, 456. [Google Scholar] [CrossRef]
  63. Karray, M.; Karakan, E.; Kincal, C.; Chiaradonna, A.; Gül, T.O.; Lanzo, G.; Monaco, P.; Sezer, A. Türkiye Mw 7.7 Pazarcık and Mw 7.6 Elbistan earthquakes of 6 February 2023: Contribution of valley effects on damage pattern. Soil Dyn. Earthq. Eng. 2024, 181, 108634. [Google Scholar] [CrossRef]
  64. Gani, E.; Öztürk, S.; Sarı, A. Examination of the severe impact of the 6 February 2023 earthquakes on Antakya district considering pulse-like ground motions, supershear rupture, and basin effects. Soil Dyn. Earthq. Eng. 2025, 198, 109608. [Google Scholar] [CrossRef]
  65. Palanci, M.; Demir, A.; Kayhan, A.H. The Investigation of Displacement Demands of Single Degree of Freedom Models Using Real Earthquake Records Compatible with TBEC-2018. Pamukkale Univ. J. Eng. Sci. 2021, 27, 251–263. [Google Scholar] [CrossRef]
  66. Demir, A.; Kayhan, A.H.; Palanci, M. Response- and Probability-Based Evaluation of Spectrally Matched Ground Motion Selection Strategies for Bi-Directional Dynamic Analysis of Low- to Mid-Rise RC Buildings. Structures 2023, 58, 105533. [Google Scholar] [CrossRef]
  67. Asgarkhani, N.; Kazemi, F.; Jankowski, R. Machine-Learning Based Tool for Seismic Response Assessment of Steel Structures In-cluding Masonry Infill Walls and Soil-Foundation-Structure Interaction. Comput. Struct. 2025, 317, 107918. [Google Scholar] [CrossRef]
  68. Demir, A.; Palanci, M.; Kayhan, A.H. Evaluation the Effect of Amplitude Scaling of Real Ground Motions on Seismic Demands Accounting Different Structural Characteristics and Soil Classes. Bull. Earthq. Eng. 2024, 22, 365–393. [Google Scholar] [CrossRef]
  69. Karakas, C.C.; Palanci, M.; Senel, S.M. Fragility based evaluation of different code based assessment approaches for the performance estimation of existing buildings. Bull. Earthq. Eng. 2022, 20, 1685–1716. [Google Scholar] [CrossRef]
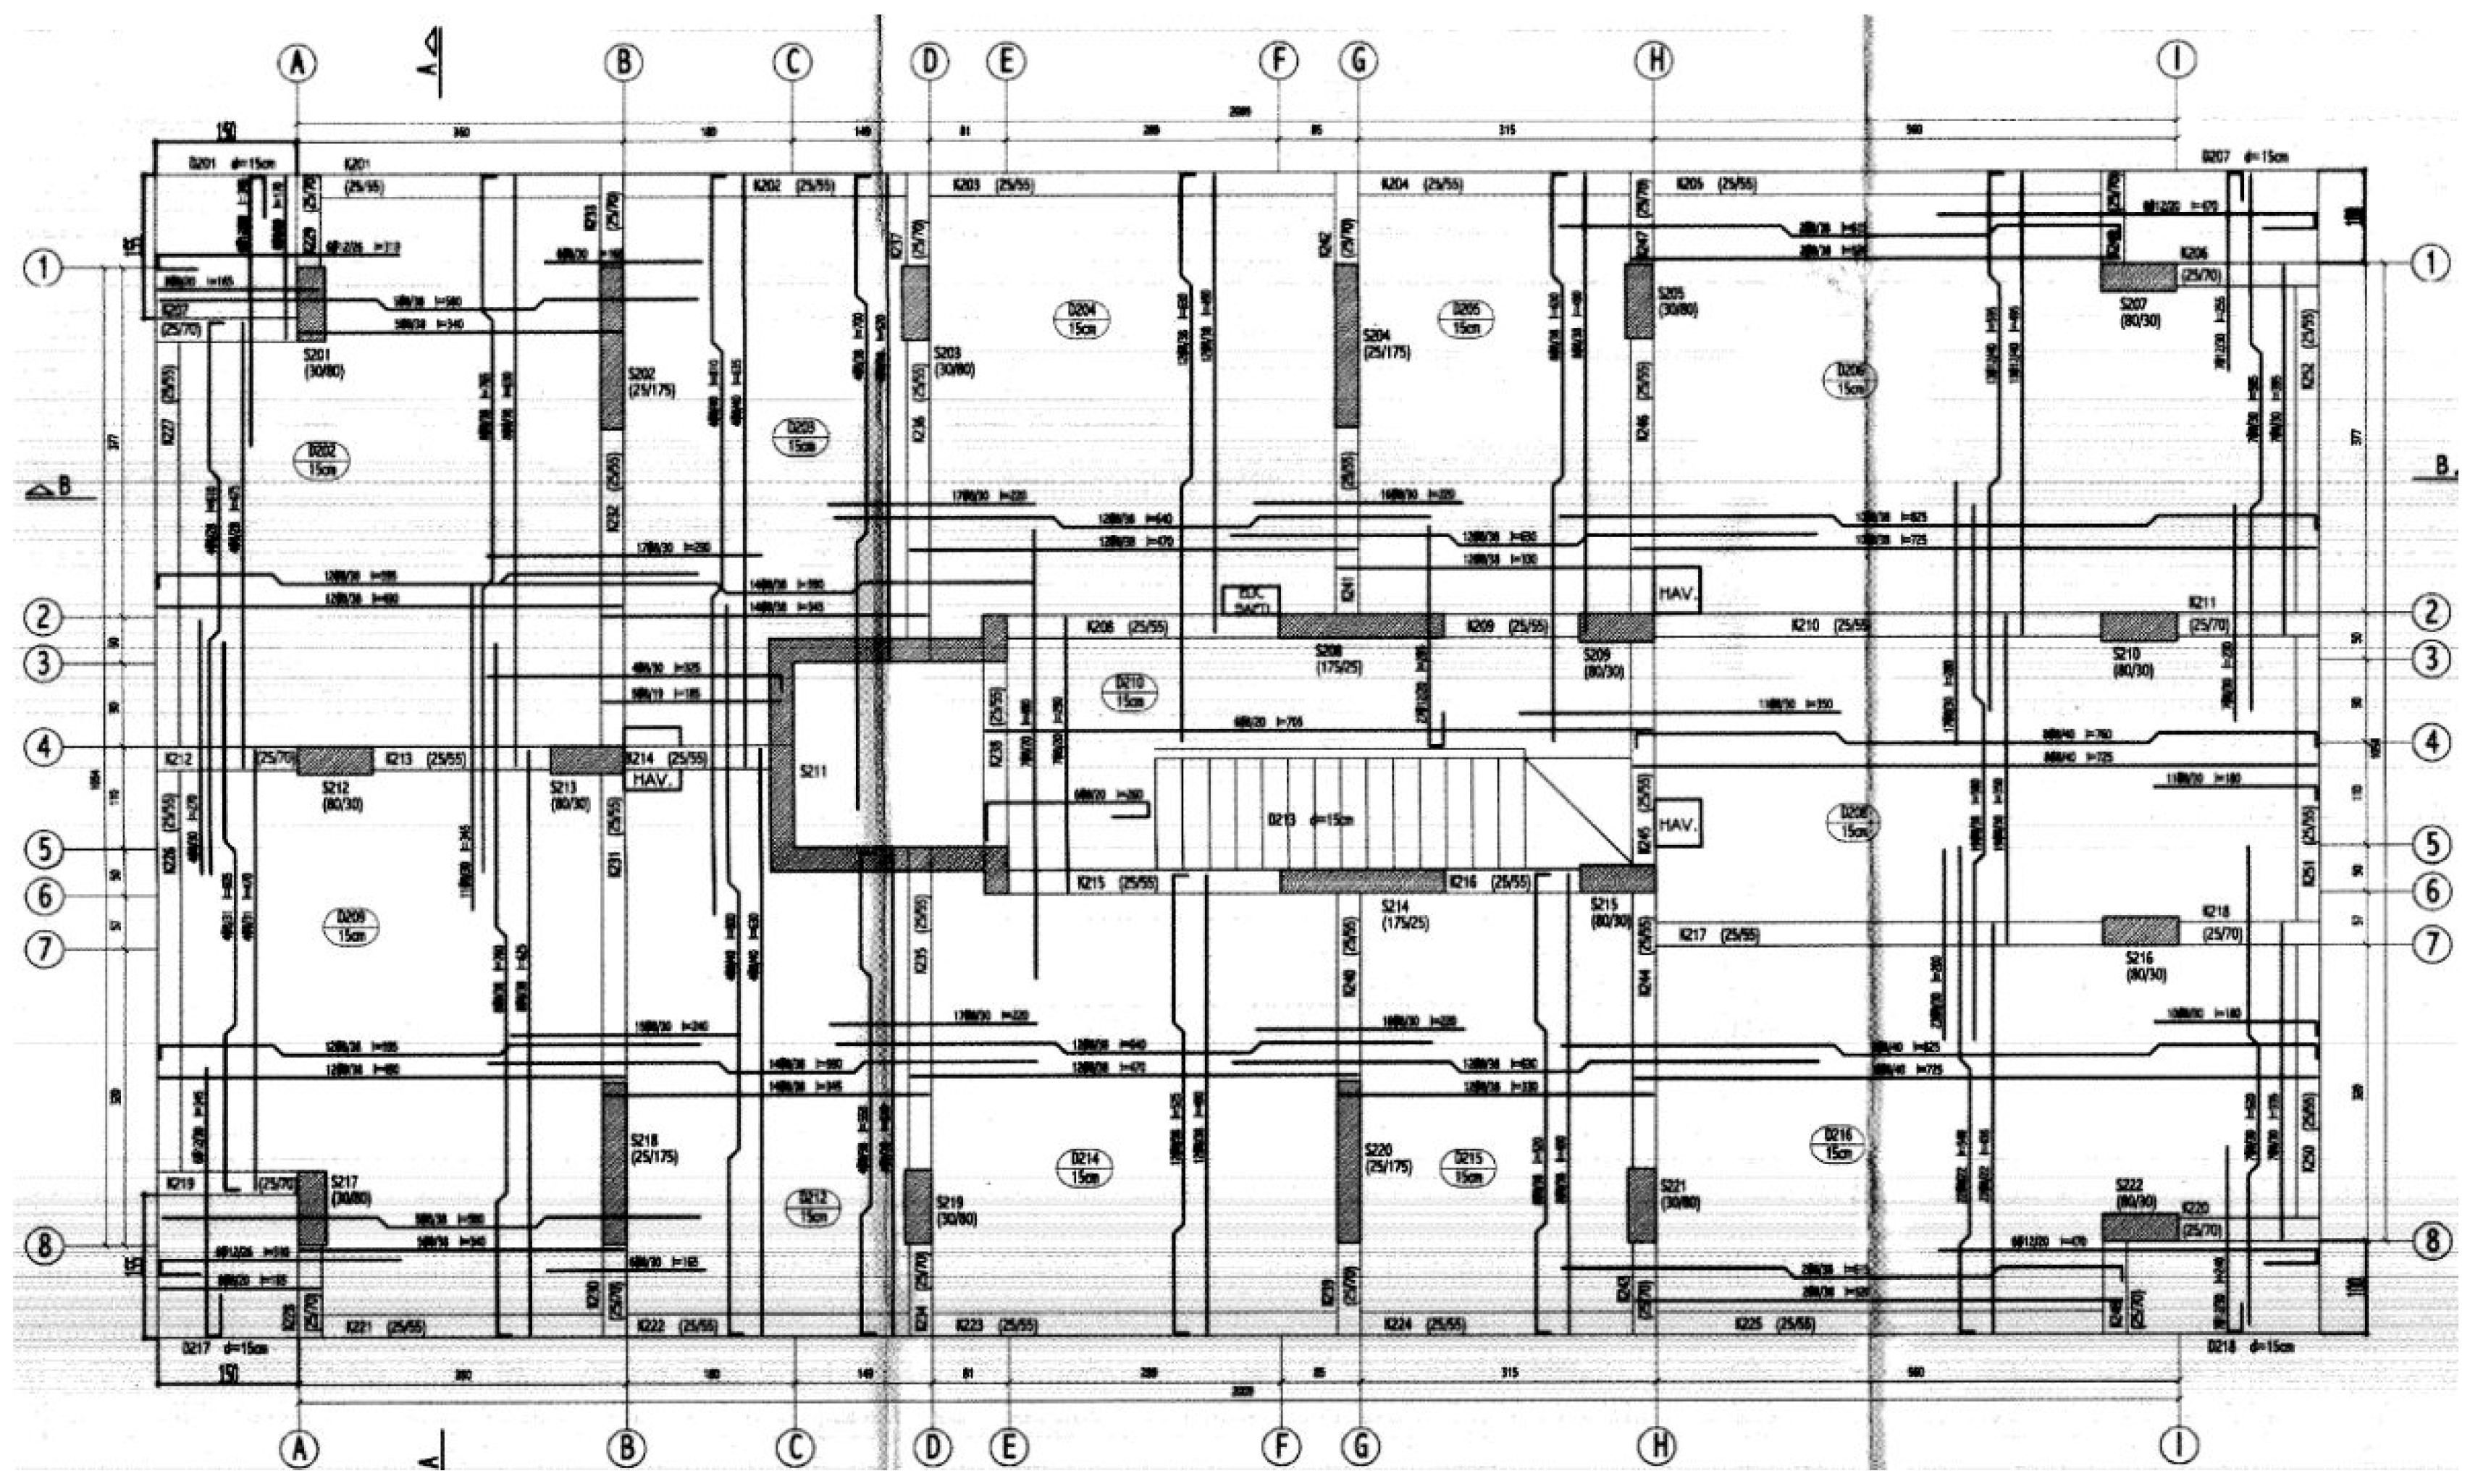
Figure 1. Framework plan of the building.
Applsci 15 10142 g001
Figure 2. Performed 3D models and removed shear walls: (a) original (existing) structural system; (b) shear walls replaced by columns in Model 2; (c) structural system of Model 2.
Applsci 15 10142 g002
Figure 3. Typical representation of fiber section and plastic hinges approaches.
Applsci 15 10142 g003
Figure 4. Acceleration–time histories records of station no. 3124 and no. 3115 rotated by 31°: (a) Station 3124, East–West Component; (b) Station 3124, North–South Component; (c) Station 3124, Vertical Component; (d) Station 3115, East–West Component; (e) Station 3115, East–West Component; (f) Station 3115, North–South Component.
Applsci 15 10142 g004aApplsci 15 10142 g004b
Figure 5. Mode shapes of the models: (a) Model 1—1st Mode Shape; (b) Model 1—2nd Mode Shape; (c) Model 1—3rd Mode Shape; (d) Model 2—1st Mode Shape; (e) Model 2—2nd Mode Shape; (f) Model 2—3rd Mode Shape.
Applsci 15 10142 g005
Figure 6. Points 1 and 2 used for the drift check.
Applsci 15 10142 g006
Figure 7. Inter-story drifts for Model 1: (a) Model1a, X Direction-Point1; (b) Model1a, Y Direction-Point1; (c) Model1a, X Direction-Point2; (d) Model1a, Y Direction-Point2; (e) Model1b, X Direction-Point1; (f) Model1b, Y Direction-Point1; (g) Model1b, X Direction-Point2; (h) Model1b, Y Direction-Point2.
Applsci 15 10142 g007
Figure 8. Inter-story drifts for Model 2: (a) Model2a, X Direction-Point1; (b) Model2a, Y Direction-Point1; (c) Model2a, X Direction-Point2; (d) Model2a, Y Direction-Point2; (e) Model2b, X Direction-Point1; (f) Model2b, Y Direction-Point1; (g) Model2b, X Direction-Point2; (h) Model2b, Y Direction-Point2.
Applsci 15 10142 g008aApplsci 15 10142 g008b
Figure 9. Distribution of damage states in structural elements: (a) Model1a—Near Fault; (b) Model1b—Far Fault; (c) Model2a—Near Fault; (d) Model2b—Far Fault.
Applsci 15 10142 g009
Figure 10. Damage observed in the building.
Applsci 15 10142 g010
Figure 11. Comparison of acceleration spectra: (a) far- and near-field records; (b) near-field, building design and TBEC-2018 spectra).
Applsci 15 10142 g011
Table 1. Structural models and analyses.
Numerical ModelEarthquake DataStructural System
Model 1aNear-Fault StationOriginal
Model 1bFar-Fault StationOriginal
Model 2aNear-Fault StationReduced Shear Wall
Model 2bFar-Fault StationReduced Shear Wall
Table 2. Strain parameters of reinforcements according to TBEC-2018 [53].
SteelYield Strength
fsy (MPa)
Yield Strain
εsy
Hardening Strain
εsh
Ultimate Tensile Strain
εsu
Ultimate-to-Yield Strength Ratio
fsu/fsy
S4204200.00210.0080.081.15–1.35
Table 3. Natural periods and modal mass participation ratios.
Model 1Model 2
Periods (s)Mass Participation (x)Mass Participation (y)Periods (s)Mass Participation (x)Mass Participation
(y)
Mode 12.6430.0005560.21773.3330.00041020.2396
Mode 21.4420.6160.0004411.5650.6170.000399
Mode 30.9610.0000640.3881.0630.00007020.367
Table 4. Base shear forces x and y direction.
ModelBase Shear (kN)
XY
Model1a5989.79496677.8931
Model1b2263.6563073.7849
Model2a4609.60554149.8857
Model2b1873.60732305.2654
Table 5. Performance levels of the models based on analysis results.
Numerical ModelTBC—2018 Seismic Performance Level
Model1aCollapse Prevention (CP)
Model1bControlled Damage (CD)
Model2aCollapse Prevention (CP)
Model2bControlled Damage (CD)
Disclaimer/Publisher’s Note: The statements, opinions and data contained in all publications are solely those of the individual author(s) and contributor(s) and not of MDPI and/or the editor(s). MDPI and/or the editor(s) disclaim responsibility for any injury to people or property resulting from any ideas, methods, instructions or products referred to in the content.