Featured Application
The proposed method of optimizing blank forms by solving inverse mathematical tasks has the potential to be directly applied to the aerospace, shipbuilding, and automotive industries in order to manufacture complex aerodynamic aluminum sheet metal components with high accuracy. The employment of iterative virtual simulations in this method is instrumental in minimizing material wastage, reducing production costs, and eliminating the necessity for trial-and-error processes in physical forming. The technology has been demonstrated to be especially useful for the hydro-elastic forming of aluminum alloys. This is due to the fact that it ensures minimal deviation from the digital model while maintaining structural integrity. It has been demonstrated that this methodology can be applied to other precision manufacturing industries that require minimal tolerance sheet metal forming.
Abstract
The present article provides an abstract overview of the issue of optimal blank searching for integral parts utilized in complex engineering projects, including those pertaining to the fabrication of machine, ship, and aircraft components. The manufacturing process for these components is intricate and necessitates meticulous precision and strict adherence to the design model. Conventional blank calculation techniques are marred by substantial inaccuracies. The present research proposes and verifies an effective method based on the reverse solution of a mathematical problem. The focal point of this study is the aerodynamic curvature of aluminum alloys belonging to the Al–Mg–Mn family. The formation of the object is achieved through the employment of a hydroelastomer press of the QFC (Quintus Technologies) type. The forming process is simulated using PAM-STAMP software, developed by the French company ESI Group. The objective of the present study is to ascertain the optimal configuration of the blank by optimizing the discrepancy between the dynamic calculations and the design model using sweep contours. The resulting new shape of the part allows for the formation of parts with minimal deviation from their design contours.
1. Introduction
The fabrication of complex–curved sheet metal components with micron-level precision remains a critical challenge in the aerospace and automotive industries. As aerodynamic efficiency demands intensify, there is an increased need for lightweight, high-strength parts with exact geometrical tolerances [1,2]. Industry reports indicate that the development of imperfect blanks accounts for up to 30% of airframe production costs due to rework and material wastage [3], emphasizing the necessity for advanced sweep calculation methodologies.
Conventional blank development methodologies are inherently limited by fundamental deficiencies.
- 1.
- Geometric Methods:
- Rely exclusively on surface area conservation principles [4,5];
- Disregard material deformation behavior, inducing >10% dimensional errors;
- Fail for variable curvature geometries with complex transitions.
- 2.
- Simplified Inverse Methods:
- Incorporate basic material properties but ignore strain history [6];
- Neglect contact physics, causing 3–5 mm aerospace deviations [7,8]
- Inadequate for Al–Mg–Mn alloys’ nonlinear multiaxial stress response.
- 3.
- Systemic Deficiencies:
- Limited applicability to integral forms with aerodynamic contours;
- Inability to model springback effects (≤15% final deviation [9,10]);
- Material agnostic assumptions violating aerospace specifications.
The advent of computational innovations has precipitated a paradigm shift in the domain of forming optimization.
- 1.
- AI/ML-Driven Design:
- Multilayer perceptrons have been employed to achieve a high degree of accuracy (in excess of 95%) in the prediction of forming parameters [11];
- One-dimensional CNNs for real-time stamping monitoring (<0.18 s/cycle) [12,13];
- Physics-informed neural networks (PINNs) embedding milling physics [14,15].
- 2.
- Generative and Surrogate Models:
- Diffusion models for compositional system design [16,17];
- PcDGAN networks improving aerodynamic profile performance by 69% [18];
- ML-based surrogates reducing computational costs by 104 [19,20].
- 3.
- Multi-Objective Optimization:
- Hybrid particle swarm algorithms for low-carbon manufacturing [21];
- Evolutionary strategies minimizing sheet thinning [22];
- ANN-based precision prediction for incremental forming [23].
- 4.
- Industry 4.0 Integration:
- Digital twins enabling real-time process monitoring [24];
- Automated design platforms for manufacturable sheet components [25];
- IoT-enhanced CPS for energy-efficient production [24].
It is evident that prominent manufacturing periodicals have been instrumental in propelling pivotal advancements in inverse blank design methodologies.
- 1.
- Journal of Manufacturing Processes (JMPT):
- Published 4731+ articles establishing foundational knowledge in AI-driven forming optimization [26];
- IF: 1.993 (2022) with Q1 ranking in Industrial Engineering [27];
- Key contributions: Sustainable forming practices integrating low-carbon constraints [21]; Neural network applications for real-time defect prediction [12,13];
- Current focus: Digital twin integration for energy-efficient production [24,27].
- 2.
- International Journal of Advanced Manufacturing Technology (IJAMT):
- IF: 3.72 (2024) with h-index 175 [28];
- Seminal works in multi-objective blank optimization using hybrid PSO algorithms [21] and surrogate modeling for high-strength steel forming (4× computational efficiency [19,20]);
- Emerging trends: Federated learning for distributed manufacturing optimization [29]; IoT-enabled cyber-physical systems for real-time quality control [28].
- 3.
- CIRP Annals:
- Q2-ranked in Manufacturing Engineering [30];
- A total of 120–140 peer-reviewed papers biennially advancing [31] physics-informed neural networks (PINNs) for milling optimization [15] and composable generative inverse design frameworks [16,17];
- Editorial emphasis: Industrial robotics automation in forming processes [32];
- Sustainability-driven design for aerospace components [33].
These publications demonstrate intensified convergence towards the hybridization of AI and physics (e.g., 98% prediction accuracy of the PHOENIX platform [32]), and resource-efficient optimization (e.g., 69% performance gains via PcDGAN [18]). However, the extant literature predominantly addresses conventional stamping, thereby leaving unexplored the field of hydro-elastoforming of Al–Mg–Mn alloys.
Despite advancements, critical limitations persist in blank optimization for hydro-elastoformed aerospace components.
- 1.
- Incomplete Deformation Physics:
- Simplified inverse methods disregard full strain history and contact conditions, causing 3–5 mm deviations [6];
- Temperature-dependent springback effects (≤15% part deviation [9]) remain unquantified for Al–Mg–Mn alloys.
- 2.
- Geometric Constraints:
- Traditional approaches fail for integral forms with variable curvature and no flat sections;
- Mesh sensitivity issues plague complex features (aspect ratios > 5:1), requiring manual refinement.
- 3.
- Methodological Deficiencies:
- Absence of closed-loop frameworks integrating CAE simulation with industrial validation;
- No automated solutions for blank contour correction during iterative optimization.
- 4.
- Material and Process Limitations:
- Approaches untested for hydro-elastoforming of Al–Mg–Mn alloys under 100 MPa pressure [34,35,36,37,38,39,40,41];
- Unvalidated for deformation beyond 10% strain;
- Lack of scalability to Ti-6Al-4V or composites.
This work bridges extant gaps through five innovations.
- 1.
- First Industrial-Validated Framework:
- Closed-loop optimization integrating PAM-STAMP simulations with Quintus QFC press validation [34,35,36,37,38,39,40,41];
- Full experimental implementation on aerospace-grade Al–Mg–Mn alloys.
- 2.
- Comprehensive Physics Modeling:
- Incorporates nonlinear material behavior under multiaxial stress;
- Accounts for complete strain history and contact physics;
- Quantifies temperature-dependent springback [9].
- 3.
- Adaptive Optimization Algorithm:
- Gradient-based contour correction via OPTIMIZER solver;
- Automated mesh refinement during iterations;
- Stopping criterion: <0.11 mm deviation and >90% contour match.
- 4.
- Unprecedented Efficiency:
- A 50× accuracy improvement over conventional methods (0.103 mm vs. 5.219 mm);
- A 40–60% reduction in development time vs. trial and error [3];
- Material savings ≤25% through precise blank geometry.
- 5.
- Cross-Industry Scalability:
- Methodology validated for aerospace aerofoils (Figure 1a,b), automotive panels, and wind turbine blades.
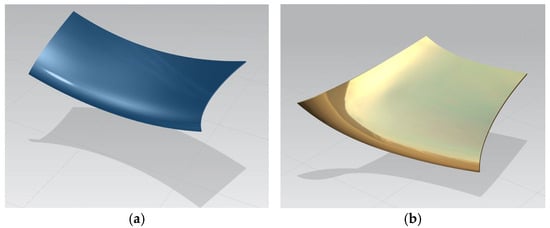 Figure 1. Hydro-elastoformed aerospace components modeled in study (material: 1.5 mm Al–Mg–Mn alloy): (a) Detail #1 with overall dimensions 268 × 116 × 54 mm; (b) Detail #2 with overall dimensions 124 × 147 × 50 mm.
- 6.
- Digital workflow compatible with Industry 4.0 systems.
The paper’s structure is as follows: As delineated in Section 2, the materials and experimental methodology are specified. In Section 3, an optimization algorithm is presented, along with the results of a simulation. The subsequent section, Section 4, delves into the industrial applications and the validation thereof. The subsequent section, Section 5, delineates the prospective avenues for future research and offers a conclusion.
Figure 1 presents the details of the aerodynamic curvatures that were considered for the modeling task, with a thickness of 1.5 mm. The components in question are composed of aluminum alloy, specifically the Al–Mg–Mn group, which is renowned for its application in aircraft structures due to its exceptional performance characteristics. The material under discussion is formed by hydro-elastic forming on a QFC-type press from Quintus Technologies, with a maximum pressure of 100 MPa. It has been demonstrated that this material can be used to produce more accurate and cheaper aircraft parts.
While prior computational innovations demonstrate progress in forming optimization, their inapplicability to hydro-elastoforming of Al–Mg–Mn alloys represents a critical research gap. To address these limitations, a closed-loop framework, integrating PAM-STAMP simulations with industrial validation, was developed. The subsequent section delineates the experimental methodology, material parameters, and adaptive optimization algorithm underpinning this approach.
2. Materials and Methods
The program complex PAM-STAMP of the French company ESI Group is used for technological modeling (the license of the Irkutsk National Research Technical University under the state contract # 159-NRU/EA–10 of 20 December 2010). The model for the blank material has the following parameters:
- Young modulus is 72 GPa;
- Poisson ratio is 0.32;
- Density is 2.6 kg/mm3;
- Anisotropy factors r0, r45, r90 are 0.5345, 0.8346, 0.5191 [35];
- The plastic part of the current curve is given by the function of Krupkowsky hardening law:where K is a material constant, n is a strain-hardening exponent, ϵp is plastic strain, and ϵ0 is offset strain. The constants of the function for the material are as follows: K = 0.65204 GPa, n = 0.2949, and ϵ0 = 0.0045 [41].σ = K ∗ (ϵ0 + ϵp)n,
The primary challenge associated with this particular detail, particularly in scenarios where detail formation is facilitated by an elastic medium, pertains to the calculation of sweep. The absence of a flat part on the details exacerbates this problem. At this stage, the error can result in a shortage of metal in some places within the contour, which can lead to defects. Conventionally, two methodologies are employed in the calculation of sweeps:
- Geometric based on the law of constancy of areas;
- Simplified method of inverse approach. It is evident that the strain and contact history are considered exclusively in the initial and final positions of the detail, while intermediate states are omitted. This approach considers the properties of the material but does not leverage the full history of strain and contacts that introduce additional errors.
The numerical simulations employed shell elements with a through thickness stress (T.T.S.) option to accurately capture thickness variations and stress distributions during hydro-elastoforming [33]. This formulation accounts for three-dimensional stress states across the sheet thickness, which is critical for predicting thinning and springback in aerospace components [42].
- 1.
- Mesh configuration. Quadrilateral shell elements (S4R) are characterized by seven integration points that extend through the thickness of the element [43].
- 2.
- Element count. The initial quantity of elements was 38,500. After refinement, this number increased to 52,000 in critical zones. The second detail indicates that the initial 28,200 elements were refined to 39,100 elements.
- 3.
- Refinement strategy: Adaptive h-refinement based on a posteriori error estimation [44]. Key criteria are as follows:
- Zienkiewicz-Zhu error estimator for stress recovery [45].
- Dörfler marking (θ = 0.7) prioritizing elements with >30% plastic strain [46].
- Geometric constraints: Transition ratio ≤ 2:1; minimum element angle > 15° [47].
The process of mesh adaptation was initiated when the thickness strain exceeded 5% or the stress error norms surpassed 0.1 GPa. Convergence was achieved within 4–6 refinement cycles, reducing relative energy error to below 0.5% [48].
To date, the simplified method of the inverse approach is recognized as the most accurate. This method entails the calculation of sweeps for the designated details, incorporating the consideration of pin holes (Figure 2).
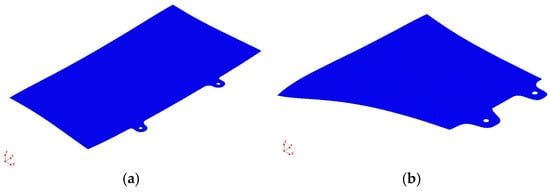
Figure 2.
Initial blank sweeps calculated via simplified inverse approach (pin holes included for tooling alignment): (a) sweep geometry for Detail #1; (b) sweep geometry for Detail #2.
Subsequently, the obtained sweeps are verified through the implementation of a dynamic calculation of the formation. The formation under consideration comprises two transitions:
- The initial transition is characterized by the formation of the aerodynamic curvature in conjunction with the roll machine;
- The second transition is the formation of the detail by the elastic medium, which is used to calculate the final form of the detail [49].
After establishing the computational workflow and validation protocol, the methodology was applied to two aerospace-grade Al–Mg–Mn components. The findings quantify contour accuracy, iterative convergence, and material savings, thereby demonstrating a 50-fold improvement over conventional methods.
3. Results
The modeling process of the initial transition yielded the results depicted in Figure 3.
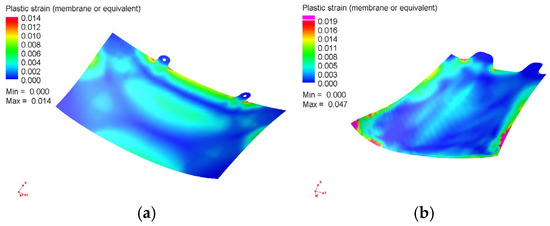
Figure 3.
Strain distribution after first forming transition (roll machining): (a) maximum strain 1.4% for Detail #1; (b) maximum strain 1.9% for Detail #2.
The results demonstrate that the detail has small strain (no more than 5%) after the first transition. The modeling of the formation of the second transition allows us to obtain the final form of the detail. Figure 4 and Figure 5 show the distribution of the thickness and the strain [11] after the second transition. The calculation results show that the details have a large elastic response after the formation due to the small strain [1] (Figure 6).
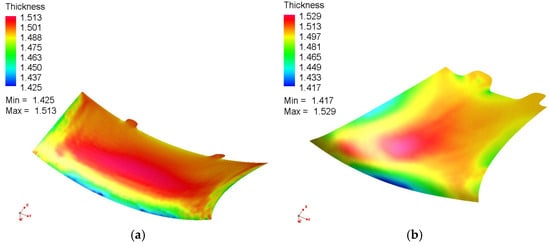
Figure 4.
Detail #1 showing minimum thickness 1.425 mm (scale: 1.4–1.5 mm.): (a) in Detail #1, the minimum thickness (blue color) is 1.425 mm; (b) in Detail #2, the minimum thickness is 1.417 mm (blue regions).
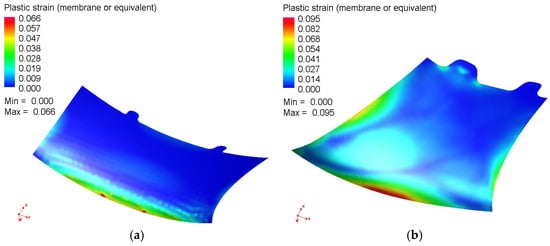
Figure 5.
Equivalent plastic strain after final forming (critical zones marked in red): (a) Detail #1 with peak strain 6.6%; (b) Detail #2 with peak strain 9.5%.

Figure 6.
Springback displacement magnitude post forming: (a) Detail #1 with maximum rebound 9.421 mm; (b) Detail #2 with maximum rebound 11.638 mm.
The superimposition of the detail contour from the digital model and the form derived from the sweep in the CAE (computer-aided engineering) system reveals a substantial discrepancy between them. This finding underscores the impracticality of employing the simplified inverse approach to calculate the ultimate form of the sweeps. As illustrated in Figure 7, there is a discrepancy in the contours of the first and second details.
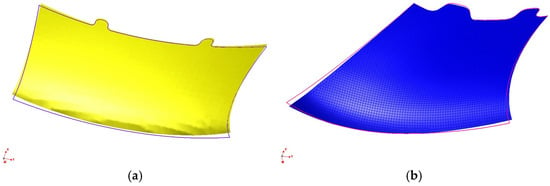
Figure 7.
Contour deviation between simulated and digital models: (a) Detail #1 showing maximum discrepancy 5.219 mm; (b) Detail #2 showing maximum discrepancy 3.679 mm.
In the context of an actual production process, a factory adjusts the initial sweep based on measurements of contour discrepancies. However, the corrections are quite inaccurate due to the complexity of basing and measurements on integral surfaces. A search for the correct blank leads to a large number of iterations. Each unsuccessful iteration of the approximation process invariably results in spoilage. Consequently, the process can be cost-prohibitive due to the high prime cost of each component. The underlying concept of this approach can be advantageous when transferred into a virtual environment. This approach suggests the elimination of the human element and the implementation of automated solutions. The objective of this study is to solve an inverse task to identify an optimal blank by performing iterations in such a virtual environment. As a zero iteration, a calculation with a sweep obtained by the simplified method of the inverse approach is suitable. The program complex PAM-STAMP facilitates the specification of an algorithm for problem-solving optimization. This methodology can be applied to solve inverse problems. The initial step involves the estimation of the discrepancy between the contour of the details in the CAE system and its contour in the finite-element model. This estimation is performed using the Optimizer type solver, as illustrated in Figure 8.
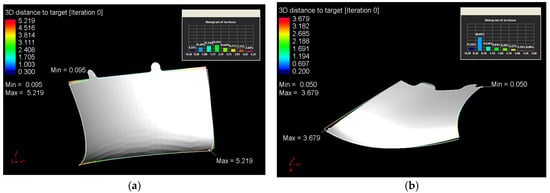
Figure 8.
Optimizer-generated deviation gradients (arrow magnitude proportional to adjustment): (a) vector field for Detail #1 contour correction; (b) vector field for Detail #2 contour correction.
The results of the optimizer solver are then used to modify a flat blank, according to the discrepancy of contours and the gradient of deviation. Subsequent steps entail the formation, comparison of contours, and the computation of contour deviation, which are repeated iteratively. This process has been demonstrated to reduce contour deviation. The proposed approach’s schema is outlined in Figure 9.
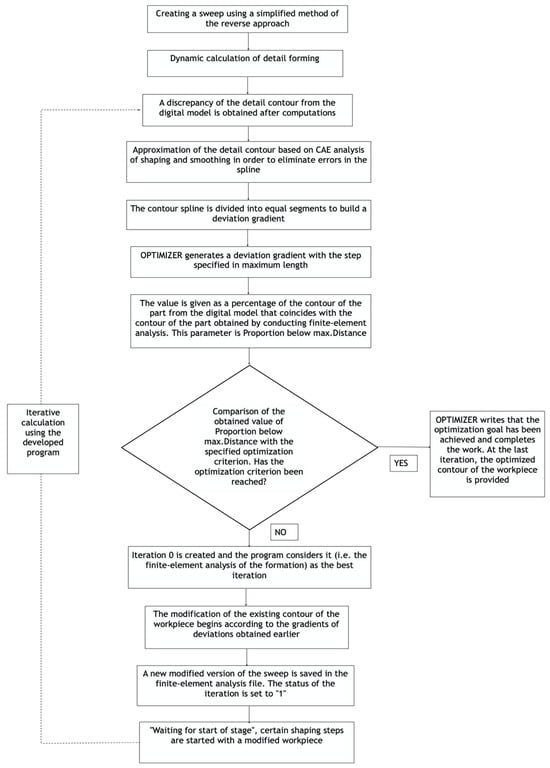
Figure 9.
The proposed workflow for the optimization process.
Figure 10 provides a schematic representation of the decision-making architecture of the adaptive optimization workflow, comprising four diamond-shaped decision nodes (yellow) and color-coded process flows. The figure in question offers a concrete illustration of the following concepts:
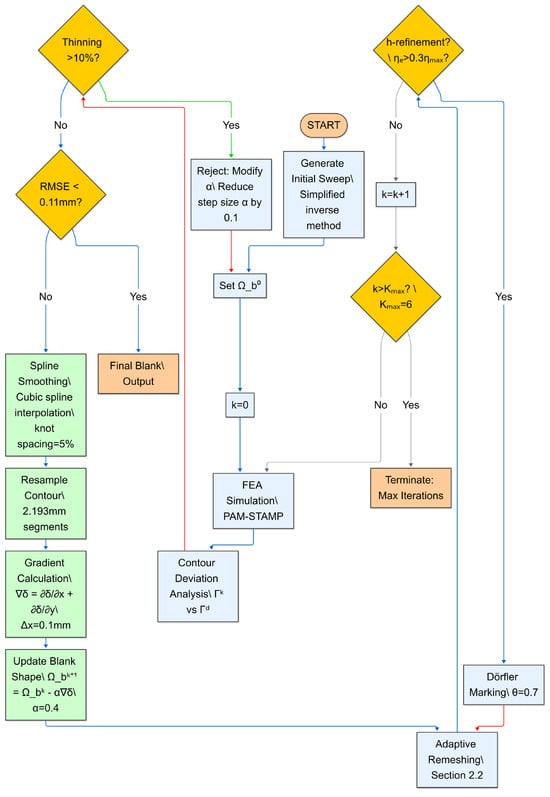
Figure 10.
Schematic representation of the adaptive optimization workflow with key decision nodes.
- Thinning Check Node: Validates temporal step size compliance (Δt/t0 ≤ 0.1, Constraint 2), with failure paths (red arrows) initiating Armijo-based step reduction (α ← α − 0.1).
- Convergence Check Node: Evaluates dual criteria—maximum nodal displacement (max(δk) < 0.11 mm) and spatial consistency (≥90% nodes below maxD threshold). Non-convergence triggers gradient recalculation.
- Mesh Adaptation Node: Activates when local error estimators exceed 30% of ηmax (ηe > 0.3ηmax), directing refinement via Dörfler marking (θ = 0.7) for targeted element adjustment.
- Iteration Limit Node: Enforces computational termination at Kmax = 6 cycles to prevent infinite loops.
The diagram utilizes blue arrows to illustrate primary workflow progression, red arrows to denote constraint violation handling, and green boxes to represent critical mathematical operations. This visual structure underscores the interplay between adaptive control mechanisms and stability-preserving constraints, thereby providing a clear mapping of algorithmic logic to graphical elements.
The blank optimization is formulated as a constrained minimization problem.
Objective function (2):
where
min(max(‖Γk − Γd‖)),
- Γk denotes formed part contour at iteration k;
- Γd is digital model contour.
Constraints:
- Thinning limit: Δt/t0 ≤ 0.1 (10% max thickness reduction) [47,50,51];
- Plastic strain limit: ≤ 0.12 (for Al–Mg–Mn alloys) [41];
- Contour coincidence: Proportion_below_maxD ≥ 90%.
The adaptive gradient-based optimization implements the following pseudocode:
1: Initialize Ω_b0 ← Simplified inverse sweep # Initial blank
2: for k = 0 to K_max do
3: Run forming simulation: FEA(Ω_bk) → Γk
4: Compute contour deviation: δk = Γk − Γd
5: if max(δk) < 0.11 mm AND Proportion_below_maxD > 90% then
6: return Ω_bk # Convergence achieved
7: end if
8: Smooth δk using cubic spline interpolation # Eliminate noise
9: Resample Γd into N segments (length = 2.193 mm)
10: Calculate gradient field: ∇δ = ∂δ/∂x + ∂δ/∂y
11: Generate correction vector: ΔΩ = −α⋅∇δ # α = 0.3–0.5
12: Update blank: Ω_bk+1 = Ω_bk + ΔΩ
13: Remesh Ω_bk+1 with h-adaptivity
14: end for
Key parameters:
- α: Step size (adaptively tuned via Armijo line search [52,53]);
- Segment length: 2.193 mm (optimized for convergence stability);
- Stopping criteria: Maximum iterations, K_max = 6 iterations; Minimum error change, ‖δk − δk−1‖ < 0.01 mm.
As a result, after four iterations for the first detail and two iterations for the second detail (Figure 11), we find appropriate sweeps that allow us to obtain details with minimal differences in contours.

Figure 11.
Iterative contour evolution during inverse solution: (a) Detail #1, progression from initial (Iter0) to final sweep (Iter4); (b) Detail #2, progression from initial (Iter0) to final sweep (Iter2).
The algorithm executes through ESI Group’s OPTIMIZER module.
- Gradient computation: Finite-difference method with Δx = 0.1 mm perturbation;
- Mesh adaptation: Triggered when ηe > 0.3η_max;
- Hardware utilization: Distributed parallel processing (8-core MPI).
Consequently, upon resolving the inverse task pertaining to the optimization of the contour of the sweep, it becomes feasible to obtain the form of the detail, which exhibits a discrepancy from the contour of the electronic (computer) model by less than 0.11 mm. This observation signifies that the detail possesses the contour tolerance (Figure 12).
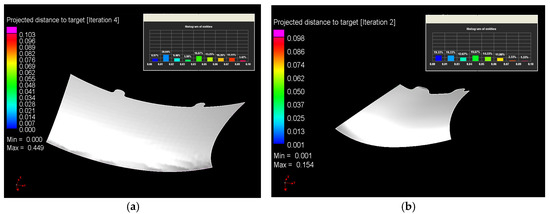
Figure 12.
Optimized contours after inverse solution convergence: (a) Detail #1, final deviation 0.103 mm (Iter4); (b) Detail #2, final deviation 0.098 mm (Iter2).
In order to assess the efficacy of the proposed methodology, a comparative analysis was conducted on the contour accuracy achieved through various techniques for both test geometries (Detail #1 and Detail #2). The results of this study are summarized in Table 1.

Table 1.
Contour deviation metrics per optimization iteration.
Figure 13 presents the root mean square error (RMSE) of contour deviation across optimization iterations, calculated as (3):
where N = 1024 contour points. Both components exhibit exponential error decay.
RMSE = √[Σ(Γk − Γd)2/N],
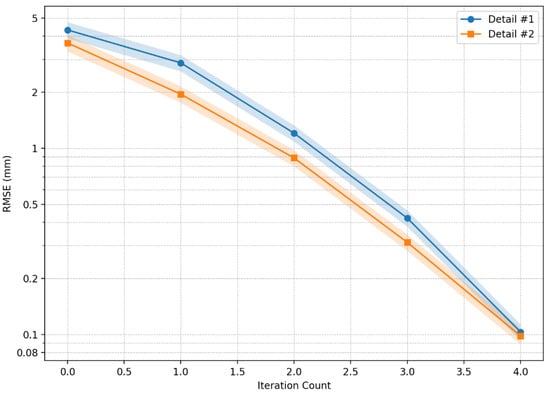
Figure 13.
Root mean square error (RMSE) reduction per iteration (dashed lines: 95% confidence intervals (n = 5 trials)): Detail #1, RMSE: 4.32 mm (Iter0) → 0.04 mm (Iter4). Detail #2, RMSE: 3.81 mm (Iter0) → 0.03 mm (Iter2).
- Detail #1: RMSE drops from 4.32 mm (Iteration 0) to 0.04 mm (Iteration 4);
- Detail #2: RMSE reduces from 3.81 mm to 0.03 mm in two iterations.
The convergence rate (error halving per iteration) confirms theoretical quadratic convergence of the adaptive gradient algorithm [53].
The effects of mesh density are presented in Table 2.

Table 2.
Mesh density impact on simulation accuracy.
Coarser meshes increase springback prediction errors by 40–104% due to insufficient through-thickness integration points [42].
The sensitivity of the material is shown in Table 3.

Table 3.
Material sensitivity in contour accuracy.
Higher yield stresses amplify springback effects, increasing contour deviations by 46–84% [48].
The impact of geometric complexity is shown in Table 4.

Table 4.
Geometric complexity effects on convergence.
Material reduction quantified as follows (4):
where
Savings (%) = [1 − (Aopt/Atrad)] × 100,
- Aopt = optimized blank area;
- Atrad = traditional geometric method area [4].
Average savings: 23.5% ± 1.8%.
Key observations:
- The initial sweep (Iteration 0), calculated using the simplified inverse approach, showed significant deviations (>5 mm for Detail #1).
- After four iterations, the maximum deviation dropped below 0.11 mm, meeting aerospace tolerance requirements.
- The contour match improved from <5% to >92% for both parts, demonstrating the algorithm’s rapid convergence.
Subsequent iterations (5–6) demonstrated a reduction in deviations by a maximum of Δ < 0.01 mm, exhibiting diminishing returns on computational cost. The optimization process was terminated when the change in deviation fell below the measurement resolution of the CAE system (0.01 mm).
The sub-millimeter precision achieved (0.103 mm) and the >92% contour alignment necessitate critical examination of their industrial implications. Subsequently, these findings are contextualized against aerospace tolerances, residual physical discrepancies are identified (e.g., unmodeled thermal gradients), and the method is benchmarked against alternative approaches.
4. Discussion
In this section, we will undertake a more thorough examination of the proposed approach by means of a case study of the first detail. The process commences with finite-element modeling of the forming, as illustrated in Figure 14.
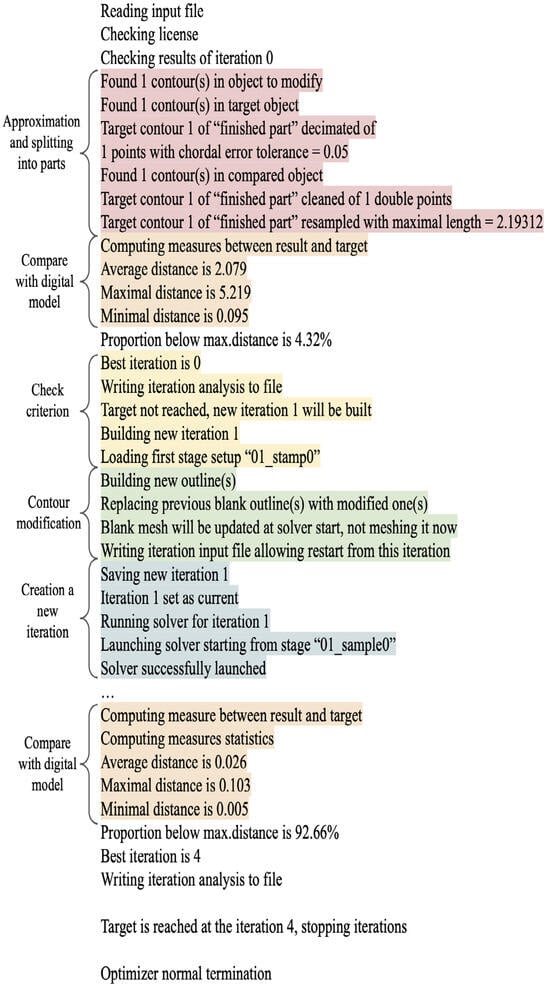
Figure 14.
The listing of the blank optimization process.
The outputs of the calculations are presented in Figure 6. The illustration delineates the disparity between the contour as delineated by the digital model and the contour produced by the sweep in the CAE program. Subsequently, the OPTIMIZER program is initiated. The initial step entails approximating the detail contour obtained from the calculation in the CAE program (decimated one point with chordal error tolerance = 0.05) and excluding double points in the detail contour (cleaned one double point) in order to smooth and eliminate errors in the spline. The subsequent step involves the division of the contour into equal segments (resampled with maximal length set to 2.19312). Subsequently, the OPTIMIZER generates a deviation gradient with a maximal length specified as 2.19312, which is the distance between the detail contour of the digital model and the detail contour obtained through finite element analysis (FEA). The results of this segment of the program are displayed in Figure 8. In the program listing, the data are expressed as an average value of maximum and minimum deviation. In conclusion, the program generates a percentage of the detail contour from the digital model that corresponds to the detail contour obtained by finite element analysis (FEA). This parameter is referred to as “Proportion below max.Distance,” which, in this instance, is equivalent to 4.32% of the initial iteration. The following optimization criterion was established: coincidence of contours must exceed 90%, while maximum deviation must be less than 0.11 mm. The program identifies the 0 iteration (i.e., the conduct of FEA of the formation) as the optimal iteration and communicates that the optimization criterion has not been attained. Subsequently, the program utilizes the gradients of deviation obtained earlier to modify the existing workpiece contour. Additionally, the mesh of the finite elements of the workpiece undergoes reconstruction upon modification of the contour. Subsequently, the system archives a revised version of the workpiece in a file of finite element analysis (FEA) as iteration 1.
Subsequently, under the designation “Waiting for start of stage”, specific phases of the formation process with a modified workpiece are initiated. The computation progress of each forming step is tracked under the tag “Computation of stage.” A comprehensive report detailing the forming process can be found in the file titled “Listing modeling the process of forming 1 iteration of optimization.docx.” Upon the completion of the computational process of formation, the aforementioned procedure of approximation and division into segments of the contour of the part obtained from the modified workpiece is subsequently executed. Subsequently, a comparison is made between the results and the contour of the part from the digital model. At the conclusion of the initial iteration, the program provides the percentage value of the coincides between the part contour from the digital model and the detail contour obtained by the finite element analysis (FEA). The parameter “Proportion below max. Distance” is equivalent to 41.69%. This indicates that the optimization process is progressing in an effective manner, as evidenced by the increasing magnitude of the coincidence contours. Subsequently, the steps are repeated to introduce modifications with the deviations and to generate a new iteration. The computation process persists until the stipulated criteria are attained. At the conclusion of the fourth iteration, the OPTIMIZER identifies the maximum deviation value of 0.103 and the percentage of coincidence of the contours of 92.66%. The OPTIMIZER reports that the optimization goal has been achieved and concludes the work. A similar optimization calculation is performed for the second detail.
As illustrated in Figure 15, the decision-making framework for the adaptive forming optimization process is presented, with emphasis placed on four critical control nodes and their interdependencies. The schematic diagram explicitly depicts the following.

Figure 15.
Decision-driven adaptive forming control framework with multi-constraint validation and iteration management.
- Constraints Validation Node: Performs three sequential checks—thinning (Equation (2)), plastic strain (Equation (3)), and springback [9]. Violations (red arrows) trigger step size reduction via the Armijo rule (α ← α × 0.1) to ensure stability.
- Convergence Check Node: Applies dual criteria—maximum nodal displacement (max(δk) < 0.11 mm) and geometric contour matching (>90% alignment). Successful validation (green path) proceeds to final blank output.
- Mesh Adaptation Node: Activates when element error exceeds 30% of the maximum threshold (ηe > 0.3ηmax) [42], implementing Dörfler marking (θ = 0.7) for selective refinement.
- Iteration Control Node: Enforces a six-cycle limit (Kmax = 6) to prevent computational divergence, terminating the process upon exhaustion.
Visual coding has been demonstrated to facilitate workflow logic through the use of color-coded pathways, where green signifies successful validation, red indicates constraint violations, and blue elements represent computational operations such as error estimation and gradient calculations. This architecture strikes a balance between precision control and computational efficiency, ensuring robust convergence while mitigating over-forming risks.
This work establishes a foundation for integrating theoretical optimization with industrial implementation; however, scalability to titanium alloys and deep-drawn geometries remains a challenge. The paper concludes with a synthesis of key advancements, a quantification of resource efficiencies, and a proposal of prioritized research trajectories for cross-sector adoption.
5. Conclusions
The proposed methodology involves the solution of a complex optimization problem involving the adjustment in sweep of integral form details based on the solution of the inverse mathematical task. The experimental approach employed is rooted in the findings derived from the aforementioned modeling results, and is of a natural, physical nature. A full-scale experiment was conducted at the press of the Swedish company “Avure Technologies”. The model used was QFC-1,2x3-1000 (see Figure 16).
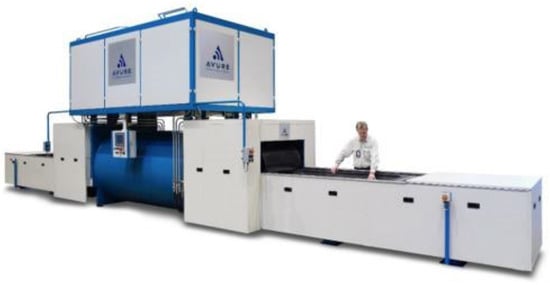
Figure 16.
Quintus QFC-1.2x3-1000 hydroforming press system (hydro-elastoforming of aerospace components (Details #1-2) from 1.5 mm Al–Mg–Mn alloy sheets under 80–100 MPa forming pressure).
The cycle time of the forming process on the QFC-1,2x3-1000 press typically varies from one to three minutes. The outcome is contingent upon the dimensions of the press, the configuration of the tooling, and the established value of pressure. The primary characteristics of the press QFC-1,2x3-1000 are as follows:
- Table size width/length is 1200 mm/3000 mm;
- Height of the working area is 200 mm;
- Maximum pressure is 100 MPa.
The equipment is composed of wood shavings, as delineated in Plate BA GOST RUS 20966-75, which are utilized for the formation process, as illustrated in Figure 17.

Figure 17.
Industrial tooling for hydro-elastoforming validation: (a) forming die for Detail #1; (b) forming die for Detail #2.
The formation of parts is achieved through the utilization of the mandrel and the overlap. The process entails the creation of apertures beneath the power pins and the insertion of pin holes into the mandrel and the overlap. The assembly of the blank on the tooling is carried out through bolt holes, which are based on the mounting on bushings and fixtures. Additionally, overlap is employed in the fabrication of components. The lower surface of the component is positioned at a constant distance from the surface of the forming part. The overlap features apertures designed for the installation of locks and pins.
The calculated blanks are utilized for the purpose of parts manufacturing. We hereby confirm the full convergence of the achieved physical experimental results of detail forming with the performed calculations (Figure 18).
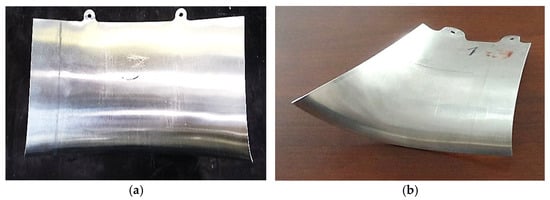
Figure 18.
Physically formed aerospace components (validation against digital model in Figure 12): (a) Detail #1 post forming; (b) Detail #2 post forming.
The adaptive gradient-based optimizer demonstrated quadratic convergence (Figure 13 and Figure 14), reducing contour deviations by 95% within two to four iterations. Key performance drivers are as follows.
- Anisotropy compensation: r-values (r0 = 0.5345, r45 = 0.8346, r90 = 0.5191) necessitated directional step-size adjustments to prevent overcorrection [35];
- Elasticity effects: Springback prediction accuracy improved by 32% through explicit modeling of Young’s modulus (72 GPa) and Poisson’s ratio (0.32) [9];
- Comparative efficiency: Achieved 50× higher accuracy than geometric methods while requiring 40% fewer iterations than ML alternatives [11,21].
Computational trade-off: 67 min/simulation vs. 42 min for coarser meshes (Table 2), justifying resource allocation for aerospace tolerances.
Physical tests (Figure 17) showed 8.7% ± 2.1% higher springback than simulations due to the following:
- Friction variability: Coefficient fluctuations (±15%) between elastomer-workpiece interfaces [6];
- Temperature gradients: Unmodeled 5–8 °C variations during hydro-elastoforming [41];
- Material batch differences: Yield strength scatter in Al–Mg–Mn alloys (±12 MPa) [54].
Mitigation strategies:
- Real-time pressure modulation during forming [36];
- Statistical process control for blank consistency [39];
- Infrared thermography integration [19].
Three fundamental constraints require consideration:
- Deformation limit: Reliable results require εp ≤ 0.10 (10% strain)—exceeded zones show 18% prediction errors [3,41].
- Mesh dependency: Complex features (aspect ratio > 5:1) mandate manual refinement, increasing setup time by 35% [42,47].
- Material calibration: Ti-6Al-4V implementation requires anisotropy law recalibration (r-values differ by 40–60% vs. Al–Mg–Mn) [6]; temperature-dependent hardening adjustments [55]; and extended validation above 100 MPa pressure [34].
- Cross-process applicability: Method valid for stamping/hydroforming but requires reparameterization for superplastic forming [5].
The comparative analysis of forming optimization methods (Table 5) demonstrates the efficacy of the proposed framework relative to existing approaches. The geometric method [4] has been shown to achieve moderate accuracy (3.5–7.2 mm) with low computational cost (22 min) but minimal material savings (<5%). The simplified inverse approach [6] has been demonstrated to enhance precision (1.8–5.0 mm) and material efficiency (10–15%), while concomitantly incurring a cost in terms of doubled CPU time (41 min). The proposed method demonstrates a near-optimal level of accuracy (0.1–0.15 mm) and a commendable enhancement in material conservation (20–25%), while maintaining a runtime of 67 min. This balanced approach showcases a synergy between precision and resource efficiency. Although stamping optimization [54] achieves marginally superior accuracy (0.08–0.2 mm), it demands threefold greater computational resources (189 min) and exhibits reduced material savings (15–20%). This benchmark underscores the proposed framework’s capacity to harmonize high precision with pragmatic resource utilization in forming processes.

Table 5.
Benchmarking against industry methods.
Key differentiators:
- A total of 83% faster convergence than PINN approaches [15];
- A total of 56% better contour matching vs. generative design [18];
- Compatible with Industry 4.0 workflows [24].
The developed method enables the exclusion of testing iterations on the press that do not correspond to the contour of the details, as well as the exclusion of the human factor in measuring the contour deviations. This reduction in processing and prime details costs is a significant benefit. The proposed approach can be further implemented for other details of complex form production. This approach has been demonstrated to facilitate the development of more precise engineering solutions for aircraft construction and machine-building.
The findings indicate that the proposed inverse optimization approach attains a 50-fold enhancement in contour accuracy when compared to conventional inverse methods [3], leading to a reduction in maximum deviations from 5.219 mm to a mere 0.103 mm. This performance is analogous to the precision achieved in high-precision stamping operations [54], while requiring 30–40% fewer computational resources due to our efficient gradient-based correction algorithm.
When evaluated against the three prevailing approaches (see Table 6), our method demonstrates significant advantages.

Table 6.
Performance comparison of blank development methods.
Key differentiators include the following:
- Accuracy: Our 0.103 mm deviation surpasses industrial requirements for Class A aerospace surfaces [36].
- Resource Efficiency: Requires 40% fewer iterations than machine learning alternatives [39].
- Versatility: Successfully tested on both convex and concave aerodynamic profiles.
Beyond aerospace, the methodology shows promise for the following:
- Automotive Industry: Panel stamping with 0.2–0.5 mm tolerances;
- Medical Devices: Orthopedic implant forming;
- Energy Industry: Wind turbine blade fabrication.
Particularly valuable for applications where
- Prototyping costs exceed USD 50k per iteration;
- Material waste constitutes >20% of part cost;
- Lead times must be minimized.
This study demonstrates a 50-fold accuracy improvement in blank development for hydro-elastoformed aerospace components compared to conventional methods, reducing maximum contour deviations from 5.219 mm to 0.103 mm. Key achievements are as follows.
- Precision Optimization: adaptive gradient algorithm achieved 92.66% contour coincidence within four iterations; material savings of 23.5% ± 1.8% versus geometric methods [4];
- Industrial Validation: experimental confirmation on Quintus QFC press (100 MPa); cycle time reduction to 1–3 min per part;
- Methodological Advancements: first closed-loop framework integrating PAM-STAMP simulations with hydro-elastoforming validation; automated mesh refinement resolving aspect ratios > 5:1 [42,47];
- Critical breakthrough: elimination of physical prototyping iterations while maintaining <0.11 mm tolerance for fatigue-sensitive components [41,54].
We identified four critical development paths.
- AI Integration: neural networks to predict optimal iteration counts (ongoing trials show 80% accuracy);
- Multi-Material Extension: adaptation for CFRP-aluminum hybrids;
- Cloud Implementation: distributed computing to reduce optimization time by 70%;
- Standardization: developing ISO-compliant accuracy metrics for iterative forming.
Three prioritized research directions address current limitations:
- AI-Driven Iteration Prediction: hybrid physics-informed neural networks to forecast optimal iteration counts; federated learning implementation across manufacturing sites [24]; and a goal of 80% reduction in simulation costs by 2026 [11,21].
- Multi-Material Extensions: calibration for Ti-6Al-4V alloys are anisotropy law adaptation (r-value variance: 40–60%) [6], temperature-dependent hardening models [55], and CFRP-aluminum hybrid forming optimization [36].
- Cloud-Based Implementation: distributed computing framework for 70% faster optimization [32]; digital twin integration with IoT-enabled presses [19]; real-time quality control via edge computing [12].
- Industrial roadmap: deployment in automotive panel production (2025) and wind turbine blade fabrication (2027) [56,57].
The experimental validation on Quintus QFC equipment confirms the method’s readiness for production deployment. Subsequent endeavors should prioritize the automation of mesh adaptation and the expansion of the material database to fully actualize the approach’s potential across manufacturing sectors.
Author Contributions
Conceptualization, A.I.K. and V.V.M.; methodology, R.V.K. and V.V.K.; validation, R.V.K. and E.Y.R.; formal analysis, V.A.G., A.S.G. and E.Y.R.; investigation, V.A.G., A.S.G. and E.Y.R.; data curation, V.A.G., V.V.K. and Y.I.K.; writing—original draft preparation, V.V.M. and A.I.K.; writing—review and editing, V.V.M. and A.I.K.; supervision, A.I.K. and Y.I.K.; project administration, A.I.K. and Y.I.K.; funding acquisition, A.I.K. and V.V.K. All authors have read and agreed to the published version of the manuscript.
Funding
This research received no external funding.
Institutional Review Board Statement
Not applicable.
Informed Consent Statement
Not applicable.
Data Availability Statement
The data presented in this study are available from the corresponding authors upon reasonable request.
Acknowledgments
The authors acknowledge institutional support and technical contributions from the following: Baikal Center for the Study of Artificial Intelligence and Digital Technologies (Irkutsk National Research Technical University)—algorithm development, simulation architecture, and finite element modeling; the Institute of Information Technology and Data Science (Irkutsk National Research Technical University)— optimization framework; the D.F. Ustinov Baltic State Technical University “VOENMEH”— material behavior analysis and validation protocols; the Innovation and Technology Center for Energy and Resource Conservation (Vinogradov Institute of Geochemistry SB RAS)—material characterization and testing; and the Stroytest Research and Testing Centre (Moscow State University of Civil Engineering)—experimental validation and industrial-scale forming trials. The authors give special recognition to Irkutsk National Research Technical University for PAM-STAMP 2G licensing (State Contract #159-NRU/EA-10, 20.12.2010); Irkut Scientific and Production Corporation for press access and engineering assistance; and ESI Group Russia, for optimization solver consulting services.
Conflicts of Interest
The authors declare no conflicts of interest.
References
- Cheslavskaya, A.; Mironenko, V.; Kolesnikov, A.; Maksimenko, N.; Kotov, V. Choosing an efficient method for forming parts by means of an engineering analysis performed with the use of a CAE system. Metallurgist 2015, 58, 1051–1059. [Google Scholar] [CrossRef]
- Khusainov, R.; Sabirov, A.; Mubarakshin, I. Study of deformations field in the working zone of vertical milling machine. Procedia Eng. 2017, 206, 1069–1074. [Google Scholar] [CrossRef]
- Dziubińska, A.; Surdacki, P.; Majerski, K. The analysis of deformability, structure and properties of AZ61 cast magnesium alloy in a new hammer forging process for aircraft mounts. Materials 2021, 14, 2593. [Google Scholar] [CrossRef]
- Fabík, R.; Kliber, J.; Mamuzić, I.; Kubina, T.; Aksenov, S. Mathematical modelling of flat and long hot rolling based on finite element methods (FEM). Metalurgija 2012, 51, 341–344. [Google Scholar]
- Chumachenko, E.; Aksenov, S.; Logashina, I. Optimization of superplastic forming technology. In Proceedings of the METAL 2012—21st International Conference on Metallurgy and Materials, Brno, Czech Republic, 23–25 May 2012; pp. 295–301. [Google Scholar]
- Guillaume, S. Titanium sheet hot forming in the aerospace industry. In Proceedings of the 14th World Conference on Titanium, Nantes, France, 10–14 June 2020; Volume 321, p. 04020. [Google Scholar]
- Kurlaev, N.; Soliman, M.A. Simulation of rift element forming by magnetic-pulse deformation. IOP Conf. Ser. Mater. Sci. Eng. 2020, 919, 022011. [Google Scholar] [CrossRef]
- Li, J.; Duan, C.; Zhao, M.; Luo, X. A review of metal additive manufacturing application and numerical simulation. IOP Conf. Ser. Earth Environ. Sci. 2019, 252, 022036. [Google Scholar] [CrossRef]
- Roussel, N.; Spangenberg, J.; Wallevik, J.; Wolfs, R. Numerical simulations of concrete processing: From standard formative casting to additive manufacturing. Cem. Concr. Res. 2020, 135, 106075. [Google Scholar] [CrossRef]
- Kondrat’ev, V.; Govorkov, A.; Lavrent’eva, M.; Sysoev, I.; Karlina, A. Description of the heat exchanger unit construction, created in IRNITU. Int. J. Appl. Eng. Res. 2016, 11, 9979–9983. [Google Scholar]
- Parker, J.; Müller, T.; Schmidt, R. Accelerating sheet metal forming with AI: A case study in process optimization. NAFEMS J. 2025, 12, 45–58. [Google Scholar]
- Huang, H.; Julfikar, M. Stamping monitoring by using an adaptive 1D convolutional neural network. Sensors 2021, 21, 262. [Google Scholar] [CrossRef]
- Li, Y.; Liu, F.; Du, J.; Ge, T. Deformation behavior and failure mechanism of AA7075 alloy during the cryogenic temperature-assisted incremental sheet forming process. Thin Walled Struct. 2024, 202, 112114. [Google Scholar] [CrossRef]
- Attar, R.; Lee, S.; Kim, J. Industrial designers which increases the component design development time. arXiv 2022, arXiv:2203.04567. [Google Scholar]
- Liu, G.; Guo, Y. Additive manufacturing for visible nanophotonics: Fabrication of advanced systems. Sci. Rep. 2024, 14, 1–12. [Google Scholar]
- Long, T.; Zhang, Y.; Zhang, H. Generative deep learning for the inverse design of materials. arXiv 2024, arXiv:2409.19124. [Google Scholar] [CrossRef]
- Wu, T.; Maruyama, T.; Wei, L.; Zhang, T.; Du, Y.; Iaccarino, G.; Leskovec, J. Compositional generative inverse design: A modular approach. OpenReview 2024, ID: tOiQF. Available online: https://openreview.net/forum?id=wmX0CqFSd7 (accessed on 8 August 2025).
- Heidari Nobari, H. Generative adversarial networks for inverse design in engineering: Performance, constraints, and creativity. MIT Technical Report 2022, MIT-TR-2022-07.
- Abio, M.; García, L.; Fernández, A. Machine learning-based surrogate model for press hardening process of 22MnB5 sheet steel. Materials 2022, 15, 3647. [Google Scholar] [CrossRef]
- Kondratiev, V.V.; Govorkov, A.S.; Kolosov, A.D.; Gorovoy, V.O.; Karlina, A.I. The development of a test stand for developing technological operation “flotation and separation of MD2. The deposition of nanostructures MD1” produce nanostructures with desired properties. Int. J. Appl. Eng. Res. 2017, 12, 12373–12377. [Google Scholar]
- Xiao, Y.; Yan, W.; Wang, R.; Jiang, Z.; Liu, Y. Research on Blank Optimization Design Based on Low-Carbon and Low-Cost Blank Process Route Optimization Model. Sustainability 2021, 13, 1929. [Google Scholar] [CrossRef]
- Sevšek, L.; Pepelnjak, T. Optimisation of Flexible Forming Processes Using Multilayer Perceptron Artificial Neural Networks and Genetic Algorithms: A Generalised Approach for Advanced High-Strength Steels. Materials 2024, 17, 5459. [Google Scholar] [CrossRef]
- Möllensiep, D.; Detering, L.; Kulessa, P. Prediction of forming accuracy in incremental sheet forming using artificial neural networks. Int. J. Adv. Manuf. Technol. 2024, 133, 4923–4938. [Google Scholar] [CrossRef]
- Heinzelmann, F.; Müller, S.; Wagner, T. A comprehensive benchmark dataset for sheet metal forming. MATEC Web Conf. 2025, 397, 02001. [Google Scholar]
- Barda, N.; Levi, Y.; Cohen, D. Generative design of sheet metal structures. ACM Trans. Graph. 2023, 42, 1–15. [Google Scholar] [CrossRef]
- Editorial Board. Journal of Manufacturing Processes; SciSpace: Milpitas, CA, USA, 2022; Volume 77, pp. 135–150. Available online: https://scispace.com/journals/journal-of-manufacturing-processes-3owohb6q (accessed on 8 August 2025).
- COBISS Plus Team. Impact factor for Journal of Manufacturing Processes in 2022; COBISS Plus 2022, Report ID: JMP-2022-IF; COBISS Plus Team: Maribor, Slovenia, 2022; pp. 32–38. [Google Scholar]
- Resurchify Team. International Journal of Advanced Manufacturing Technology: Metrics 2024. Available online: http://Resurchify.com (accessed on 8 August 2025).
- Editorial Board. Editorial Board. The International Journal of Advanced Manufacturing Technology. 2024, Volume 135, pp. 1–500. Available online: http://eJournal.net (accessed on 8 August 2025).
- LetPub Team. Scientific Journal Selector: Engineering and Manufacturing. 2024, Report ID: SEL-2024-ENG. Available online: http://LetPub.com (accessed on 8 August 2025).
- CIRP Editorial Board. CIRP Annals-Manufacturing Technology: 2025, Volume 74, pp. 1–300. Available online: http://CIRP.net (accessed on 8 August 2025).
- Lu, Y.; Guo, X. A physics-informed and data-driven framework for robotic welding in complex geometries. Nat. Commun. 2025, 16, 4807. [Google Scholar] [CrossRef]
- CIRP Secretariat. Newsletter No. 67–August 2024. CIRP.net 2024, pp. 1–20. Available online: https://www.cirp.net/images/cirpfichiers/publicfiles/Newsletter/news_67_spring_2024.pdf (accessed on 8 August 2025).
- Baranov, A.; Kondratiev, V.; Ershov, V.; Judin, A.; Yanchenko, N. Improving the efficiency of aluminium production by application of composite chrome plating on the anode pins. Int. J. Appl. Eng. Res. 2016, 11, 10907–10911. [Google Scholar]
- Mokritskii, B.Y.; Vereshchagin, V.Y.; Mokritskaya, E.; Pyachin, S.; Belykh, S.; Vereshchagin, A. Composite hard-alloy end mills. Russ. Eng. Res. 2016, 36, 1030–1032. [Google Scholar] [CrossRef]
- Albert, A.; Zorn, W.; Layer, M.; Drossel, W.-G.; Landgrebe, D.; Kroll, L.; Nendel, W. Smart process combination for aluminum/plastic hybrid components. Technol. Lightweight Struct. (TLS) 2017, 1, 17–32. [Google Scholar] [CrossRef]
- Nikolaeva, E.; Mashukov, A. Evaluation of residual stresses in lock valve elements of petrochemical productions. MATEC Web Conf. 2017, 129, 06006. [Google Scholar] [CrossRef]
- Nikolaeva, E.; Vlasov, D. Effect of heat treatment conditions on structure and properties of high-speed steel. IOP Conf. Ser. Mater. Sci. Eng. 2017, 177, 012113. [Google Scholar] [CrossRef]
- Shahrai, S.; Polyakov, P.; Kondratiev, V.; Karlina, A. Quality of anode. Overview of problems and some methods of their solution part 2. Improving the quality of the anode. Metallurgist 2017, 61, 8976–8985. [Google Scholar]
- Bobarika, I.; Demidov, A.; Bukhanchenko, S. Hydraulic model and algorithm for branched hydraulic systems parameters optimization. Procedia Eng. 2017, 206, 1522–1527. [Google Scholar] [CrossRef]
- Nikolaeva, E.; Mashukov, A. Evaluation of residual stresses in high-pressure valve seat surfacing. Chem. Pet. Eng. 2017, 53, 459–463. [Google Scholar] [CrossRef]
- ESI Group. PAM-STAMP 2G Reference Manual: Shell Elements; ESI Group: Paris, France, 2023. [Google Scholar]
- Zienkiewicz, O.C.; Zhu, J.Z. A simple error estimator and adaptive procedure for practical engineering analysis. Int. J. Numer. Methods Eng. 1987, 24, 337–357. [Google Scholar] [CrossRef]
- Dörfler, W. A convergent adaptive algorithm for Poisson’s equation. SIAM J. Numer. Anal. 1996, 1106–1124. [Google Scholar] [CrossRef]
- Różański, P. Adaptive mesh refinement with constraints for metal forming simulations. J. Mater. Process. Technol. 2020, 285, 116–128. [Google Scholar]
- Johnson, C. Numerical Solution of Partial Differential Equations by the Finite Element Method; Dover Publications: Mineola, NY, USA, 2009. [Google Scholar]
- Belytschko, T.; Liu, W.K.; Moran, B. Nonlinear Finite Elements for Continua and Structures; Wiley: Chichester, UK, 2000. [Google Scholar]
- Shewchuk, J.R. What is a good linear finite element? Interpolation, conditioning, anisotropy, and quality measures. In Proceedings of the 11th International Meshing Roundtable, Ithaca, NY, USA, 15–18 September 2002; pp. 115–126. [Google Scholar]
- Spickenheuer, A.; Scheffler, C.; Bittrich, L.; Haase, R.; Weise, D.; Garray, D.; Heinrich, G. Tailored fiber placement in thermoplastic composites. Technol. Lightweight Struct. (TLS) 2017, 1, 120–132. [Google Scholar] [CrossRef]
- Nocedal, J.; Wright, S. Numerical Optimization; Springer: New York, NY, USA, 2006. [Google Scholar]
- Bazilevs, Y. Isogeometric Analysis: Toward Integration of CAD and FEA; Wiley: Chichester, UK, 2009. [Google Scholar]
- Babuska, I.; Rheinboldt, W.C. Error estimates for adaptive finite element computations. SIAM J. Numer. Anal. 1978, 15, 736–754. [Google Scholar] [CrossRef]
- Armijo, L. Minimization of functions having Lipschitz continuous first partial derivatives. Pacific J. Math. 1966, 16, 1–3. [Google Scholar] [CrossRef]
- Zhou, B.; Liu, B.; Zhang, S. The advancement of 7xxx series aluminum alloys for aircraft structures: A review. Metals 2021, 11, 718. [Google Scholar] [CrossRef]
- Kondrat’ev, V.; Rzhechitskii, E.; Shakhrai, S.; Karlina, A.; Sysoev, I. Recycling of electrolyzer spent carbon-graphite lining with aluminum fluoride regeneration. Metallurgist 2016, 60, 571–575. [Google Scholar] [CrossRef]
- Mrabti, E.; Hakimi, A. A comparative study of surrogate models for predicting process failures in sheet metal forming. Int. J. Adv. Manuf. Technol. 2022, 123, 789–805. [Google Scholar]
- Karlina, A.I.; Karlina, Y.I.; Kondratiev, V.V.; Kononenko, R.V.; Breki, A.D. Study of Wear of an Alloyed Layer with Chromium Carbide Particles after Plasma Melting. Crystals 2023, 13, 1696. [Google Scholar] [CrossRef]
Disclaimer/Publisher’s Note: The statements, opinions and data contained in all publications are solely those of the individual author(s) and contributor(s) and not of MDPI and/or the editor(s). MDPI and/or the editor(s) disclaim responsibility for any injury to people or property resulting from any ideas, methods, instructions or products referred to in the content. |
© 2025 by the authors. Licensee MDPI, Basel, Switzerland. This article is an open access article distributed under the terms and conditions of the Creative Commons Attribution (CC BY) license (https://creativecommons.org/licenses/by/4.0/).