Abstract
This article presents an analysis of a logistics process using process mining methods. Additionally, it highlights the possibilities of analyzing industrial process data using the process mining tools available in the ProM software 6.12. The paper explains what process mining is, its types and perspectives, and its potential applications in business process management. This analysis is based on an event log, while the process model is presented in the form of a Petri net. The process research was carried out using ProM software and its available tools. The dataset is characterized, and the results of the conducted studies are presented, including an analysis of the event log, process flow network analysis, and conformance checking between the model and the event log, as well as time-based, organizational, and error detection analyses. Solutions to the identified problems are proposed. In summary, this article presents an analysis of a logistics process that was generated based on system process data, and demonstrates the possibilities of using selected algorithms from the ProM software.
1. Introduction
We are witnessing the continuous advancement of technology, electronics, and computer systems. As these domains evolve, so too do the information systems used in enterprises, which generate increasing volumes of data. This data serves as a valuable source of knowledge about events, individuals, and processes. In response, researchers have begun to focus on analyzing this data, developing methods that are now widely applied in both business and industry. One such method is process mining, which centers on process-related data collected in process-support systems. It enables the analysis, monitoring, and improvement of industrial processes using information extracted from these systems.
Process mining is a relatively young research discipline situated between machine learning and data mining on one side and process modeling and analysis on the other [1,2,3,4,5,6]. Its core objective is to discover, monitor, and improve real-world processes by extracting knowledge from event logs, which are readily available in today’s information systems [7,8,9,10,11,12].
The growing interest in process mining stems from two main factors: the rapid increase in the volume of event data generated by modern systems, and the development of tools designed to enhance and support business processes [3,13].
Business process management (BPM) is the art and science of overseeing how work is performed within an organization to ensure effective outcomes and continuous improvement [14,15]. Common goals of process improvement include reducing costs, shortening execution times, and minimizing errors. Figure 1 presents the seven phases of the BPM lifecycle and the relationships between them [2].
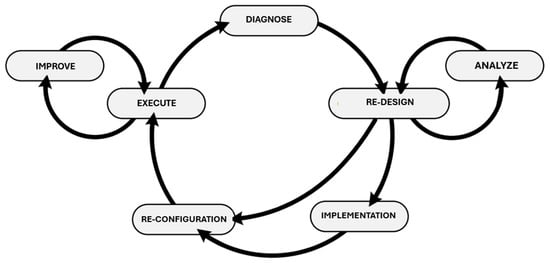
Figure 1.
BPM cycle [3].
Process mining can contribute to nearly all BPM phases (except for implementation). In the (re-)design phase, either new process models are created or existing ones are modified. In the analysis phase, these models can be compared and evaluated alongside alternatives. After (re-)design, the process is either implemented (implementation phase) or the existing system is reconfigured (reconfiguration phase). In the execution phase, the model is validated and monitored in the system. Moreover, in the improvement phase, minor model adjustments can be made without returning to the (re-)design stage. In the diagnosis phase, the running process is analyzed using process mining tools, and the results may trigger a return to (re-)design.
While process mining is particularly valuable during the diagnosis phase, its usefulness extends across the entire BPM cycle. For instance, in the execution phase, process mining techniques support real-time operations, and analyses based on historical data can guide process adaptation. Similarly, decision-makers can use process mining insights to reconfigure processes more effectively [2].
This article presents a case study illustrating how standard process discovery tools can be applied to improve a real-world logistics process. The originality of this study lies in its comprehensive execution of all stages of the analysis—from raw event log cleaning and noise threshold selection to model discovery, conformance checking, and time analysis—on a large, industrial dataset. The literature emphasizes that real-world logs often contain incorrect, missing, or duplicated events, which hinder accurate model generation [10]. Moreover, the lack of standardized procedures for noise and outlier identification negatively affects the quality of the discovered processes [16].
In our case study, we address these challenges and demonstrate how simple filtering techniques—such as setting an appropriate noise threshold—can significantly enhance model clarity. Rather than developing new algorithms, we focus on documenting practical experiences with the application of existing process mining techniques in a logistics context. At the same time, we recognize that handling incomplete logs remains a key challenge. Emerging methods, such as the Timed Genetic-Inductive Process Mining algorithm, which combines genetic and inductive approaches, offer promising solutions by reconstructing missing activities and producing more accurate models [17]. Exploring such advanced methods, along with more refined noise filtering techniques, presents a valuable direction for future research aimed at improving both the generalizability and applicability of results.
To summarize, this article presents a case study that demonstrates how standard process-discovery tools can be applied to improve a real logistics process using noisy and incomplete industrial data. The main contributions of this work are as follows: (1) the application of process mining techniques to a real-world, large-scale event log from a logistics operation, with a detailed discussion on data quality challenges; (2) the examination of noise threshold settings and their impact on model readability, including an initial sensitivity analysis; (3) the integration of concept drift detection approaches, such as time-based segmentation and plugin-based analysis, to reflect process dynamics over time; (4) the implementation of a full process mining workflow—covering process discovery, conformance checking, performance evaluation, and organizational analysis—using ProM tools; and (5) the identification of critical process execution errors, accompanied by practical recommendations for improving operational reliability. These contributions aim to bridge the gap between the theoretical models and practical applications of process mining in industrial logistics environments.
2. Materials and Methods
2.1. Structure of the Event Log
An essential element in conducting process mining is the event log, which contains structured data about the execution of a process (Table 1). Each event recorded in the log corresponds to a specific activity and is associated with a particular case (i.e., process instance) [18].

Table 1.
Sample event log.
The basic information required to analyze process execution includes the following elements [19]:
- (1)
- Case number;
- (2)
- Activity name;
- (3)
- Timestamp of the event.
Event logs may also contain additional attributes, which enrich the process model and enable more in-depth analyses of process behavior. One of the most commonly used attributes is the resource responsible for performing a given activity [18].
2.2. Process Model Construction
Process models are created to visualize and understand how a process operates and to support its automation and analysis by integrating the model into appropriate systems. A process model is a visual representation of a business process, understood as a sequence or flow of activities within an organization that are aimed at achieving specific outcomes [20,21].
Numerous modeling languages exist for representing business processes. In this study, ProM software was used, which provides a range of functionalities that enable process model discovery through various algorithms: procedural (e.g., Petri nets, BPMN), declarative (e.g., Declare), and simple process maps like Directly Follows Graphs (DFGs). For the purposes of the conducted analysis, the process was modeled using a Petri net. This modeling formalism is particularly suitable for representing dynamic systems, allowing for detailed workflow analysis, resource management, and activity synchronization—especially in complex processes.
The analyzed logistics process covers the journey of a product, starting from the moment the order is registered, then through the packing and sorting stages, and finally to its final shipment. A detailed description of this process is provided in Section 2.4.
Although Petri nets are not typically used to model specific stages such as parcel packing, they can be effectively applied to visualize and analyze more complex production and logistics processes, in which packing constitutes only one component. Petri nets enable the representation of concurrent activities—common in logistics—such as simultaneous picking or sorting. They also facilitate the modeling of interdependencies between process stages, the control of resource flows (e.g., workforce, equipment), and performance analyses using simulations. Their formal structure supports a precise analysis of process logic and complexity—whether for simple or advanced workflows.
A Petri net is a formal modeling language widely used across domains, including business process management. It consists of two main components: places and transitions. Places, depicted as circles, hold tokens representing process entities, while transitions, shown as rectangles, move tokens between places. The basic notation elements of a Petri net are shown in Figure 2.

Figure 2.
Elements of Petri net notation.
The application of Petri nets in this study is justified by their unique ability to model concurrency, synchronization, and resource flow—key characteristics of logistics processes. Unlike BPMN (Business Process Model and Notation), which prioritizes readability and communication with stakeholders, Petri nets provide a formal and mathematically precise representation of dynamic system behavior. This makes them particularly valuable for technical analyses such as conformance checking, performance evaluation, and process simulation.
In the analyzed logistics process (see Section 2.4), many activities—such as picking, packing, sorting, and loading—occur in parallel and involve complex coordination between system actions and manual operations. Petri nets are well suited to represent such concurrent behavior through token-based mechanics, enabling the simultaneous execution of transitions. This is crucial in logistics, where efficiency depends on synchronized subprocesses and optimized resource use.
Petri nets also allow for clear visualization of control-flow dependencies and decision points. In the presented case study, the process model (presented in Section 3.4) captures both the main and exceptional paths, including rare variants, such as product shortages that require dynamic rescheduling. Capturing such complexities is more challenging when using declarative approaches or BPMN, which, while intuitive, lack the formal execution semantics required for data-driven process mining.
As discussed in Section 3.4 and Section 3.5, the Petri net model generated using the Inductive Miner plugin in ProM struck a balance between accuracy and readability when a 50% noise threshold was applied. To assess the impact of noise filtering on model structure, a sensitivity analysis was performed using thresholds of 30%, 50%, and 70%. The 50% threshold was selected based on preliminary analysis, as it offered a reasonable trade-off between model complexity and abstraction. At 30%, the model became overly complex and included spurious paths; at 70%, important behavioral traces were omitted. The resulting model enabled effective conformance checking(presented in Section 3.5), highlighting discrepancies and supporting the identification of incomplete executions and potential process anomalies.
The theoretical foundation for using Petri nets in logistics is well supported in the process mining literature [9,12], which emphasizes their ability to represent both high-level process logic and low-level execution details. Their application is particularly appropriate in industrial environments where precise alignment between the model and real execution data is essential.
In conclusion, while BPMN and other notations play important roles in process communication and documentation, Petri nets are more suitable for in-depth data-driven analyses of logistics processes. Their formal nature, support for concurrency, and integration with tools like ProM make them the preferred modeling language for the objectives pursued in this study.
2.3. Description of the ProM Tool
ProM is a platform designed for both the users and developers of process mining algorithms, developed to be intuitive, flexible, and easily extensible. It was created to support the academic and research community by providing open access to technologies that enable the application of continuously evolving methods and tools in the field of process mining [22].
ProM facilitates the analysis and modeling of business processes based on the data extracted from information systems. The platform is capable of automatically discovering process models from data sources such as event logs. It offers a wide range of tools and functionalities that support key process mining tasks, including process discovery, conformance checking, and process enhancement.
Depending on the selected plugin or algorithm, the system generates various types of diagrams and visualizations that can be used to
- -
- Verify the conformance of actual processes to predefined models;
- -
- Analyze performance from multiple perspectives;
- -
- Identify inefficiencies or redundant steps in the workflow;
- -
- Detect execution errors and process anomalies.
Additionally, when the event log contains information about the individuals performing specific activities, ProM can uncover social structures within the process—such as handovers of work or task similarities among resources.
The quality, scope, and depth of analysis in ProM depend largely on the structure, completeness, and accuracy of the data contained in the event log.
The research presented in this article was conducted using ProM version 6.12, with the following plugins applied:
- (1)
- Explore Event Log for interactive exploration of the log’s structure and content;
- (2)
- Mine Petri Net with Inductive Miner for automated discovery of Petri net models;
- (3)
- Replay a Log on Petri Net for Conformance Analysis to assess alignment between the model and the event log;
- (4)
- Replay a Log on Petri Net for Performance/Conformance Analysis to analyze execution durations and process delays;
- (5)
- Project Log on Dotted Chart for time-based visualization of activity sequences;
- (6)
- Mine for a Handover-of-Work Social Network to detect handovers of tasks among resources;
- (7)
- Mine for a Similar-Task Social Network to identify the individuals performing similar types of tasks.
2.4. Characteristics of the Modeled Process
The data analyzed in this study were obtained from a selected warehouse operated by a company primarily engaged in logistics [22]. This facility serves as the central distribution center, responsible for dispatching products both to pick-up points and to other warehouses. The dataset encompasses operations from the central warehouse, as well as six satellite locations.
The analyzed logistics process encompasses the entire journey of a product, starting from order registration, then through packing and sorting, and finally to final shipment. The inputs consist of goods stored on warehouse shelves, while the outputs are parcels transported to designated collection points.
Initially, each prepared parcel is sent to one of the six logistics points, from which it continues to the end customer. Given that packing, sorting, and shipping are critical components of the delivery process, their efficiency is essential to ensuring that products reach customers quickly and in perfect condition.
To optimize this process, the company uses a range of tools and systems, including barcode scanners that track every step of order fulfillment. Additionally, packing staff are required to visually inspect the condition of each product prior to packing.
The analyzed process comprises four main stages:
- System-Based Order Preparation
This initial stage is performed automatically by the system. It involves generating order numbers, scheduling shipments, and creating packing paths—that is, lists of product locations and the items to be included in each parcel. The system also assigns shipping containers and delivery deadlines.
- 2.
- Package Preparation
This stage includes selecting suitable boxes or bags for the products, labeling them with order numbers, shipping addresses, and barcodes, and assigning packages to individual employees (up to 30 per person). Employees use barcode scanners to retrieve products from specified locations and pack them. The final step is transferring the package to the sorting area via a conveyor belt.
- 3.
- Package Sorting
Upon arrival in the sorting area, parcels are scanned and manually sorted by delivery destination. The system directs employees to place each parcel in the appropriate container, ensuring accurate delivery routing.
- 4.
- Shipment Loading
In the final stage, containers of parcels are transported to the truck loading zone, where they are loaded onto delivery vehicles. These operations are performed by warehouse staff with the assistance of self-driving forklifts.
A simplified representation of the key stages in the analyzed logistics process is presented in Figure 3.

Figure 3.
General process model.
2.5. Description of Input Data
The data used in this study were extracted from a warehouse management system (WMS) that enables real-time monitoring and reporting of warehouse inventory and ongoing operations. All events are recorded automatically by the system. The generated report includes only those activities that can be registered by the system—primarily those involving barcode scanners. As a result, the event log does not contain data on activities such as the duration of packing individual orders or the time spent preparing packaging. However, this limitation does not hinder our ability to analyze the overall process flow.
The dataset covers a period of 16 consecutive working hours, representing a standard operational cycle. It not only contains data related to the analyzed process, but also entries from other processes executed concurrently.
Table 2 presents a fragment of the raw data exported from the system. It is immediately apparent that the dataset contains gaps, and some fields—such as activity codes—are ambiguous, resulting in inconsistencies in labeling. Therefore, it was necessary to preprocess the data before analysis. This involved

Table 2.
Selected part of the raw data in MS Excel.
- -
- Identifying and handling missing values;
- -
- Standardizing date formats and activity descriptions;
- -
- Selecting relevant data for process mining;
- -
- Excluding irrelevant or redundant entries.
Although the analyzed event log spans only a 16 h timeframe, logistics processes are inherently dynamic and evolve over time. Changes may be caused by factors such as seasonality, staffing levels, equipment upgrades, or procedural modifications. This phenomenon is known as concept drift, which refers to shifts in process behavior that occur over time and may alter the patterns captured in event logs.
If concept drift is not accounted for, process models may become misleading due to the following:
- -
- Overgeneralization: A model trained on outdated data may permit paths that are no longer valid, reducing precision.
- -
- Undergeneralization: A model too closely fitted to a specific time window may fail to capture new or rare but valid behaviors, thus limiting generalization.
To mitigate the risks associated with temporal drift, the following strategies are recommended:
- -
- Time-based segmentation: Divide the event log into temporal segments (e.g., by work shifts, weeks, or pre-/post-process changes) and compare the generated models.
- -
- Drift detection techniques: Use tools such as the Concept Drift plugin in ProM to detect and visualize significant behavioral shifts over time.
- -
- Comparative conformance analysis: Replay event logs from different periods on a reference model to track changes in fitness and alignment metrics.
For future research, it would be beneficial to extend the temporal scope of the data and incorporate drift-aware modeling techniques. This would enable a deeper understanding of the stability and evolution of logistics processes, enhancing the robustness and adaptability of the resulting process models.
3. Results
3.1. Data Preparation
The first step in conducting the process analysis was data preparation, which involved cleaning the raw dataset obtained directly from the Warehouse Management System (WMS).
The input data were preprocessed to enhance quality and consistency. Existing information—such as activity codes—was clarified and supplemented using values from other columns and domain knowledge provided by employees, as well as the authors’ own experience. Duplicate records, identified by matching activity codes, were removed. Similarly, detailed attributes that were not relevant to the analysis of the warehouse process were excluded. Events and paths containing invalid or corrupt attributes were also filtered out. The date format was standardized to ensure compatibility with the data analysis tools used in the study. Finally, the dataset was chronologically sorted to reflect the actual sequence of events in the process.
The raw event log initially contained 128,677 rows; after cleaning, 35,579 rows of valid data remained. Table 3 presents a selected fragment of the cleaned dataset.

Table 3.
Selected part of the event log in MS Excel.
It is important to emphasize that event log quality is crucial to the reliability of any process mining analysis. Incomplete or poor-quality logs can lead to misleading conclusions. Common data quality issues affecting the fundamental elements of event logs include the following [1]:
- -
- Missing occurrence in the log: An event happened in reality, but was not recorded by the system.
- -
- Nonexistent occurrence: An event was logged, although it did not actually occur.
- -
- Hidden in unstructured data: An activity was performed, but is documented only in paper records or unstructured sources.
In terms of event attributes, typical problems include the following [1]:
- -
- Missing attribute: An expected attribute (e.g., a timestamp) is absent for a particular event.
- -
- Incorrect attribute: The recorded value is wrong, such as an activity that does not correspond to the actual process path.
- -
- Imprecise attribute: The attribute lacks sufficient precision, e.g., a timestamp provided only as a date, without a time component.
- -
- Irrelevant attribute: An attribute that adds no analytical value, but may assist in identifying valid log entries during preprocessing.
Techniques for event log preparation can be grouped into two categories:
- Transformation techniques: These aim to correct data quality issues before applying process mining algorithms.
- Diagnostic techniques: These are used to detect and diagnose potential quality problems in the event log [10].
3.2. Event Log Characteristics
The event log prepared for analysis (Table 3) contains four variables:
- (1)
- Order number (case ID): This column includes order numbers automatically generated by the company’s system. Since these numbers are assigned in a continuous sequence that reflects the order in which requests are received, the order number can be treated as a case number, as it fulfills the same function.
- (2)
- Timestamp: This column records the exact time at which each activity occurred, presented in the format dd/mm/yyyy hh:mm:ss.
- (3)
- Activity: This column specifies the names of the actions performed during the execution of a given order by a particular resource in order to fulfill it.
- (4)
- Resource: This field indicates the individual responsible for executing each activity in the process. The exception is the label “W0”, which signifies that the activity was executed automatically by the system.
The event log, a fragment of which is shown in Figure 3, contains 35,579 rows, describing the execution of 4575 unique orders.
3.3. Event Log Analysis
The first stage of the actual analysis of the selected logistics process involved the examination of the event log. For this purpose, the event log was imported into the ProM software, which enabled exploration of its contents and visualization of the data. This, in turn, facilitated a better interpretation and understanding of the process embedded in the system data.
3.3.1. Dashboard Analysis
The first screen displayed in the program is the dashboard (Figure 4), which presents a panel showing the number of activities assigned to each case.
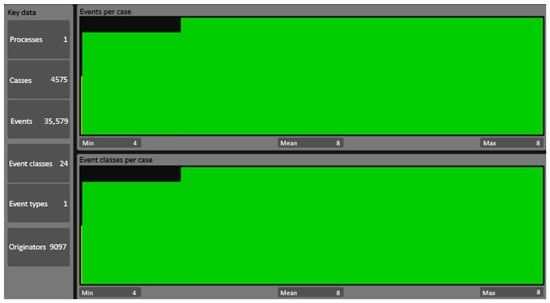
Figure 4.
Event log analysis dashboard in ProM.
To assess the quality and suitability of the discovered process models, standard evaluation metrics recommended in the IEEE Process Mining Manifesto were applied. These are discussed in the sub-sections below.
3.3.2. Analysis of Process Path Variants
Using the Explore Event Log function in ProM, diagrams of 16 distinct product flow path variants were generated. These variants were identified based on the sequences of activities recorded in the event log. Figure 5 presents the discovered paths.
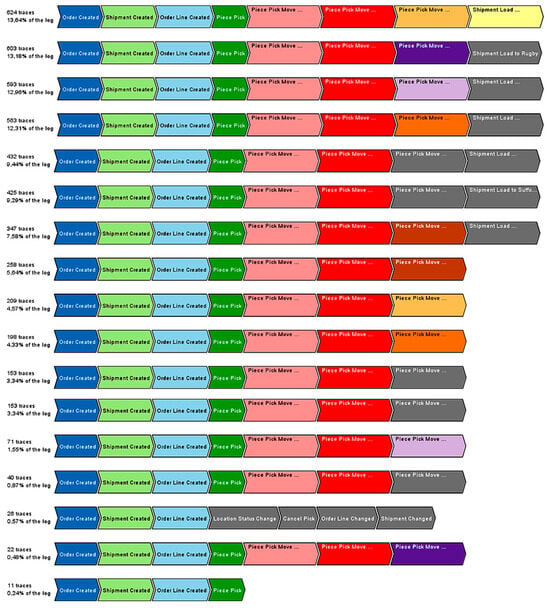
Figure 5.
Path variants in the analyzed process.
The identified variants are as follows:
- Order Created → Shipment Created → Order Line Created → Piece Pick → Piece Pick Move to Conveyor → Piece Pick Move to Marshaling → Piece Pick Move to Stillage for Bridgwater → Shipment Load to Bridgwater—occurred 624 times (13.64% of the log).
- Same path ending in Rugby—603 times (13.18%).
- Ending in Alfreton—593 times (12.96%).
- Ending in Normanton—563 times (12.31%).
- Ending in Runcorn—432 times (9.44%).
- Ending in Suffolk Park—425 times (9.29%).
- Ending in Maidstone—347 times (7.58%).
- Same path as 7, but without shipment loading—258 times (5.64%).
- Same path as 1, without shipment loading—209 times (4.57%).
- Same as 4, without shipment loading—198 times (4.33%).
- Same as 5, without shipment loading—153 times (3.34%).
- Same as 3, without shipment loading—71 times (1.55%).
- Same as 6, without shipment loading—40 times (0.87%).
- Order Created → Shipment Created → Order Line Created → Location Status Change → Cancel Pick → Order Line Changed → Shipment Changed—26 times (0.57%), likely due to stockouts requiring rescheduling.
- Same path as 2, without shipment loading—22 times (0.48%).
- Incomplete path: Order Created → Shipment Created → Order Line Created → Piece Pick—11 times (0.24%), likely indicating process errors.
These results indicate that Bridgwater received the highest number of shipments during the analyzed period. Paths representing fully completed processes (with shipment loading) account for 78.22% of all orders. In 20.78% of cases, packages were sorted, but not shipped, within the analyzed timeframe. Only 0.57% of orders required rescheduling due to product unavailability, and 0.24% reflect incomplete processes, likely due to execution errors.
3.4. Process Flow Network Analysis
In the next stage of this study, the process flow network was analyzed. Based on the event log, a Petri net was generated using the ProM software (Mine Petri Net with Inductive Miner plugin), resulting in a simplified model of the process (Figure 6).
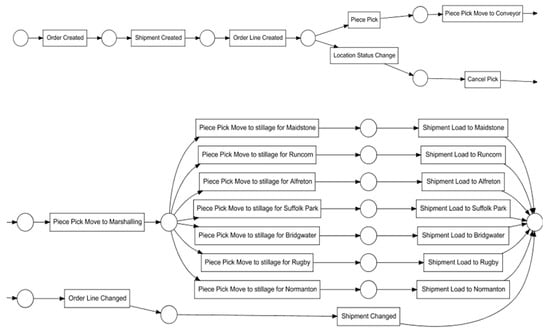
Figure 6.
Petri net generated in the ProM program.
A key factor influencing the quality, clarity, and alignment of the generated model with the event log is the choice of the noise threshold. This parameter, used by model discovery algorithms such as Inductive Miner, allows for the algorithm to filter out infrequent behavior in order to reduce model complexity and highlight the most representative paths.
To determine the most appropriate noise threshold, a comparative analysis was conducted using three values: 30%, 50%, and 70%. Each value was applied using the Inductive Miner algorithm, and the resulting models were evaluated based on structure clarity and key quality metrics (Table 4). The threshold of 50% provided the best balance—effectively reducing noise while retaining essential process variants—thereby justifying its selection.

Table 4.
Evaluation of model quality metrics for different noise thresholds.
The resulting network visualizes the sequence of activities and their interrelations, providing insight into potential process paths for order fulfillment.
The process begins with Order Created, where an order is registered in the system. This is followed by Shipment Created, in which the order is assigned to a specific distribution point, and then Order Line Created, defining the locations from which items are to be picked. At this point, the process splits in regard to what can be interpreted—based on domain knowledge—by taking the form of an OR gateway, indicating that the flow may proceed along one of two possible branches.
The first branch begins with Piece Pick. Once an entire cart of orders has been picked, the packages are moved collectively to Piece Pick Move to Conveyor, where they are placed on a conveyor belt for transportation to the sorting area. After arrival, they are handled at the Piece Pick Move to Marshaling stage. Here, a second OR gateway directs the flow into seven possible paths, each corresponding to a delivery destination. The activity Piece Pick Move to stillage for [destination] represents placing the package into a container for a specific city, followed by Shipment Load to [destination], where the container is loaded onto the appropriate truck.
The alternative path through the first OR gateway occurs when the product is unavailable at the designated location. In this case, the flow proceeds to Location Status Change, where the worker marks the location as empty using a scanner. This is followed by Cancel Pick, as the item cannot be retrieved. A new picking location is then assigned via Order Line Changed, and the shipping schedule is updated as Shipment Changed.
3.5. Conformance Analysis of the Event Log with the Model
To analyze the conformance of the event log with the generated Petri net model—representing only the intended, predefined order processing paths—the Replay a Log on Petri Net for Conformance Analysis plugin in ProM was used. The comparison produced the network shown in Figure 7.
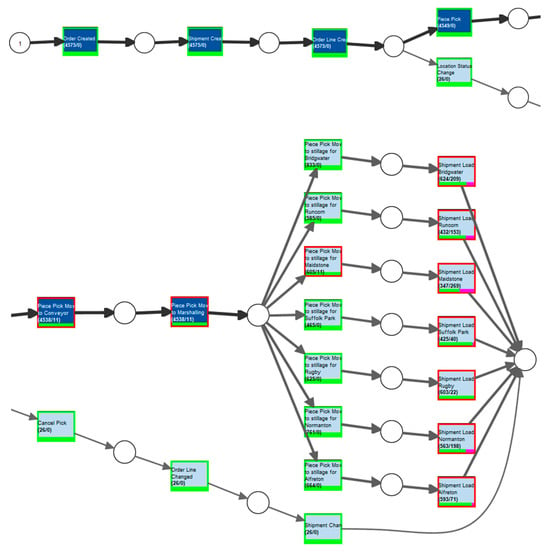
Figure 7.
Conformance-checking network generated in ProM.
From this network, we observed that activities from the initial stage of system-based order preparation—Order Created, Shipment Created, Order Line Created, and Order Packed—were fully consistent between the event log and the model. This is indicated by green frames around the activities and the intense blue coloring, which reflects their high frequency.
Activities related to delays in packing due to product unavailability—such as Location Status Change, Cancel Pick, Order Line Changed, and Shipment Changed—are also consistent between the log and the model. Although they are framed in green, indicating correct execution, the low saturation of blue shows that these situations occurred rarely.
Red frames appear around the following activities:
- -
- Move Package to Conveyor;
- -
- Receive Package in Sorting;
- -
- Move Package to Stillage for Maidstone;
- -
- Load Shipment to Maidstone.
Each of the first three inconsistencies occurred 11 times, suggesting that 11 packages were lost between the packing stage and their transfer to the conveyor. This represents a critical deviation from the expected process, potentially delaying delivery to the recipient. In the case of Load Shipment to Maidstone, the number of discrepancies was even higher.
According to the model, the lost packages were intended for Maidstone. However, this destination is not explicitly recorded in the event log at the packing stage, as location-specific information appears only later during sorting. While Maidstone is not the most frequent destination (Bridgwater is), it is likely that the orders immediately before and after the lost ones were also bound for Maidstone, which would explain why the discrepancy is attributed to this part of the process.
Additional red frames are observed in the Load Shipment phase for all destination cities. A pink line in this section indicates the extent of misalignment between the event log and the model.
From the top of the diagram, the following discrepancies were identified: 209 shipments were not delivered to Bridgwater, 153 to Runcorn, 269 to Maidstone, 40 to Suffolk Park, 22 to Rugby, 194 to Normanton, and 71 to Alfreton.
These discrepancies do not necessarily indicate permanent process errors. Shipment records show that nearly 80% of these packages were delivered in the next scheduled delivery, beyond the analyzed time window.
In total, the diagram reveals 995 discrepancies between the event log and the process model.
3.6. Evaluation of Model Quality
To assess the quality and suitability of the discovered process models, the standard evaluation metrics recommended by the IEEE Process Mining Manifesto were applied. These include the following:
- -
- Fitness: The extent to which the model can reproduce the behavior recorded in the event log;
- -
- Precision: The degree to which the model avoids allowing behavior that was not observed in the log;
- -
- Generalization: The model’s ability to reflect future or similar behavior not yet observed;
- -
- Simplicity: The structural comprehensibility and compactness of the model.
Table 5 presents a comparative summary of three widely used process discovery algorithms: Inductive Miner, Heuristic Miner, and Alpha Miner. Each algorithm was applied to the same filtered event log, and the resulting models were evaluated using the ETConformance plugins available in the ProM framework.

Table 5.
Model evaluation metrics.
As the results indicate, the Inductive Miner achieved the best overall balance between conformance (fitness), generalization, and model simplicity. Its ability to filter noise and generate structured models makes it particularly suitable for analyzing real-world event logs. While the Heuristic Miner achieved slightly better precision—capturing more specific process variants—it resulted in a more complex model. The Alpha Miner, although foundational, struggled with the complexity and incompleteness of the real log data, yielding a model with low fitness and limited structural clarity.
These findings support the selection of the Inductive Miner for the subsequent detailed analyses conducted in this study.
3.7. Time Analysis of the Process
Time analysis of the process aims to identify the duration of individual activities and the delays between them, as well as to detect time-related inefficiencies that may require improvement. The ProM software offers dedicated tools for conducting such time-based analyses.
In the conducted temporal analysis, activity duration is defined as the time interval between the recorded start and end timestamps of a specific task within a single process instance. This metric reflects the actual execution time of the activity and is calculated directly from the event log by measuring the difference between the start and end timestamps. This approach allows for precise evaluation of task performance within the broader context of overall process execution.
3.7.1. Activity Duration Analysis
Using the Replay a Log on Petri Net for Performance/Conformance Analysis plugin, a process path was generated that visualizes the duration of individual activities (Figure 8).
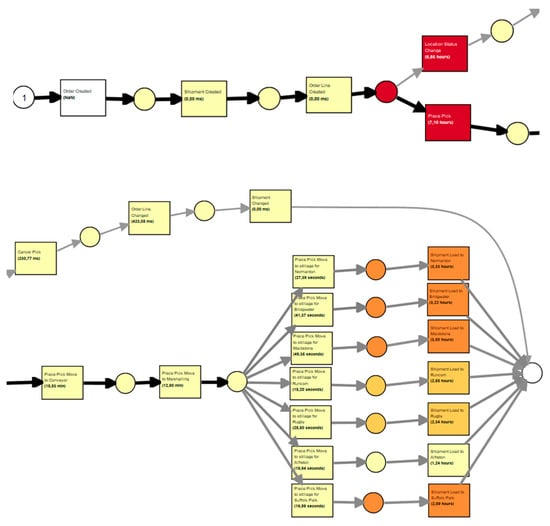
Figure 8.
Time analysis network generated in ProM.
In the resulting network, the first activity does not display any duration. This is because the event log used to generate the network contains only a single timestamp per activity, indicating the moment that it occurred. In such cases, the duration is approximated by calculating the time difference between the timestamp of the preceding activity and that of the current one—effectively reflecting the delay between events.
The second activity, Shipment Creation, has a recorded duration of 0 s, meaning that it is executed immediately after the first. The same applies to the third activity, Creation of Order Fulfillment Path. This suggests that the first three activities are performed almost simultaneously.
Subsequently, a gateway appears from which two parallel activities emerge. According to the generated path, these have the longest durations in the entire process, as indicated by the most saturated colors. However, these durations actually reflect the waiting time before the activities begin.
The average delay between the system-based preparation of the order and the start of its physical execution is approximately 5.64 h, while the Change of Location Status typically occurs after 5.07 h.
Once the order is packed, it is transferred to a conveyor belt. The diagram shows that the average delay between packing and conveyor placement is 10.55 min. This includes the total time from the packing of the first order on a cart to the last, as orders are moved to the conveyor only after the entire cart is complete.
An average of 8.31 min elapses between placing an order on the conveyor and its receipt in the sorting area. This duration accounts for possible conveyor downtimes (as the belt operates in cycles), the time taken for parcels to descend from the mezzanine floors, and the time required for sorting staff to retrieve and scan them.
The shortest activity durations—excluding system-related actions—are associated with loading parcels into containers. The average delay between removing a parcel from the conveyor and placing it into the appropriate container ranges from 11 s (Runcorn) to 41 s (Bridgwater).
At the end of the process, containers are loaded onto trucks. The average time a parcel remains in the container before truck loading varies from 58 min for Alfreton to 3 h for Suffolk Park. This variation is due to earlier packing of some parcels for later departures—enabled by the efficient preparation of earlier shipments—which caused them to wait longer than expected. This observation is supported by employee interviews.
In the alternative path involving canceled packing, subsequent activities are executed almost instantaneously, with durations measured in milliseconds.
3.7.2. Analysis of Activity Distribution over Time
ProM also enables the generation of a scatter plot that visualizes the sequence of activity executions over time using the Project Log on Dotted-Chart plugin. The resulting plot is shown in Figure 9.
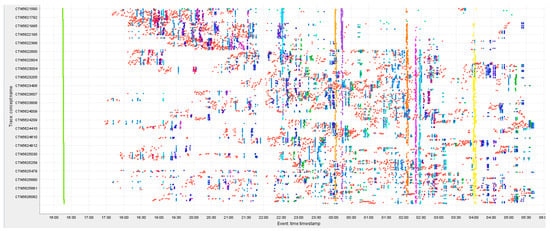
Figure 9.
Scatter plot generated using ProM.
The chart displays all activities performed between 4:00 PM and 6:00 AM on 13–14 December 2022.
The first activities visible on the plot—Order Creation, Shipment Creation, and Creation of Order Fulfillment Path—are represented by green dots forming a straight, continuous line. This pattern reflects their near-simultaneous execution for each order, indicating that all orders were prepared in the system between 4:00 PM and 4:30 PM, before the start of the packing process.
A pause in activity follows, and packing begins after 5:00 PM. At the top of the chart, a dense group of orange dots appears, representing the gradual packing of subsequent orders.
Between 5:30 PM and 10:00 PM, the visible data points correspond to packing, sorting, and order-removal activities (in cases of stock unavailability). Around 10:00 PM, a noticeable pause in the process occurs, coinciding with the shift change to the night shift.
Afterward, the loading and shipment of parcels begin as follows:
- -
- The first shipment—to Maidstone—takes place around 10:30 PM, with most of the earliest orders (those with the lowest codes, shown highest on the chart) being dispatched at this time.
- -
- The next shipment—to Bridgwater—is dispatched around midnight, followed by a shipment to Suffolk Park.
- -
- After 2:00 AM, orders are shipped first to Normanton and then to Runcorn and Alfreton, with the final shipment—to Rugby—departing around 4:00 AM.
Following the last truck loading, packing and sorting activities continue. This explains why the final activity (Shipment Loaded) is missing from many cases. These orders were still being processed, and were likely scheduled for shipment after the time period covered by the analyzed event log.
3.8. Analysis of Process Resource Organization
To assess the organization of human resources involved in the process, two types of social networks were generated using ProM plugins: a handover-of-work network and a task similarity network. These visualizations were complemented by additional quantitative network metrics to enhance the analysis. All personal identifiers in the social network graphs were replaced with pseudonyms (W1, W2, …, W32) to ensure compliance with data privacy standards. However, the mapping of roles was preserved to retain analytical value.
Figure 10 presents the handover-of-work network generated using the Mine for a Handover-of-Work Social Network plugin. This network visualizes the task transitions between the individuals involved in the process. The number of connections for each person is indicated by arrows pointing to or from them. To improve readability, the size of each node reflects the total number of interactions.
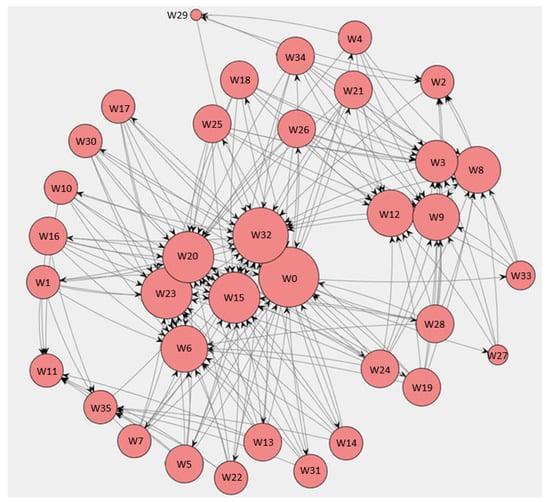
Figure 10.
Social network of resource interactions generated in ProM.
The node with the highest number of connections is W0, representing the system, which automatically assigns tasks to employees, resulting in a large number of outgoing interactions. Among human workers, W32 has the most connections; this employee is responsible for verifying container completeness and handing them over for shipment, explaining the frequent interactions with staff preparing containers for loading. Other highly connected individuals include W15, W20, W6, and W23, suggesting their active roles or responsibilities regarding critical tasks. In general, the number of connections correlates with the volume of orders handled, highlighting the link between operational load and inter-worker interactions.
To deepen the organizational analysis, we calculated additional network metrics based on data exported from the ProM social network plugins. Specifically, we computed centrality measures—including in-degree, out-degree, and betweenness centrality—for each resource in the handover-of-work network. The results confirm that W32 not only had the highest number of direct interactions, but also played a key intermediary role in task flow, consistent with their supervisory responsibilities. Similarly, W15 and W20 showed high betweenness values, indicating their significant roles in ensuring smooth transitions between different process stages. These findings reinforce the organizational importance of these individuals as intermediaries in the execution chain.
To explore the division of labor, a task similarity network was generated using the Mine for a Similar-Task Social Network plugin. Figure 11 shows this network, where individuals are grouped based on the similarity of the tasks they perform. Node size and position reflect the task profiles and workload distribution.
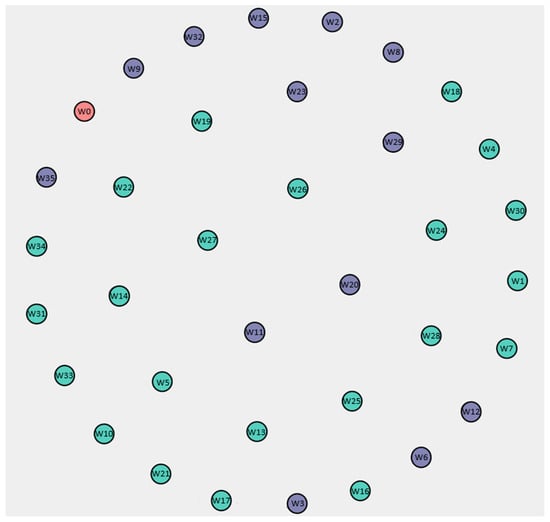
Figure 11.
Task similarity diagram generated in ProM.
In this diagram, green represents employees responsible for packing (22 individuals), while purple denotes those involved in sorting shipments (13 individuals). Red indicates the system (W0), which handles non-human activities. Workers W15, W20, W6, and W23 again stand out as highly active in sorting tasks, while W32 also appears in the sorting group, consistent with their involvement in final shipment preparation.
To enhance this visualization, we applied modularity-based community detection to the task similarity network. The results reveal two distinct clusters—one for packing staff and one for sorting staff—mirroring the color coding in Figure 11. The modularity score of 0.43 indicates a moderate but meaningful structural separation between these groups, supporting the current division of responsibilities.
Taken together, the network diagrams and computed metrics offer compelling evidence that the process is well-organized in terms of task allocation and collaboration among workers. The staffing structure reflects the process demands: packing, being more time-consuming, involves more workers, while sorting is performed by a smaller but more efficient team. These insights suggest that workforce planning aligns well with task complexity and time requirements.
In future research, we plan to expand this organizational analysis by incorporating more advanced network measures—such as closeness centrality and clustering coefficient—and by testing alternative team configurations using simulated event logs. This would support a deeper understanding of how different organizational structures influence process performance.
3.9. Error Analysis in the Process
As a result of the conducted analyses, a process error was identified involving the incomplete execution of the process flow, specifically the fulfillment of the order terminated at the “Piece Pick” stage. The order was neither transferred to the sorting area via the conveyor belt, nor loaded for shipment. This error occurred 11 times in total. The following section presents a detailed analysis of this issue.
To investigate the problem, the Explore Event Log function was used again in ProM. The faulty process variant was selected to gain insight into the details of the specific orders that followed this incomplete path. Figure 12 presents the results of this analysis.
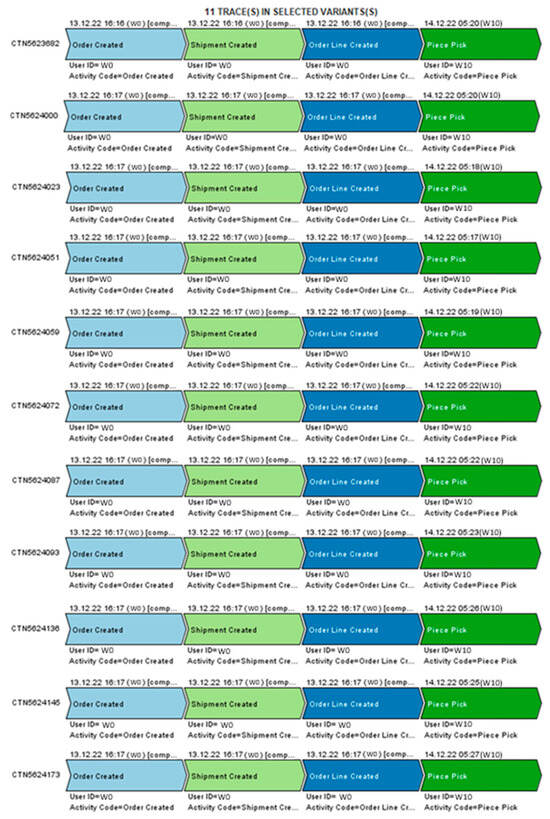
Figure 12.
Diagram illustrating task similarity generated using the ProM program.
Upon examining the results, it was determined that each faulty process instance involved the system (W0) and an employee identified as W10. Based on the timestamps of the subsequent Piece Pick activities, it can be concluded that all affected orders were packed consecutively between 05:17 and 05:27. This suggests that the orders were likely placed on the same cart and packed by a single person—W10.
Moreover, the execution times of the Piece Pick activity indicate that these orders were not scheduled to be shipped with any of the seven trucks that had already departed. According to information from company staff, a shift change occurs at 6:00 AM, which is why employees on the night shift finish their packing and sorting activities between 5:30 and 6:00 AM. It is therefore likely that the packages were packed, but never transferred to the conveyor belt for further processing.
This error appears to be the result of human oversight and failure to complete the assigned task. Since the morning shift does not handle packing in the Mezzanine (Mezz) area, there is a risk that the packages would remain on the upper floor, never reach the sorting area, and ultimately fail to be delivered to the customer.
3.10. Proposed Solution to the Process Error
The employee responsible for packing is not only required to prepare the order, but also to place it on the conveyor belt for further processing. To prevent situations where this task is not properly completed, the following corrective measures are recommended:
- (1)
- Implement a system control that prevents employees from logging out of the scanner if any packed items have not yet been transferred to the sorting area via the conveyor belt.
- (2)
- Organize refresher training sessions to reinforce proper task execution procedures and remind employees of the consequences of skipping any step in the process.
- (3)
- Configure an automatic alert system that notifies the area or shift manager when an order remains in the “Piece Pick” status 30 min before a scheduled truck departure.
- (4)
- Introduce a best practice requiring the morning shift area manager to inspect the conveyor belt loading area at the start of the shift to ensure that no packages have been left behind.
These measures are intended to enhance accountability, raise process awareness, and ensure seamless order fulfillment without errors or delays.
4. Discussion
This study applied process mining techniques to a real-world logistics process using noisy and incomplete event data extracted from a Warehouse Management System (WMS). The full analytical workflow was implemented, including data preparation, process model discovery, conformance checking, performance analysis, organizational mining, and error identification. Each phase relied on the ProM software and relevant plugins.
Three process discovery algorithms—Inductive Miner, Heuristic Miner, and Alpha Miner—were compared using standard model evaluation metrics: fitness, precision, generalization, and simplicity. Among them, the Inductive Miner with a 50% noise threshold provided the best balance between model clarity and accuracy, allowing for effective identification of frequent behavior patterns while filtering out sporadic or noise-induced variants. Although the Heuristic Miner generated more detailed models (higher precision), they were also more complex. In contrast, the Inductive Miner maintained greater simplicity and generalization, which is essential for strategic use such as process optimization and redesign.
The trade-off between precision and generalization is fundamental in process mining. Highly precise models tend to overfit, capturing uncommon paths that may reflect noise or anomalies rather than typical behavior. Conversely, models with greater generalization may omit important specificities. This study confirms that Inductive Miner strikes a useful compromise by generating models that are interpretable, structurally compact, and robust against data imperfections.
A thorough cleaning of the raw data was conducted before analysis. From over 128,000 initial records, a curated event log of 35,579 rows was created, describing the execution of 4575 orders. The data was cleaned, standardized, deduplicated, and filtered for relevance. This step proved to be crucial, as the reliability of process mining outcomes strongly depends on data quality. The importance of this preprocessing aligns with the prior literature, including recommendations by Marin-Castro and Tello-Leal [10], who emphasized the impact of structured and consistent event logs on process mining reliability.
The cleaned event log was analyzed using the Explore Event Log plugin in ProM 6.12. Sixteen process variants were discovered. Seven represented complete order fulfillment, seven ended after packing (interpreted as valid but incomplete within the log’s timeframe), one represented a canceled order, and one revealed a critical error—an order that was packed, but never transferred for sorting or shipment.
A Petri net model was generated using the Inductive Miner plugin and was then evaluated using conformance analysis. Replay logs confirmed alignment between most recorded behavior and the process model. However, the analysis also identified 962 unpacked orders and 11 prematurely terminated cases. Time-based analysis using the Dotted Chart and Replay on Petri Net for Performance plugins revealed that some “unpacked” orders were actually being prepared for a later shipment and thus did not indicate process failure. No systemic time-related inefficiencies were found.
This study also conducted an organizational analysis using two types of social networks: handover-of-work and task similarity. These revealed the structural characteristics of work organization. Pseudonymized identifiers ensured data privacy. The analysis confirmed that 22 employees were involved in packing, while 13 were responsible for sorting. Metrics such as centrality and community detection revealed the key roles of specific employees (notably W32) and confirmed the functional separation between packing and sorting teams. These insights can inform staff planning and role allocation.
The erroneous process path, identified earlier, was further investigated. All 11 affected orders were packed between 05:17 and 05:27 by the same employee (W10). None of the orders were transferred for sorting. Operational knowledge provided by warehouse staff confirmed that this occurred during the transition between the night and morning shifts. It was likely due to negligence or failure to complete the packing task. To mitigate such errors in the future, a series of practical recommendations are proposed:
- -
- Prevent employees from logging out of scanners if orders have not been transferred to the sorting area.
- -
- Send automated alerts to area managers when orders remain in Piece Pick status close to the truck departure time.
- -
- Conduct refresher training for staff on task completion responsibilities.
- -
- Introduce a morning routine for supervisors to verify the loading area at the start of each shift.
To evaluate the effectiveness of these measures, key performance indicators (KPIs) could be established, including
- -
- The percentage of orders reaching the sorting area before shift change.
- -
- The number of orders remaining in Piece Pick after a shift.
- -
- Scanner logouts with open tasks.
- -
- The number of orders flagged by automatic alerts.
Benchmarking such indicators over time would enable quantitative assessments of improvement initiatives and their effect on process reliability.
Despite using a 50% noise threshold, no formal sensitivity analysis was included in this study. This remains a limitation. While concept drift and noise handling were discussed conceptually, future work will incorporate segmented or drift-aware analysis and compare different noise thresholds (e.g., 30%, 50%, 70%) to validate threshold robustness. Comparative conformance and performance metrics across thresholds will help justify parameter selection.
Benchmarking will also be enhanced in future research through expert-based model validation and comparisons with operational KPIs, such as lead times, resource utilization, or error rates. These comparisons will help to assess whether process insights reflect operational realities and whether the discovered models are actionable for decision-making.
Furthermore, the obtained quality metrics are consistent with those reported in similar process mining studies conducted on real-world, noisy event logs in logistics and manufacturing contexts [23,24,25], where fitness values above 0.90 and precision in the range of 0.70–0.85 are considered satisfactory for operational decision-making. Compared to these benchmarks, the Inductive Miner in our analysis demonstrates competitive performance while maintaining superior simplicity and interpretability. This positions our model within the upper range of practical applicability observed in the literature, and supports its relevance for both operational monitoring and strategic process improvement initiatives.
By situating the results within the broader context of prior studies—such as the maturity model proposed by Jacobi et al. [26], production-focused applications by Lorenz et al. [23], and reinforcement learning approaches by Neubauer et al. [24] and Kintsakis et al. [25]—this study demonstrates that even basic analyses using curated event logs can yield meaningful and actionable insights. Furthermore, it confirms that process mining is a powerful and practical tool for data-driven logistics improvement, and that organizations can advance their practices by integrating such techniques into operational monitoring and decision-making processes.
Author Contributions
Conceptualization, A.N. and N.P.; methodology, A.N. and N.P.; software, A.N. and N.P.; validation, A.N. and N.P.; formal analysis, A.N. and N.P.; investigation, A.N. and N.P.; resources, A.N. and N.P.; data curation, A.N. and N.P.; writing—original draft preparation, A.N. and N.P.; writing—review and editing, A.N. and N.P.; visualization, A.N. and N.P.; supervision, A.N. and N.P.; project administration, A.N. and N.P.; funding acquisition, A.N. and N.P. All authors have read and agreed to the published version of the manuscript.
Funding
This research received no external funding.
Data Availability Statement
Data are available on request due to restrictions.
Conflicts of Interest
The authors declare no conflicts of interest.
References
- Brzychczy, E.; Aleknonytė-Resch, M.; Janssen, D.; Koschmider, A. Process mining on sensor data: A review of related works. Knowl. Inf. Syst. 2025, 67, 4915–4948. [Google Scholar] [CrossRef]
- Dumas, M.; La Rosa, M.; Mendling, J.; Reijers, H. Fundamentals of Business Process Management; Springer: Berlin/Heidelberg, Germany, 2013; Available online: https://repository.dinus.ac.id/docs/ajar/Fundamentals_of_Business_Process_Management_1.pdf (accessed on 12 July 2025).
- van der Aalst, W.; Adriansyah, A.; Alves de Medeiros, A.; Arcieri, F.; Baier, T.; Blickle, T.; Bose, J.; van den Brand, P.; Brandtjen, R.; Buijs, J.; et al. Process Mining Manifesto, IEEE Task Force on Process Mining. 2012. Available online: https://www.tf-pm.org/upload/1580737614108.pdf (accessed on 12 July 2025).
- van der Aalst, W.M.P. Process Mining: A 360 Degree Overview; Springer International Publishing: Cham, Switzerland, 2022; pp. 3–34. [Google Scholar] [CrossRef]
- Reinkemeyer, L. Process mining in action. In Process Mining in Action Principles, Use Cases and Outloook; Springer International Publishing: Cham, Switzerland, 2020; Volume 11, pp. 116–128. [Google Scholar]
- Bozkaya, M.; Gabriels, J.; van der Werf, J.M. Process diagnostics: A method based on process mining. In 2009 International Conference on Information, Process, and Knowledge Management; IEEE: New York, NY, USA, 2009; pp. 22–27. [Google Scholar]
- Al-Ali, H.; Cuzzocrea, A.; Damiani, E.; Mizouni, R.; Tello, G. A composite machine-learning-based framework for supporting low-level event logs to high-level business process model activities mappings enhanced by flexible BPMN model translation. Soft Comput. 2020, 24, 7557–7578. [Google Scholar] [CrossRef]
- Bertrand, Y.; De Weerdt, J.; Serral, E. Assessing the suitability of traditional event log standards for iot-enhanced event logs. In Business Process Management Workshops; Cabanillas, C., Garmann-Johnsen, N.F., Koschmider, A., Eds.; Springer International Publishing: Cham, Switzerland, 2023; pp. 63–75. [Google Scholar]
- Leemans, S.J.; Fahland, D.; van der Aalst, W.M.P. Discovering Block-Structured Process Models from Event Logs Containing Infrequent Behaviour, in International Conference on Business Process Management; Springer: Berlin/Heidelberg, Germany, 2013; pp. 66–78. [Google Scholar]
- Marin-Castro, H.M.; Tello-Leal, E. Event Log Preprocessing for Process Mining: A Review. Appl. Sci. 2021, 11, 10556. [Google Scholar] [CrossRef]
- Turner, C.J.; Tiwari, A.; Olaiya, R.; Xu, Y. Process mining: From theory to practice. Bus. Process Manag. J. 2012, 18, 493–512. [Google Scholar] [CrossRef]
- van der Aalst, W. Process Mining Data Science in Action; Wyd. 2, Wydawn; Springer: Berlin/Heidelberg, Germany, 2016. [Google Scholar]
- Hammer, M.; Champy, J. Reengineering the Corporation: A Manifesto for Business Revolution; Harper Collins: New York, NY, USA, 1993; 233p. [Google Scholar]
- Gabryelczyk, R.; Sipior, J.C.; Biernikowicz, A. Motivations to Adopt BPM in View of Digital Transformation. Inf. Syst. Manag. 2022, 41, 340–356. [Google Scholar] [CrossRef]
- Lepenioti, K.; Bousdekis, A.; Apostolou, D.; Mentzas, G. Prescriptive analytics: Literature review and research challenges Int. J. Inf. Manag. 2020, 50, 57–70. [Google Scholar] [CrossRef]
- Koschmider, A.; Kaczmarek, K.; Krause, M.; van Zelst, S.J. Demystifying Noise and Outliers in Event Logs: Review and Future Directions. In Business Process Management Workshops; BPM 2021, Lecture Notes in Business Information Processing; Marrella, A., Weber, B., Eds.; Springer: Cham, Switzerland, 2022; Volume 436. [Google Scholar] [CrossRef]
- Effendi, Y.A.; Kim, M. Reliable Process Tracking Under Incomplete Event Logs Using Timed Genetic-Inductive Process Mining. Systems 2025, 13, 229. [Google Scholar] [CrossRef]
- Brzychczy, E.; Rostek, K. Cyfrowa Analiza Danych I Procesów; Polskie Towarzystwo Ekonomiczne: Warszawa, Poland, 2024. [Google Scholar]
- Brzychczy, E. Wykorzystanie eksploracji procesów w przedsiębiorstwie. Inżynieria Miner. 2017, 18, 237–244. [Google Scholar]
- Drejewicz, S.; Zrozumieć, B.P.M.N. Modele Procesów Biznesowych; Wyd. 2, Wydawn; Helion: Gliwice, Poland, 2017. [Google Scholar]
- Hammer, M. Reinżynieria i jej Następstwa; Wyd. 1, Wydawn; Wydwawnictwo Naukowe PWN: Warszawa, Poland, 1999. [Google Scholar]
- Process and Data Science Group—RWTH Aachen University. Process Mining ProM. Available online: https://processmining.org/old-version/prom.html (accessed on 29 November 2022).
- Lorenz, R.; Senoner, J.; Sihn, W.; Netland, T. Using Process Mining to Improve Productivity in Make-to-Stock Manufacturing. Int. J. Prod. Res. 2021, 59, 4869–4880. [Google Scholar] [CrossRef]
- Neubauer, T.R.; da Silva, V.F.; Fantinato, M.; Peres, S.M. Resource Allocation Optimization in Business Processes Supported by Reinforcement Learning and Process Mining. In Intelligent Systems; BRACIS 2022; Lecture Notes in Computer Science; Xavier-Junior, J.C., Rios, R.A., Eds.; Springer: Cham, Switzerland, 2022; Volume 13653, pp. 580–595. [Google Scholar] [CrossRef]
- Kintsakis, A.M.; Psomopoulos, F.E.; Mitkas, P.A. Reinforcement Learning-Based Scheduling in a Workflow Management System. Eng. Appl. Artif. Intell. 2019, 81, 94–106. [Google Scholar] [CrossRef]
- Jacobi, C.; Meier, M.; Herborn, L.; Furmans, K. Maturity Model for Applying Process Mining in Supply Chains: Literature Overview and Practical Implications. Logist. J. Proc. 2020, 16, 1–16. Available online: https://proc.logistics-journal.de/article/view/978/954 (accessed on 12 July 2025).
Disclaimer/Publisher’s Note: The statements, opinions and data contained in all publications are solely those of the individual author(s) and contributor(s) and not of MDPI and/or the editor(s). MDPI and/or the editor(s) disclaim responsibility for any injury to people or property resulting from any ideas, methods, instructions or products referred to in the content. |
© 2025 by the authors. Licensee MDPI, Basel, Switzerland. This article is an open access article distributed under the terms and conditions of the Creative Commons Attribution (CC BY) license (https://creativecommons.org/licenses/by/4.0/).