Abstract
As a globally renowned alpine gorge region and seismically active zone, the eastern margin of the Qinghai–Tibet Plateau (QTP) is highly prone to landslide dam formation. Considering unstable landslide dams often pose catastrophic risks to downstream areas, current research on landslide dams along QTP primarily focuses on the breach mechanisms of unstable dams, while studies on the formation mechanisms of stable landslide dams—which can provide multiple benefits to downstream regions—remain limited. This paper selected the Conaxue Co landslide dam on the eastern margin of the QTP as one case example. Field investigation, sampling, numerical simulation, and comprehensive analysis were carried out to disclose its formation mechanisms. Field investigation shows that the Conaxue Co landslide dam was formed by a high-speed long-runout landslide blocking the river, with its structure exhibiting a typical inverse grading pattern characterized by coarse-grained rock overlying fine-grained layers. The inverse grading structure plays a critical role in the stability of the Conaxue Co landslide dam. On one hand, the coarse, hard rock boulders in the upper dam mitigate fluvial erosion of the lower fine-grained sediments. On the other hand, the fine-grained layer in the lower dam acts as a relatively impermeable aquitard, preventing seepage of dammed lake water. Additionally, the step-pool system formed in the spillway of the Conaxue Co landslide dam contributes to the protection of the dam structure by dissipating 68% of the river’s energy (energy dissipation rate η = 0.68). Understanding the formation mechanisms of the Conaxue Co landslide dam can provide critical insights into managing future landslide dams that may form in the QTP, both in emergency response and long-term strategies.
1. Introduction
Landslide dam formation and stability represent a globally significant research theme in geological hazard mitigation, involving complex interactions between tectonic, geomorphic, and climatic processes [1,2]. This phenomenon is exceptionally prevalent in active orogenic zones. Since the Cenozoic, the collision between the Indian and Eurasian Plates has driven lateral extrusion of the eastern Qinghai–Tibet Plateau (QTP) margin toward the Yangtze Block. The resultant compressional transition zone exhibits complex fault systems, frequent strong earthquakes [3,4,5], and intense fluvial dissection that forms steep alpine valleys [6,7]. Under these coupled endogenic and exogenic dynamics, river blockages by landslides frequently generate numerous landslide dams.
Historical research has predominantly focused on unstable dams due to catastrophic consequences, exemplified by events like the 1786 Mogangling dam failure [8,9], 2000 Yigong Tsangpo breach [10,11], and 2018 Jinsha River blockage [12,13,14,15]. Contrastingly, stable landslide dams—which persist long-term without failure—remain understudied despite their geomorphic and ecological significance [16,17]. While stable dams are widespread across the QTP, their formation mechanisms remain poorly understood, with current research primarily addressing spatial distributions rather than causative processes [16,17].
To address this knowledge gap, we investigate the Cuona Xuecuo landslide dam—a representative stable dam on the eastern QTP margin—through integrated field investigations, numerical simulations, and geotechnical analyses. This study aims to (1) decipher structural controls enabling long-term stability, (2) establish a mechanistic framework for stable dam formation, and (3) provide practical insights for regional dam management.
2. Regional Geological Background
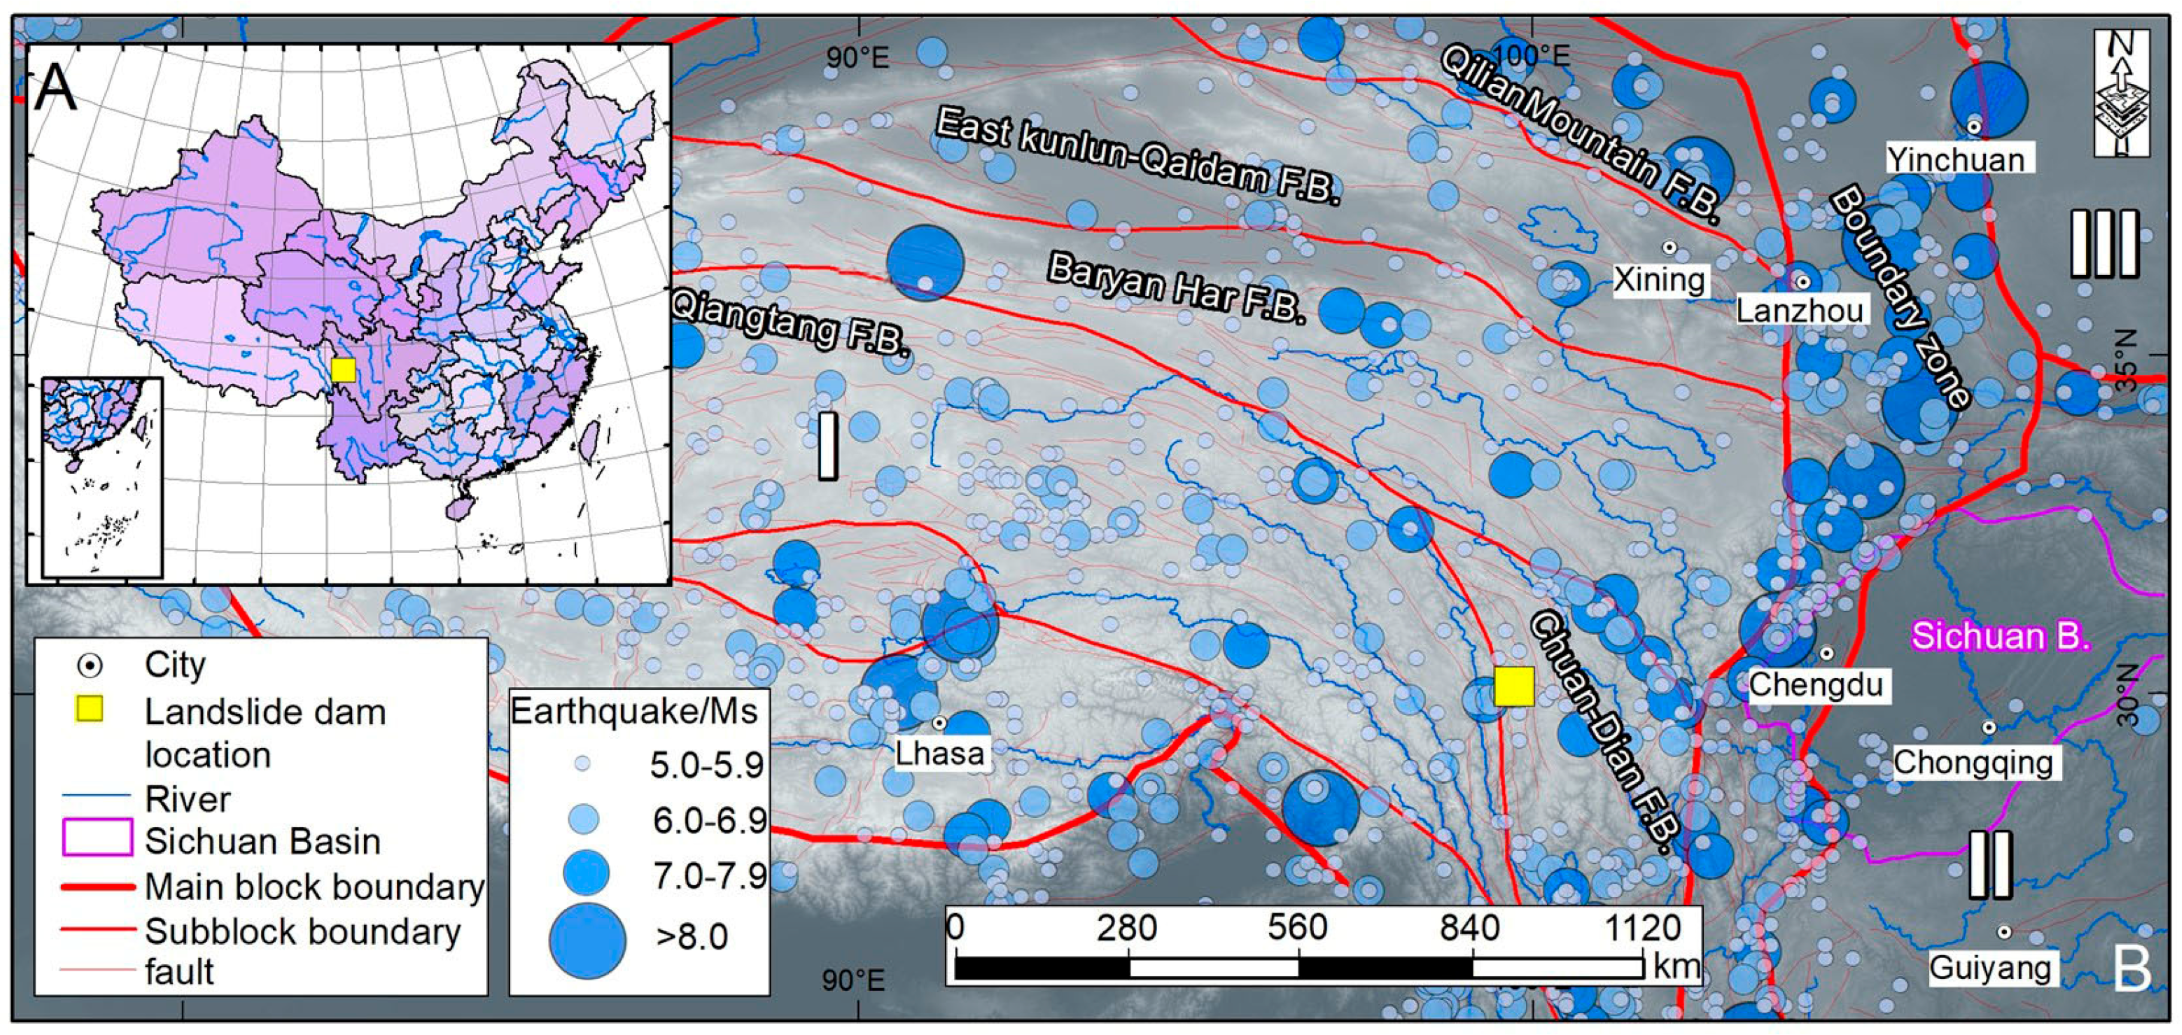
The Conaxue Co landslide dam is located in Lieyi Township, Batang County of the Garzê Tibetan Autonomous Prefecture, Sichuan Province, China. Its geographic coordinates are 99°31′56.6″ E and 30°11′54.6″ N. The study area is located within the QTP and is a crucial region for studying the uplift mechanism of the QTP (Figure 1). The Batang area is positioned at the junction of two primary fault blocks: the Qiangtang fault block (Qiangtang F.B.) and the Chuan-Dian fault block (Chuan-Dian F.B.), as illustrated in Figure 1. This junction constitutes a structurally active zone where intense tectonic movements can readily trigger strong earthquakes (Figure 1). For example, both the 1973 Ms 7.6 Luhuo earthquake and the 2010 Ms7.1 Yushu earthquake occurred at the junction zone between these two blocks [18,19].
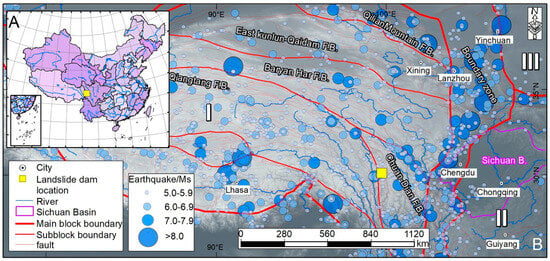
Figure 1.
Regional geological background of the landslide dam. (A)—Nationwide base map; (B)—geological background of the landslide dam. I—Qinghai–Tibet block; II—Yangzi block; III—North China block.
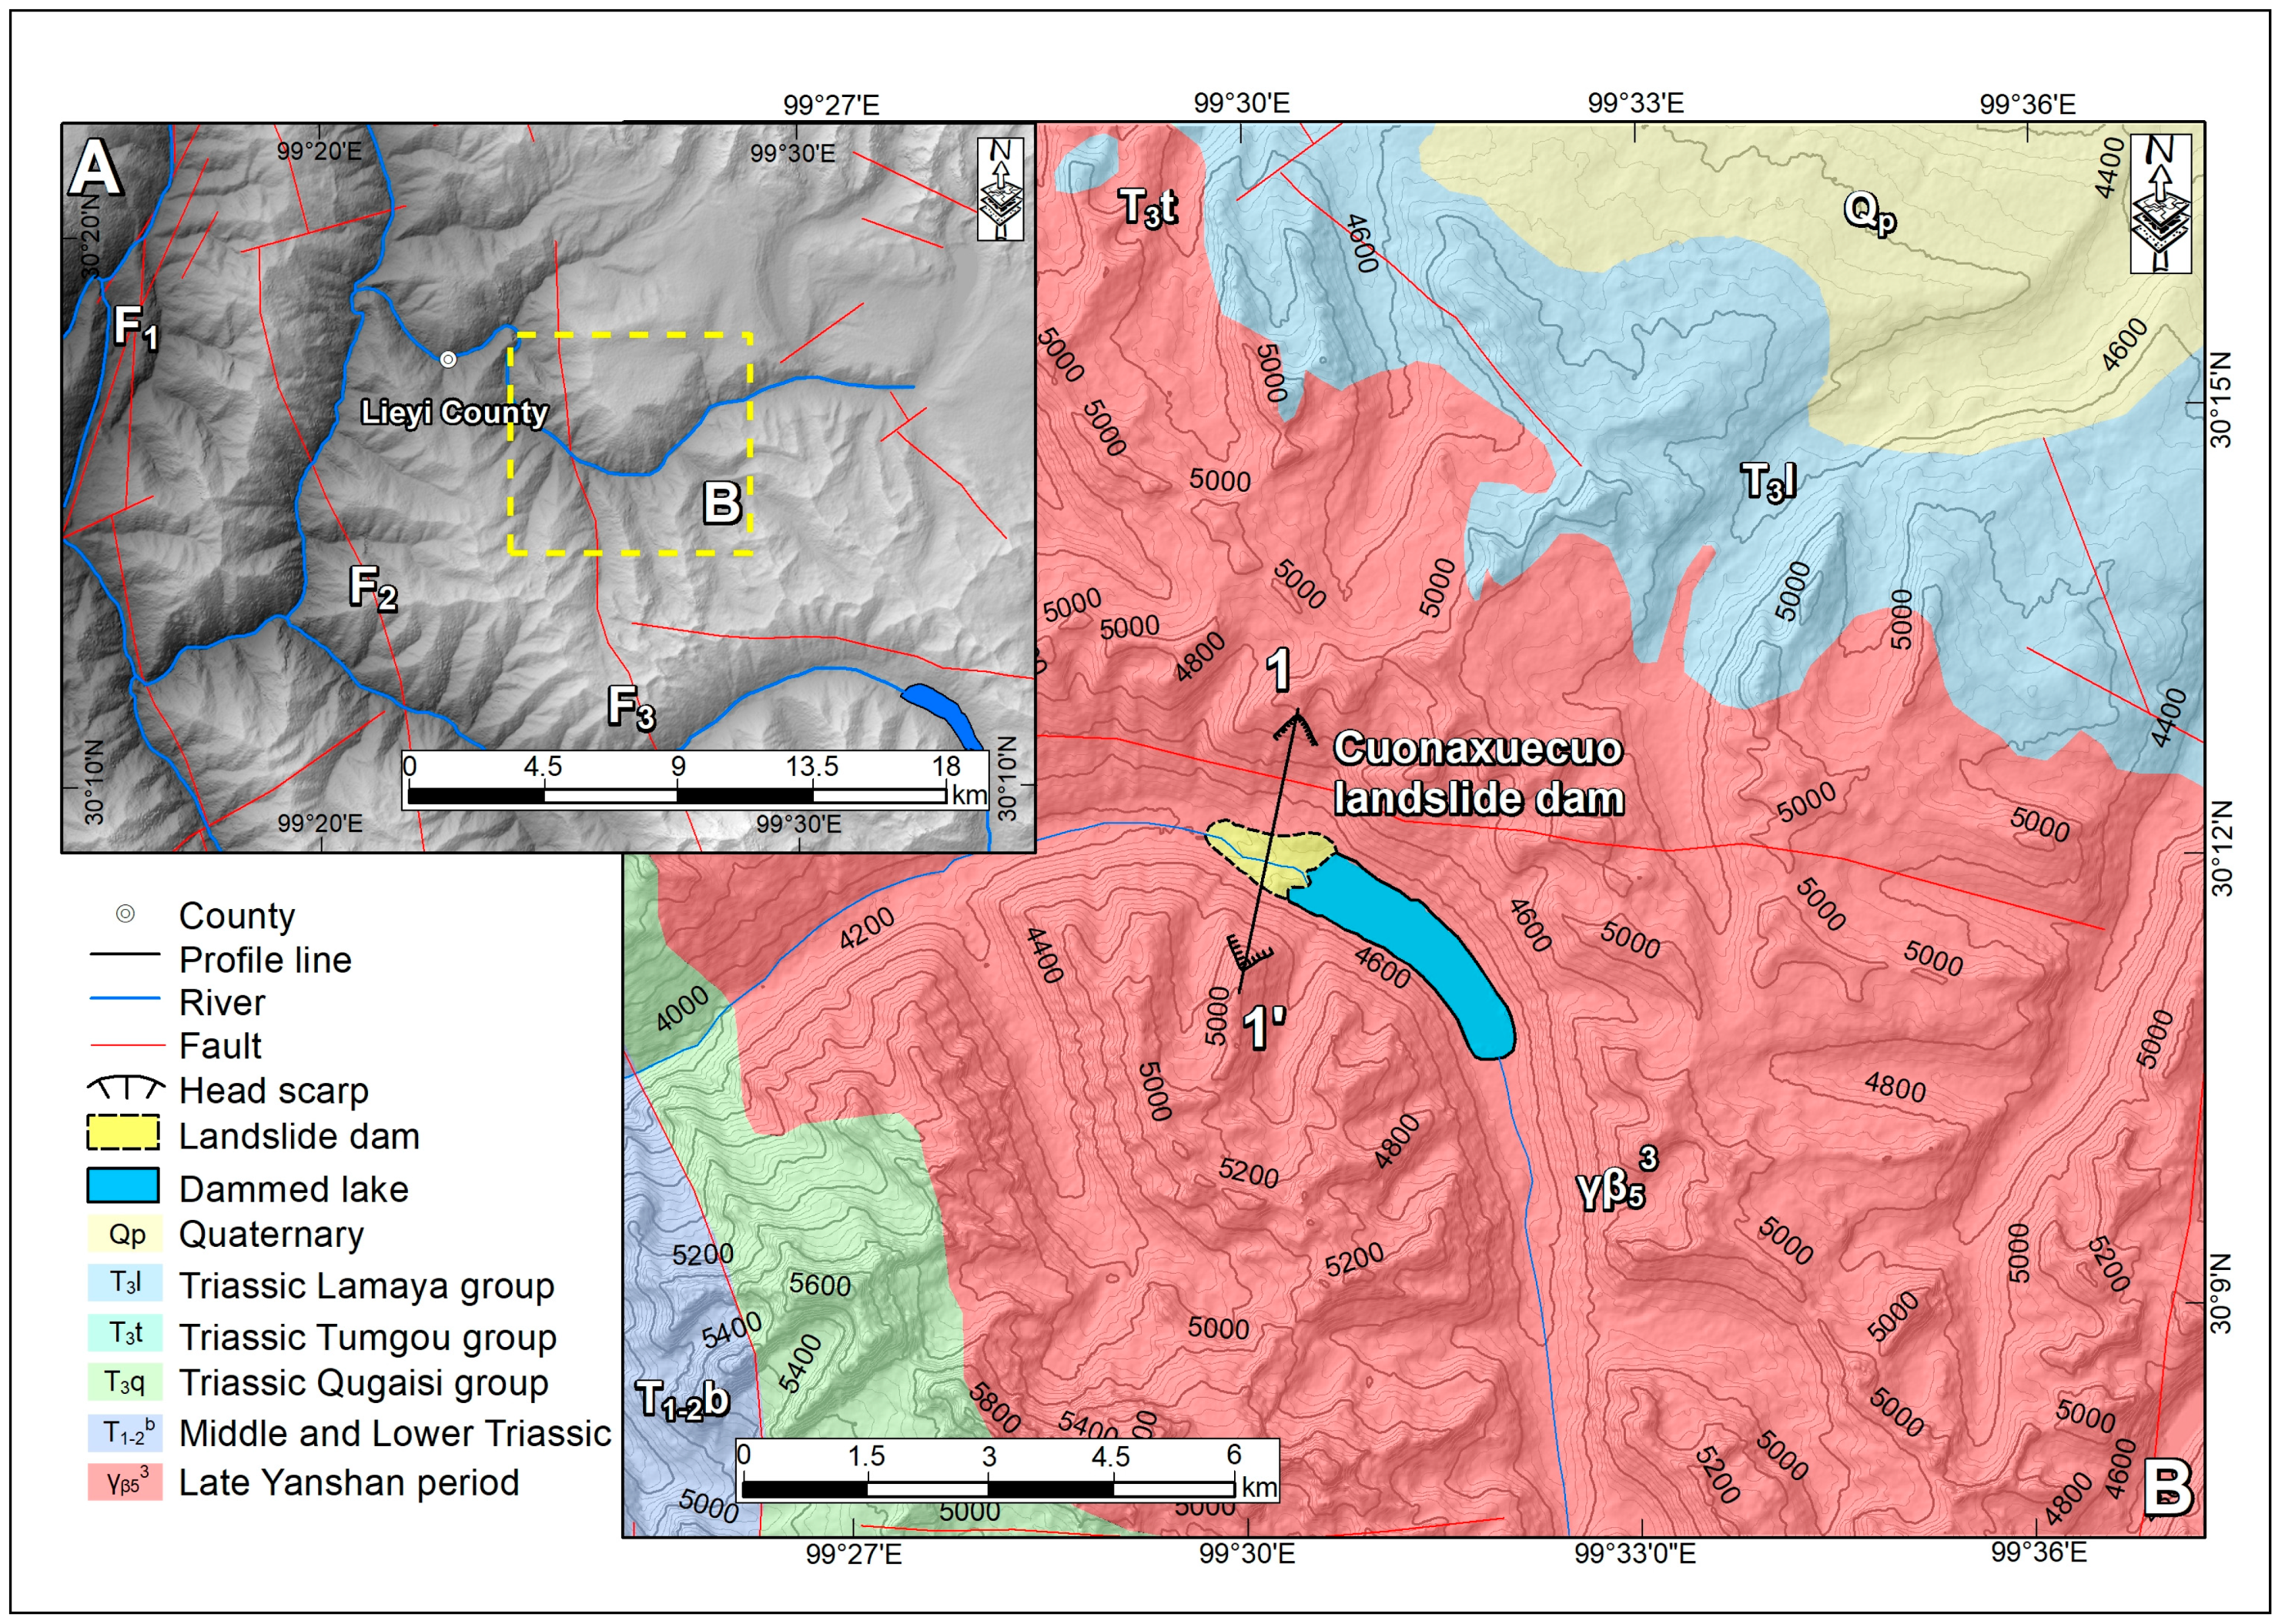
The Conaxue Co landslide dam is structurally situated at the convergent junction between the Sanjiang Orogenic Belt and the Songpan-Garzê orogenic belt. Regional crustal deformation in this area is dominantly governed by three active faults: a NE-striking dextral strike-slip fault (Batang Fault; slip rate of 2.8 ± 0.3 mm/yr), a NNW-striking thrust fault (Changgai-Namakuo fault; dip angle of 45° SE), and a N-striking normal fault (Chalong-Ranbu fault; vertical displacement of >150 m since Late Pleistocene; Figure 2A). The exposed strata in the study area, from oldest to youngest, include late Yanshanian (), Triassic (T), and Quaternary (Q) formations. Among them, the Late Yanshanian () strata are predominantly composed of granite, while the Triassic (T) strata primarily consist of metamorphic sandstone and slate. The strata that formed the source area of the Conaxue Co landslide dam slide are primarily late Yanshanian granite (Figure 2B).
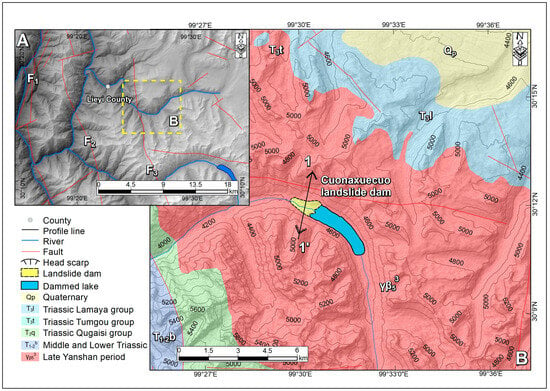
Figure 2.
Geological map of the study area. (A)—Main fault of the study area; (B)—geological map of the Conaxue Co landslide dam; F1—Batang fault; F2—Changgai-namakuo fault; F3—Chalong-ranbu fault.
3. Methodology
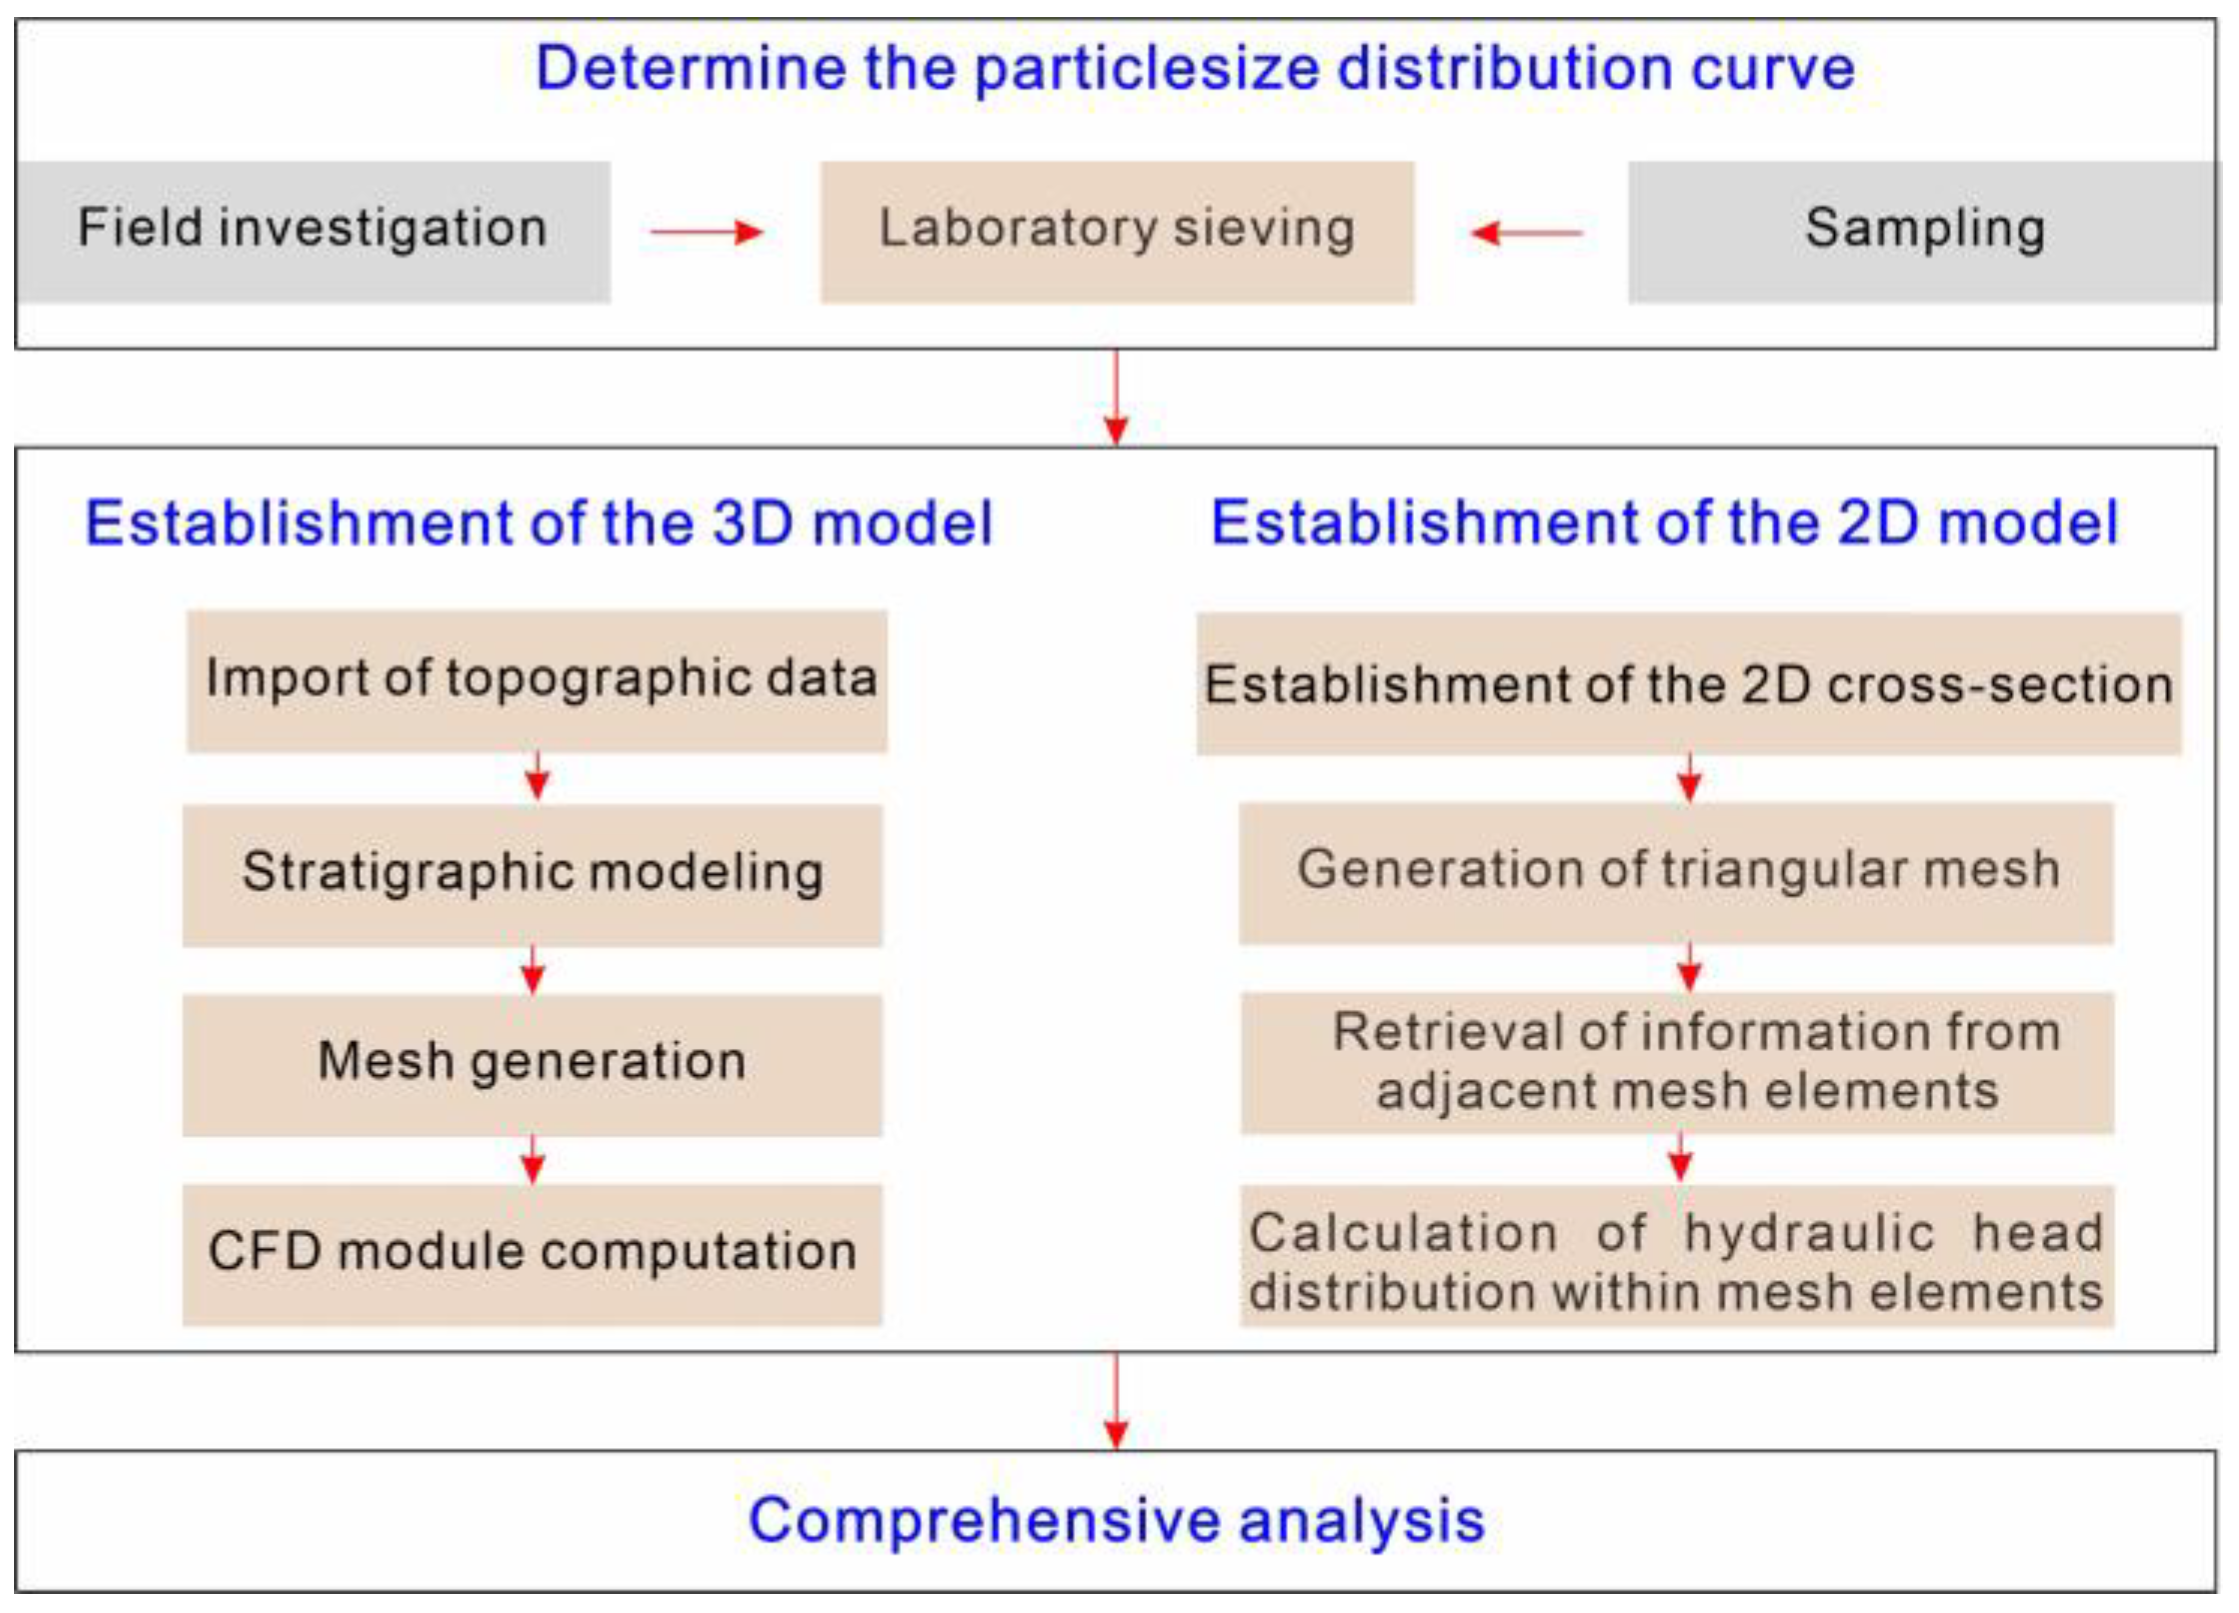
To investigate the formation mechanism of the Conaxue Co landslide dam, this study employed field investigation, numerical simulation, and comprehensive analysis. The flowchart of the whole methodology is shown in Figure 3.
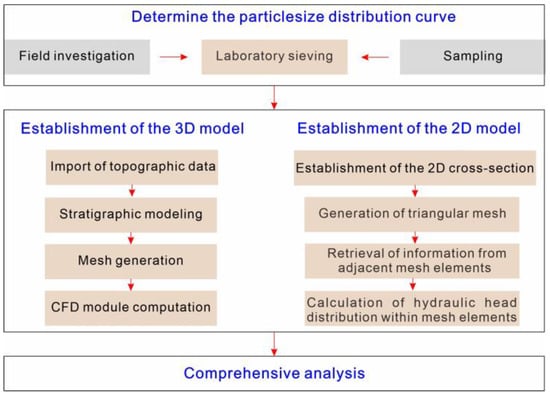
Figure 3.
The flowchart of the entire methodology.
3.1. Field Investigation and Laboratory Sieving
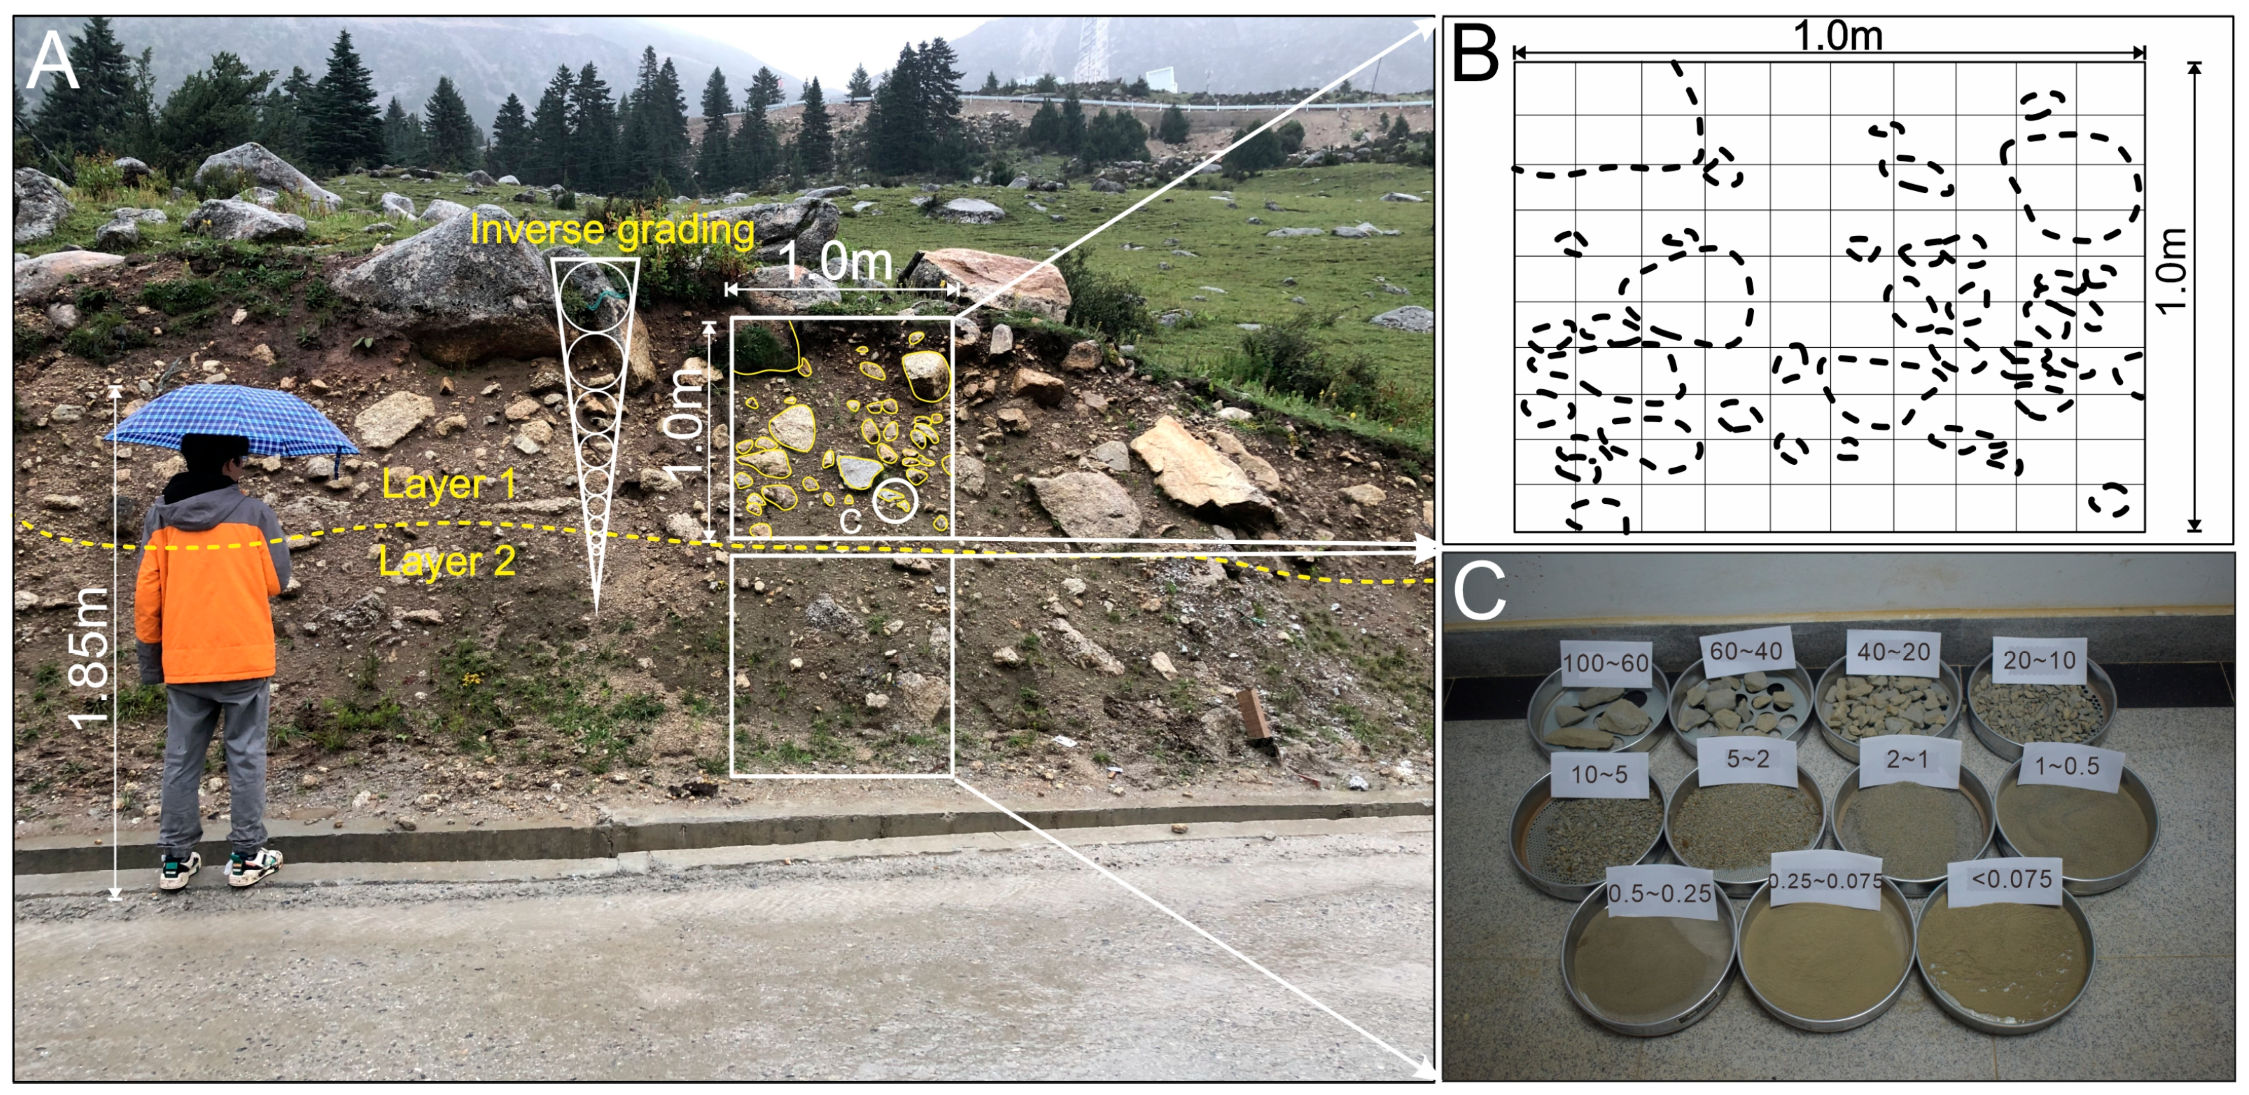
Numerous studies have demonstrated that the stability of landslide dams is closely related to their structural configurations. To investigate the relationship between the dam structure and the formation mechanisms of the Conaxue Co landslide dam, a comprehensive field investigation was conducted. Based on the particle size distribution characteristics of the dam materials, this study focused on a typical profile exposed by highway excavation on the dam body. An approach that integrates the sampling-area frequency method and traditional laboratory sieving method was employed to conduct a quantitative analysis of the dam structure.
The sampling-area frequency method was utilized for rock blocks with particle sizes greater than 100 mm. The specific steps are as follows: First, the profile was divided based on the overall particle size of typical landslide dam profiles. The selected typical profile in this study was divided into two layers: the upper layer (Layer 1) and the lower layer (Layer 2; Figure 4A). Second, two 1.0 m × 1.0 m square areas were identified on the Layer 1 and Layer 2 profiles, respectively. A grid with a side length of 0.1 m was used to statistically analyze the area of rock fragments larger than 100 mm within the square areas. This operation allowed for the determination of the area percentage of particles greater than 100 mm (Figure 4B).
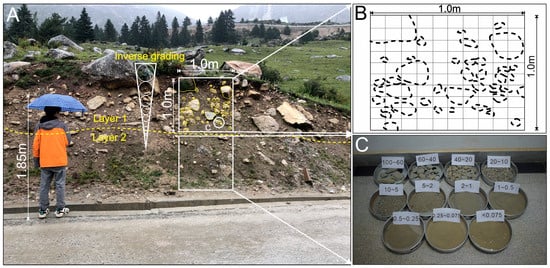
Figure 4.
The method for determining the structure of Conaxue Co landslide dam. (A)—A typical profile of Conaxue Co landslide dam; (B)—a square area was selected to determine the distribution of particles larger than 100 mm; (C)—sampling and sieving were conducted in the laboratory to determine the distribution of particles smaller than 100 mm.
The traditional laboratory sieving method was employed for gravel and rock fragments with particle sizes less than 100 mm. The specific steps are as follows: First, fine particles smaller than 100 mm were sampled from Layer 1 and Layer 2, with a minimum sampling quantity of 8 kg for each layer. Second, the samples were sieved using screens with aperture sizes of 60 mm, 40 mm, 20 mm, 10 mm, 5 mm, 0.25 mm, and 0.075 mm (Figure 4C). The mass of the samples retained on each sieve was measured to determine the percentage of particles smaller than 100 mm in each layer. Finally, the results obtained from both methods were converted using the relationship between the area-frequency method and the weight-frequency method [20]. The area percentages of each particle group in the vertical profile layers were converted into weight percentages. This yielded the cumulative vertical particle grading distribution for the typical profile of the Conaxue Co landslide dam.
3.2. Numerical Simulation
In this study, PFC3D 5.0 discrete element software was employed to reveal the formation mechanisms of the Conaxue Co landslide dam. A three-dimensional (3D) analysis was conducted to examine particle migration under seepage conditions, while a two-dimensional analysis was performed to investigate the distributions of seepage field and force chains under water flow conditions.
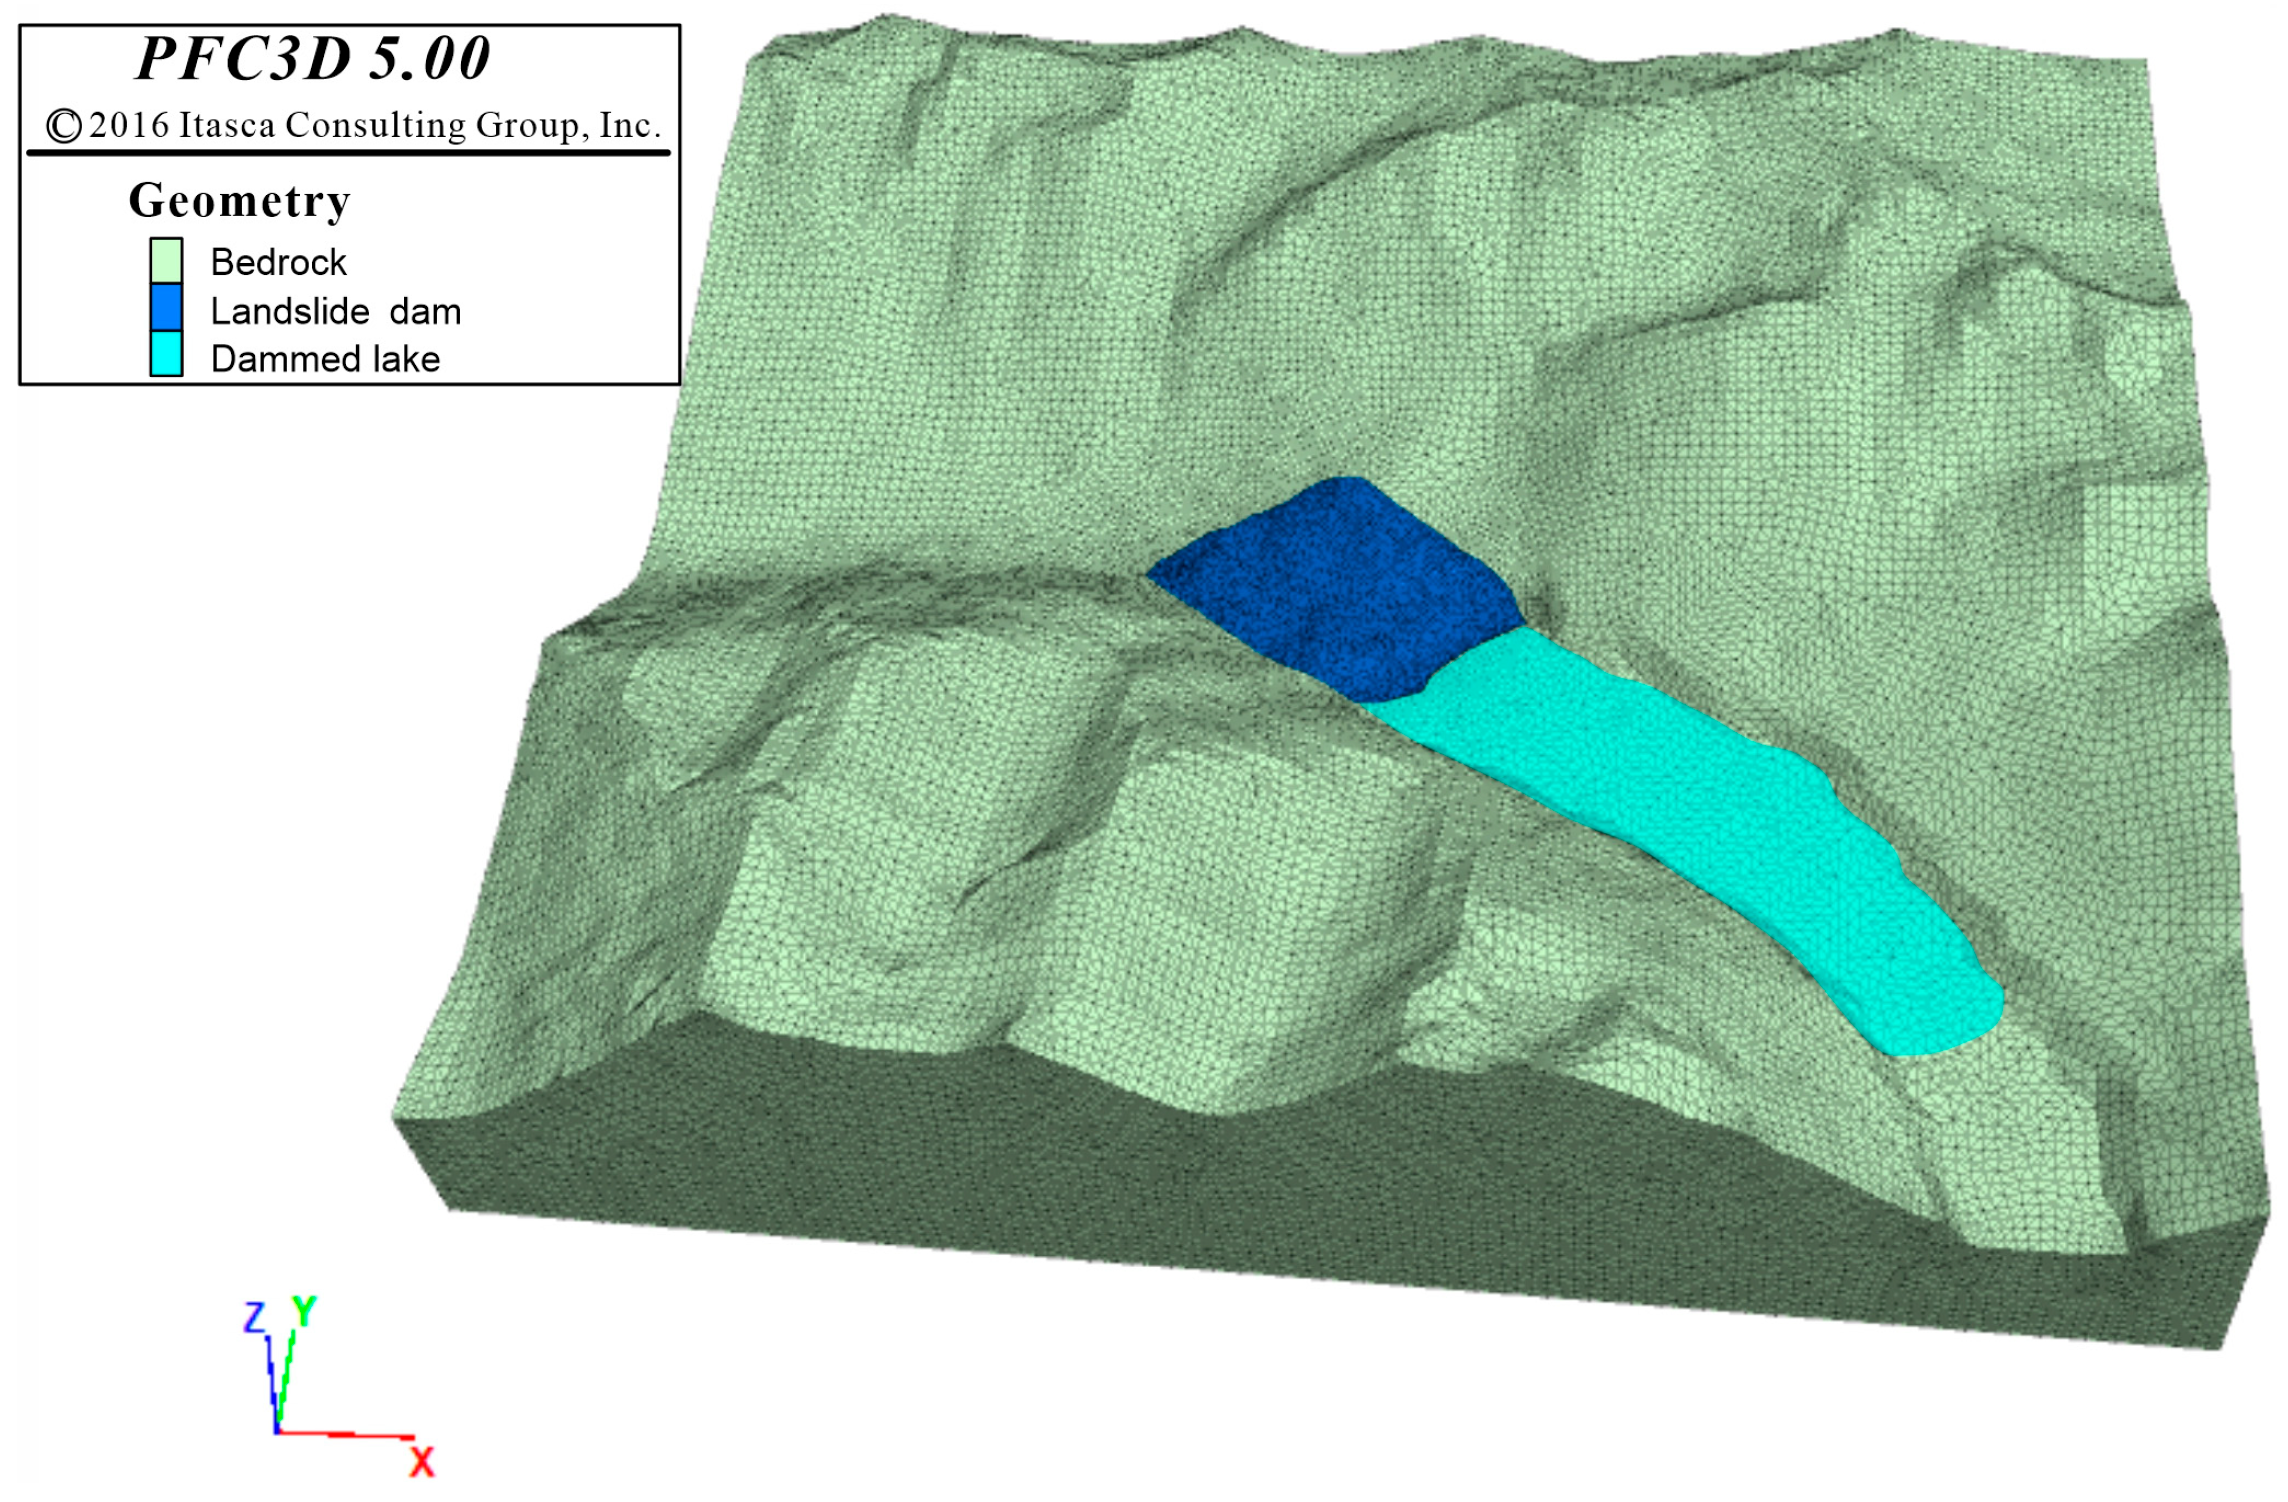
The topographic data of the landslide dam (12.5 m DEM data from https://search.asf.alaska.edu/#/, accessed on 12 December 2024) were first converted into grid format and subsequently imported into Rhinoceros 8 software. To simulate the mechanical behavior of the landslide, advanced numerical techniques were employed in the literature, in line with recent developments in slope stability analysis [21,22,23]. Subsequently, the boundaries of the dam body and bedrock were precisely delineated, and their geometric configurations were defined based on the topographic data. Given that field investigations demonstrated distinct inverse grading structure for the Conaxue Co landslide dam, the coarse-grained and fine-grained layers were differentiated during the modeling process. Rigid spherical particles were generated for each layer based on the particle size distribution obtained through field investigation and laboratory sieving. Layer 1 exhibited a porosity of 0.55, while Layer 2 had a porosity of 0.35. Given computational limitations, a total of 16,403 spherical particles were generated in the model, including 3380 in the coarse-grained layer and 13,023 in the fine-grained layer. As the Conaxue Co landslide dam originated from a high-speed and long-distance landslide deposit, the interparticle contact behavior was modeled using the Mindlin-Hertz contact model in PFC. With reference to previous model parameters [24], contact parameters were determined through trial-and-error methods and numerical tests. The finalized parameters are listed in Table 1, and the 3D particle flow model is illustrated in Figure 5.

Table 1.
Micromechanical parameters of particles and contacts used in the 3D model.
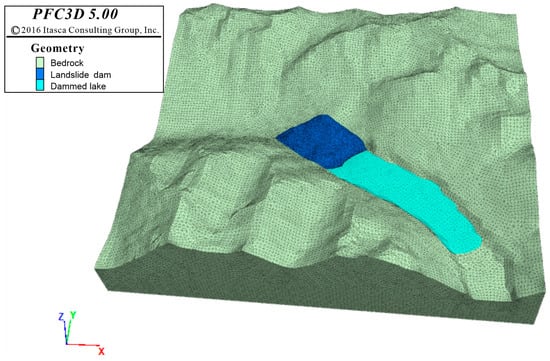
Figure 5.
Three-dimensional model of the Conaxue Co landslide dam.
To develop the 2D model, the typical longitudinal profile of the dam body and bedrock was initially created in software CAD 2024 using elevation data. The dam body was subsequently divided into a coarse-grained layer and a fine-grained layer. The outlined profiles of both dam body and bedrock were saved in STL format and imported into PFC2D software to establish the dam’s geometry. Rigid spherical particles were also generated for the coarse-grained layer and fine-grained layer based on the particle size distribution obtained from field investigation and laboratory sieving. The porosity was calculated by substituting the 2D porosity of the landslide dam into Equation (1) [25].
where is the 2D porosity of the landslide dam, and is the 3D porosity of the landslide dam. The porosities of the coarse-grained and fine-grained layers are 0.265 and 0.139, respectively. A total of 6459 particles were generated in the model, including 873 in the coarse-grained layer and 5586 in the fine-grained layer. The model has a base width of 120 m and a height of 10 m. The final 2D discrete element model of the landslide dam is presented in Figure 6. The contact model and mesoscopic parameters employed in the 2D model are consistent with those utilized in the 3D model.

Figure 6.
Two-dimensional model of the Conaxue Co landslide dam.
For the seepage component, the 2D discrete element model of the landslide dam employed a bidirectional fluid–solid coupling approach. It integrates PFC and Fipy to apply forces to particles based on the seepage governing equations. The process primarily involves the following steps: (1) generation of triangular mesh; (2) retrieval of information from adjacent mesh elements; (3) calculation of hydraulic head distribution within mesh elements. Different hydraulic heads were established at the upstream and downstream boundaries of the dam to create a hydraulic head difference within the dam body, thereby inducing seepage effects within the structure. A bidirectional fluid–solid coupling analysis was conducted to monitor key parameters, including hydraulic head distribution and contact force evolution during seepage.
4. Results
4.1. Characteristics of the Conaxue Co Landslide Dam
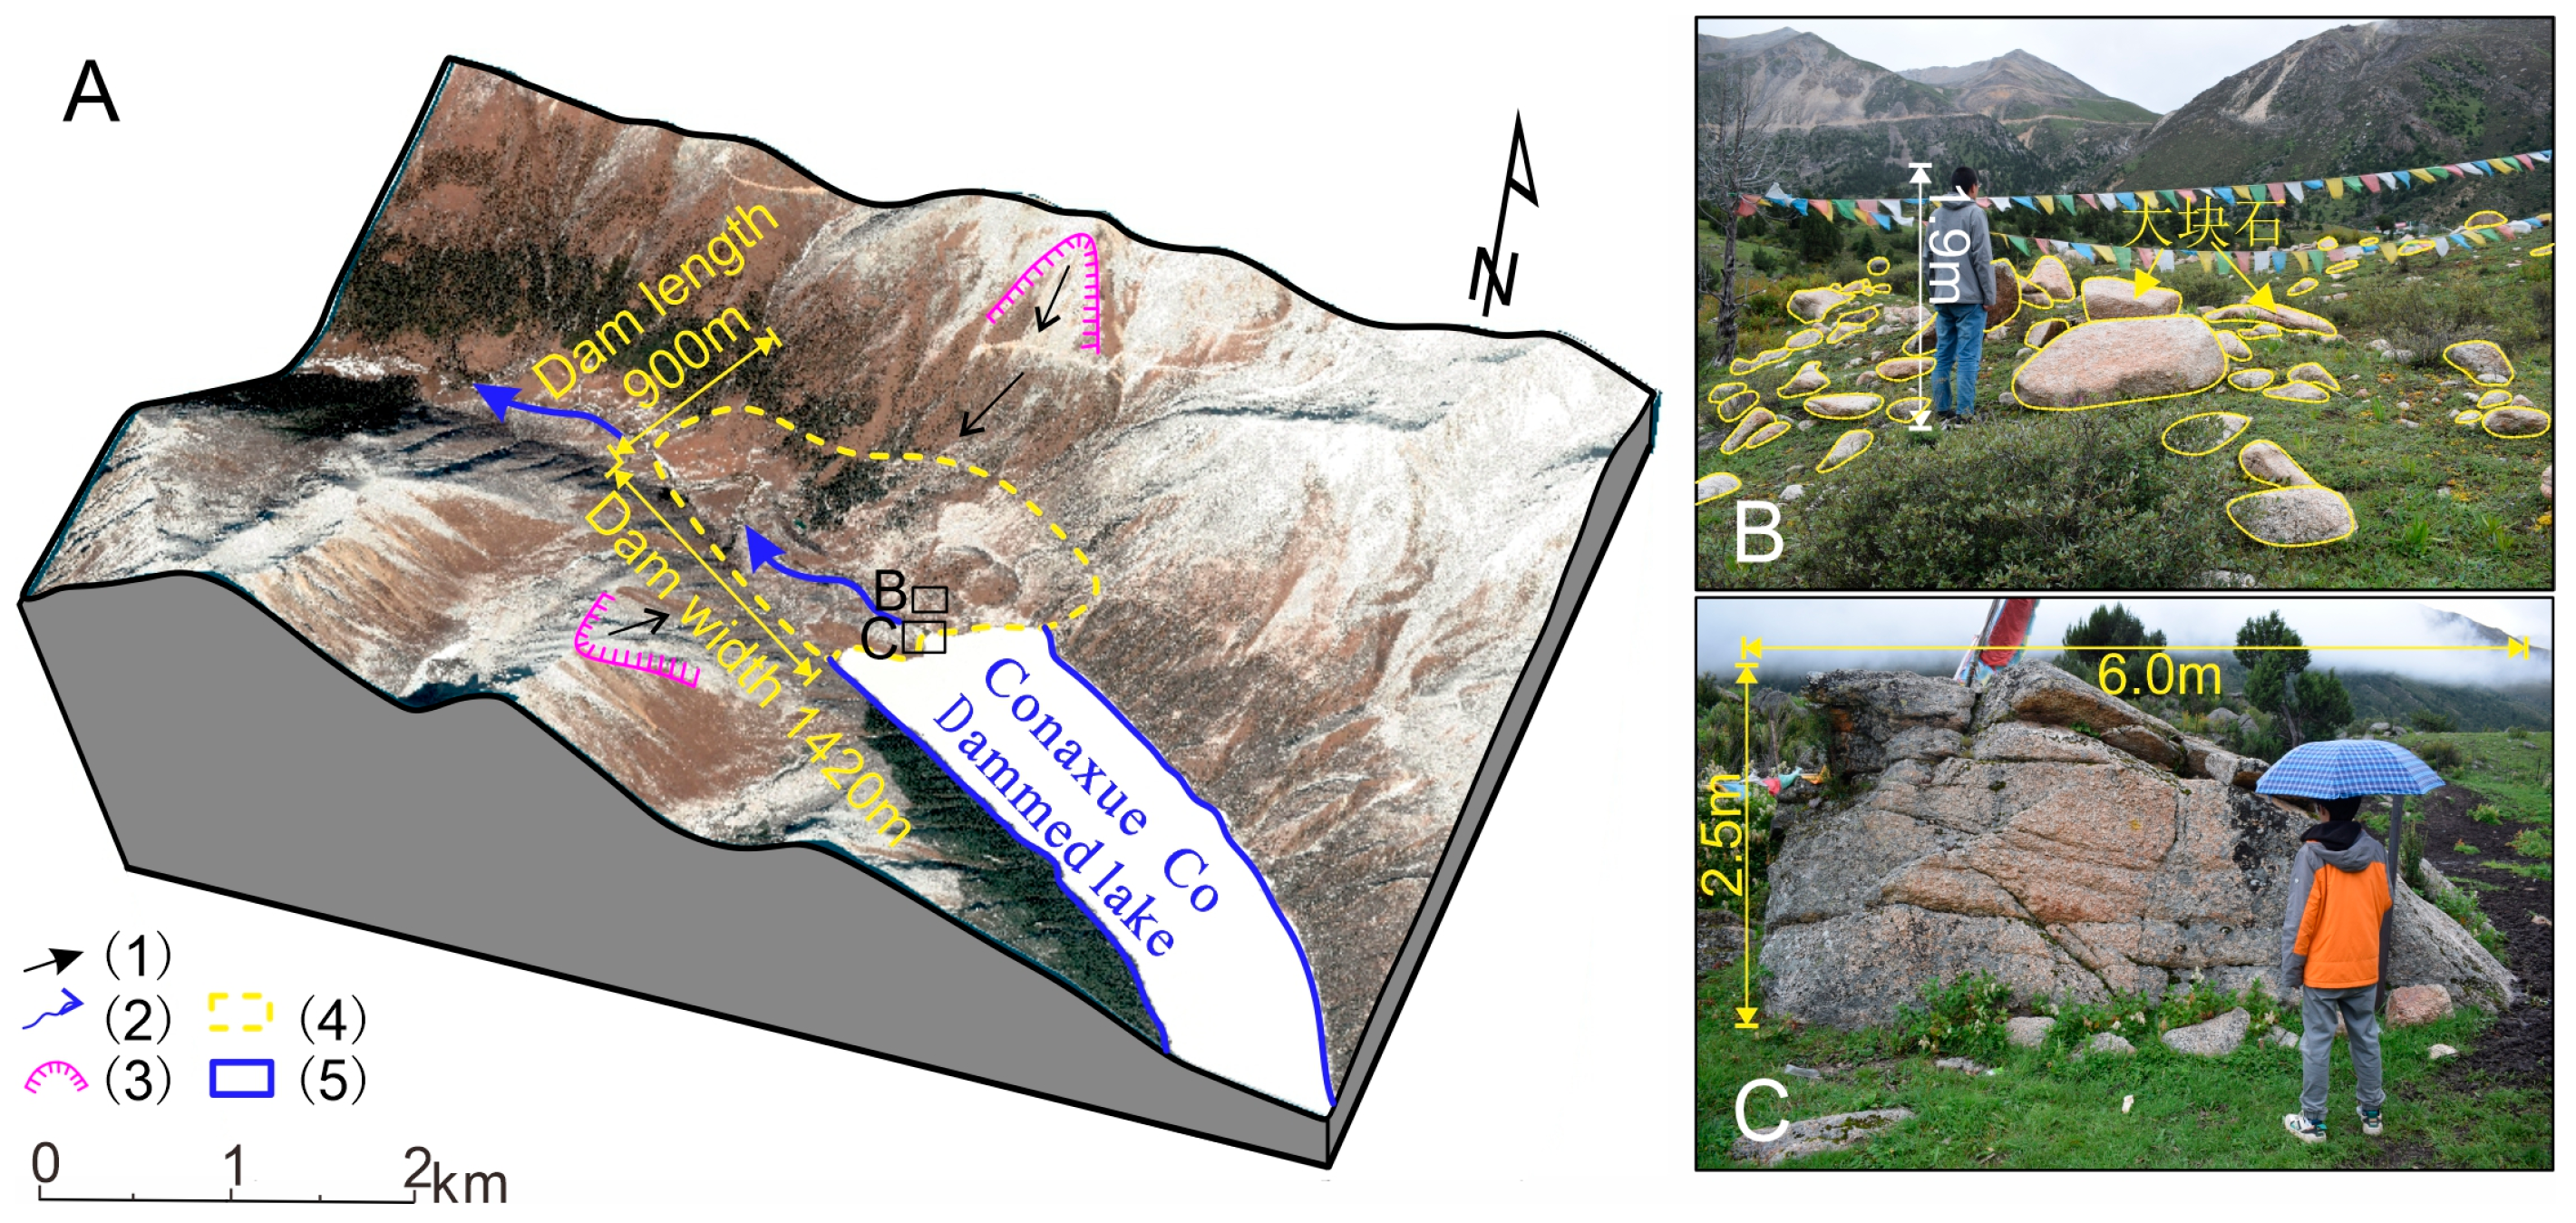
Field investigations revealed that the Conaxue Co landslide dam formed by the high-speed and long-distance movement of the biotite granite slope rock mass from the Late Yanshan period (γβ53) on both sides under strong earthquakes, ultimately resulting in a collision in the Kangrilongba gully that obstructed the river (Figure 7A). Numerous boulders resulting from this movement are distributed across the dam surface (Figure 7B), with maximum boulder sizes reaching up to 6 m (Figure 7C). The dam blocked the third-order tributary of the Jinsha River, the Kangrilongba River, with an upstream catchment area of ~69.86 km2 and an average annual runoff of ~1.5 m3/s at the dam site. Dammed lake discharges primarily through the spillway via surface runoff.
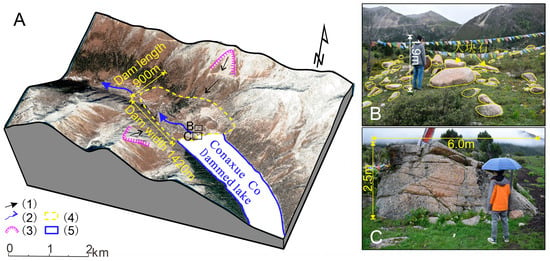
Figure 7.
Characteristics of the Conaxue Co landslide dam. (A)—Overview of the landslide dam; (B)—dense distribution of the isolated boulders on the dam surface; (C)—isolated boulder with a particle size of 6 m; (1)—direction of debris deposit movement; (2)—flow direction; (3)—scarp; (4)—landslide dam; (5)—dammed lake. (A,C) were adapted from Song et al. [17].
The Conaxue Co landslide dam features a saddle-shaped profile along the river channel, characterized by elevated sides and a lower central section. The crest topography exhibits notable variation: the left bank reaches an elevation of 4397 m, while the right bank stands at 4379 m, and the crest spillway is positioned at 4331 m (Figure 6). The dam extends approximately 1420 m along the river channel, with an upstream slope ratio of approximately 1:8 and a downstream slope ratio of 1:7. The Conaxue Co landslide dam covers an area of approximately 0.77 km2 and has a volume of about 6060 × 104 m3, classifying it as an ultra-large landslide dam.
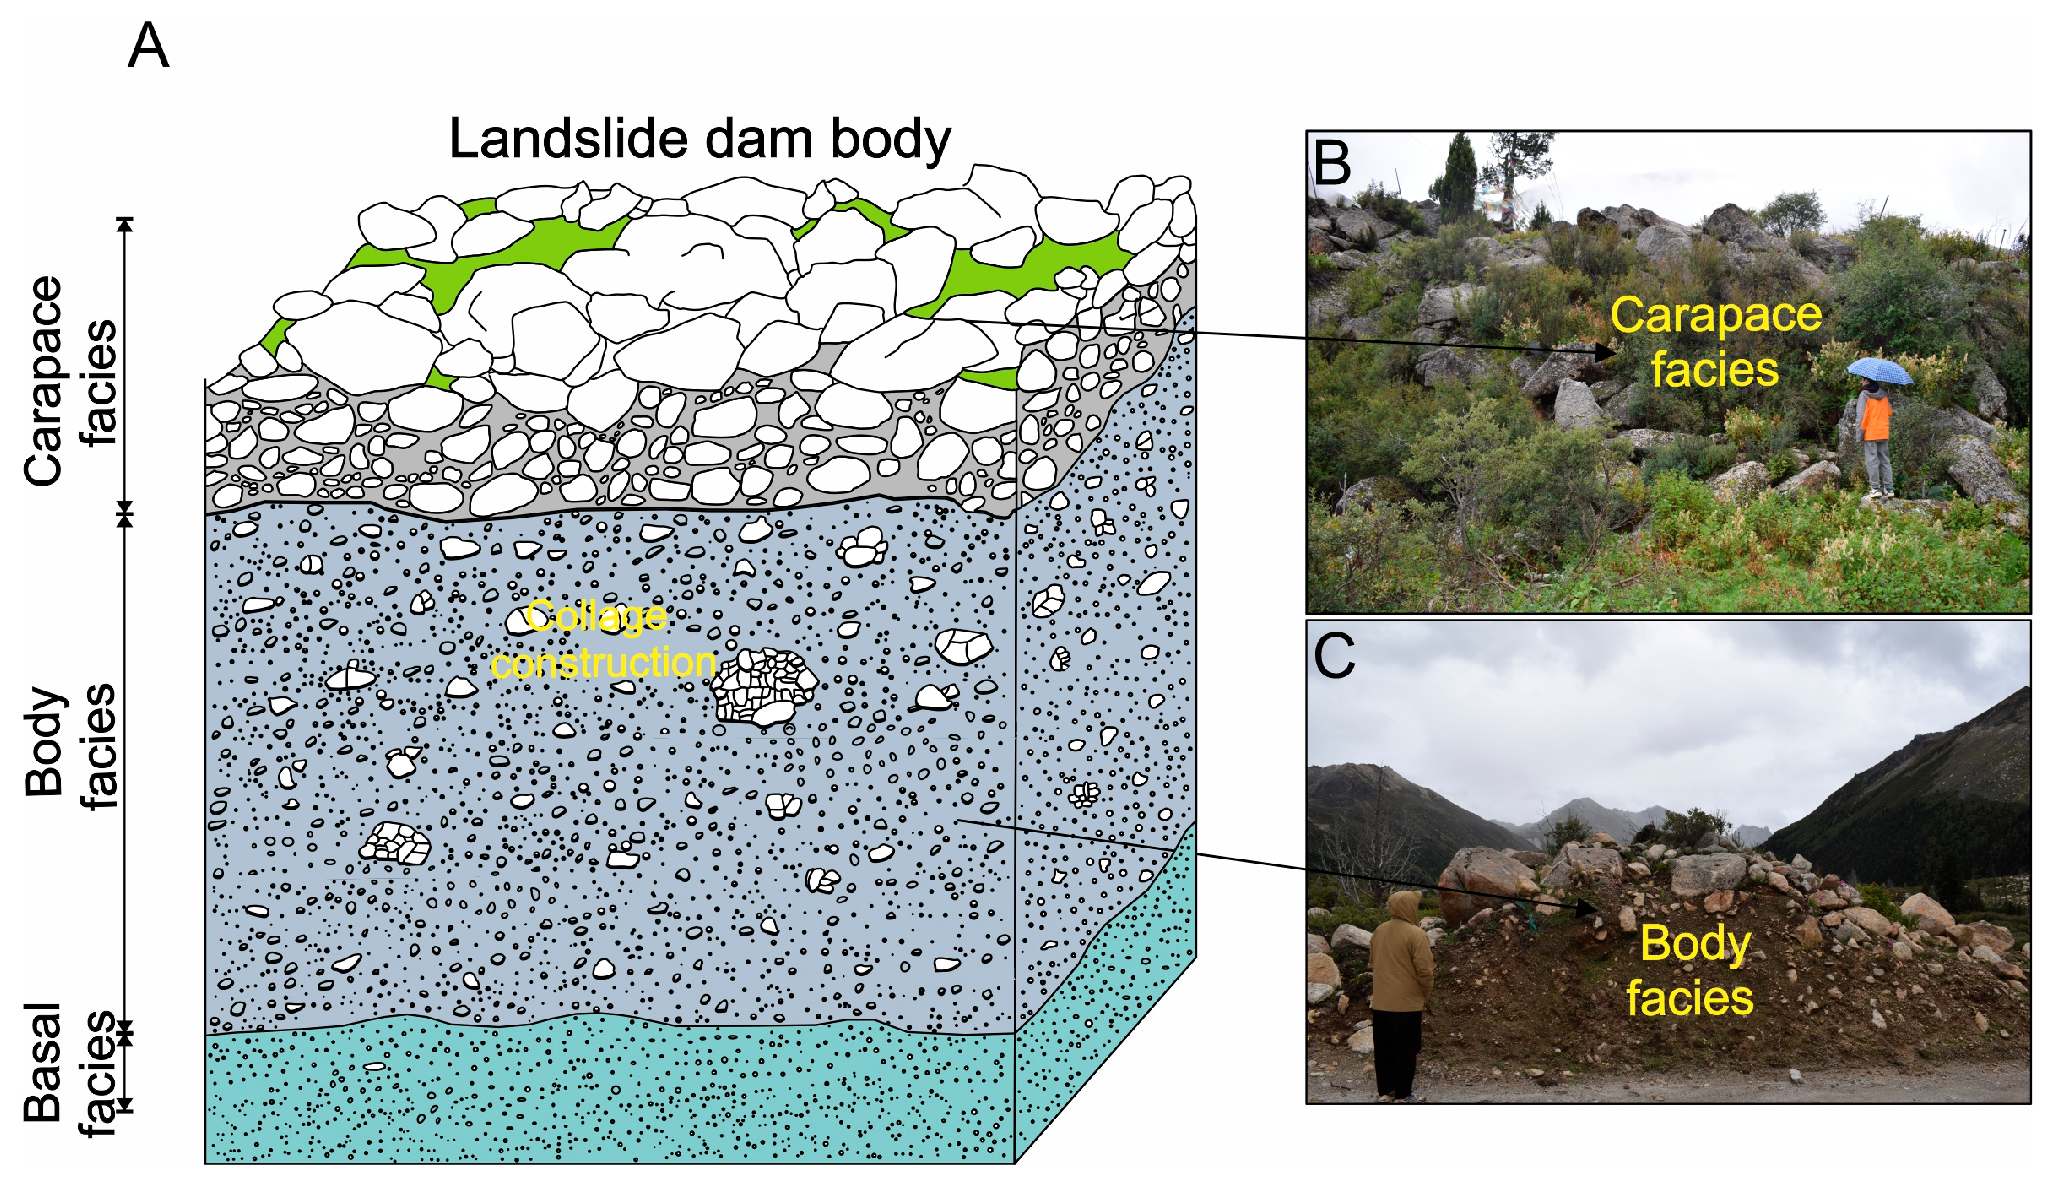
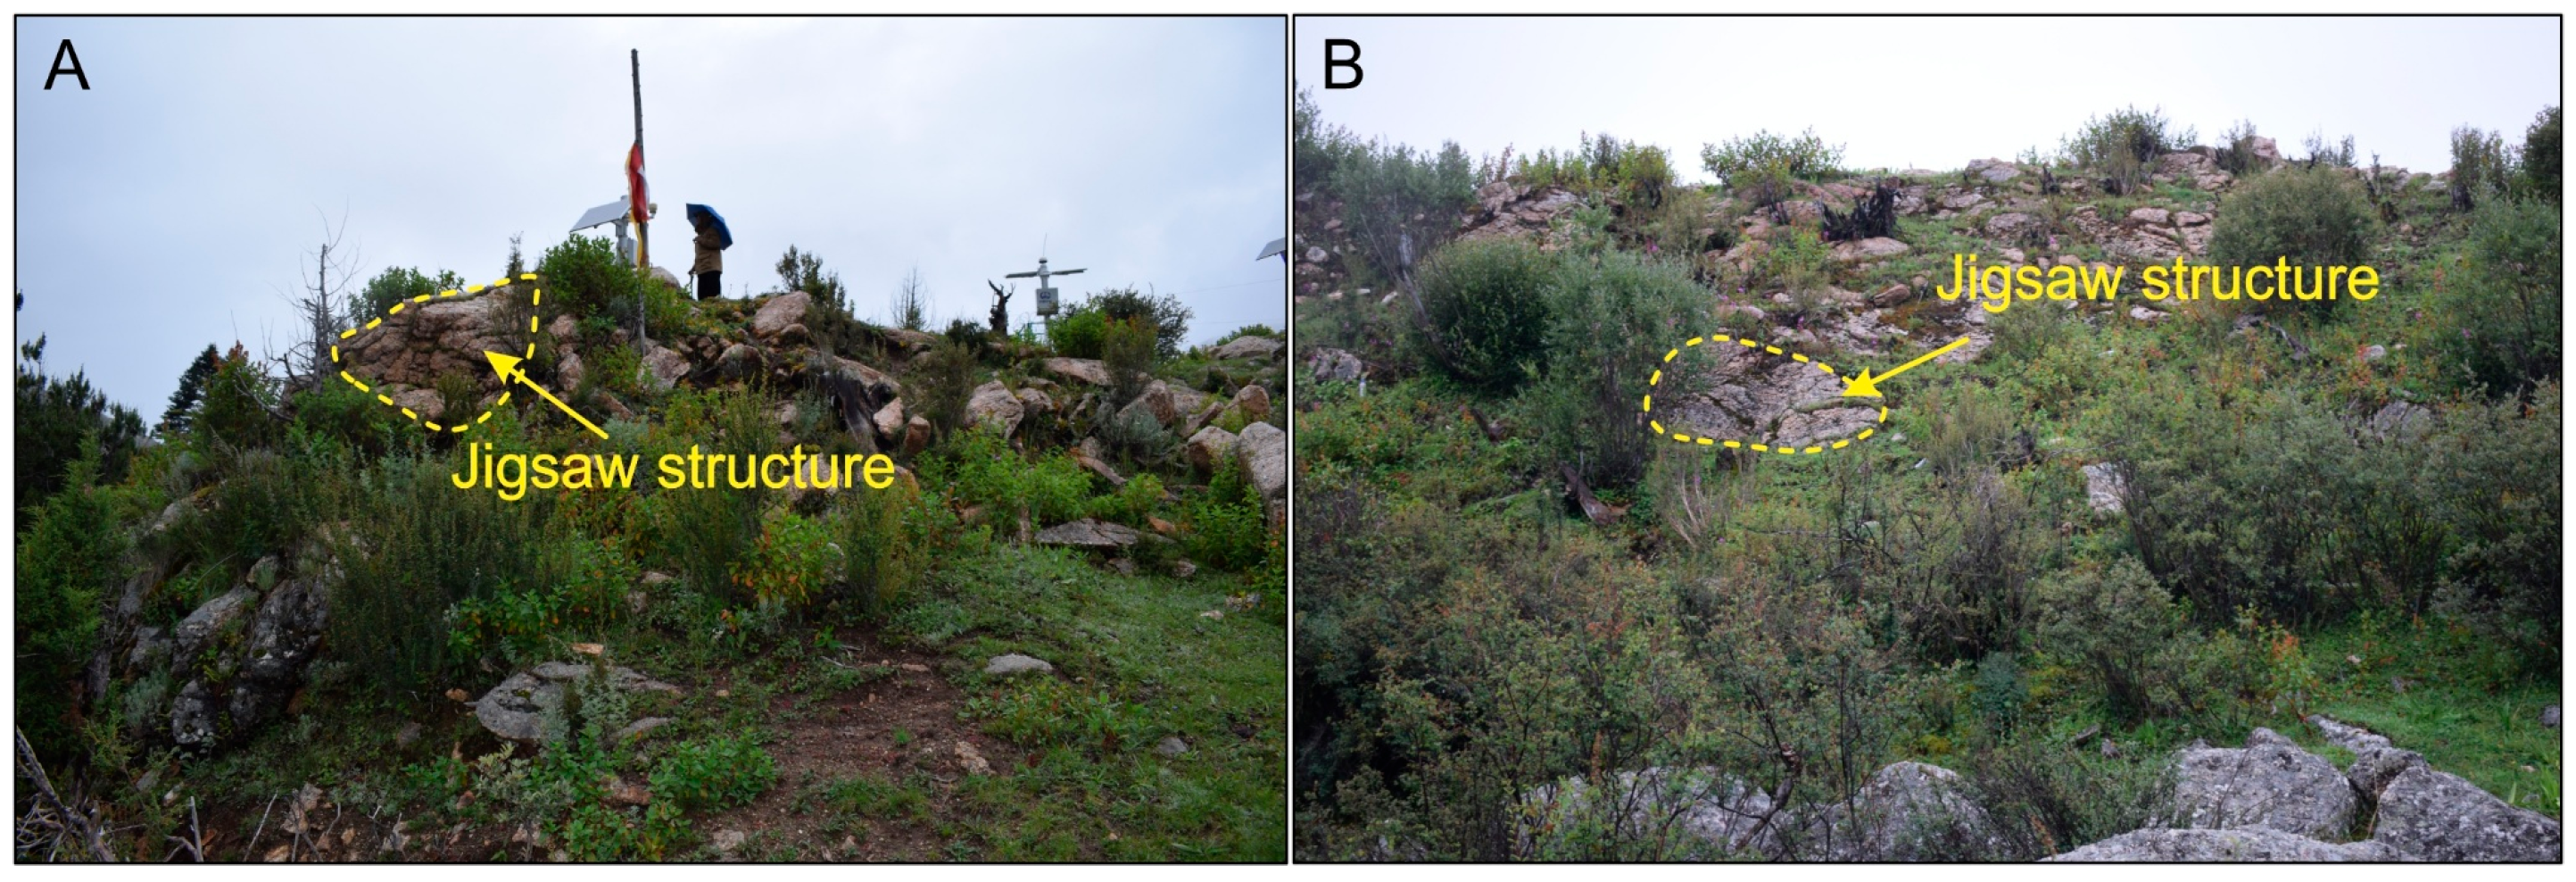
The Conaxue Co landslide dam deposit exhibits a distinct inverse grading structure (Figure 8). Specifically, the dam surface is predominantly composed of large boulders, while the lower part mainly consists of gravel, breccia, and fine-grained particles. The dam structure is characterized by a distinct carapace facies and body facies formed by a high-speed and long-distance landslide. Notably, the basal facies at the lower part remain unexposed due to limited excavation depth of the highway cutting profile. The carapace layer of the dam is predominantly composed of chaotically stacked coarse-grained materials, such as large boulders, which exhibit low matrix content and a skeleton-supported structure among particles (Figure 8B). The body facies constitute the largest portion of the dam, characterized by a marked decrease in grain size. They are predominantly composed of fine-grained materials such as gravel, coarse sand, and fine sand, which exhibit a predominantly matrix-supported fabric among particles (Figure 8C). Additionally, jigsaw structures were observed within the coarse-grained layer on the dam surface (Figure 9).
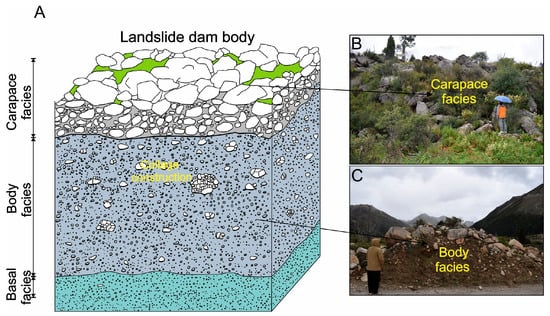
Figure 8.
Inverse grading structure of the Conaxue Co landslide dam. (A)—Schematic diagram of the dam structure; (B)—carapace facies at the dam top; (C)—body facies at the dam middle. (C) were adapted from Song et al. [17].
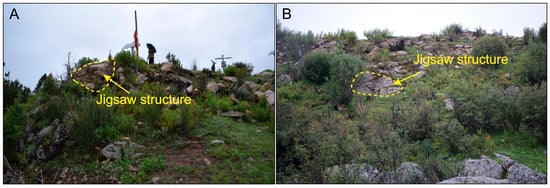
Figure 9.
Jigsaw structures on surface boulders at Conaxue Co landslide dam. (A)—the jigsaw structures of rubble stones are visible at the top of the dam body; (B)—the jigsaw structure of rubble stones is visible within the dam body.
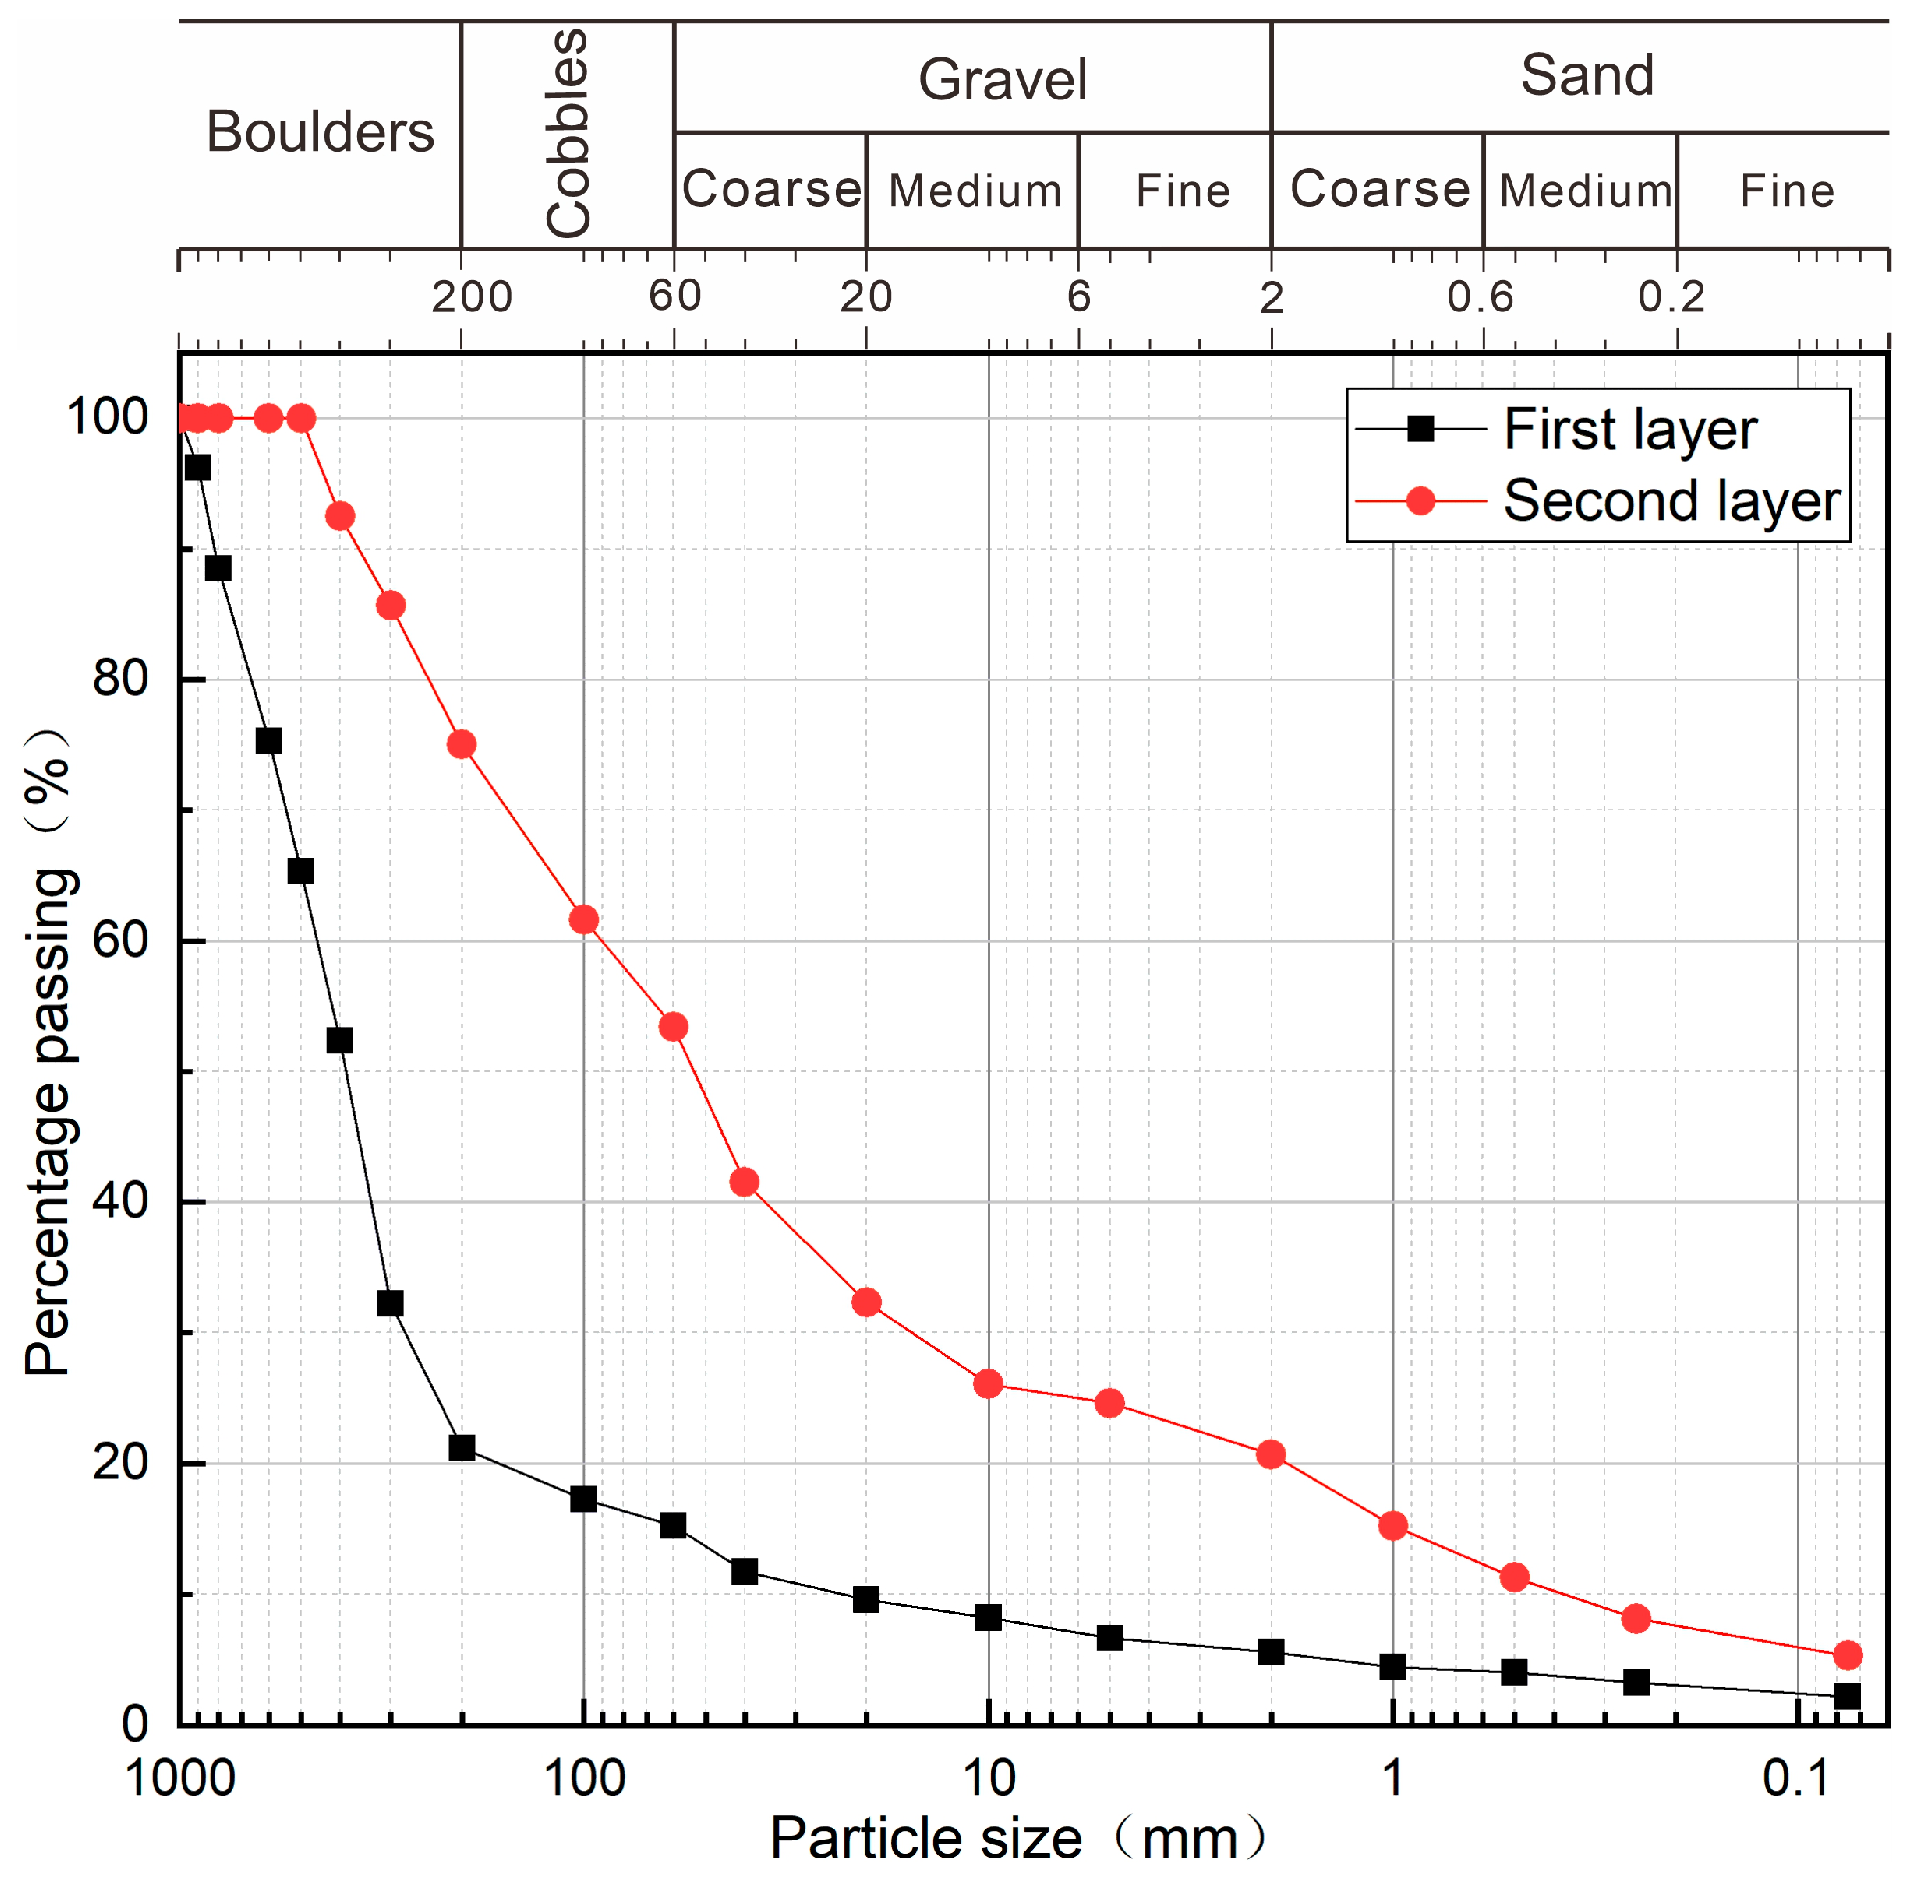
The grain composition of Layer 1 (upper layer) and Layer 2 (lower layer) in the typical profile of the Conaxue Co landslide dam exhibits a distinct left-to-right shift in the gradation curves (Figure 10). This observation quantitatively demonstrates that the structure of landslide dam exhibits pronounced vertical sorting, characterized by an upward coarsening trend in grain size along the profile. The grain size composition of each layer in the profile is specifically characterized as follows: Layer 1 deposits are predominantly composed of boulders (d > 200 mm), which account for 80%, followed by gravel (2 mm < d < 60 mm) at 10%, while crushed rock and sandy soil collectively comprise approximately 10%. Layer 2 deposits exhibit a significant reduction in blocky fragments (d > 60 mm), which drop to 47%. In this layer, boulders (d > 200 mm) account for 25%, while particles exceeding 500 mm are notably absent. Gravel (2 mm < d < 60 mm) and sandy soil constitute 33% and 20% of this layer, respectively. The particle size distribution curves of the typical landslide dam profile demonstrated that the Conaxue Co landslide dam exhibits distinct vertical zonation, characterized by a coarsening-upward structure with finer-grained materials at the base.
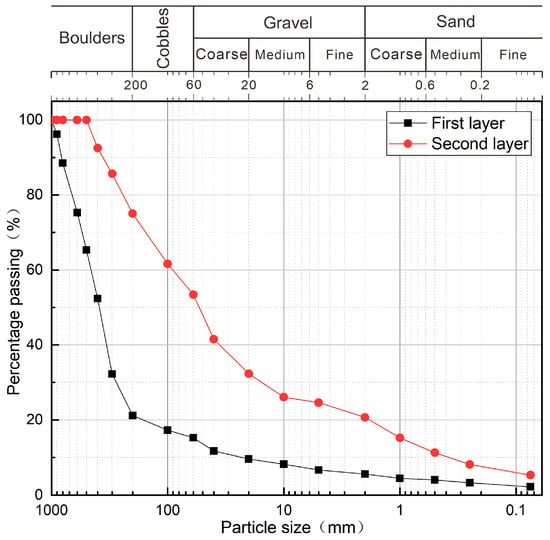
Figure 10.
Particle grading distribution of the Conaxue Co landslide dam.
4.2. Particle Transport Results of 3D Dam Model
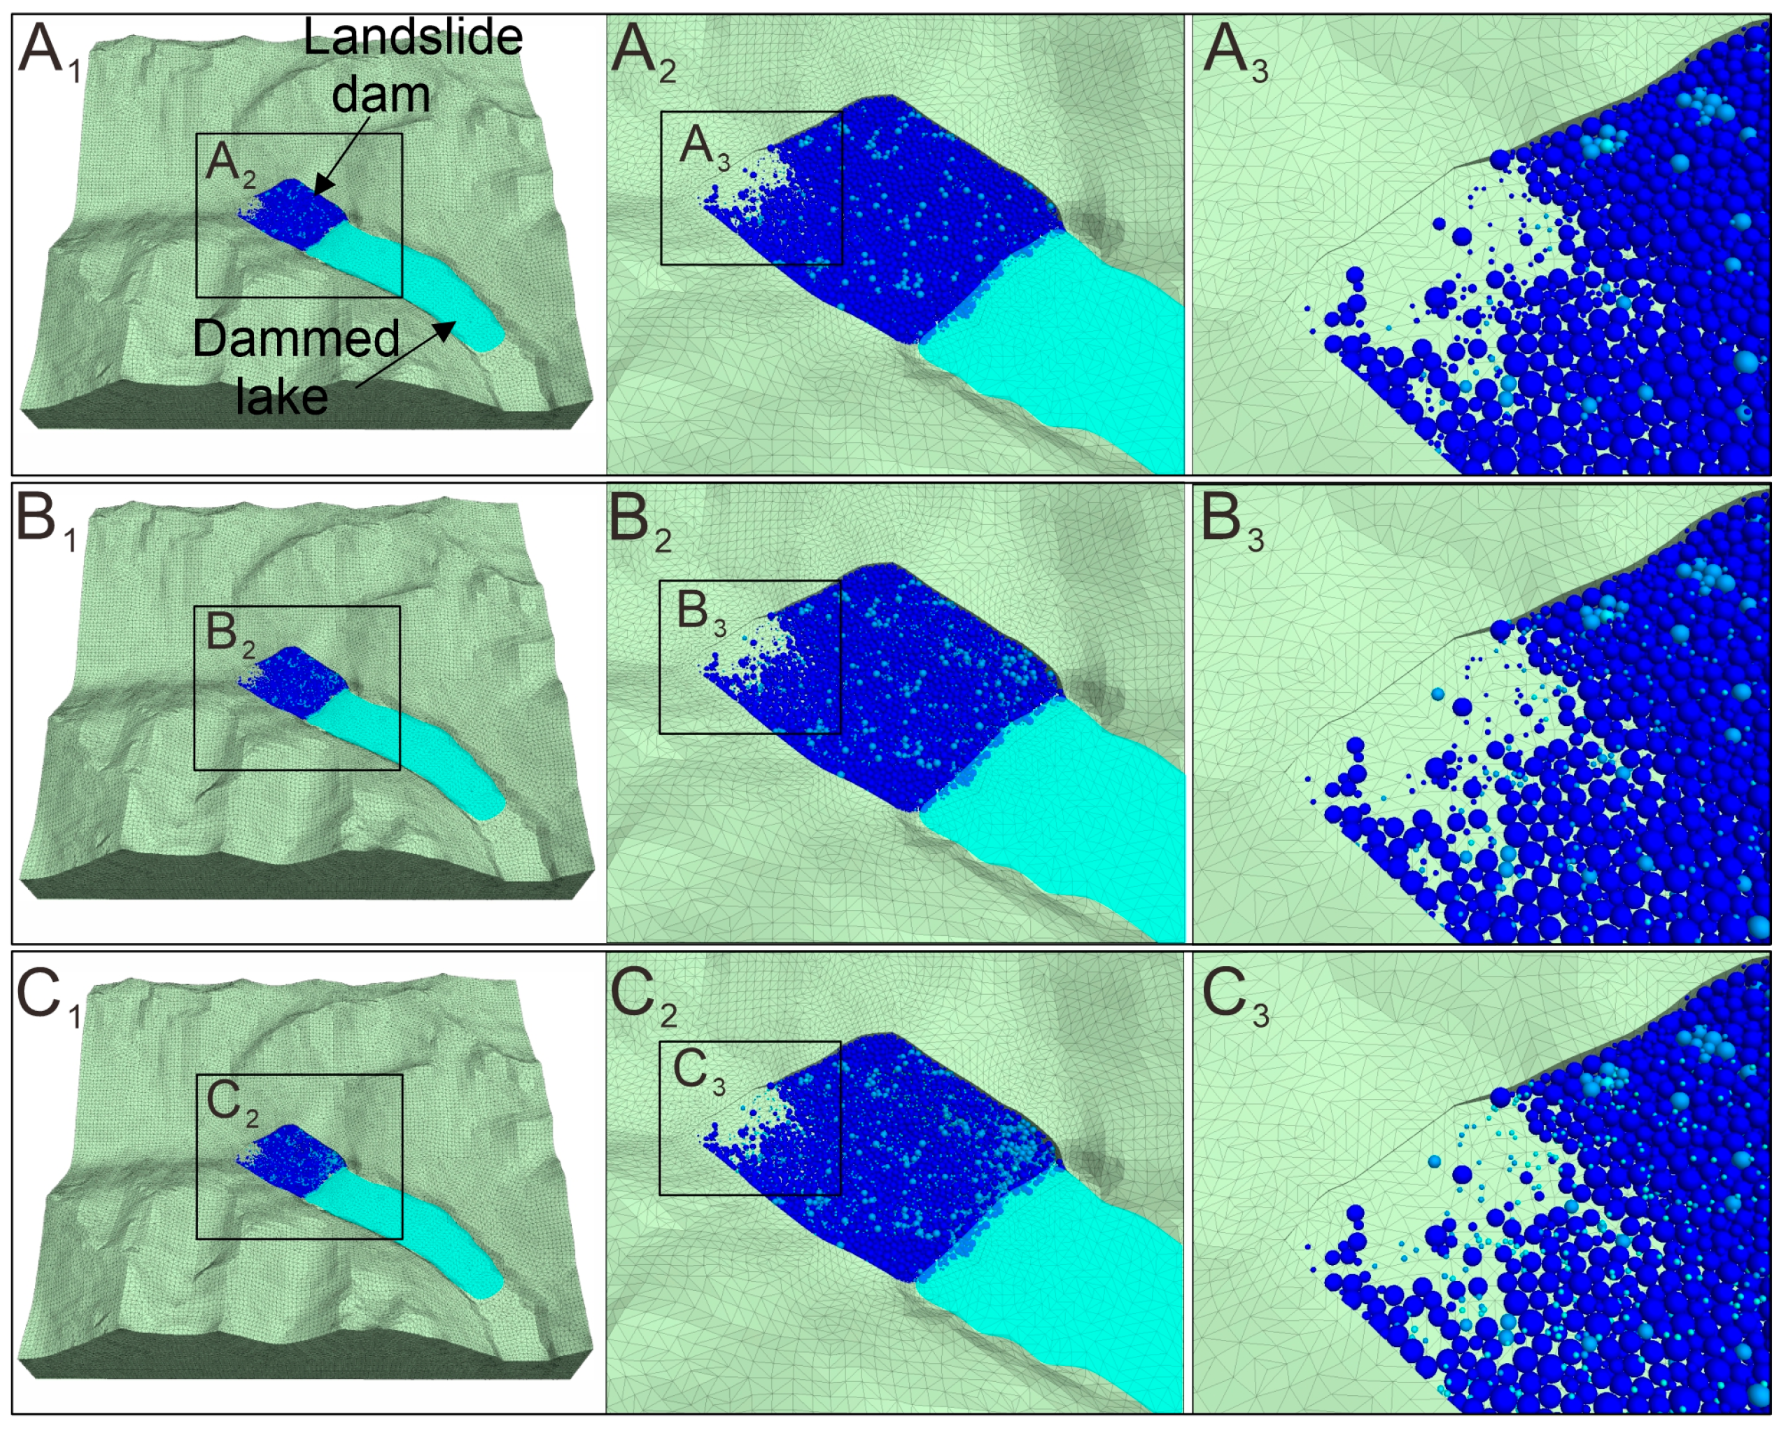
The particle transport process within the Conaxue Co landslide dam under seepage conditions is presented in Figure 11. During the initial stage of fluid loading, a portion of fine particles within the dam’s fine-grained layer was eroded and transported downstream (Figure 11A). As fluid loading continued, finer particles within the dam’s coarse-grained materials began to migrate towards the downstream side (Figure 11B). Ultimately, a significant quantity of fine particles was transported downstream under the influence of the seepage field (Figure 11C). Although partial particles were transported to the downstream side of the dam due to flow drag force, the entire dam remained in a stable state. This observation indicates that the migration of small amounts of fine particles does not compromise the overall stability of the dam.
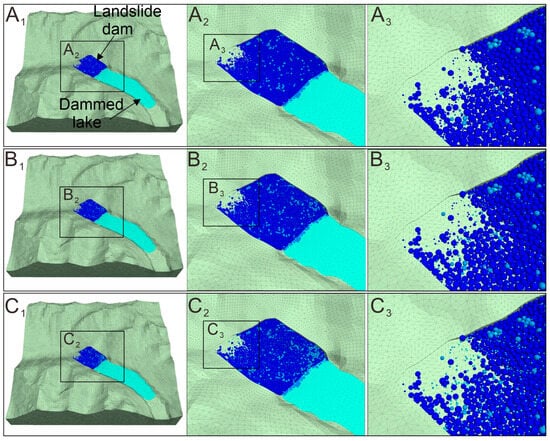
Figure 11.
The results of particle transport within the 3D dam model under seepage conditions. (A)—initial phase; (B)—intermediate phase; (C)—final phase. A2 and A3; B2 and B3; C2 and C3 are zoomed-in views of Figures A, B, and C, respectively.
4.3. The Seepage Results of 2D Dam Model
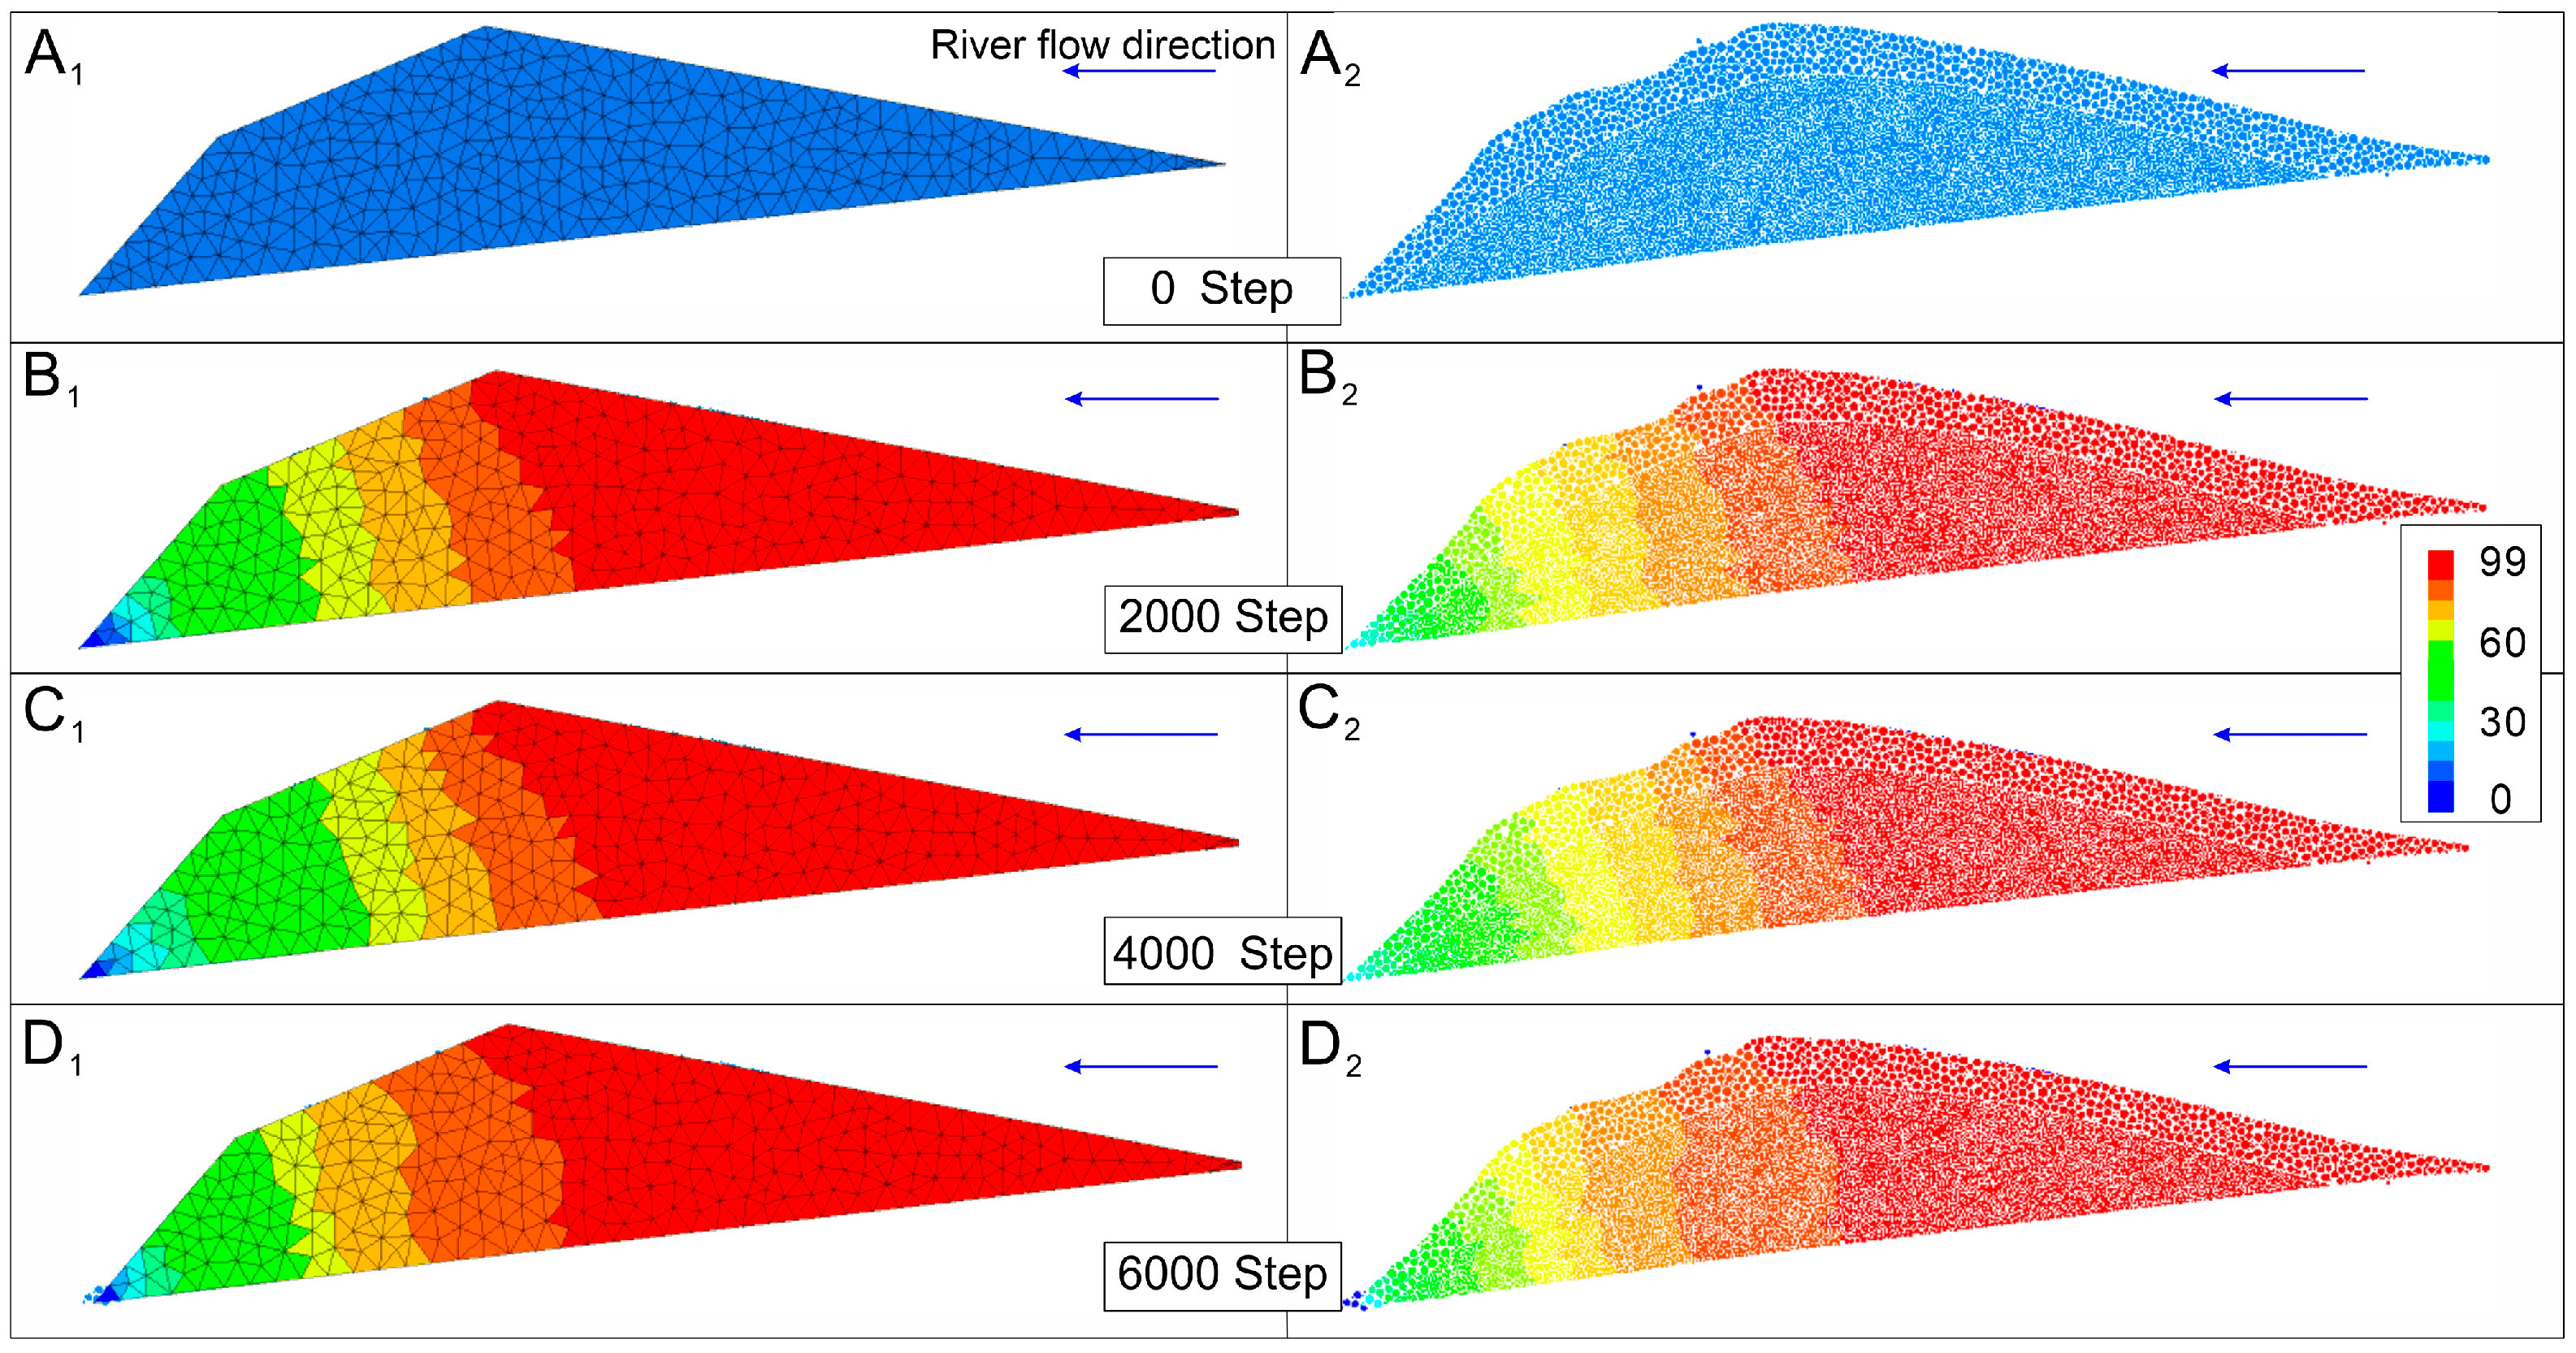
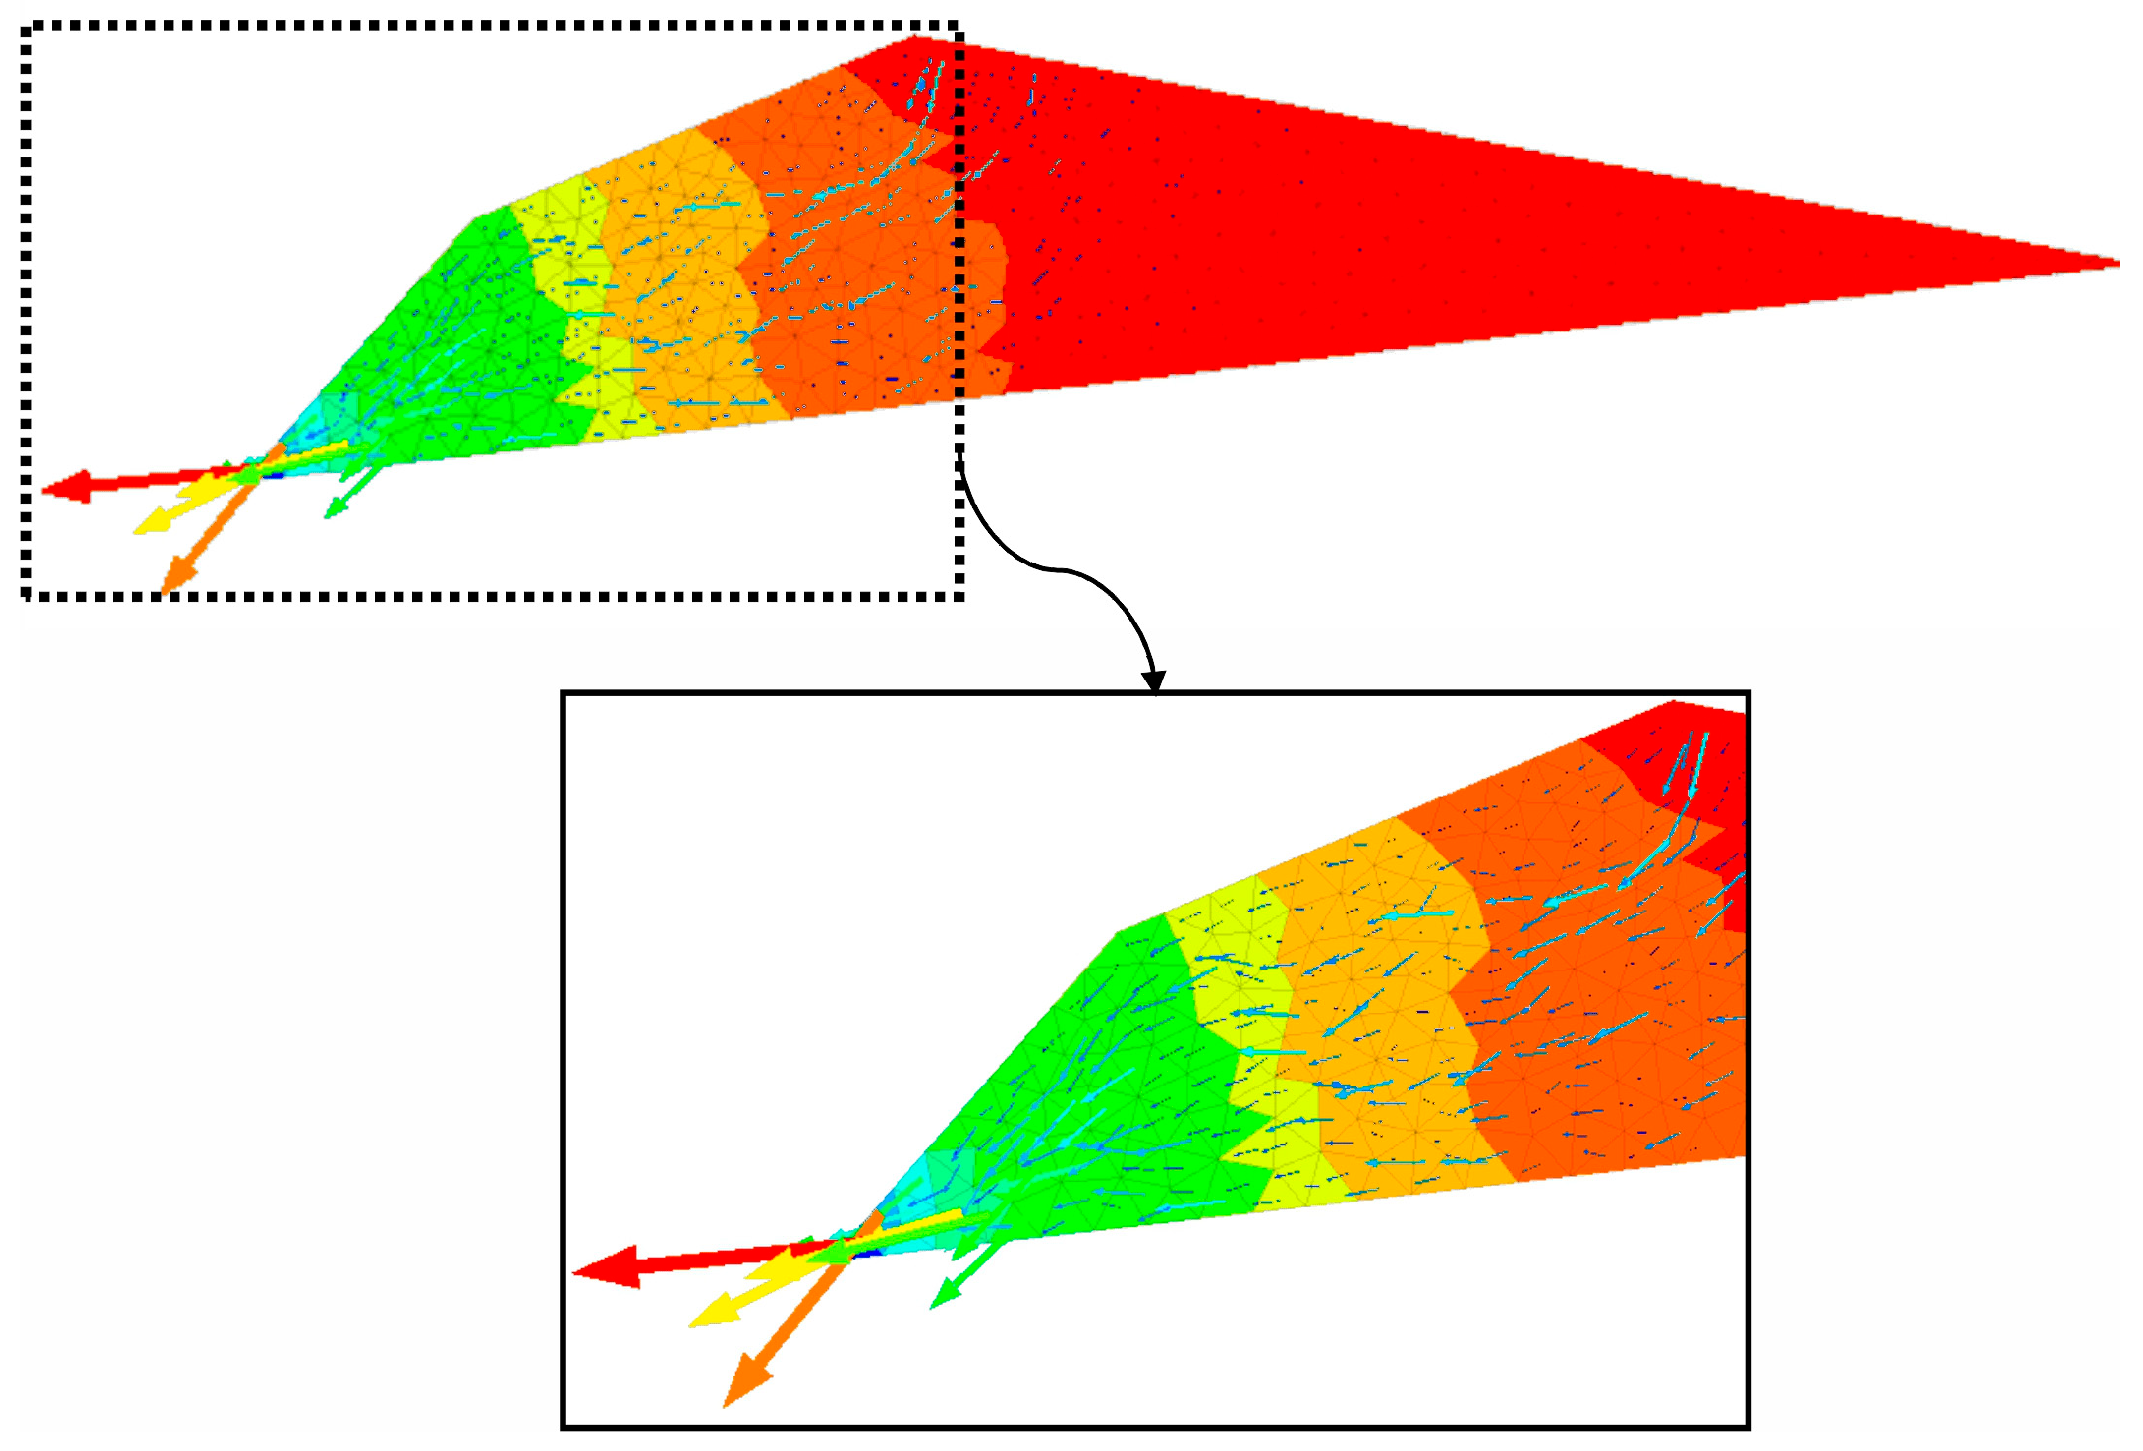
The variations in hydraulic head, seepage field, contact force chain, and porosity in the 2D dam model under seepage conditions are illustrated in Figure 11, Figure 12, Figure 13 and Figure 14.
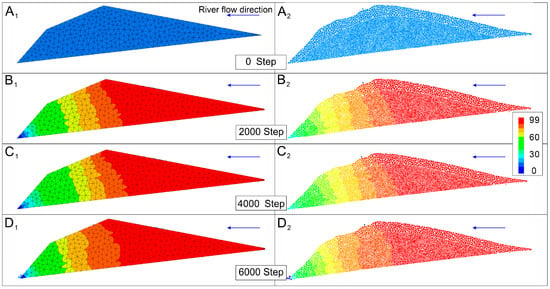
Figure 12.
Hydraulic head distribution map in the 2D dam model. (A1–D1)—hydraulic head distribution map of the Conaxue Co landslide dam mesh; (A2–D2)—hydraulic head distribution map of particles in the Conaxue Co landslide dam area.
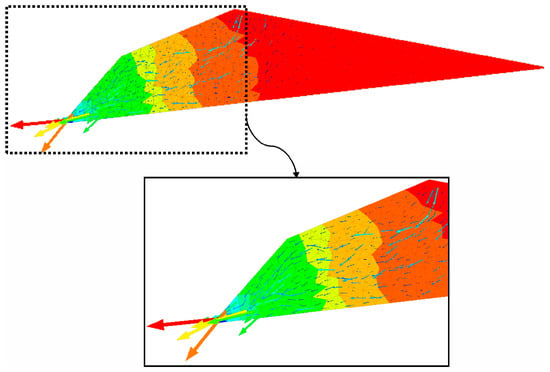
Figure 13.
Seepage field distribution map of the Conaxue Co landslide dam.

Figure 14.
Particle displacement in the Conaxue Co landslide dam. (A)—particle displacement results at time step 0; (B)—particle displacement results at time step 2000; (C)—particle displacement results at time step 4000; (D)—particle displacement results at time step 6000.
It was observed that the hydraulic head progressively decreases from the upstream to the downstream side of the dam. Over time and with increased seepage effects, the zones of high hydraulic head gradually expanded downstream (Figure 12A1–D1). The analysis of hydraulic head distribution among dam particles revealed that the hydraulic head gradient formed by internal particles creates differential force distributions within the dam, leading to the development of seepage fields (Figure 12A2–D2). The seepage field distribution confirmed that the seepage field in the dam’s coarse-grained layer is markedly more pronounced than in the fine-grained layer (Figure 13). This observation demonstrated that the dam’s coarse-grained layer experiences more intense hydrodynamic forces, thereby mitigating severe fluvial erosion on the underlying fine-grained sediments.
As shown in Figure 14, particle displacements within the dam body at different time intervals reveal significant downstream slope movement due to water impact. The maximum displacement (0.36 m) occurred at the toe of the downstream slope. Nevertheless, the dam maintained overall stability.
The interior of the landslide dam consists of numerous particles. Contact forces formed between the particles, and the network of these contact forces constituted the contact force chain distribution map (Figure 15). During the initial stage of seepage, the Conaxue Co landslide dam remained in an overall stable state (Figure 15A). Due to the differing particle size distributions and porosities between the dam’s coarse-grained and fine-grained layers, the resulting contact force chain distributions exhibited distinct characteristics. The contact force chain distribution in the coarse-grained layer was relatively sparse, which indicates larger porosity among the coarse particles. Conversely, the distribution in the fine-grained layer was more uniform and denser, corresponding to smaller porosity and greater compaction degree (Figure 15B,C). Under sustained seepage effects, both the coarse-grained and fine-grained layers were subjected to seepage-induced forces that influence the dam’s stability. However, the dam maintained overall stability (Figure 15D).

Figure 15.
Contact force chain distribution map within the Conaxue Co landslide dam. (A)—contact force chain distribution results at time step 0; (B)—contact force chain distribution results at time step 2000; (C)—contact force chain distribution results at time step 4000; (D)—contact force chain distribution results at time step 6000.
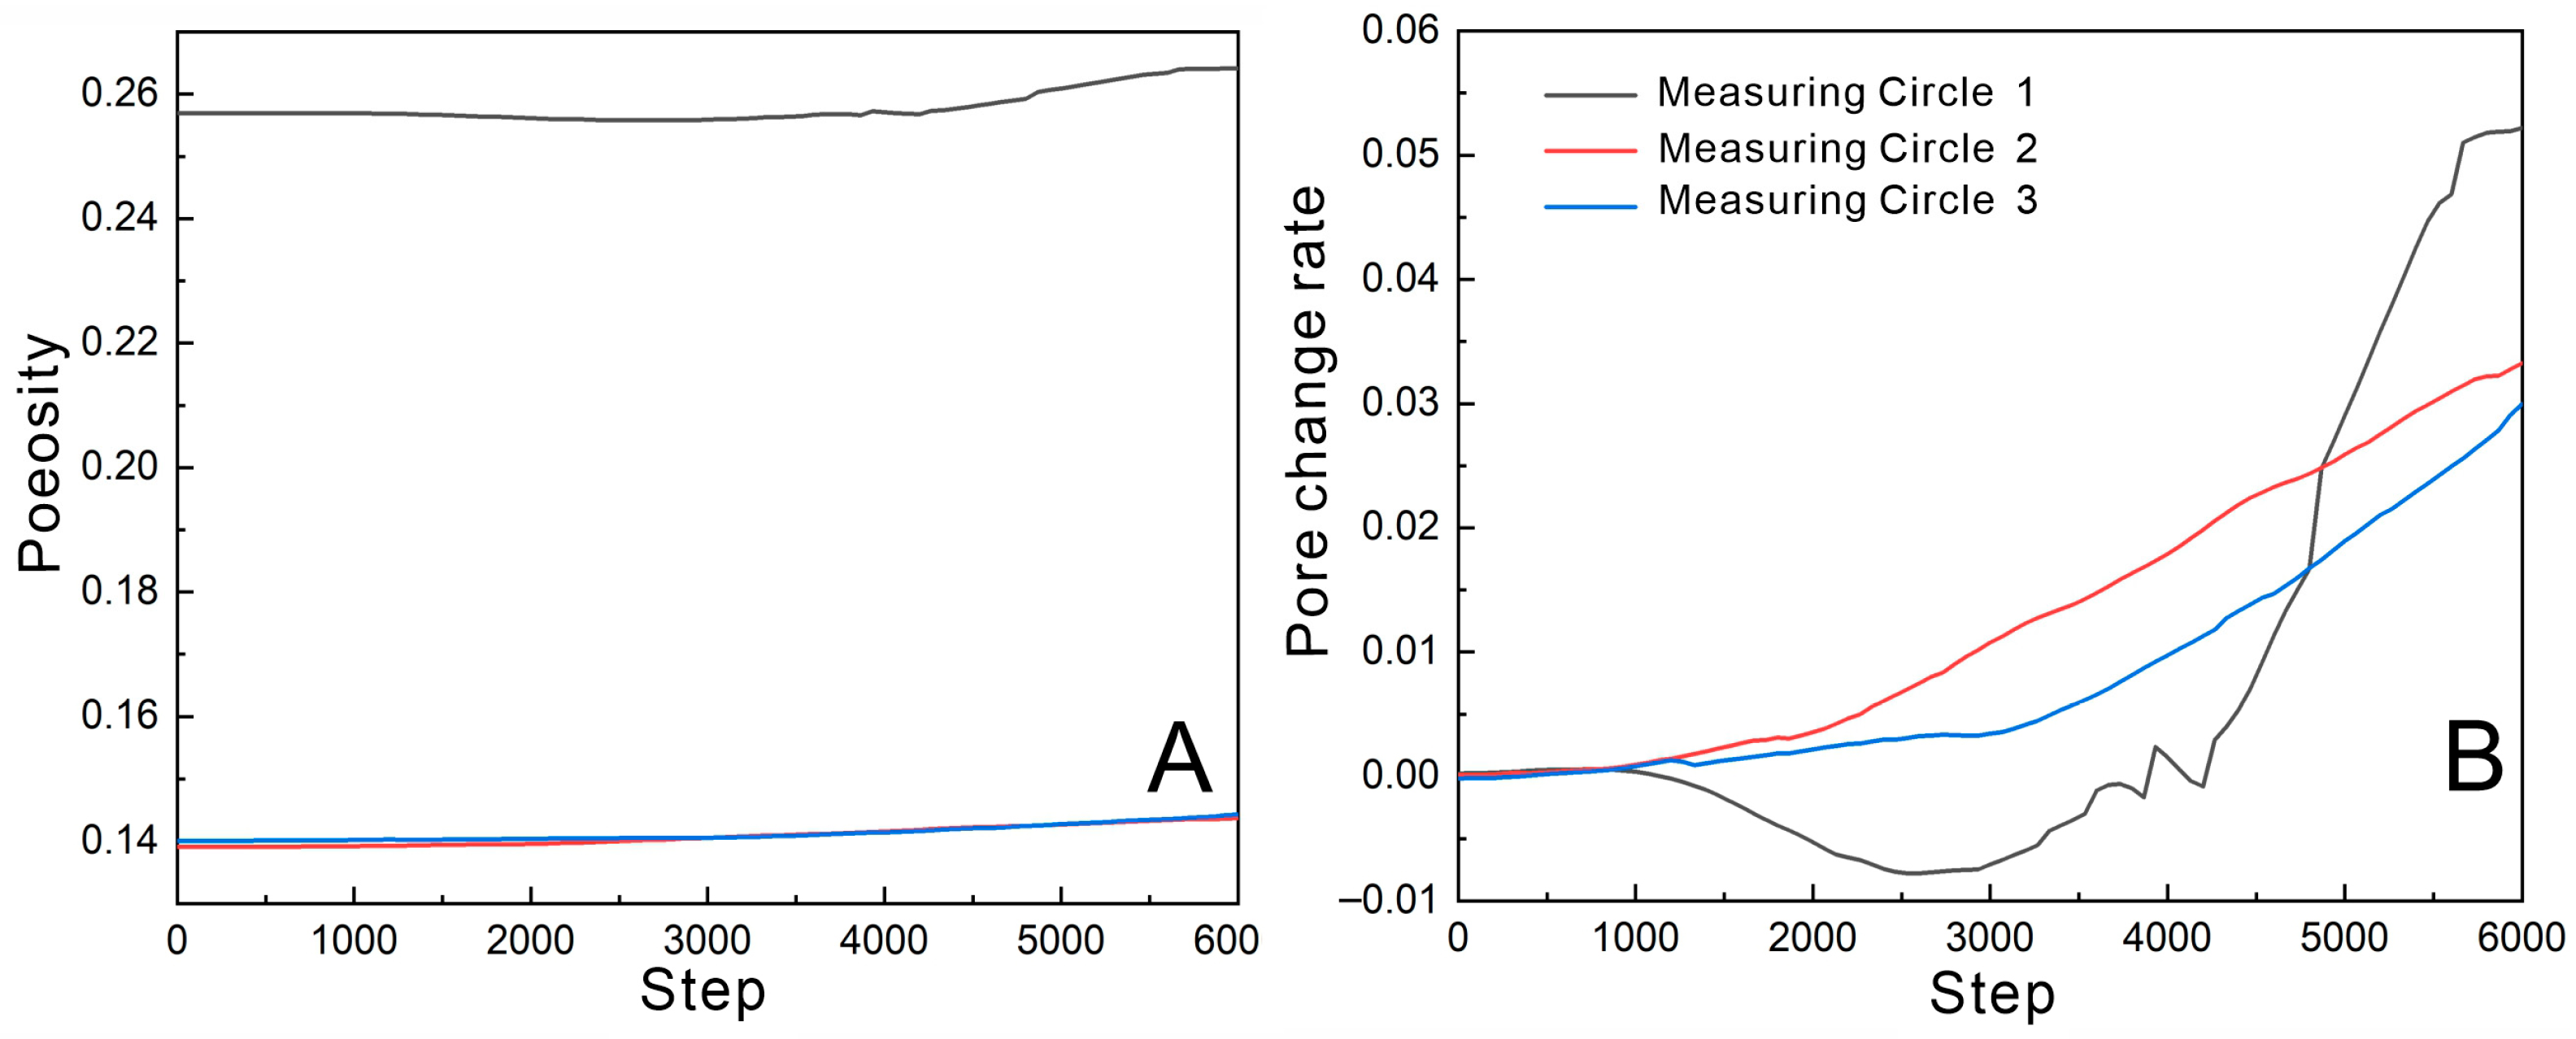
Porosity variations at different locations within the dam were monitored using measuring circles (Figure 16). As shown in Figure 16A, the porosity at Measuring Circle 1 was higher and exhibited greater variation. This is because Measuring Circle 1 is located in the coarse-grained layer, which naturally possesses higher porosity and greater particle size variation. The larger interstitial spaces between coarse particles facilitated the migration of finer particles. In contrast, the fine-grained layer has a higher compaction degree and limited particle movement. Figure 16B demonstrates the degree of porosity variation at different locations. The porosity variation rates in Measuring Circles 2 and 3 were consistent, whereas the variation in Measuring Circle 1 was more pronounced compared to Circles 2 and 3. Specifically, the porosity in Measuring Circle 1 initially decreased before sharply increasing, indicating that particle-scale changes in the coarse-grained layer are more significant during the seepage process.
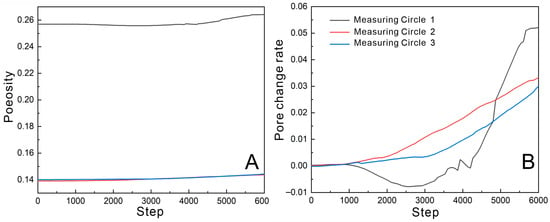
Figure 16.
Porosity and porosity variation rate at different locations within the Conaxue Co landslide dam. (A)—Porosity at different locations within the Conaxue Co landslide dam; (B)—porosity variation rate at different locations within the Conaxue Co landslide dam.
5. Discussion
5.1. Stability Mechanism
Based on detailed field investigations, numerical simulations, and comprehensive analysis, this study concludes that the inverse grading structure formed by high-velocity long-runout hard rock landslides is a governing factor in the stability of the Conaxue Co landslide dam.
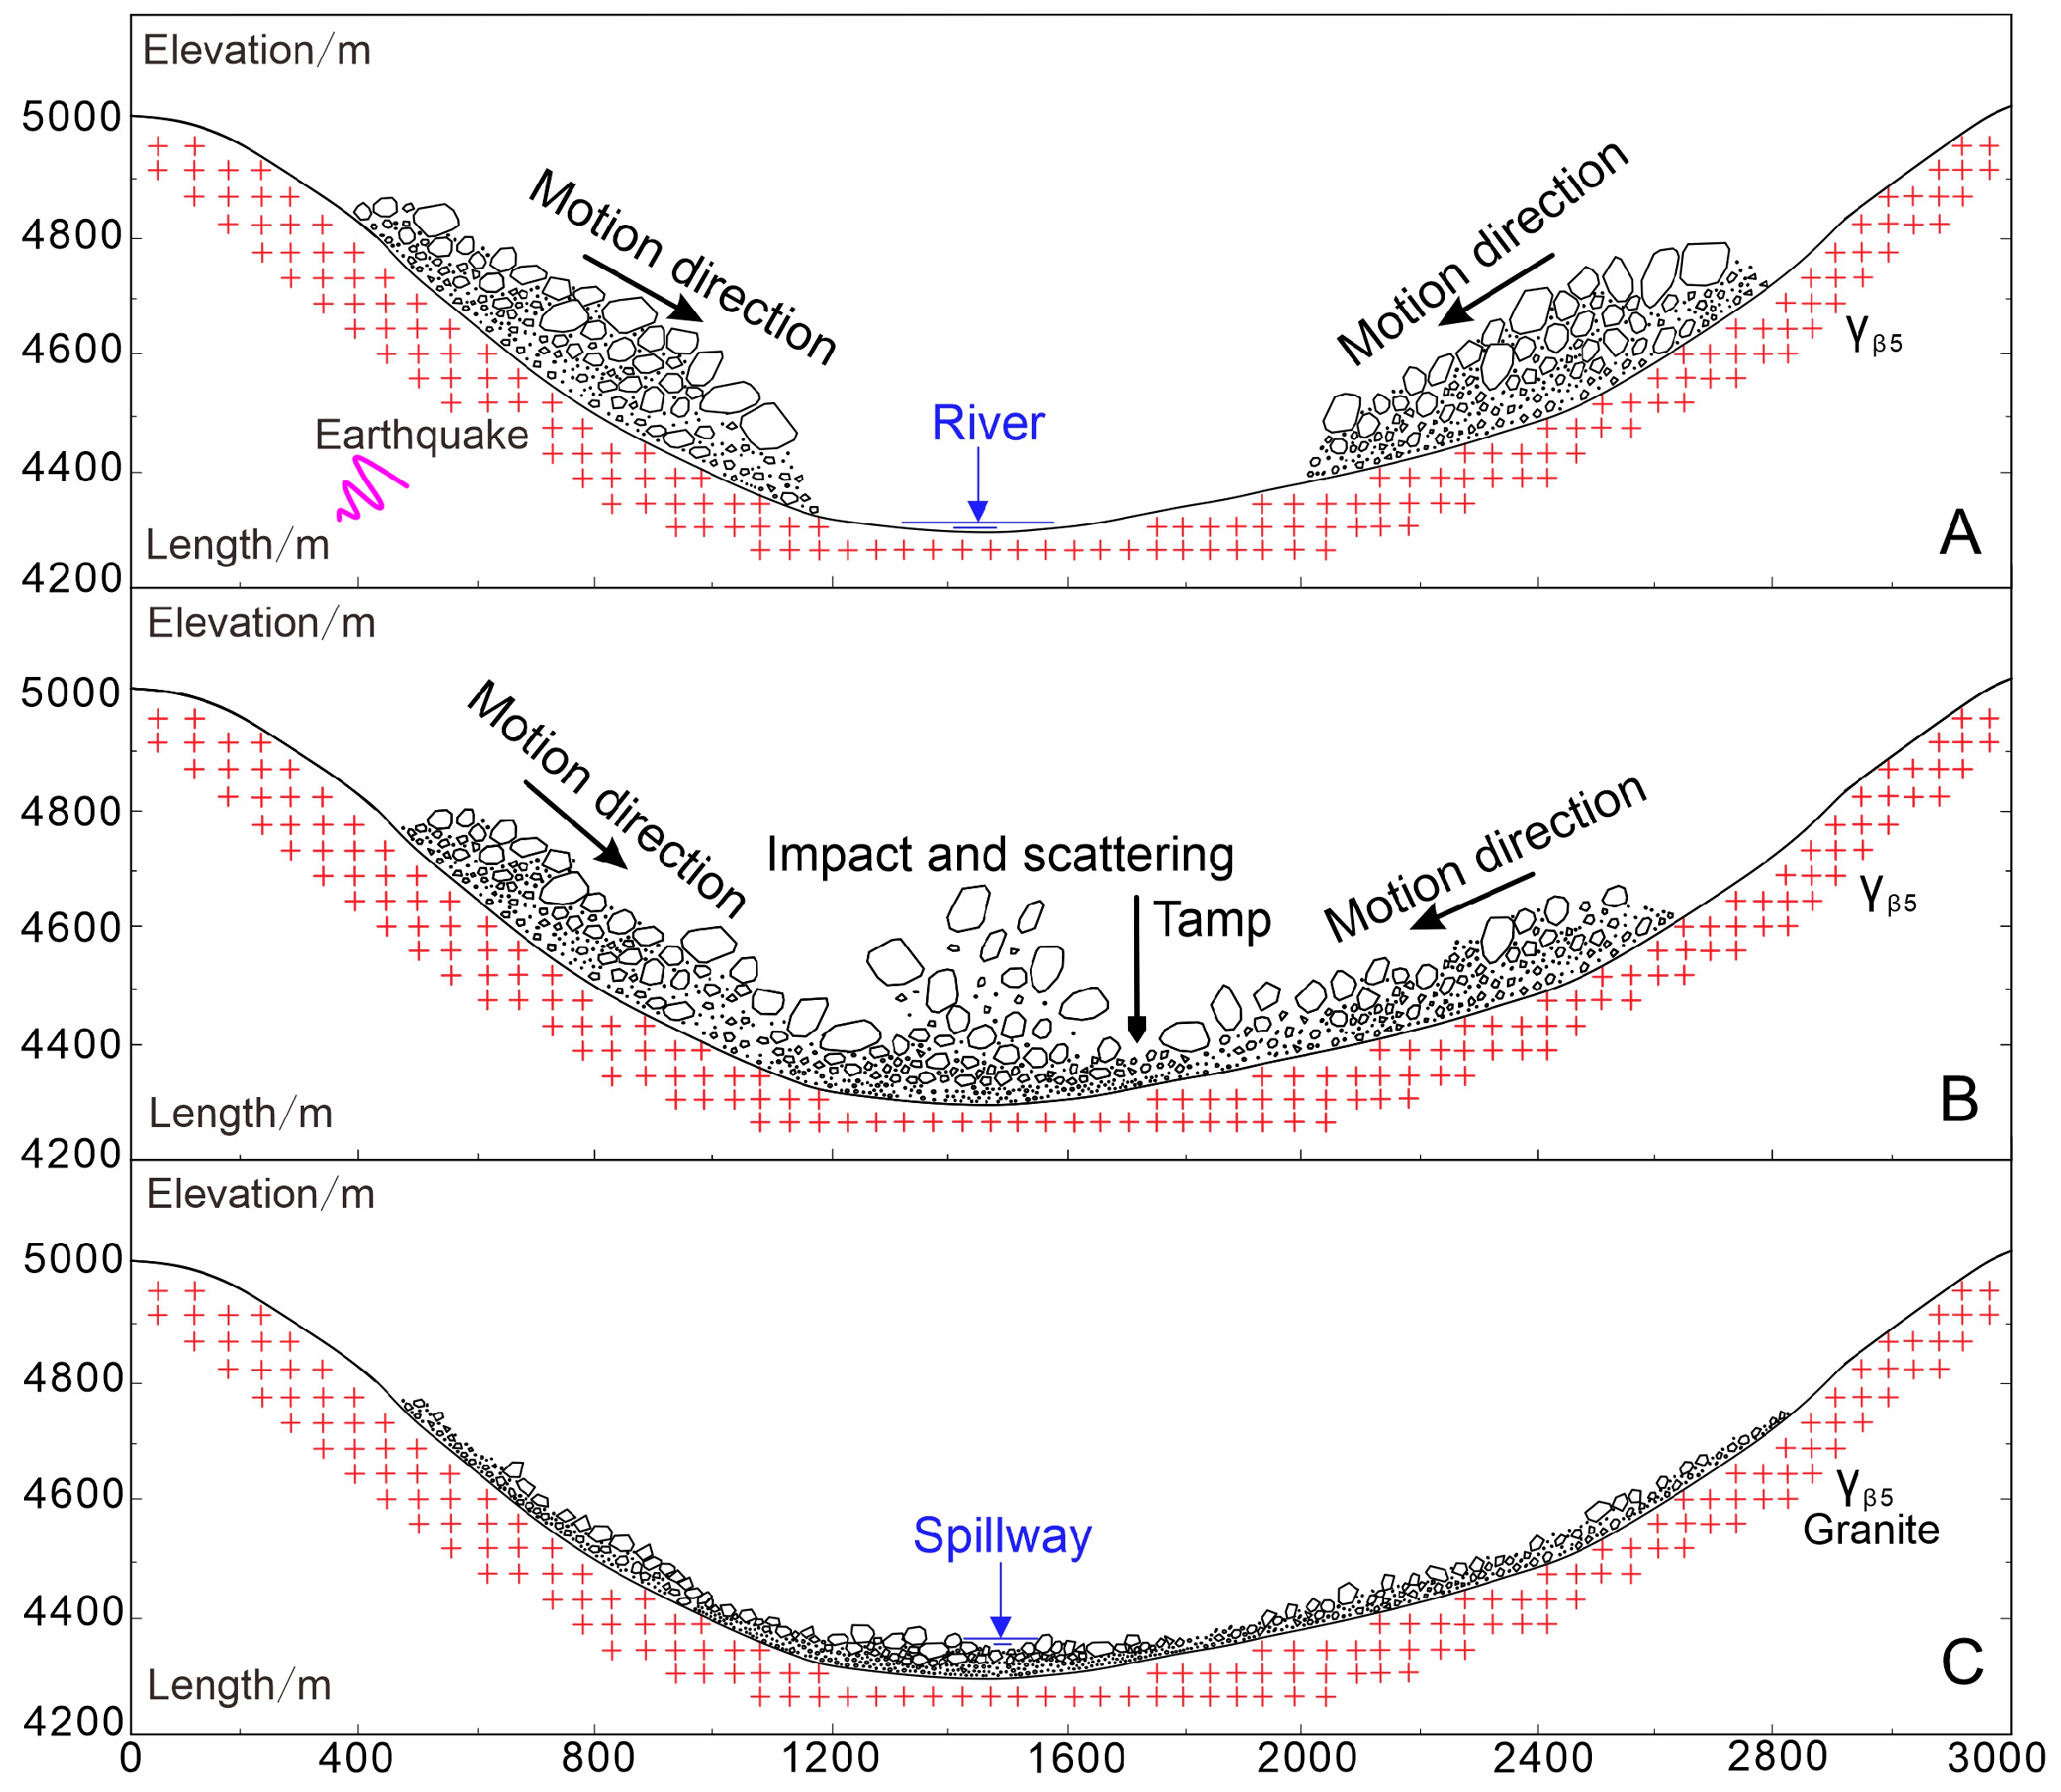
Before analyzing the formation mechanism of the inverse grading structure within the dam, a brief overview of the formation process of the Conaxue Co landslide dam is required. Based on previous studies of high-speed long-runout landslides [26,27], this study proposes a three-stage formation mechanism for the Conaxue Co landslide dam through field investigations and comprehensive analysis. The formation of the Conaxue Co landslide dam primarily consists of three stages (Figure 17): (1) the kinematic sieving stage; (2) the impact, ejection, and compaction stage; (3) the dam-forming stage. During the initial kinematic sieving stage, the granite slopes on both banks of the river channel were subjected to intense seismic forces, which resulted in failure and subsequent high-speed and long-distance movement (Figure 17A). During this movement, the relatively intact granite rock mass was subjected to an uneven sliding surface. This generated vibrational forces within the rock mass. When these forces exceeded the rock’s shear strength, the originally intact rock from the source area was subsequently fragmented into blocky debris. Simultaneously, the intense vibrational forces generated interstitial voids between coarse particles within the landslide mass. This facilitated the downward migration of debris. As a result, vibrationally fragmented and size-heterogeneous mass was mechanically sorted into a coarse-over-fine stratified structure. This process is termed vibrational sieving [28,29,30]. During the subsequent impact, ejection, and compaction stage, the landslide masses originating from both banks of the river channel converged and collided near the valley floor. Coarse-grained boulders were ejected into the air by powerful impact forces. These large boulders then fell freely under gravity and subsequently impacted the deposit surface again. The descent of multi-ton massive boulders from considerable heights exerted significant compaction effects on the underlying fine-grained particles, resulting in increased density of the lower fine-grained layer (Figure 17B). Numerous studies on the kinematic characteristics of high-speed and long-distance landslides have also confirmed the presence of impact, ejection, and compaction processes during their formation [31,32]. Finally, the landslide dam was formed after the impact, ejection, and compaction of coarse boulders on the underlying fine-grained particles were completed. With the continuous inflow of debris from upstream, the water of the landslide-dammed lake discharged through the relatively low-elevation spillway of the dam (Figure 17C).
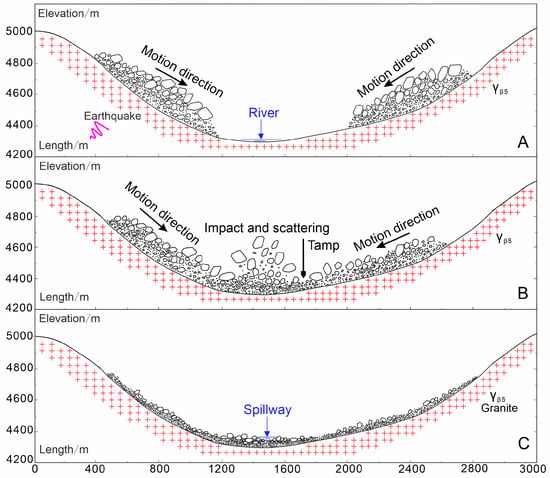
Figure 17.
Formation process of the inverse grading structure in the Conaxue Co landslide dam. (A)—Process of vibrational sieving; (B)—impact, ejection, and compaction processes; (C)—formation of the landslide dam.
The formation process of the Conaxue Co landslide dam revealed that the fine-grained layer underlying the inverse grading structure exhibits a higher compaction degree. This resulted in a lower hydraulic conductivity within the lower fine-grained layer of the dam, forming a relatively impermeable aquitard. Consequently, the lake water can only discharge through the surface spillway, thereby effectively preventing seepage failure to the dam. During the dry season, the compacted fine-grained layer in the lower portion of the landslide dam acts as an impermeable aquitard to prevent Conaxue Co Lake from drying out due to seepage. The coarse-grained layer in the upper portion of the landslide dam enhances hydraulic conductivity, which enables rapid saturation following overland flow. Meanwhile, the consolidated fine-grained layer in the lower dam reduces seepage flow, thereby lowering the downstream groundwater table. Under these conditions, even in the event of dam overtopping, the downstream fine-grained materials may not saturate rapidly, thus preventing breaching failure.
The massive boulders located in the upper dam body and spillway (Figure 18A) are critical for preventing erosion of the lower fine-grained layer by lake water. On one hand, as lake water flows over the boulder surfaces, it generates significant drag forces on the spillway bed. However, the densely packed boulders within the spillway bed exhibit high erosion resistance, thereby shielding the underlying fine-grained layer from hydraulic erosion. On the other hand, these boulders facilitate the energy dissipation from the lake water flow, substantially reducing its erosive capacity. In the 2D flow field distribution, the significantly more pronounced flow field within the coarse-grained layer compared to the fine-grained layer provides clear validation of this assertion (Figure 13). In addition, studies of failed dams (e.g., Baige) consistently document fine-dominated compositions, corroborating the critical stabilizing function of coarse blocks through empirical counterevidence.

Figure 18.
Massive boulders in the spillway of the Conaxue Co landslide dam. (A)—Spillway with distributed massive boulders; (B)—the spillway develops a step-pool system with plunge pools.
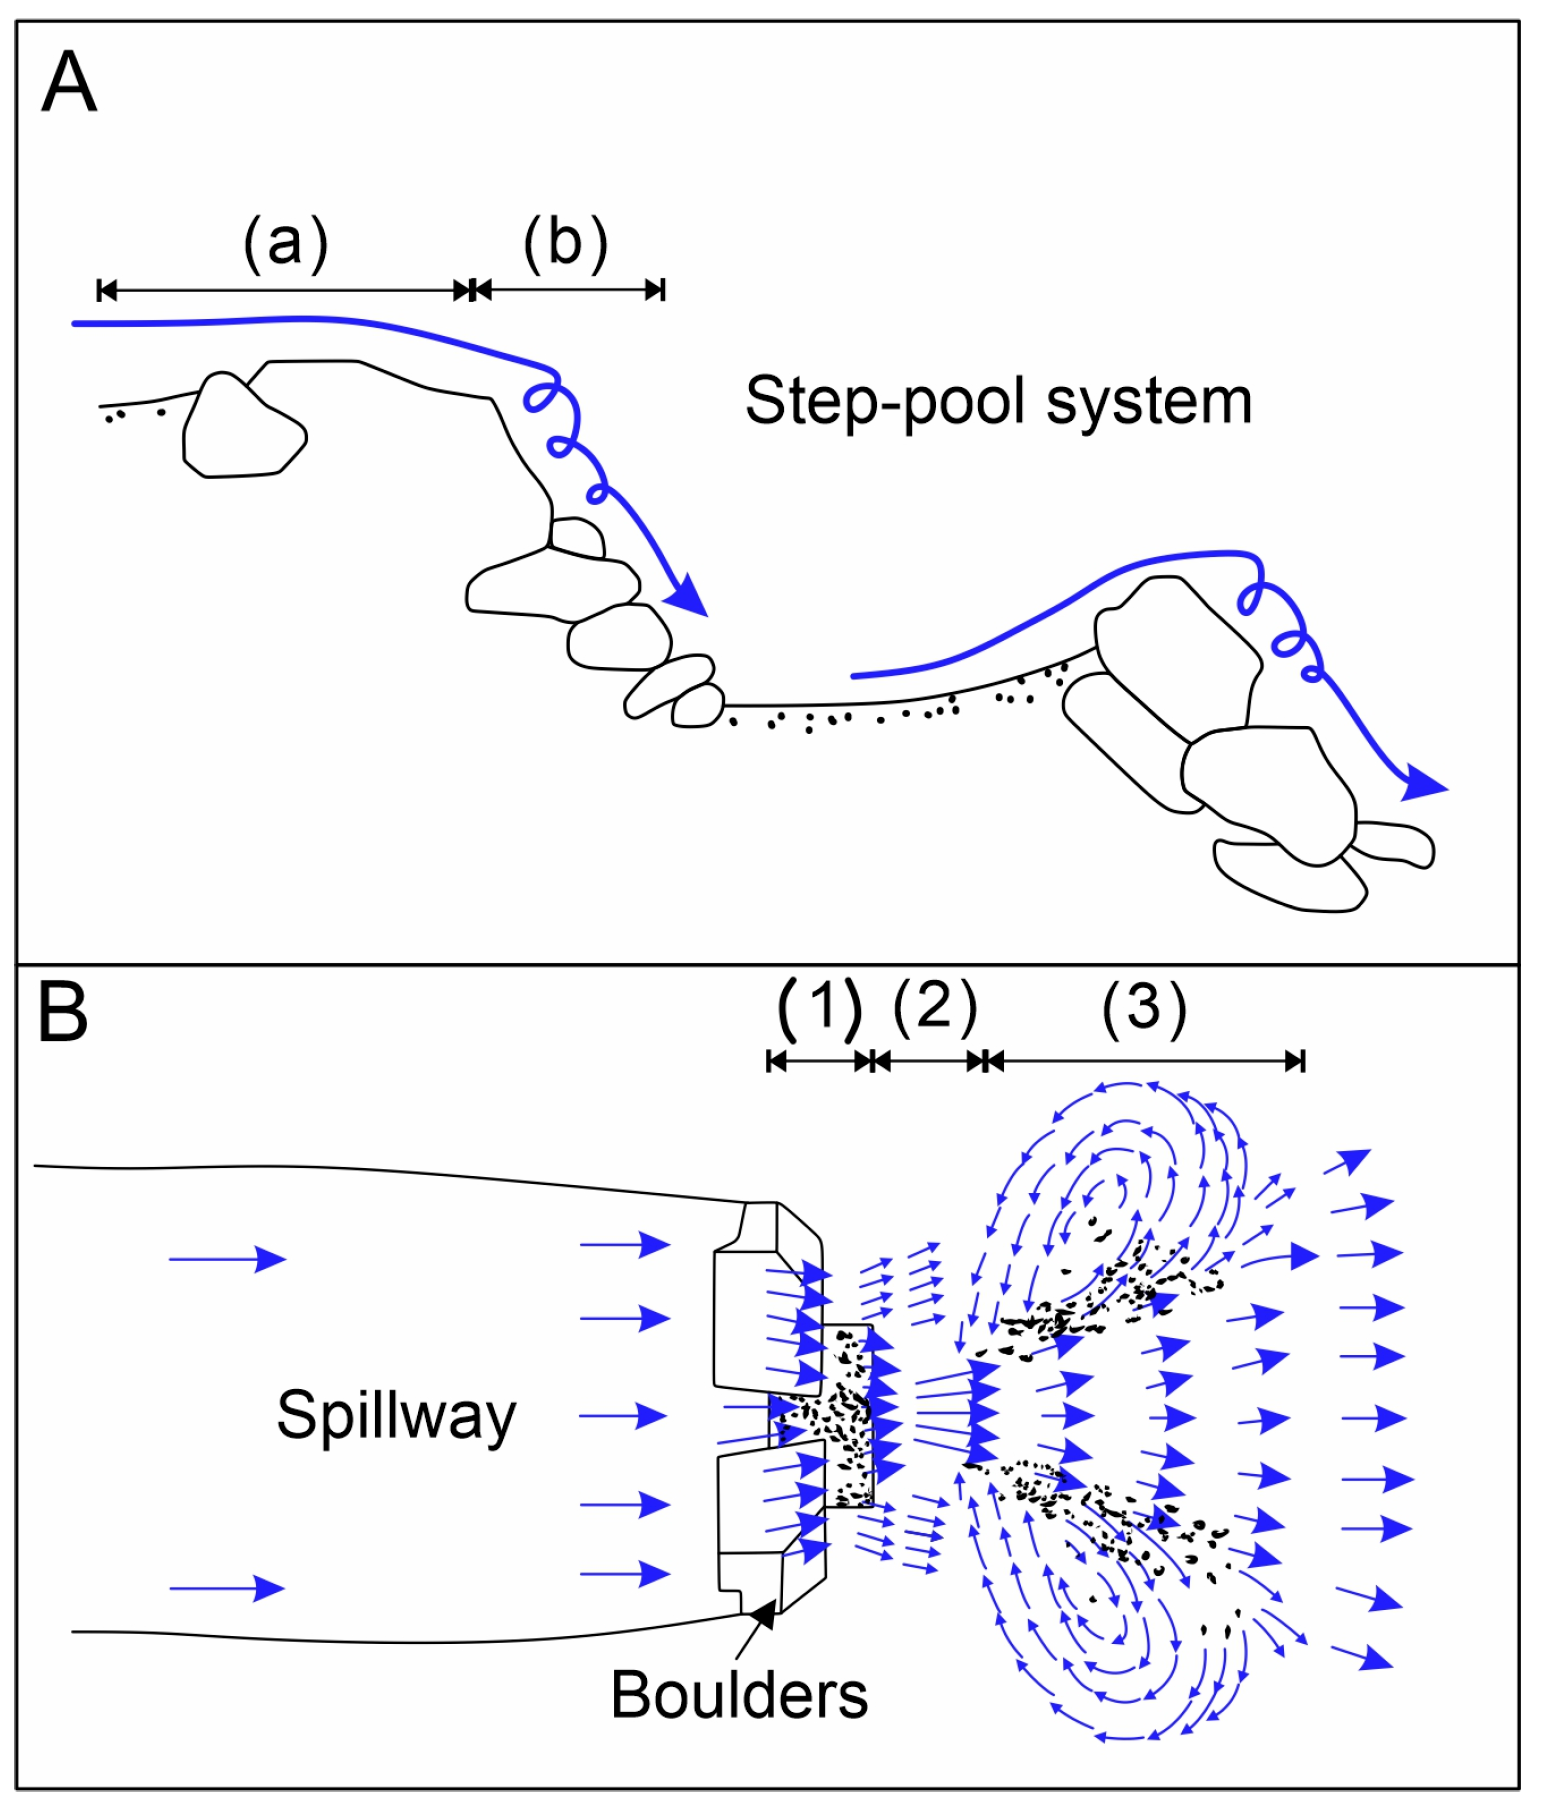
Regarding energy dissipation in the coarse-grained layer, we identified a step-pool system formed by long-term fluvial transport of boulders within the spillway (Figure 18B). This system features an alternating sequence of steep slopes, gentle slopes, and plunge pools arranged in step-like morphology [33]. It has been widely documented to generate exceptionally high flow resistance. This behavior effectively helps to dissipate stream power, thereby mitigating bed incision in the spillway channel [34,35]. The energy dissipation mechanisms of the step-pool system in the spillway of the Conaxue Co landslide dam primarily include step-induced dissipation and pool-induced dissipation. For step-induced dissipation, the dominant modes are skin friction and hydraulic jumps downstream of the steps. When the lake water flows over the steps, intense friction and form resistance generated by the massive boulders dissipate energy. Subsequently, as the flow is deflected by the steps, it entrains air and generates localized hydraulic jumps with vortices (Figure 19A). These hydraulic jumps differ from typical pool hydraulic jumps; they occur as smaller-scale phenomena directly on step surfaces. For pool-induced dissipation, energy is first dissipated through hydraulic jumps in the main flow zone. Subsequently, turbulent kinetic energy is generated at the interface between the main flow and surrounding water, converting bulk kinetic energy into turbulence. Finally, large-scale vortex zones along the main flow margins transfer energy to smaller-scale turbulent eddies (Figure 19B). Consequently, the stream power of the Conaxue Co dammed lake flow is substantially reduced after passing through the step-pool system, thereby maintaining the long-term stability of the dam.
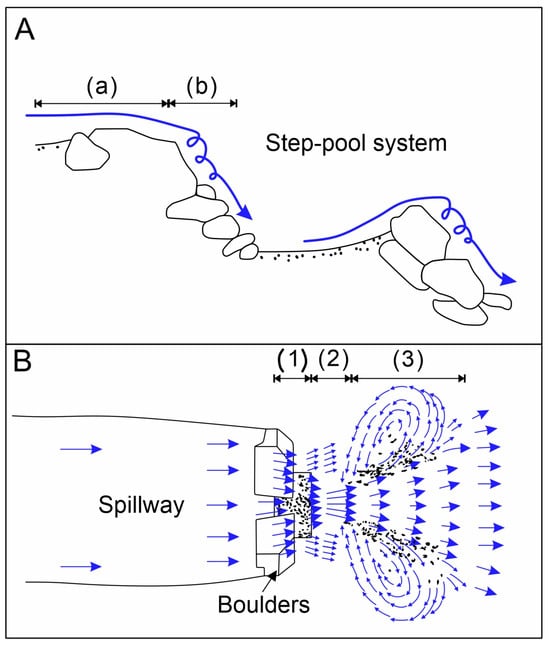
Figure 19.
Energy dissipation mechanism of the step-pool system formed in the spillway of the Conaxue Co landslide dam. (A)—Schematic diagram of step-induced energy dissipation mechanism; (B)—schematic diagram of pool-induced energy dissipation mechanism; (1)—main flow zone of hydraulic jump; (2)—interface zone; (3)—large-scale vortex zone.
This study employed the energy dissipation rate calculation formulas for step-pool systems derived from experimental and field data by Lenzi [36] and Wang and Zhang [37] to quantitatively assess the energy dissipation rate of the step-pool system in the Conaxue Co landslide dam. The specific calculation formula is as follows
where η is the energy dissipation rate of the step-pool system, hc is the critical water depth (m), Hs is the step height (m), Q is the discharge (m3/s), W is the channel width (m), and g is the gravitational acceleration (m/s2).
Field measurements indicated a discharge of 1.5 m3/s in the Gangrilongba stream, with a step height of 1.5 m and an average spillway width of 20 m. Calculations yielded an energy dissipation rate of 0.68 for the step-pool system in the Conaxue Co landslide dam spillway. These findings demonstrated that 68% of the lake water’s energy was dissipated by this system.
In summary, the stable Conaxue Co landslide dam, located along the QTP, was formed as a result of seismically induced slope failure that generated a high-speed and long-distance landslide damming the river. This resulted in an inverse grading structure within the dam body, characterized by overlying coarse-grained hard rock boulders and underlying fine-grained layers. On one hand, the coarse and hard rock boulders in the upper dam mitigate fluvial erosion of the lower fine-grained sediments. On the other hand, the fine-grained layer in the lower dam acts as a relatively impermeable aquitard to prevent seepage of dammed lake water. This coupled mechanism ensures the long-term stability of the inverse-graded dam structure composed of hard rock. Furthermore, the step-pool system formed by long-term fluvial transport of massive boulders significantly dissipates stream power.
5.2. Stability Patterns
The inverse grading structure (coarser upper and finer basal layers) formed by high-speed long-runout landslides stabilizes the dam. During initial formation, headward erosion occurs in the fine-grained stratum on the downstream slope under hydraulic action, ceasing when its gradient approaches that of the coarse layer (Figure 20A). Continued flow scours relatively finer particles from the coarse downstream layer, inducing particle repositioning until force equilibrium is achieved (Figure 20B). The coarse upper layer resists fluvial erosion, while the partially cemented/dense fine basal layer acts as an aquitard. Progressive stabilization ensues over time (Figure 20C).

Figure 20.
Stability patterns of the Cuona Xuecuo landslide dam. (A)—the stage of headward erosion; (B)—the stage of fluvial scouring; (C)—the stage of dam stability.
5.3. Limitations and Perspectives
This study employed a 2D model to elucidate seepage characteristics in coarse and fine particles. Future work should focus on 3D seepage modeling for dams with complex, irregular topography. Additionally, flume experiments could investigate the stability mechanisms of inversely graded landslide dams.
6. Conclusions
The QTP is a region prone to stable landslide dams, yet the understanding of the stabilization mechanism of individual stable landslide dams remains insufficient. This study focused on the Cuonaxue Co landslide dam, a representative stable landslide dam developed along the eastern margin of the QTP. Investigating the stabilization mechanisms of typical landslide dams along the eastern margin of the QTP holds significant scientific and practical implications for disaster mitigation of similar dams formed in this region.
Field investigations and comprehensive understanding revealed that the Cuonaxue Co landslide dam formed through high-speed and long-runout landsliding damming the river. The inverse grading structure generated by this landslide plays a decisive role in stabilizing the dam. Specifically, coarse particles in the upper dam section exhibit high erosion resistance, shielding underlying fines from fluvial erosion. Long-term fluvial scour formed a step-pool system in the spillway, which effectively dissipates flow energy. Quantitatively, 68% of hydraulic energy is consumed by this step-pool system. In addition, 3D modeling revealed that limited migration of fine-grained particles does not compromise the overall stability of the dam. Two-dimensional modeling demonstrated significantly more pronounced seepage fields in the coarse-grained layer than in the fine-grained layer, indicating that the upper coarse layer resists fluvial erosion and thereby prevents erosion of underlying fine particles.
Author Contributions
Methodology, L.S. and Y.W.; Software, L.S.; Formal analysis, Y.S. and T.L.; Investigation, L.S., Y.W., T.L., Z.X., Y.Z., T.T. and S.L.; Data curation, T.L.; Writing—original draft, L.S.; Writing—review & editing, Y.S.; Funding acquisition, Y.S. All authors have read and agreed to the published version of the manuscript.
Funding
This research is supported by the Key Laboratory of Xinjiang Coal Resources Green Mining, Ministry of Education, Xinjiang Institute of Engineering, Urumqi 830023, China (Grant No. KLXGY-Z2513); the Third Xinjiang Scientific Expedition Program (Grant No. 2022xjkk1305); Xinjiang Uygur Autonomous Region “Tianchi Talent” Introduction Program (Grant No. 2025XGYTCYC07); and Doctoral Research Initiation Fund of Xinjiang Institute of Engineering (Grant No. 2025XGYBQJ08).
Institutional Review Board Statement
Not applicable.
Informed Consent Statement
Not applicable.
Data Availability Statement
The original contributions presented in this study are included in the article. Further inquiries can be directed to the corresponding author.
Conflicts of Interest
The authors declare no conflict of interest.
References
- Casagli, N.; Ermini, L. Geomorphic analysis of landslide dams in the Northern Apennine. Trans.—Jpn. Geomorphol. Union 1999, 20, 219–249. [Google Scholar]
- Costa, J.E. and Schuster, R.L. The formation and failure of natural dams. Geol. Soc. Am. Bull. 1988, 100, 1054–1068. [Google Scholar] [CrossRef]
- Chen, J.; Li, H. Genetic mechanism and disasters features of complicated structural rock mass along the rapidly uplift section at the upstream of Jinsha River. J. Jilin Univ. (Earth. Sci. Ed.) 2016, 46, 1153–1167. [Google Scholar]
- Li, Y.; Wang, C.; Dai, J.; Xu, G.; Hou, Y.; Li, X. Propagation of the deformation and growth of the Tibetan–Himalayan orogen: A review. Earth-Sci. Rev. 2015, 143, 36–61. [Google Scholar] [CrossRef]
- Zhan, J.; Chen, J.; Zhang, W.; Han, X.; Sun, X.; Bao, Y. Mass movements along a rapidly uplifting river valley: An example from the upper Jinsha River, southeast margin of the Tibetan Plateau. Environ. Earth Sci. 2018, 77, 634. [Google Scholar] [CrossRef]
- Li, J.; Fang, X.; Pan, B.; Zhao, Z.; Song, Y. Late Cenozoic Intensive Uplift of the Tibetan Plateau and Its Impacts on the Surrounding Environments. Quat. Res. 2001, 21, 381–391. [Google Scholar]
- Zhu, S. Geomorphological and Geological Environmental Evolution of the Yarlung Tsangpo River Valley; Chinese Academy of Geological Sciences: Beijing, China, 2012. [Google Scholar]
- Dai, F.; Lee, C.F.; Deng, J.; Tham, L. The 1786 earthquake-triggered landslide dam and subsequent dam-break flood on the Dadu River, southwestern China. Geomorphology 2005, 65, 205–221. [Google Scholar] [CrossRef]
- Zhao, B.; Wang, Y.; Wu, J.; Su, L.; Liu, J.; Jin, G. The Mogangling giant landslide triggered by the 1786 Moxi M 7.75 earthquake, China. Nat. Hazards 2021, 106, 459–485. [Google Scholar] [CrossRef]
- Guo, C.; Montgomery, D.R.; Zhang, Y.; Zhong, N.; Fan, C.; Wu, R.; Yang, Z.; Ding, Y.; Jin, J.; Yan, Y. Evidence for repeated failure of the giant Yigong landslide on the edge of the Tibetan Plateau. Sci. Rep. 2020, 10, 14371. [Google Scholar] [CrossRef]
- Shang, Y.; Park, H.-D.; Yang, Z.; Yang, J. Distribution of landslides adjacent to the northern side of the Yarlu Tsangpo Grand Canyon in Tibet, China. Environ. Geol. 2005, 48, 721–741. [Google Scholar] [CrossRef]
- Liu, D.; Cui, Y.; Wang, H.; Jin, W.; Wu, C.; Bazai, N.A.; Zhang, G.; Carling, P.A.; Chen, H. Assessment of local outburst flood risk from successive landslides: Case study of Baige landslide-dammed lake, upper Jinsha river, eastern Tibet. J. Hydrol. 2021, 599, 126294. [Google Scholar] [CrossRef]
- Zhang, L.; Xiao, T.; He, J.; Chen, C. Successive landsliding and damming of the Jinsha River in eastern Tibet, China: Prime investigation, early warning, and emergency response. Landslides 2019, 16, 583–596. [Google Scholar] [CrossRef]
- Zhong, Q.; Chen, S.; Wang, L.; Shan, Y. Back analysis of breaching process of Baige landslide dam. Landslides 2020, 17, 1681–1692. [Google Scholar] [CrossRef]
- Zhang, L.; Xiao, T.; He, J.; Chen, C. Erosion-based analysis of breaching of Baige landslide dams on the Jinsha River, China, in 2018. Landslides 2019, 16, 1965–1979. [Google Scholar] [CrossRef]
- Song, L.; Wang, Y.-S.; Hu, D.-Y.; Wu, H.-C.; Tang, T.; Liu, S.-C. Insights into the long-term stability of landslide dams on the eastern margin of the Tibetan Plateau, China–A case study of the Diexi area. J. Mt. Sci. 2023, 20, 1674–1694. [Google Scholar] [CrossRef]
- Song, L.; Wang, Y.; Zhao, Y.; Xiao, Z.; Feng, Z.; Liu, S.; Tang, T. Distribution and Stabilization Mechanisms of Stable Landslide Dams. Sustainability 2024, 16, 3646. [Google Scholar] [CrossRef]
- Tapponnier, P.; Xu, Z.Q.; Roger, F.; Meyer, B.; Arnaud, N.; Wittlinger, G.; Yang, J.S. Oblique stepwise rise and growth of the Tibet Plateau. Science 2001, 294, 1671–1677. [Google Scholar] [CrossRef]
- Chen, G.; Xu, X.; Wen, X.; Wang, Y. Coseismic slip distribution of the 2010 Yushu earthquake derived from joint inversion of InSAR and GPS data. Seismol. Res. Lett. 2010, 81, 703–711. [Google Scholar]
- Casagli, N.; Ermini, L.; Rosati, G. Determining grain size distribution of the material composing landslide dams in the Northern Apennines: Sampling and processing methods. Eng. Geol. 2003, 69, 83–97. [Google Scholar] [CrossRef]
- Troncone, A.; Pugliese, L.; Parise, A.; Mazzuca, P.; Conte, E. Post-failure stage analysis of flow-type landslides using different numerical techniques. Comput. Geotech. 2025, 182, 107152. [Google Scholar] [CrossRef]
- Pastor, M.; Tayyebi, S.M.; Stickle, M.M.; Yagüe, Á.; Molinos, M.; Navas, P.; Manzanal, D. A depth integrated, coupled, two-phase model for debris flow propagation. Acta Geotech. 2021, 16, 2409–2433. [Google Scholar] [CrossRef]
- Bao, Y.; Su, L.; Chen, J.; Zhang, C.; Zhao, B.; Zhang, W.; Zhang, J.; Hu, B.; Zhang, X. Numerical investigation of debris flow–structure interactions in the Yarlung Zangbo River valley, north Himalaya, with a novel integrated approach considering structural damage. Acta Geotech. 2023, 18, 5859–5881. [Google Scholar] [CrossRef]
- Li, W.; Qian, J.; Yin, Z.; Zhou, C. CFD-DEM Coupled Simulation of Seepage Erosion in Gap-Graded Sandy Soils. Rock. Soil. Mech. 2021, 42, 123–135. [Google Scholar]
- Wang, Z.; Ruiken, A.; Jacobs, F.; Ziegler, M. A new suggestion for determining 2D porosities in DEM studies. Geomech. Eng. 2014, 7, 665–678. [Google Scholar] [CrossRef]
- Wang, F.; Cheng, Q.; Highland, L.; Miyajima, M.; Wang, H.; Yan, C. Preliminary investigation of some large landslides triggered by the 2008 Wenchuan earthquake, Sichuan Province, China. Landslides 2009, 6, 47–54. [Google Scholar]
- Gorum, T.; Fan, X.; van Westen, C.J.; Huang, R.Q.; Xu, Q.; Tang, C.; Wang, G. Distribution pattern of earthquake-induced landslides triggered by the 2008 Wenchuan earthquake. Geomorphology 2011, 133, 152–167. [Google Scholar] [CrossRef]
- Wang, Y. Experimental Study on Air-Entrainment Fluidization Mechanisms of High-Speed Long-Runout Landslides; Southwest Jiaotong University Press: Chengdu, China, 2014. [Google Scholar]
- Wang, Y.; Cheng, Q.; Zhu, Q. Inverse Grading Characteristics and Mechanisms of Debris Flow Deposits Triggered by the Wenchuan Earthquake. Chin. J. Rock Mech. Eng. 2012, 31, 1089–1106. [Google Scholar]
- Zheng, G.; Xu, Q.; Peng, S. Depositional Characteristics and Mechanisms of Landslide-Generated Debris Flows. J. Eng. Geol. 2019, 27, 785–795. [Google Scholar]
- Cheng, Q. Dynamics of High-Speed Rock Landslides; Southwest Jiaotong University Press: Chengdu, China, 1999. [Google Scholar]
- Ren, S. Development Characteristics and Formation Mechanisms of Landslide Damming in the Alpine Gorge Region of the Upper Min River. Master’s Thesis, China University of Geosciences (Beijing), Beijing, China, 2018. [Google Scholar]
- Xu, J.; Wang, Z. Formation Mechanisms and Functional Roles of Step-Pool Systems. J. Hydraul. Eng. 2004, 1–9. [Google Scholar]
- Wang, Z.Y.; Melching, C.S.; Duan, X.H.; Yu, G.A. Ecological and Hydraulic Studies of Step-Pool Systems. J. Hydraul. Eng. 2009, 135, 705–717. [Google Scholar] [CrossRef]
- Wang, Z.; Cui, P.; Yu, G.; Zhang, K. Stability of landslide dams and development of knickpoints. Environ. Earth Sci. 2012, 64, 1067–1080. [Google Scholar] [CrossRef]
- Lenzi, M.A. Stream bed stabilization using boulder check dams that mimic step-pool morphology features in Northern Italy. Geomorphology 2002, 45, 243–260. [Google Scholar] [CrossRef]
- Wang, Z.; Zhang, C. Riverbed Structures and Energy Dissipation-Hazard Mitigation Mechanisms in Southwestern Mountainous Rivers. J. Hydraul. Eng. 2019, 50, 124–134+154. [Google Scholar]
Disclaimer/Publisher’s Note: The statements, opinions and data contained in all publications are solely those of the individual author(s) and contributor(s) and not of MDPI and/or the editor(s). MDPI and/or the editor(s) disclaim responsibility for any injury to people or property resulting from any ideas, methods, instructions or products referred to in the content. |
© 2025 by the authors. Licensee MDPI, Basel, Switzerland. This article is an open access article distributed under the terms and conditions of the Creative Commons Attribution (CC BY) license (https://creativecommons.org/licenses/by/4.0/).

