You are currently viewing a new version of our website. To view the old version click .
Applied Sciences
  • Article
  • Open Access

31 July 2025

Fragility Assessment and Reinforcement Strategies for Transmission Towers Under Extreme Wind Loads

,
,
and
1
POWERCHINA Fujian Electric Power Engineering Co., Ltd., Fuzhou 350001, China
2
School of Civil and Environmental Engineering, Changsha University of Science and Technology, Changsha 410114, China
3
School of Civil Engineering, Central South University, Changsha 410075, China
*
Authors to whom correspondence should be addressed.
This article belongs to the Section Civil Engineering

Abstract

Transmission towers are particularly vulnerable to extreme wind events, which can lead to structural damage or collapse, thereby compromising the stability of power transmission systems. Enhancing the wind-resistant capacity of these towers is therefore critical for improving the reliability and resilience of electrical infrastructure. This study utilizes finite element analysis (FEA) to evaluate the structural response of a 220 kV transmission tower subjected to fluctuating wind loads, effectively capturing the dynamic characteristics of wind-induced forces. A comprehensive dynamic analysis is conducted to account for uncertainties in wind loading and variations in wind direction. Through this approach, this study identifies the most critical wind angle and local structural weaknesses, as well as determines the threshold wind speed that precipitates structural collapse. To improve structural resilience, a concurrent multi-scale modeling strategy is adopted. This allows for localized analysis of vulnerable components while maintaining a holistic understanding of the tower’s global behavior. To mitigate failure risks, the traditional perforated plate reinforcement technique is implemented. The reinforcement’s effectiveness is evaluated based on its impact on load-bearing capacity, displacement control, and stress redistribution. Results reveal that the critical wind direction is 45°, with failure predominantly initiating from instability in the third section of the tower leg. Post-reinforcement analysis demonstrates a marked improvement in structural performance, evidenced by a significant reduction in top displacement and stress intensity in the critical leg section. Overall, these findings contribute to a deeper understanding of the wind-induced fragility of transmission towers and offer practical reinforcement strategies that can be applied to enhance their structural integrity under extreme wind conditions.

1. Introduction

Transmission lines serve as critical components of power infrastructure, playing a central role in maintaining the stability and reliability of modern electrical grids. In response to the rapid growth of China’s energy sector, transmission towers are being constructed with greater heights and longer spans to accommodate rising electricity demand. However, these structural features, i.e., increased height, extended span length, and high flexibility, make transmission towers particularly vulnerable to wind-induced forces, which have become a dominant factor in their structural design and performance considerations []. In recent years, the growing frequency and severity of extreme wind events have significantly elevated the risk of transmission tower failures. Such failures have resulted in widespread power outages, service disruptions, and substantial economic losses across affected regions [,]. This trend underscores the urgent need to reassess wind-resistance design standards and develop more robust structural strategies to enhance the resilience of transmission infrastructure in wind-prone environments.
Extensive research has been conducted on the wind resistance of transmission towers, focusing on key issues such as wind-induced vibrations, failure modes, and collapse mechanisms. To illustrate, Deng et al. [] performed wind tunnel tests on both individual towers and tower-line systems, revealing that the wind vibration coefficients specified in existing design standards are significantly underestimated. Zhu et al. [] utilized numerical simulations to analyze the structural vulnerability of transmission towers under varying wind directions, identifying critical conditions leading to collapse and quantifying associated failure probabilities. Fu et al. [] introduced a simplified uncertainty analysis method for evaluating the combined effects of wind and rain loads on transmission towers, offering a more efficient approach for load estimation. Similarly, Tian et al. [] conducted full-scale experimental and numerical investigations to replicate collapse scenarios, thereby identifying common failure modes in lattice tower structures. An et al. [] identified collapse-prone regions within lattice frameworks and emphasized the need for targeted reinforcement. In another study, Liang et al. [] examined the aeroelastic behavior of tower-line systems through wind tunnel experiments, highlighting the strong dynamic coupling between towers and conductors. Zhang et al. [] explored progressive collapse mechanisms under strong wind conditions, demonstrating that failure patterns are highly dependent on the initial location, extent, and distribution of structural damage, as well as the deformation trajectory during collapse. Ma et al. [] proposed a resilience assessment framework for transmission towers exposed to hurricane conditions, establishing vulnerability curves that support probabilistic structural evaluations and risk-informed decision-making.
Transmission tower failures under extreme wind conditions are typically triggered by localized component failures that exceed critical load-bearing thresholds and subsequently propagate through the main structural framework, leading to progressive collapse []. To account for end moments generated by eccentric connections, many structural design codes incorporate simplified formulations that adjust the slenderness ratio, thereby reflecting the influence of end eccentricity on member stability [,,,]. However, these advancements in code provisions have rendered many legacy transmission towers noncompliant with current performance and safety standards. In response to this discrepancy, extensive research has been directed toward understanding the stress distribution and failure mechanisms in transmission tower components through both mechanical testing and numerical simulation [,]. Findings consistently show that initial geometric imperfections [], internal bending moments in primary load-bearing members [], and eccentric axial loading [] are critical factors influencing overall structural stability and collapse modes. In a detailed study, Elgaaly et al. [] identified six distinct failure modes in angle steel components with low slenderness ratios, emphasizing the significant role of joint configuration, slenderness ratio, and width-to-thickness ratio in determining failure behavior.
Reinforcement strategies for transmission towers have primarily focused on strengthening vulnerable structural components to enhance overall stability and resistance to failure. Lu et al. [] investigated the effects of bolt pre-tightening force, slip load, and dynamic stiffness on the performance of reinforced joints. Baran et al. [] explored the impact of bolt quantity, connection configurations, and the number of connecting plates through a combination of experimental tests and finite element simulations, providing a more comprehensive understanding of joint reinforcement behavior. Patrick et al. [] reported that reducing weld spacing had a negligible effect on the compressive strength of reinforced angle steel. Balagopal et al. [] explored strengthening existing bolted joints in transmission towers using GFRP and steel reinforcement plates. Their experiments compared the load-sharing behavior of GFRP and steel retrofits, concluding that both materials significantly enhanced the tensile capacity of aged bolted joints. Zhuge et al. [] developed a three-dimensional continuum element model to simulate reinforcement strategies using panel and bolt connections. Xie et al. [] proposed a diagonal rod stiffening technique that effectively shifted the dominant failure mode from diagonal bracing buckling to main leg buckling. This transition in failure mechanism resulted in a substantial increase in the ultimate load-bearing capacity of the tower. Liu et al. [] introduced an innovative clamping reinforcement method, which achieved a 21.96% improvement in ultimate bearing capacity.
Despite notable advancements in component-level testing, evaluating individual angle steel members under axial or eccentric loading conditions fails to capture the global structural behavior of transmission towers or accurately assess the effectiveness of reinforcement strategies at the system level. Traditional numerical simulation methods, which typically adopt uniform modeling scales (e.g., beam or shell elements for the entire structure), often encounter difficulties in simultaneously resolving both global deformation patterns and localized stress concentrations, especially during progressive failure and collapse scenarios. To address these limitations, multi-scale simulation methods have emerged as a promising alternative []. Multi-scale simulation refers to a computational strategy that couples different modeling resolutions or element types—typically coarse-scale global models (e.g., beam or shell elements) with fine-scale local models (e.g., solid or continuum elements)—within a unified framework through interface constraint techniques, allowing for simultaneous and consistent analysis of both macroscopic structural performance and microscopic damage evolution [,]. This methodology enables localized phenomena such as yielding, buckling, or fracture to be modeled with high fidelity, without compromising the computational efficiency required for simulating the entire tower structure. Compared to traditional component-level modeling, which isolates structural members and neglects interaction effects, multi-scale modeling captures the global load redistribution, progressive failure propagation, and structure-reinforcement interactions with significantly greater accuracy []. Wang et al. [] validated the effectiveness of multi-scale modeling by comparing simulation outcomes with rigid frame models, truss models, and experimental data. Their study introduced a multi-stage damage detection framework based on multi-scale finite element modeling, enhancing accuracy in identifying failure progression. Liu et al. [] applied multi-scale techniques to analyze the failure modes of critical tower nodes under extreme weather conditions, revealing detailed local damage patterns that would be overlooked in single-scale models. Yang et al. [] conducted a comparative study of hierarchical and concurrent multi-scale modeling approaches, demonstrating that the concurrent method offered superior accuracy in capturing structural responses and stress distributions.
While numerous studies have addressed transmission tower failure mechanisms, angle steel reinforcement techniques, and multi-scale simulation methods, few have provided a systematic and quantitative evaluation that directly links failure mechanisms to the effectiveness of reinforcement strategies. To bridge this gap, the present study aims to enhance the load-bearing capacity of transmission towers by conducting a comprehensive structural analysis of a representative 220 kV tower using the finite element software Abaqus []. The research investigates the tower’s behavior under various wind attack angles, with a particular focus on identifying instability patterns and collapse mechanisms induced by extreme wind loading. Critical structural vulnerabilities that contribute to failure are systematically examined. To mitigate these weaknesses, a concurrent multi-scale reinforcement model is developed, allowing for detailed simulation of local reinforcement effects within the context of global structural behavior. The model is validated through numerical simulations to ensure its reliability.

2. Project Overview

2.1. Meteorological Characteristics

Typhoon Doksuri (No. 2305) made landfall in Jinjiang, Fujian Province, China, with maximum wind speeds near the storm center reaching level 15. During landfall, meteorological observations recorded extreme wind conditions across Quanzhou, including in Nan’an, Jinjiang, and the city center, with both gust speeds and 10 min mean wind speeds exceeding historical records. Data collected from nearby monitoring stations revealed that the 10 min mean maximum wind speed at the locations of three collapsed transmission towers reached 35 m/s.

2.2. Transmission Line Design and Damage Condition

The transmission line was originally designed for a maximum wind speed of 33 m/s, corresponding to a 15-year return period, measured at 10 m above ground level. The design also specified a minimum ambient temperature of −5 °C, with no consideration for ice accretion. Towers #51 and #52 on Huibian III Road were equipped with double-split LGJ-300/25 steel-core aluminum stranded conductors and designed with a safety factor of 2.5. Under maximum working conditions, these conductors experience a tensile stress of 100 MPa, while the average operational stress is 62.56 MPa—approximately 25% of the conductor’s breaking strength.
Originally, the towers were outfitted with two GJ-50 galvanized steel strand ground wires. Following a technical upgrade, these were replaced with JLB-40/80 aluminum-clad steel strands, offering a higher safety factor of 3.0. The upgraded ground wires have a maximum working stress of 204 MPa and an average operational stress of 153.01 MPa, also corresponding to 25% of their breaking strength.
The towers that collapsed include Huibian III Road #51 tower (designated ZM3-24), #52 tower (ZM3-33), and Huizhai Line #21 tower (ZM2-24). As illustrated in Figure 1, on-site forensic investigations revealed that failure in the #52 tower initiated in the third segment above the base legs. The collapse mechanism involved bending instability in the primary load-bearing members, torsional deformation of the cross-bracing, and detachment of auxiliary structural components, culminating in a progressive structural failure.
Figure 1. Examples of transmission tower damage conditions.

3. Numerical Simulation Analysis

3.1. Model Establishment

This study investigates the structural behavior of the ZM3-33 tower, a representative 220 kV transmission tower with a total height of 40.7 m. The design wind speed is specified as 33 m/s at a reference height of 10 m above ground level, with a minimum operating temperature of −5 °C and no ice accretion considered. The analysis incorporates LGJ-300/25 steel-core aluminum stranded conductors and JLB-40/80 aluminum-clad steel ground wires, consistent with the actual tower configuration. The tower structure is primarily composed of equal-leg angle steel members. Q355-grade steel is used for the main load-bearing components, including the tower body and legs, while Q235-grade steel is employed for bracing and auxiliary elements. The mechanical properties of these steel grades are summarized in Table 1. Both Q355 and Q235 steels share an elastic modulus (E) of 2.06 × 10⁵ N/mm2 and a density (ρ) of 7850 kg/m3.
Table 1. The parameters of the transmission tower angle steel components.
To characterize the material response, a bilinear hardening model is adopted. This model captures both the elastic and plastic stages of deformation. As depicted in Figure 2, in this idealized model, point “a” denotes the yield point where plastic deformation begins. ε k represents the bending strain while ε y represents the yield strain, σ y is yield stress. The segment oa characterizes the linear elastic response of the material, governed by Hooke’s Law, while segment ab represents the plastic deformation region, where the material exhibits a reduced stiffness due to strain hardening. The stress–strain relationship is defined as
σ = E 0 ε   , 0 < ε < ε y σ y + E 1 ( ε ε t ) , ε > ε y
where ε is strain, σ is stress, E 0 is elastic modulus, and E 1 is the tangent modulus in the plastic region, representing the strain hardening rate. For both Q235 and Q355 structural steel, material parameters were based on nominal values specified in Chinese steel standards. For both Q235 and Q355 structural steel, material parameters were based on nominal values specified in Chinese steel standards. Specifically, the yield stress was taken as 235 MPa for Q235 and 355 MPa for Q355, respectively. The ultimate tensile strength was assumed to be 370–500 MPa for Q235 and 470–630 MPa for Q355, based on standard ranges provided in the corresponding specifications. The transmission tower is divided into seven segments, is shown in Figure 3. A constant strain hardening modulus Et = 0.01E was adopted for both materials, in line with previous studies modeling tower member behavior under monotonic loading. It is to be noted that no additional coupon testing was conducted in this study, and the use of nominal material properties is a common engineering practice for large-scale tower simulations where component-level variability is not the primary focus. Overall, such bilinear model provides a computationally efficient yet sufficiently accurate approximation of the material behavior under wind-induced stresses, and it has been widely validated in similar transmission tower collapse and buckling analyses.
Figure 2. Stress–strain curves of steel.
Figure 3. Division of transmission tower sections.
For the finite element analysis, the transmission tower structure was discretized using a nonlinear finite element approach. Beam elements (B31) were employed to model primary members, following the methodology proposed by Xiong and Liang [], who demonstrated the effectiveness of this strategy in capturing both elastic and plastic responses under incremental wind loading. To replicate the real-world boundary constraints, fixed supports are applied at the tower base, ensuring that translational and rotational degrees of freedom are fully restrained. The complete finite element model, including all geometric and boundary conditions, is shown in Figure 4. This model forms the basis for subsequent simulations aimed at evaluating structural performance, identifying failure modes, and assessing the effectiveness of reinforcement strategies under various wind loading scenarios.
Figure 4. FEM model of transmission tower.
To assess the adequacy of the transmission tower’s structural design, a modal analysis was performed. This analysis is crucial for evaluating the dynamic characteristics of the tower, particularly in light of its high flexibility. This study focuses on the first three natural vibration modes, as these are most influential in determining the tower’s dynamic response. The corresponding mode shapes are illustrated in Figure 5. The first mode, with a natural frequency of 1.6992 Hz, is characterized by longitudinal bending deformation along the height of the tower. The second mode, with a frequency of 2.2081 Hz, involves lateral bending deformation, indicating displacement perpendicular to the tower’s longitudinal axis. The third mode represents the overall torsional deformation of the structure, occurring at a frequency of 3.5536 Hz.
Figure 5. Modal analysis.

3.2. Wind Load Simulation Method

The harmonic synthesis method is employed to simulate the time-varying fluctuating wind speeds across multiple segments of the transmission tower. In this approach, the wind field is modeled as a one-dimensional multivariate Gaussian random process, denoted by the vector ( u t = { u 1 t   u 2 t u n t } T ), where its cross-spectral density matrix S ω and cross-correlation function matrix R ω are semi-positive definite complex matrices. The Cholesky decomposition of S ω l can be expressed as
S ω l = H ω l H T ω l
where H T ω l is the conjugate transpose matrix of H ω l . The argument of the off-diagonal elements is given by
θ j m ( ω ) = tan 1 I m H j m ( ω ) Re H j m ( ω )
where Im and Re represent the imaginary and real parts of the matrix elements, respectively. The resulting random wind field u j ( t ) can then be expressed as
u j ( t ) = k = 1 j l = 1 N | H j k ( ω l ) | 2 Δ ω l cos ( ω l t + ϕ k l ) j = 1 , 2 , , n
where N is a sufficiently large positive integer representing the number of data sampling points, and ϕ k l is a random independent phase angle uniformly distributed between 0 and 2 π . The Kaimal spectrum is adopted to characterize the power spectral density of fluctuating wind speeds, providing a realistic representation of the wind’s frequency content. The parameters used for simulating the wind speed time history are summarized in Table 2. Figure 6 presents the comparison between the simulated wind speed spectrum and the target Kaimal spectrum, confirming the accuracy of the frequency representation. Figure 7 displays the corresponding time history of the simulated wind speed, effectively illustrating the temporal variability and stochastic nature of the wind field at the specified height.
Table 2. List of parameters for fluctuating wind speed time history simulation.
Figure 6. Comparison of wind speed spectrum at 40.7 m.
Figure 7. Wind speed time history at 40.7 m.

3.3. Wind Load Calculation

In accordance with the reference [], a comparative evaluation was conducted among the equivalent static wind load calculation methods specified in several international and national standards, including CEI/IEC 60826:2003, BS EN 50341-1:2012, ASCE Manual No. 74:2009, and China’s national standard GB 50545-2010 []. The comparison revealed that the GB 50545-2010 method produced the most conservative wind load estimates, providing a higher margin of safety in structural design. Accordingly, this study adopts the GB 50545-2010 formulation for subsequent wind load analysis to ensure a conservative and safety-oriented evaluation of the transmission tower’s structural performance.
The wind speed V ( z , t ) at different sections of the transmission tower is expressed as the sum of the average wind speed V ¯ ( z , t ) and the fluctuating wind speed v ( z , t ) , as shown in Equation (4):
V ( z , t ) = V ¯ ( z , t ) + v ( z , t )
Given the inherent variability of atmospheric wind, the wind loads acting on different segments of the transmission tower must be modeled as a dynamic load. Furthermore, uncertainties associated with climate variability, terrain features, and wind direction necessitate a comprehensive evaluation of the structural response under different wind attack angles. In the present study, wind loads corresponding to the angles of 0° and 90° attack angle were calculated following the specifications outlined in DL/T 5551-2018 [] and GB 50545-2010 [], using the following standard Equation:
W S ( t ) = μ Z c × μ S c × A S c × V ( z , t ) 2 / 1.6
where W S ( t ) is the standard wind load on the transmission tower structure (kN), μ Z c is the height variation coefficient of wind pressure, μ S c is the shape coefficient, A S c is the projected area of the windward surface (m2). Specifically, the shape coefficient is a critical parameter that reflects the aerodynamic characteristics of the structural elements exposed to wind. This coefficient varies with structural geometry, wind approach angle, and member configuration.
In addition, to evaluate wind direction effects beyond those prescribed by national codes, additional wind angles of 45° and 60° are considered in accordance with GB 50545-2010 []. The corresponding wind angle configurations are illustrated in Figure 8. The wind load acting on the ground conductor is determined using
W x = α m W 0 μ Z c μ S c β c d L p B sin 2 θ
where α m is the wind pressure non-uniformity coefficient, W 0 is the standard value of the basic wind pressure (kN/m2), β c is the wind load adjustment coefficient for the grounding wire, d is the calculated outer diameter of the conductor (m), L p is the horizontal span of the transmission tower (m), B is the icing increase coefficient (in this study, B = 0), θ is the angle between the wind direction and the conductor. To enhance computational efficiency, the distributed wind loads acting on the conductors were simplified and applied as equivalent concentrated forces at selected nodal locations. This approach is based on Equation (7). The transformation from a continuous to a discrete load representation is a common numerical strategy in large-scale structural simulations, particularly when modeling slender elements like cables or conductors in wind-sensitive systems. By replacing distributed line loads with equivalent point loads at finite element nodes, the system stiffness matrix becomes more tractable, reducing computational complexity and memory requirements. More importantly, this simplification facilitates faster and more stable convergence in the nonlinear finite element analysis.
Figure 8. Illustration of attack wind angles.

4. Wind-Induced Response Under Strong Wind

4.1. Wind Angle Analysis

The previously calculated wind loads were uniformly applied to the load-bearing nodes of the primary structural components and cross-arm elements. The Newton–Raphson iterative algorithm was adopted to solve the nonlinear equilibrium equations, with the following convergence criteria: residual force tolerance: ≤1.0 × 10⁻⁴; displacement increment threshold: less than 10% of the previous increment, and maximum iterations per load step: 50. The resulting stress and displacement distributions of the transmission tower, subjected to a wind speed of 33 m/s from four distinct wind directions, are illustrated in Figure 9 and Figure 10. The analysis reveals that the maximum stress concentration occurs in the main structural member at the compression zone of the third segment, located near the mid-height of the tower. This region represents a critical structural vulnerability that could compromise overall stability under multidirectional wind loading. Despite the localized stress peaks, the stress levels in all primary members remain below the material yield strength, indicating that the structure operates within the elastic deformation range. As shown in Figure 10, the maximum displacement is observed at the tower top, which aligns with the expected deformation pattern of tall, slender structures subjected to lateral wind forces.
Figure 9. The moment of maximum stress contour.
Figure 10. The moment of maximum displacement contour.
As illustrated in Figure 11, the maximum stress and displacement values under different wind directions are summarized to assess the directional sensitivity of the transmission tower’s structural response. The analysis reveals that a wind direction of 45° induces the most severe loading conditions. At this angle, the stress in the primary structural components reaches 259.2 MPa—approximately 75% of the yield strength—while the maximum displacement at the tower top is 458.2 mm, equivalent to 1.14% of the tower’s total height. Comparable trends are observed for the 0° and 60° wind directions, where stress and displacement values remain elevated but below those observed at 45°. In contrast, the 90° wind direction results in the lowest stress (168.6 MPa) and minimal top displacement (302.3 mm), indicating a less critical loading scenario. The results exhibit a nonlinear relationship between wind direction and structural response. As the wind direction shifts from 0° (frontal wind) to 45°, both stress and displacement increase, driven by a corresponding increase in the projected windward area. This area reaches its maximum at 45°, leading to peak aerodynamic loading. Beyond this point, as the wind direction approaches 90° (lateral wind), the projected windward area decreases, resulting in a reduction in both stress and displacement. These findings highlight the pronounced effect of wind direction on structural performance, identifying 45° as the most critical wind angle for the tower.
Figure 11. Results of transmission tower at different wind angle (v10 = 33 m/s).

4.2. Transmission Tower Collapse Analysis

To further investigate the failure mechanisms of the transmission tower under extreme wind conditions, Table 3 summarizes the tower’s top displacement and maximum stress values under various wind speeds, specifically for a 45° wind direction—the most critical loading case identified earlier. The results consistently indicate that the highest stress concentrations occur in the main structural members of the third tower section. A detailed schematic of these primary material rods is provided in Figure 12.
Table 3. Transmission tower displacement and maximum stress under different wind speeds (45°).
Figure 12. Position of No.1~No.4 rod in Section 3.
Figure 13 presents the stress distribution in the No. 1 to No. 4 main structural rods as a function of increasing wind speed. For wind speeds below 30 m/s, the stress in these rods gradually increases, with the No. 1 rod bearing the greatest load along the tower leg. However, as wind speeds exceed 30 m/s, the stress distribution becomes more uniform across the No. 1, No. 2, and No. 4 rods, indicating a redistribution of internal forces. A critical threshold is observed at a wind speed of 37 m/s, where a sudden surge in top displacement occurs, as illustrated in Figure 14. This marks the onset of large-scale deformation and structural instability. At this wind speed, the No. 1, No. 2, and No. 4 rods simultaneously enter the plastic deformation phase, as shown in Figure 15, initiating yielding and leading to plastic instability in the tower’s primary load-bearing elements. This transition results in a rapid loss of structural stiffness and load-bearing capacity, ultimately triggering the collapse of the transmission tower.
Figure 13. No.1~No.4 rod stress curve with wind speed.
Figure 14. Variation curves of tower top displacement.
Figure 15. Failure of the third section.

5. Concurrent Multi-Scale Reinforcement Modeling

5.1. Establishment of Concurrent Multi-Scale Model

As identified in Section 3, the lower halves of the main structural members in the third segment of the tower—specifically, rods No. 1 through No. 4—constitute the most critical region of vulnerability under strong wind loading. To capture the localized structural behavior of this zone with higher fidelity, a detailed sub-model is developed and integrated into a concurrent multi-scale modeling framework.
In multi-scale simulations, effective coupling between global and local models requires compatibility in degrees of freedom (DOFs) at the interface. When the DOFs are consistent between different element types, direct nodal connections can be used. However, in cases where discrepancies in DOFs exist, constraint equations must be formulated to enforce kinematic compatibility in both translational and rotational motions across the interface []. This relationship is mathematically expressed as
C I = I = 1 N C o I U I
where C(I) represents the constant term; U(I) is the degree of freedom variable; Co(I) is the coefficient of U(I); and N is the total number for the constraint equations. To implement this coupling, the Multi-Point Constraint (MPC) method in Abaqus is adopted. The MPC algorithm automatically generates constraint equations and is capable of accommodating nonlinear phenomena such as large displacements and the birth or death of elements. This makes it especially effective for modeling complex joint behavior, including rigid rods and rigid beams. In this study, beam and solid elements are integrated using the MPC approach, where the node of the beam element is designated as the control node. This node governs the displacement and rotation of the adjacent solid element nodes, ensuring continuity and mechanical consistency across the model interface. The coupling configuration is illustrated in Figure 16.
Figure 16. MPC connection.
To strengthen the identified weak region in the third section of the tower, the traditional perforated plate reinforcement method is implemented. This technique involves the installation of perforated steel connecting plates at both ends of the primary structural members (typically angle steel rods), forming a bolted assembly that redistributes internal forces and improves local stability. The perforated plate reinforcement method is defined as a structural strengthening approach in which plates with pre-drilled bolt holes are used to bridge critical members through frictional and mechanical interlock provided by bolted joints, thereby enhancing both the stiffness and load-bearing capacity of the target region [,]. Mechanically, the reinforcement effect is achieved through dual mechanisms: (1) direct force transmission via bolt preload and bearing contact between the plate and the member, and (2) confinement effect, where the plate assembly constrains the local deformation and delays the onset of instability. Compared to full-member replacement or welded stiffening techniques, the perforated plate method offers several key advantages, such as non-destructive installation, better stress redistribution, ease of customization, as well as improved fatigue resistance.
The reinforced structural configuration is illustrated in Figure 17. Given the complexity of simulating contact interactions between bolts and surrounding structural components, a simplified modeling approach is adopted. The normal contact behavior is defined as hard contact, preventing interpenetration of mating surfaces. Tangential behavior is modeled using a penalty friction formulation, with a friction coefficient set to 0.3 to represent realistic slip resistance during shear load transfer. To replicate the mechanical effect of bolted joints while minimizing computational cost, all nodes on the bolt hole surface are coupled to a single central control node positioned at the geometric center of the bolt hole. This coupling ensures uniform load distribution and accurate stress representation. In addition, connector elements are employed to simulate the bolt preload. These elements are assigned axial preload forces that replicate the initial clamping force exerted during bolt tightening, as shown in Figure 18.
Figure 17. Multi-scale transmission tower model after reinforcement.
Figure 18. Bolt hole detail.

5.2. Model Validation

To assess the accuracy and reliability of the concurrent multi-scale model, a modal analysis was conducted for both the rigid frame model and the multi-scale model of the transmission tower. Consistency was maintained by using identical material properties and structural configurations in both models. The first ten natural frequencies extracted from each model are summarized in Table 4. The comparison reveals close agreement, with a maximum deviation of only 1.12%, demonstrating that the multi-scale model effectively captures the global dynamic characteristics of the transmission tower. In addition, the tower’s top displacement under varying wind speeds at a 0° wind direction was compared between the two models. Due to space constraints, this comparative analysis focuses on displacement results only. As shown in Figure 19, the displacement values obtained from the multi-scale model closely match those of the rigid frame model, with deviations remaining within 5%.
Table 4. Comparison of modal analysis results.
Figure 19. Two models of variation curves of tower top displacement.
Furthermore, a comparison of stress distributions in the No. 1 to No. 4 main structural rods at a wind speed of 33 m/s is presented in Figure 20. The beam element model yields a relatively coarse stress distribution due to its simplified representation of geometry and stress fields. In contrast, the solid elements within the multi-scale model provide a more refined and detailed depiction of localized stress concentrations. This enhanced resolution underscores the enhanced capability of the multi-scale model in accurately identifying critical stress regions that are essential for failure analysis and reinforcement design. Expectedly, the minor discrepancies in displacement and stress predictions between the two models can be attributed to the complex mechanical coupling between beam and solid elements at the interface. These interface points may introduce localized inaccuracies in force transfer, resulting in slight computational deviations. Nevertheless, the observed differences remain within an acceptable tolerance range and do not compromise the overall validity of the multi-scale modeling approach.
Figure 20. Local stress contrast diagram under 0° wind angle.

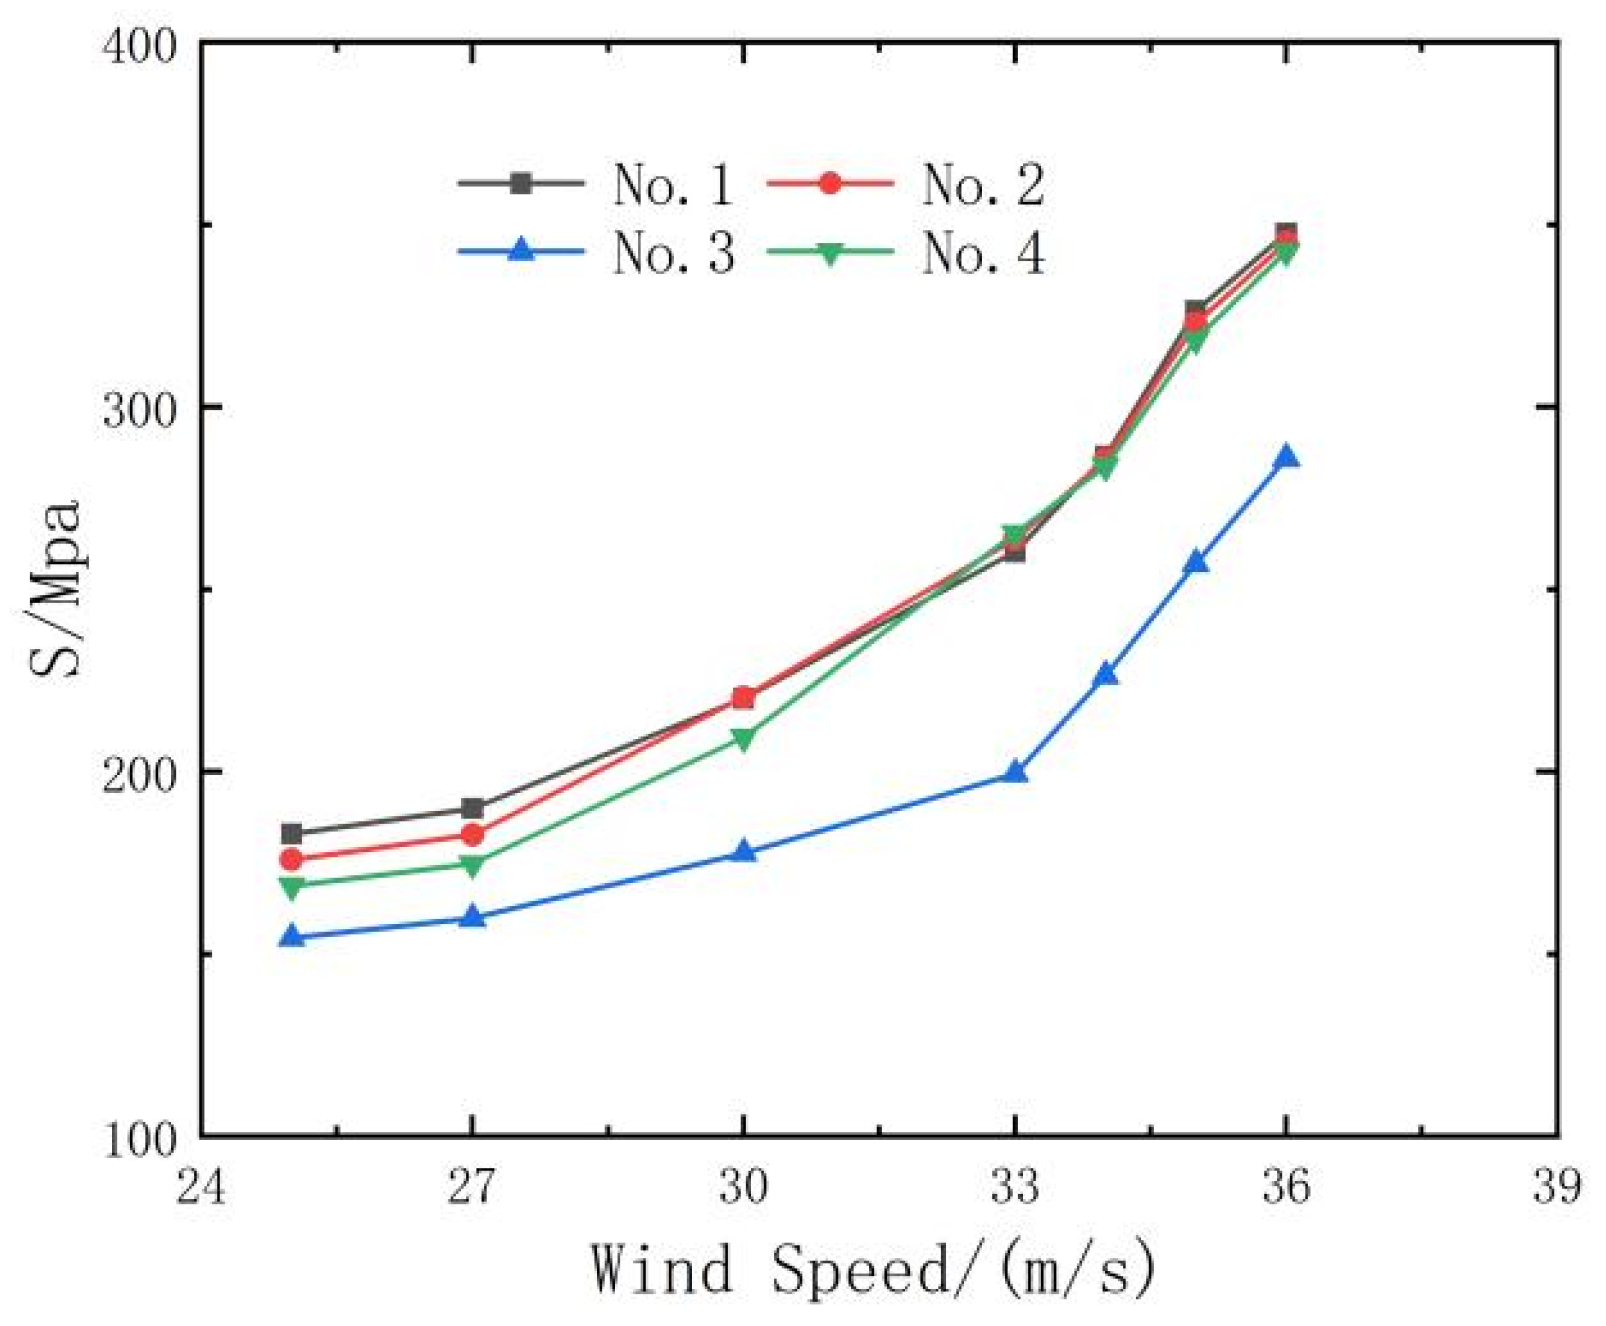
5.3. Evaluation of Bearing Capacity After Reinforcement

To evaluate the effectiveness of the proposed reinforcement strategy, a structural analysis was conducted under a wind speed of 33 m/s. The resulting tower top displacements at various wind angles were calculated and are shown in Figure 21. Compared to the unreinforced results presented in Figure 8, the reinforced model exhibits a reduction in top displacement of approximately 10%, indicating an improvement in global structural stiffness and lateral stability.
Figure 21. Displacement at different wind angle.
Figure 22, Figure 23, Figure 24 and Figure 25 display the stress contours of both main and auxiliary structural components under four different wind directions. The results reveal a clear reduction in stress levels in the primary load-bearing members following reinforcement. The inclusion of bolt preload in the simulation introduces localized stress concentrations around the bolt holes in both the main and auxiliary components. Furthermore, the stress distribution in the auxiliary members is found to be non-uniform, with comparatively lower stress values observed along the edges of the angle steel. This indicates that the main structural stresses are effectively transferred to the ends of the auxiliary components via filler plates, after which the stresses gradually diffuse toward the central regions of the auxiliary materials.
Figure 22. The 0° stress contour.
Figure 23. The 45° stress contour.
Figure 24. The 60° stress contour.
Figure 25. The 90° stress contour.
Table 5 and Table 6 summarize the stress values in rods No. 1 through No. 4 before and after reinforcement across the four wind angles. The data show a consistent stress reduction ranging from 13% to 21% post-reinforcement, highlighting the effectiveness of the perforated plate reinforcement method in enhancing the transmission tower’s load-bearing capacity.
Table 5. Stress of main material before and after reinforcement.
Table 6. Stress of auxiliary material.
Despite these improvements, the stress levels within the auxiliary components remain relatively low, suggesting suboptimal force transmission and underutilization of reinforcement materials. To improve load distribution efficiency in practical engineering applications, it is recommended to increase the number of connecting plates used in the localized reinforcement of tower legs. This adjustment could enhance the uniformity of stress distribution within the auxiliary materials, thereby improving the overall structural efficiency and utilization of the reinforcement system.

6. Conclusions

This study investigated the instability and collapse behavior of a 220 kV ZM3-33 transmission tower subjected to strong wind conditions, with a focus on identifying structural vulnerabilities and evaluating the effectiveness of reinforcement strategies. A concurrent multi-scale finite element model was developed to analyze the weak region of the structure, and a traditional perforated plate reinforcement method was applied. The key findings are summarized as follows:
  • By accounting for wind load uncertainties and variations in wind direction, the 45° wind angle was identified as the most critical loading condition for the ZM3-33 transmission tower. Collapse is primarily initiated by plastic instability in the main structural members of the third section. As wind speed increases, the lower part of this section simultaneously enters the plastic yield phase, resulting in a rapid decline in load-bearing capacity. The critical wind speed at which collapse occurs is approximately 37 m/s.
  • Comparative analysis of natural frequencies, displacement responses, and stress distributions between the rigid frame model and the concurrent multi-scale model evidenced the enhanced accuracy of the latter. The multi-scale model effectively captures localized stress concentrations while maintaining consistency in global structural behavior, thereby validating its suitability for high-fidelity structural assessments.
  • The applied reinforcement strategy significantly improved the transmission tower’s structural performance. The tower top displacement was reduced by approximately 10%, and the stress levels in the main tower leg members decreased by 13% to 21% under wind loading. However, non-uniform stress distribution in the auxiliary members indicates suboptimal force transmission.
The current study focuses on a single tower configuration, with a specific geometry, material grade (Q235 and Q355 steel), and conductor configuration. While this provides a realistic and practical case for model development and validation, it inherently limits the direct transferability of the results to towers of different voltage classes, geometries, or structural layouts. Generalizing the reinforcement strategies or failure modes observed here to dissimilar tower types may require additional parametric studies or recalibration of key model parameters. On the other hand, the wind loads were simulated using a deterministic approach based on codified equations (DL/T 5551-2018, GB 50545-2010) and further simplified by applying concentrated forces on conductor nodes. Although this study considers multiple wind attack angles, the wind field is assumed to be horizontally uniform and does not include spatial turbulence, localized phenomena, e.g., downbursts [,], typhoons [], and tornadoes [,]. Therefore, the results provided are most applicable to synoptic-scale wind conditions and may not fully capture dynamic response behaviors induced by transient or spatially complex wind events. Furthermore, this study evaluates the performance of one conventional reinforcement method (perforated plate bolted strengthening). Although the method is validated and shows improved stress reduction, other reinforcement techniques—such as FRP jacketing, welded stiffeners, or adaptive dampers—were not considered.
Additionally, further refinement of the multi-scale modeling approach is recommended, with a focus on improving interface coupling techniques to enhance simulation accuracy and computational efficiency.

Author Contributions

Formal analysis, J.Y.; Investigation, J.Y.; Resources, L.W.; Writing—original draft, J.Y.; Writing—review & editing, Z.S.; Supervision, F.C.; Funding acquisition, F.C. All authors have read and agreed to the published version of the manuscript.

Funding

This project was funded by National Natural Science Foundation of China (Project No: 52278479).

Data Availability Statement

The original contributions presented in the study are included in the article, further inquiries can be directed to the corresponding authors.

Conflicts of Interest

Author Lanxi Weng was employed by the company POWERCHINA Fujian Electric Power Engineering Co., Ltd. The remaining authors declare that the research was conducted in the absence of any commercial or financial relationships that could be construed as a potential conflict of interest.

References

  1. Chen, F.-B.; Zhang, T.; Yi, J.-R.; Shu, Z.-R.; Li, Y. Non-Gaussian characteristics and extreme wind pressure of long-span roof under various approaching flow turbulences. J. Build. Eng. 2023, 76, 107266. [Google Scholar] [CrossRef]
  2. Li, S.; Wu, T. Optimizing Post-Hurricane Recovery of Interdependent Infrastructure Systems via Knowledge-Enhanced Deep Reinforcement Learning. Adv. Wind Eng. 2025, 2, 100039. [Google Scholar] [CrossRef]
  3. Swabarna, R.; Chinmay, K.K. State of the art review of wind induced vibration and its control on transmission towers. In Structures; Elsevier: Amsterdam, The Netherlands, 2021. [Google Scholar]
  4. Deng, H.Z.; Si, R.J.; Hu, X.Y.; Duan, C.Y. Wind tunnel study on wind-induced vibration responses of a UHV transmission tower-line system. Adv. Struct. Eng. 2023, 16, 1175–1185. [Google Scholar] [CrossRef]
  5. Zhu, C.; Yang, Q.; Huang, G.; Zhang, X.; Wang, D. Fragility analysis and wind directionality-based failure probability evaluation of transmission tower under strong winds. J. Wind Eng. Ind. Aerodyn. 2024, 246, 105668. [Google Scholar] [CrossRef]
  6. Fu, X.; Li, H.N.; Li, G. Fragility analysis and estimation of collapse status for transmission tower subjected to wind and rain loads. Struct. Saf. 2016, 58, 1–10. [Google Scholar] [CrossRef]
  7. Tian, L.; Pan, H.; Ma, R.; Zhang, L.; Liu, Z. Full-scale test and numerical failure analysis of a latticed steel tubular transmission tower. Eng. Struct. 2020, 208, 109919. [Google Scholar] [CrossRef]
  8. An, L.; Wu, J.; Zhang, Z.; Zhang, R. Failure analysis of a lattice transmission tower collapse due to the super typhoon Rammasun in July 2014 in Hainan Province, China. J. Wind Eng. Ind. Aerodyn. 2018, 182, 295–307. [Google Scholar] [CrossRef]
  9. Liang, S.; Zou, L.; Wang, D.; Cao, H. Investigation on wind tunnel tests of a full aeroelastic model of electrical transmission tower-line system. Eng. Struct. 2015, 85, 63–72. [Google Scholar] [CrossRef]
  10. Zhang, Z.; Li, H.; Li, G.; Wang, W.; Tian, L. The numerical analysis of transmission tower-line system wind-induced collapsed performance. Math. Probl. Eng. 2013, 2013, 413275. [Google Scholar] [CrossRef]
  11. Ma, L.; Khazaali, M.; Bocchini, P. Component-based fragility analysis of transmission towers subjected to hurricane wind load. Eng. Struct. 2021, 242, 112586. [Google Scholar] [CrossRef]
  12. Huang, X.; He, S.-Y.; Liu, X.-Y.; Han, D.-G.; Pu, F.; Yan, H.-Q.; Kang, S.-B. Compression behaviour of Q355 steel equal-leg angles with simulated local defects at the mid-height. J. Constr. Steel Res. 2024, 217, 108673. [Google Scholar] [CrossRef]
  13. AISC. Load and Resistance Factor Design Specification for Structural Steel Buildings; American Institute of Steel Construction: Chicago, IL, USA, 2005. [Google Scholar]
  14. BS5950; Structural Use of Steelwork in Building–Part 1: Code of Practice for Design–Rolled and Welded Sections. BSI: London, UK, 2000.
  15. Code of Practice for Structural Use of Steel 2005; Buildings Department, SAR Government: Hong Kong, 2005.
  16. BS EN 1993-1-1; Eurocode 3 Design of Steel Structures–Part 1-1: General Rules and Rules for Building. CEN BSI: London, UK, 2005.
  17. Li, B.; Cao, P.; Zhang, D.; Guo, Y. Experimental research on behavior of Q420 dual-angle steel with cruciform section under dynamic compression. J. Vibroeng. 2017, 19, 2031–2042. [Google Scholar] [CrossRef]
  18. Fong, M.; Cho, S.H.; Chan, S.L. Design of angle trusses by codes and second-order analysis with experimental verification. J. Constr. Steel Res. 2009, 65, 2140–2147. [Google Scholar] [CrossRef]
  19. Liu, H.Y.; Lu, Z.L.; Huang, Z.L. A study on the bearing capacity of angle steel members in transmission towers. Prog. Steel Build. Struct. 2021, 23, 47–55. (In Chinese) [Google Scholar]
  20. Yue, Y.; Bo, S.; Xiaochen, M.; Yadi, L.; Yingyun, S. Prediction model of transmission line fault probability applying attention mechanism. Electr. Power Constr. 2022, 43, 42–49. (In Chinese) [Google Scholar]
  21. Li, Z.L.; Li, Y.; Liu, H.J.; Ohsaki, M.; Shi, J.H. Experimental study on mechanical behavior of single angle under eccentric compression. J. Build. Struct. 2018, 39, 146–155. [Google Scholar]
  22. Elgaaly, M.; Dagher, H.; Davids, W. Behavior of single-angle-compression members. J. Struct. Eng. 1991, 117, 3720–3741. [Google Scholar] [CrossRef]
  23. Lu, C.H.; Ma, X.; Mills, J.E. Cyclic performance of bolted cruciform and splice connectors in retrofitted transmission tower legs. Thin-Walled Struct. 2018, 122, 264–285. [Google Scholar] [CrossRef]
  24. Baran, E.; Akis, T.; Sen, G.; Draisawi, A. Experimental and numerical analysis of a bolted connection in steel transmission towers. J. Constr. Steel Res. 2016, 121, 253–260. [Google Scholar] [CrossRef]
  25. Mulholland, P.R.; Denavit, M.D. Compression strength of reinforced steel angles. Eng. Struct. 2024, 306, 117875. [Google Scholar] [CrossRef]
  26. Balagopal, R.; Prasad Rao, N.; Rokade, R.P.; Umesha, P.K. Experimental Investigation on Strengthening of Bolted Connections in Transmission/Communication Towers. J. Inst. Eng. (India) Ser. A 2018, 99, 269–277. [Google Scholar] [CrossRef]
  27. Zhuge, Y.; Mills, J.E.; Ma, X. Modelling of steel lattice tower angle legs reinforced for increased load capacity. Engi. Struct. 2012, 43, 160–168. [Google Scholar] [CrossRef]
  28. Xie, Q.; Zhang, J. Experimental study on failure modes and retrofitting method of latticed transmission tower. Eng. Struct. 2016, 226, 111365. [Google Scholar] [CrossRef]
  29. Liu, C.-C.; Yan, Z.; Jiang, T.; Guo, T.; Zou, Y.-B. Experimental study on failure modes of a transmission tower reinforced with clamps. Eng. Fail. Anal. 2024, 159, 108151. [Google Scholar] [CrossRef]
  30. Wang, F.; Xu, Y.; Qu, W. Mixed-dimensional finite element coupling for structural multi-scale simulation. Finite Elem. Anal. Des. 2014, 92, 12–25. [Google Scholar] [CrossRef]
  31. Xiao, S.P.; Belytschko, T. A bridging domain method for coupling continua with molecular dynamics. Comput. Methods Appl. Mech. Eng. 2004, 193, 1645–1669. [Google Scholar] [CrossRef]
  32. Fish, J. Bridging the scales in nano engineering and science. J. Nanoparticle Res. 2006, 8, 577–594. [Google Scholar] [CrossRef]
  33. Nie, G.J.; Zhong, Z. Elasto-plastic analysis of beams by differential quadrature method. Eng. Mech. 2005, 22, 59–62. (In Chinese) [Google Scholar]
  34. Wang, C.Q.; Wang, H.C.; Li, L.; Zhao, X.L.; Sun, Q. Multi-scale finite element analysis of steel tube tower for large crossing transmission lines. Eng. Mech. 2013, 30, 147–152. (In Chinese) [Google Scholar] [CrossRef]
  35. Wang, F.Y.; Xu, Y.L.; Qu, W.L. Study on the failure mode of key nodes on high voltage transmission steel tube tower under multiscale model. Sci. Technol. Eng. 2014, 14, 32–38. (In Chinese) [Google Scholar]
  36. Yang, X.Y.; Fan, W.L.; Su, D.J.; Li, Z.L. Hierarchical-concurrent multiscale modeling of transmission towers. Prog. Steel Build. Struct. 2021, 23, 112–118. (In Chinese) [Google Scholar]
  37. ABAQUS, Version 2022; Dassault Systèmes Simulia Corp.: Providence, RI, USA, 2022.
  38. Xiong, T.H.; Liang, S.G. Limit Wind Loads of a Concrete Filled Steel-Tube Transmission Tower. Appl. Mech. Mater. 2012, 105, 1697–1704. [Google Scholar]
  39. GB 50545—2010; Code for Design of 110 kV~750 kV Overhead Transmission Line. China Planning Press: Beijing, China, 2010. (In Chinese)
  40. Zhang, Q.H.; Gu, M. Comparison among wind loads and wind-induced responses of typical lattice structures obtained using various codes. J. Vib. Shock 2015, 34, 140–145. (In Chinese) [Google Scholar]
  41. DL/T 5551—2018; Load Code for the Design of Overhead Transmission Line. China Planning Press: Beijing, China, 2018. (In Chinese)
  42. Yan, B.; Peng, Y.; Cheng, X.; Ma, C.; Tian, Y.; Ji, B.; Yan, Z. A refined empirical model of steady-state downburst based on high-resolution wind speed data obtained from wind tunnel tests. Adv. Wind Eng. 2024, 1, 100006. [Google Scholar] [CrossRef]
  43. Hao, J.; Feng, Y.; Su, B.; Li, J.; Wu, T. Generation of downburst outflow in a traditional wind tunnel using multi-blade flow control device. Adv. Wind Eng. 2025, 2, 100030. [Google Scholar] [CrossRef]
  44. Zhao, L.; Cui, W.; Fang, G.; Cao, S.; Zhu, L.; Song, L.; Ge, Y. State-of-the-art review on typhoon wind environments and their effects on long-span bridges. Adv. Wind Eng. 2024, 1, 100007. [Google Scholar] [CrossRef]
  45. Fang, G.; Zhang, Y.; Cao, J.; Pang, W.; Wang, J.; Cao, S.; Ge, Y.; Wen, Z. Development and application of a tornado database for the Chinese mainland. Adv. Wind Eng. 2024, 1, 100019. [Google Scholar] [CrossRef]
  46. Jing, H.; Zeng, S.; He, X.; Zhang, D.; Li, B. Vortex characteristics of a large-scale Ward-type tornado simulator at Central South University. Adv. Wind Eng. 2025, 2, 100038. [Google Scholar] [CrossRef]
Disclaimer/Publisher’s Note: The statements, opinions and data contained in all publications are solely those of the individual author(s) and contributor(s) and not of MDPI and/or the editor(s). MDPI and/or the editor(s) disclaim responsibility for any injury to people or property resulting from any ideas, methods, instructions or products referred to in the content.

Article Metrics

Citations

Article Access Statistics

Multiple requests from the same IP address are counted as one view.