Abstract
In order to explore the influence of the temperature gradient on rock failure degree during freezing and thawing, freeze–thaw-cycle tests were carried out on saturated red sandstone under the conditions of all-directional freeze–thaw and unidirectional freeze–thaw. The results show that the deformation behavior of saturated red sandstone during freeze–thaw cycles is significantly affected by freeze–thaw direction, and the redistribution of water during freeze–thaw cycles leads to significant strain variations. Macro-cracks caused by all-directional freeze–thaw are located in the center of the sample and crack from the inside out, while macro-cracks caused by unidirectional freeze–thaw are perpendicular to the temperature gradient direction and located in the lower part of the sample. Unidirectional freeze–thaw cycles cause the vertical inhomogeneity of the sample to be more obvious, and the uniaxial compressive strength of the sample decreases more significantly in the early stage. After 30 freeze–thaw cycles, the uniaxial strength of all-directional freeze–thaw and unidirectional freeze–thaw samples tends to be stable and virtually identical. The freeze–thaw cycles have seriously damaged the micro-structure of the sample, but the extent of damage to the cementing agents between particles is weaker than that caused by the all-directional freeze–thaw, owing to the seepage path formed in the pore water under unidirectional freeze–thaw conditions.
1. Introduction
With the development of large-scale engineering construction in alpine mountain areas, more and more projects in cold regions are concerned with the durability of structures in response to freeze–thaw cycles [1,2]. Under the action of freeze–thaw cycles, the physical and chemical properties of rock deteriorate, adversely affecting the operation of engineering projects [3]. Many researchers have studied this deterioration in rock and soil under low-temperature and freeze–thaw cycle conditions. Lei et al. [4] found that the compressive strength, tensile strength and elastic modulus of rock all decrease with an increasing number of freeze–thaw cycles, and the rock sample gradually changes from brittle failure to plastic failure. Through the application of acoustic emission technology, Wang et al. [5] observed that increasing the number of freeze–thaw cycles promoted the development of internal cracks in sandstone. The frost-heaving deformation of fissure water and pore water in rock is the key factor for the development of frost damage in geotechnical engineering, which is especially pronounced for rock mass with high permeability [6]. Differences between the designed freeze–thaw cycle tests are primarily reflected in variations in extreme temperatures, cycle duration, and heating/cooling time periods. Gao [7] conducted freeze–thaw cycle tests on sandstone using a 10 h cycle: freezing at −20 °C for 4 h, thawing at 20 °C for 4 h, with a total of 2 h allocated for heating and cooling transitions. Specimens underwent up to 40 freeze–thaw cycles. Noor-E-Khuda [8] conducted freeze–thaw cycle tests on weathered granite. The freeze–thaw temperature range was −10 °C to 70 °C, and each cycle lasted 8 h, consisting of 5 h of freezing and 3 h of thawing. Substantial evidence indicates that the greater the number of freeze–thaw cycles, the longer the cycle duration, and the larger the temperature difference between the upper and lower limits, the more severe the resulting freeze–thaw damage to rocks becomes. Chen [9] proposed that water migration affects crack initiation and propagation during freeze–thaw cycles and derived a macroscopic and microscopic damage model of rock mass that incorporates compaction deformation and accounts for the water migration mechanism of freeze–thaw damage. The rock mass involved in projects in cold regions is mostly large-volume semi-infinite bodies, such as slopes and tunnels. During freeze–thaw cycling, these rock masses predominantly experience non-uniform freeze–thaw cycles induced by one-sided cooling. Under such conditions, all surfaces of the rock mass experience different temperature boundaries, forming non-uniform temperature gradients [10,11,12] inside the rock mass. Under the temperature gradient of unidirectional freeze–thaw, the rock shows non-uniform frost heaving characteristics. Matsuoka [13] conducted saturated unidirectional freeze–thaw tests on samples of different rocks and preliminarily discussed the relationship between frost heaving and the freeze–thaw rate, freeze–thaw duration, and unfrozen water content. Based on the frost heaving test results, Yang et al. [14] proposed an innovative method to calculate anisotropic parameters. Jia et al. [15] established a coupled thermomechanical model of rock incorporating a unidirectional freezing temperature field and used this model to study the influence of the temperature gradient on frost-heave deformation. Suh et al. [16] proposed a multiphase porous mechanical model to simulate the growth and melting of ice lenses. Bai, Peppin et al. [17,18] argued that the theoretical values calculated by capillary theory are not always consistent with the experimental values and that capillary theory fails to provide a reasonable mechanism to explain the formation of new lenses. Based on the generalized Clapeyron equation and the thin film water migration driving force model, Cheng Hua et al. [19] constructed a generalized Clapeyron equation mechanical model, and believed that the frozen macropores produced concentrated suction at the curved ice-water interface, which drove the migration of capillary water in the unfrozen micropores and thin film water on the particle surface to the inside of the frozen macropores. The migration of pore water caused by a temperature gradient results in uneven water distribution within the rock and soil, which in turn leads to uneven frost-heaving damage.
This paper investigates the influence of freeze–thaw direction on rock strength. In unidirectional freeze–thaw cycle tests, rock specimens are wrapped with thermal insulation to confine heat transfer to the upper surface only. During the freeze–thaw cycles, specimen strain is monitored, and differences in freeze–thaw damage attributable to the direction of the temperature gradient are analyzed. The influence of different freeze–thaw cycle regimes on the microstructure of the rock specimens is analyzed using scanning electron microscopy (SEM). The differences in rock strength resulting from unidirectional versus all-directional freeze–thaw cycles can provide valuable insights for the design and maintenance of rock engineering structures in cold regions.
2. Materials and Methods
2.1. Sample Preparation
The medium sandstone is selected as the test material, and the basic physical properties are shown in Table 1. The rock sample is a cylinder of φ50 mm × h100 mm.

Table 1.
Basic physical properties of sandstone.
2.2. Test Equipment
The experimental setup comprises a freeze–thaw chamber, a temperature monitoring system, a strain monitoring device, and a uniaxial compression loading frame. The freeze–thaw chamber operates within a temperature range of −40 °C to +150 °C. Pt100 temperature sensors are used to monitor temperature changes on the top and bottom surfaces of rock specimens in real time during freeze–thaw cycling. The side and bottom surfaces of the unidirectional freeze–thaw specimen are wrapped with thermal insulation materials with a thermal conductivity of less than 0.02 W/(m·K). This configuration establishes a significant temperature gradient across the specimen (primarily from top to bottom), simulating unidirectional freezing conditions. Uniaxial compression testing was conducted using a servo-controlled loading frame with a maximum load capacity of 3000 kN.
2.3. Test Methods
Prior to testing, the rock specimens were vacuum saturated for 24 h, and the temperature sensors were affixed to the upper and lower surfaces of each specimen. Strain gauges were mounted on the side surface of the specimens to measure the strain at mid-height during freeze–thaw cycling. The experimental procedure is shown in Figure 1. Saturated specimens were then placed in the freeze–thaw chamber. Each freeze–thaw cycle lasted 12 h (Lei et al. [4], Wang et al. [20]), with a freezing temperature of −20 °C, a thawing temperature maintained at 20 ℃, and heating and cooling rates of 4 °C/min.
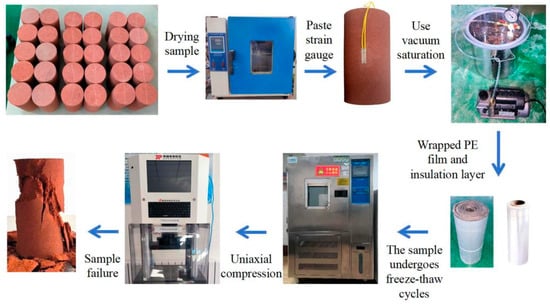
Figure 1.
Test flow.
3. Results and Analysis
3.1. Freeze–Thaw Strain
Figure 2a shows the curve of the maximum and minimum strains measured in the freeze–thaw cycles as a function of the number of cycles. It can be seen from the figure that the strain values differ significantly between samples subjected to unidirectional freeze–thaw and those subjected to all-directional freeze–thaw. During unidirectional freeze–thaw, as the number of cycles increases, both the maximum and minimum values of freeze–thaw strain initially decrease before stabilizing. The minimum value corresponds to the freeze shrinkage strain of rock during the freeze–thaw cycle, which gradually stabilizes after approximately 25 unidirectional freeze–thaw cycles. At this stage, the influence of freeze–thaw cycling on the rock’s frost shrinkage diminishes, and the water within the rock is redistributed during the cycles. The maximum value corresponds to the combined effect of pore-water frost-heave strain and rock frost shrinkage during the freeze–thaw cycle. When the unidirectional freeze–thaw cycle count reaches 30, the maximum freeze–thaw strain value stabilizes. At this point, pore expansion and micro-crack development within the rock matrix, influenced by pore water, are complete, and the rock sample’s porosity increases, enabling it to accommodate the volume expansion of pore water during freeze–thaw cycles. In contrast, with an increasing number of all-directional freeze–thaw cycles, the maximum freeze–thaw strain value increases while the fluctuation in the minimum freeze–thaw strain decreases. After about 30 freeze–thaw cycles, both the maximum and minimum strains of the specimen increased significantly and the specimen cracked due to frost heaving. Following frost-heaving cracking, the maximum strain of the sample remains nearly constant with further freeze–thaw cycles. At this stage, frost heaving has induced macro-cracks due to freeze–thaw damage, and the expansion from the water–ice phase change during frost heaving cannot fill the cracks once macro-cracks have formed in the rock.
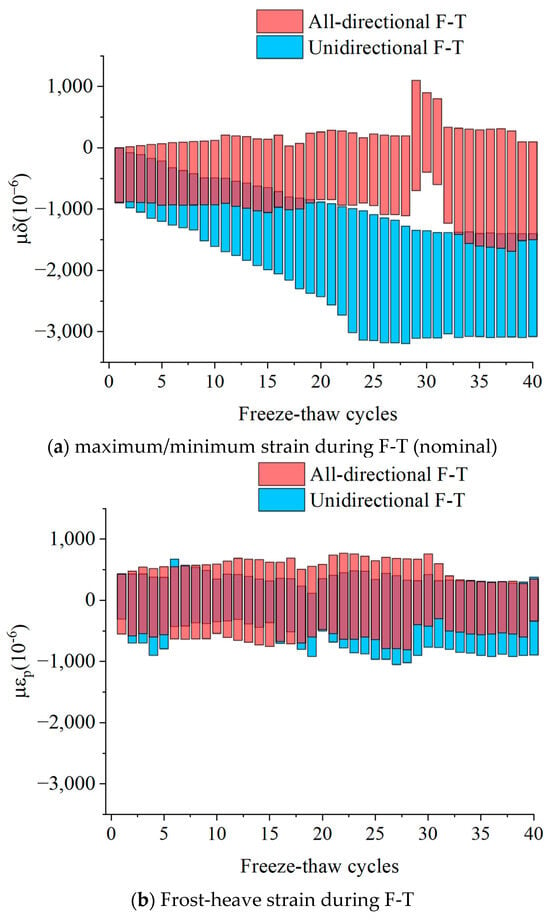
Figure 2.
Variation of maximum strain with F-T cycles.
As mentioned above, the measured freeze–thaw strain represents the total strain of rock samples during the freeze–thaw process. This total strain comprises four components (as illustrated in Figure 3): the temperature-induced strain of the protective coating, the temperature-induced strain of waterproof silicone rubber sealant, the temperature-induced strain of the rock itself, and the frost-heave strain. It can be expressed by the following equation:
where is the temperature strain of structural adhesive, is the temperature strain of waterproof silicone rubber, is the temperature strain of rock matrix, and is the strain caused by the participation of pore water. As mentioned above, the strain of dry red sandstone with a known thermal expansion coefficient can be measured using the quarter-bridge strain gauge configuration [21]. The frost-heaving strain during the freeze–thaw process is shown in Figure 2b. As can be seen from the figure, the minimum strain under unidirectional freeze–thaw is significantly reduced compared with the measured total strain, indicating that the frost shrinkage observed during unidirectional freeze–thaw is primarily caused by the temperature-induced strain of rock matrix and the structural adhesive. The maximum frost-heave strain under all-directional freeze–thaw is generally greater than that under unidirectional freeze–thaw throughout the 40 freeze–thaw cycles. With an increase in the number of freeze–thaw cycles, the maximum frost-heave strain of the sample fluctuates significantly in magnitude. After 30 freeze–thaw cycles, both the maximum and minimum strain values gradually stabilized following a brief period of fluctuation. At this stage, the damage inflicted on the red sandstone by the freeze–thaw cycles is essentially complete; micro-cracks have developed within the sample, and the expansion from the pore water phase change is no longer sufficient to fill the pores and exert pressure on the rock matrix.
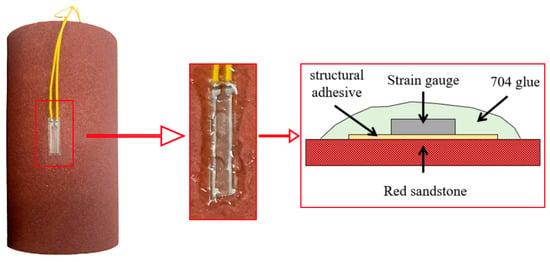
Figure 3.
Attachment method of strain gauge.
Figure 4a shows the frost-heave strain during the 1st, 3rd, 5th, 10th, 20th, 30th, and 40th freeze–thaw cycles in the unidirectional freeze–thaw process. The strain evolution can be divided into four distinct stages:
- (1)
- Heat transfer and phase change stage. The cooling rate of red sandstone is relatively low under unidirectional freeze–thaw conditions. At the beginning of the freezing stage, the rock temperature changes slowly due to the limited heat transfer between the environmental temperature and the rock sample; additionally, the surface of the strain gauge is encased within the thermal insulation layer and thus shielded from the cold environment. Despite this, the strain value increases rapidly at the onset of the freeze–thaw cycle. Although the temperature of the rock sample has not yet decreased to the freezing point, expansion begins at the measuring point. This occurs because the upper surface of the sample shrinks during cooling, while the strain measuring point is located in the middle of the sample and oriented perpendicular to the temperature gradient direction. Consequently, the measuring point experiences tensile deformation due to the freezing shrinkage of the upper sample region. This tensile deformation, combined with pore-water frost heaving induced by the gradual temperature decrease, results in the observed strain increase during this stage.
- (2)
- Cold shrinkage stage. After the phase transformation of pore water in red sandstone is largely completed, the sample primarily undergoes thermal deformation. In unidirectional freeze–thaw, the freezing front continues to advance along the temperature gradient direction after passing the strain measuring point. At this juncture, the frost-heave strain at the measuring point begins to decrease, marking the onset of the freezing contraction stage.
- (3)
- Melting phase transition stage. Analogous to the first stage, the sample exhibits shrinkage at the start of heating. This shrinkage occurs because unidirectional heating causes the exposed section to expand, thereby exerting compressive force on the measuring point in the middle of the sample, manifesting as shrinkage at the measurement point.
- (4)
- Thermal expansion stage. Following the complete melting of pore ice, the sample temperature continues to rise. Consequently, distinct thermal expansion deformation becomes evident in the strain curve.
Figure 4b shows the frost-heave strain during the 1st, 3rd, 5th, 10th, 20th, 30th, and 40th freeze–thaw cycles in the all-directional freeze–thaw process. Analogous to the process of unidirectional freeze–thaw, the phase change curve exhibits a similar division into four stages. However, distinct differences exist between the freezing phase transition and melting phase transition stages compared to unidirectional freeze–thaw:
- (1)
- Frozen phase transition stage. The frost-heaving strain value under all-directional freeze–thaw is typically greater than that of unidirectional freeze–thaw, yet the peak occurs significantly later. This delay occurs because the measuring point is located directly on the sample surface during all-directional freeze–thaw. Additionally, the strain of dry and saturated sandstone samples is similar during the cooling process prior to freezing. Frost heave commences only when the pore water adjacent to the surface freezes.
- (2)
- Cold shrinkage stage. As the temperature decreases further, pore-water phase change ceases, and the temperature of the red sandstone sample approaches the ambient temperature. The thermal deformation of rock skeleton particles progressively diminishes, and the slope of strain curve gradually approaches zero. At the end of this stage, the freezing contraction strain is markedly less than that observed under unidirectional freeze–thaw.
- (3)
- Melting phase transition stage. The higher heating rate results in more pore ice melting compared to unidirectional freeze–thaw. However, the melting process absorbs latent heat, causing a concomitant decrease in pore temperature. This temperature drop can lead to the re-freezing of pore water in some pores [22], resulting in violent fluctuations in the strain curve and even the appearance of two distinct troughs.
- (4)
- Thermal expansion stage. When the temperature rises above the freezing point of water, the pore ice in the red sandstone melts completely. Subsequently, only the thermal deformation of the rock skeleton particles occurs. As the difference between the sample temperature and the ambient temperature decreases, the thermal deformation activity of the rock particles weakens and the slopes of both the strain curve and the temperature curve gradually asymptote to zero.
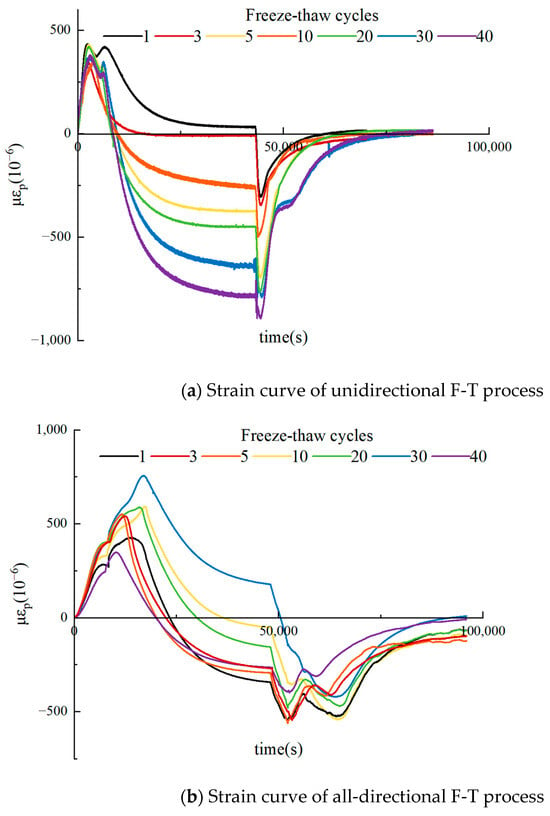
Figure 4.
Frost-heave strain in F-T cycle. (The abscissa is the time of a single freeze–thaw process, and the ordinate is the strain value).
The maximum value of frost-heave strain influenced by pore water during freeze–thaw cycles was described above. With an increase in the number of freeze–thaw cycles, the maximum frost-heave strain exhibits minimal change. However, during the 5th to 10th unidirectional freeze–thaw cycles, the minimum strain value in the freezing contraction stage increases. The minimum strain in the freezing contraction stage under all-directional freeze–thaw does not decrease monotonically but fluctuates. Building on this, the governing differential equation for heat conduction during a freeze–thaw cycle, derived from Fourier’s law of heat conduction and the principle of energy conservation, is given as follows [23]:
where is equivalent volumetric heat capacity, λ is thermal conductivity, L is the latent heat of phase change between ice water, is volumetric ice content, is bulk density of soil, and is the bulk density of ice. Based on the Richard equation, the water migration control equation is as follows [23]:
where is the hydraulic diffusion coefficient of rock and soil and is the permeability coefficient of rock and soil in the direction of gravity acceleration. At the same time, the thin film theory proposes that under the temperature gradient, the water film on the surface of the soil particles becomes asymmetric, leading to a thinner film at the cooler end and a thicker film at the warmer end, thereby creating an imbalance in the unfrozen water, ice, and soil particle system. Consequently, water molecules migrate within the film from the thicker to the thinner part to reach a new thermodynamic equilibrium driven by [24]. The relationship between the film thickness and temperature is as follows:
where is the thickness of water film, is temperature, A is Hammock constant, is the density of rock and soil, is the latent heat of ice, and is the freezing temperature of soil moisture. The film theory can describe the phenomenon of pore water migration to the freezing front. After each freeze–thaw cycle, micro-pores expand and micro-cracks develop in the rock, resulting in changes to pore water distribution. Inhomogeneities exist in both the pore water distribution and rock properties and the measurement location is fixed, which leads to a fluctuation in frost-heave strain at the measurement point. As the number of freeze–thaw cycles increases, original pore water gains more space for volume expansion during subsequent freeze–thaw cycles, so the destructive squeezing effects of pore water expansion on the rock are weakened in later freeze–thaw cycles. Simultaneously, water loss during pore water migration further reduces frost-heave strain. Comparing the characteristics of two freeze–thaw strain curves reveals that even for the same rock type under identical environmental temperature changes, different freezing directions will significantly influence the frost-heave process, resulting in distinct patterns of rock frost damage, as shown in Figure 5. It can be seen from the figure that under all-directional freeze–thaw conditions, frost damage occurs in the middle of rock samples, as cooling occurs internally from all surfaces, causing unfrozen water to gather at the sample’s center, while pore water near each surface freezes, filling rock pores and significantly reducing rock permeability [25]. At this time, the volume expansion generated after the internal water freezes causes significant damage to the rock matrix. In contrast, macroscopic frost damage under unidirectional freeze–thaw occurs in the middle and lower parts of the sample and is considerably less severe than under all-directional freeze–thaw. This reduced severity occurs because unidirectional freeze–thaw lowers the heat transfer efficiency between the sample and the environment, allowing pore water a longer migration time. Frost-heave pressure comprises two components: ice exerting pressure against the rock and unfrozen water pressure [15]. The pore water freezing front advances along the temperature gradient, but pore water remains unfrozen and has not undergone phase change ahead of the freezing front [26]. This unfrozen water has escape channels, enabling it to dissipate some pressure generated by the water–ice phase change during freezing, thereby weakening the frost damage to the rock.
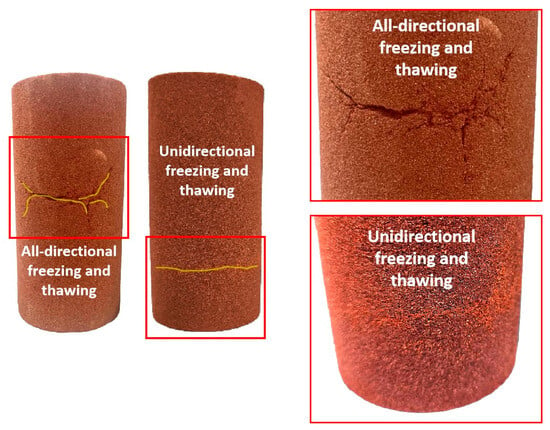
Figure 5.
Frost-heaving cracks.
3.2. Uniaxial Compressive Strength and Failure Mode
Figure 6 shows the stress–strain curve of rock sample after freeze–thaw cycling. As can be seen, the rock sample undergoes four stages during uniaxial compression: the initial pore compaction stage, the elastic deformation stage, the plastic deformation stage, and the failure stage. Most specimen failures show obvious distinct characteristics, meaning an obvious stress drop occurs after the peak on the stress–strain curve. The stress–strain curves of samples under different freeze–thaw cycles exhibit slight differences, with the following specific characteristics:
- (1)
- In the pore compaction stage, the pore compaction process in samples subjected to all-directional freeze–thaw is shorter, and the samples enter the elastic deformation stage after only a small amount of axial deformation.
- (2)
- In the elastic deformation stage, the stress–strain curve of red sandstone shows pronounced linear characteristics. The sample deforms elastically under load, and the elastic modulus of the all-directional freeze–thaw samples is larger than that of the unidirectional freeze–thaw samples. Due to cooling occurring primarily on the upper surface, the unidirectional freeze–thaw specimens exhibit more pronounced vertical inhomogeneity. Consequently, weak surfaces within the specimen tend to fail first during compression.
- (3)
- In the plastic deformation stage, with the further increase in load, the frozen–thawed red sandstone enters the plastic deformation stage. During this process, the stress–strain curve exhibits multiple discrete stress drops. The plasticity of the sample increases with the number of freeze–thaw cycles.
- (4)
- In the post-peak stage, with the increasing plastic deformation of the specimen, the fluctuation in the stress–strain curve further increases. After reaching the peak stress, the specimen fails and its strength drops rapidly.
Figure 6 also shows the variation in the unconfined compressive strength (UCS) of rock samples with the number of freeze–thaw cycles. The UCS decreases as the number of freeze–thaw cycles increases. For all-directional freeze–thaw samples, the UCS decreased slightly initially but rapidly later: the reduction was only about 34% after 0–20 cycles but accelerated to approximately 46% between cycles 20 and 30, resulting in a total reduction of about 80% after 30 cycles (relative to the initial strength). In contrast, the UCS of unidirectional freeze–thaw samples decreased rapidly in the early stages and then stabilized: a 57% reduction occurred within the first 20 cycles, followed by a much smaller decrease of 16% between cycles 20 and 30. This behavior is significantly different from that observed in all-directional freeze–thaw. The migration of pore water during unidirectional freezing and thawing is affected by temperature gradient, and there is an uneven distribution of water content in the vertical direction. When frost heaving occurs, the samples subjected to unidirectional freeze–thaw have uneven frost-heaving damage due to the uneven distribution of water content in the vertical direction. In the process of freezing and thawing in all directions, the uneven frost-heaving damage of rock samples is uneven from the central position of the samples to the outer surface. Comparing the two types of uneven damage, vertical inhomogeneity leads to a more obvious decrease in the early compressive strength. With an increase in the number of freeze–thaw cycles, the rock samples subjected to freeze–thaw in all directions have obvious macro-failure and the frost-heaving cracks extend outward from the center and connect with the outer surface. At this time, the crushing degree of the samples subjected to all-directional freezing and thawing is greater than that of samples subjected to unidirectional freezing and thawing, and the unconfined compressive strength is significantly reduced.
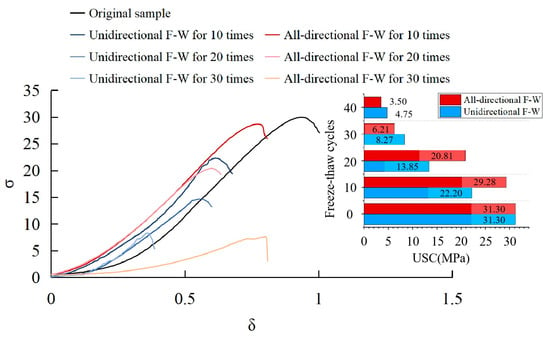
Figure 6.
Stress–strain curve and compressive strength change. (The ε is the strain in USC process, and the σ is the stress value).
During rock sample deformation under load, failure is often accompanied by minor rock fragment ejection, as shown in Figure 7. Under uniaxial compression, the microcracks induced by freeze–thaw cycles coalesce, leading to partial surface spalling [27]. As the number of freeze–thaw cycles increases, the damage intensifies and the sample failure typically exhibits shear characteristics. After fewer freeze–thaw cycles, the interparticle cohesion within the rock is stronger and the overall structure remains relatively stable. After a high number of freeze–thaw cycles, the rock structure experiences significant damage and the internal cementation is substantially weakened. Under uniaxial compression, specimens subjected to 40 unidirectional freeze–thaw cycles exhibit not only shear cracks but also localized crushing failure resulting from freeze–thaw-induced inhomogeneities. Macroscopic frost-heaving cracks are already present in the samples subjected to 40 all-directional F-T cycles. The propagation of these cracks significantly impacts the compressive strength at failure. The different freezing directions influence the water migration and freezing processes within the sample. Consequently, the samples exhibit significant anisotropy and inhomogeneity upon failure.
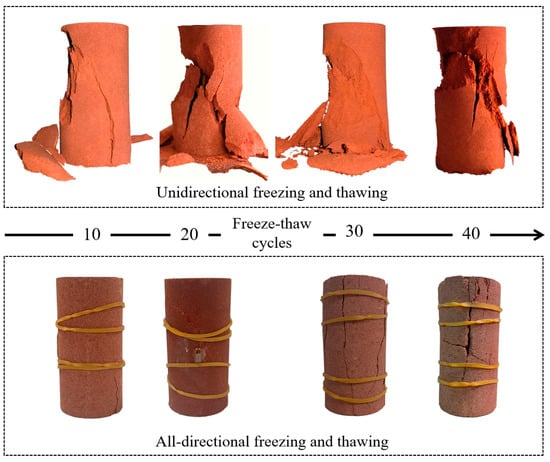
Figure 7.
Specimen compression failure diagram.
3.3. Micro-Structure
Figure 8 presents a scanning electron microscope (SEM) image of sandstone samples before and after freeze–thaw cycling. Sandstone, a common sedimentary rock, consists of sand grains bound together by cement. The images clearly show cement located between the sand grains. Figure 8a shows an SEM image of an untreated sandstone sample. The image reveals strong grain-to-grain cementation and well-filled pores. As this sample has not undergone freeze–thaw cycling, the grains and cement at the imaged surface show no evidence of damage from ice crystallization stresses. The grains retain their original angularity.
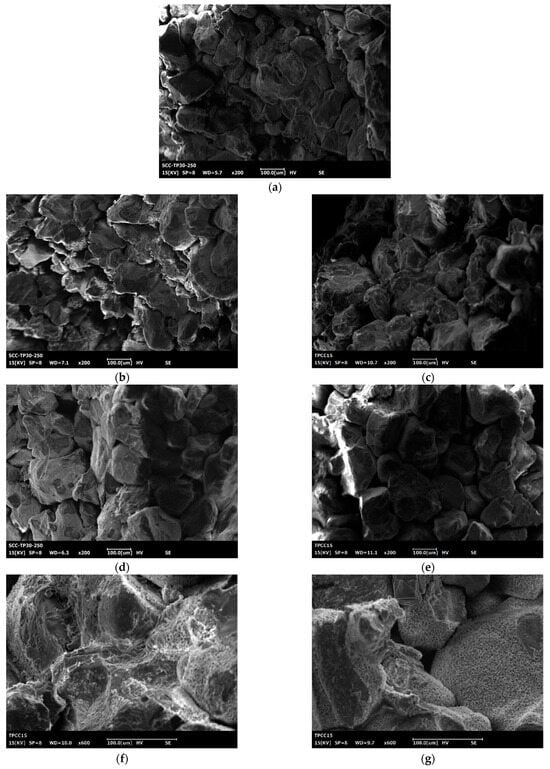
Figure 8.
Micro-structure. (a) Samples not subjected to freeze–thaw cycles (200 times); (b) Samples subjected to unidirectional freeze–thaw 10 times (200 times); (c) Samples subjected to all-directional freeze–thaw 10 times (200 times); (d) Samples subjected to unidirectional freeze–thaw 20 times (200 times); (e) Samples subjected to all-directional freeze–thaw 20 times (200 times); (f) 600 times electron microscope of unfrozen samples; (g) 600 times electron microscope of samples freeze–thawed 20 times in all directions.
Figure 8b,d depict sandstone samples after 10 and 20 unidirectional freeze–thaw cycles, respectively. Progressive freeze–thaw cycling weakens the intergranular cement. After 10 cycles, cementation is visibly reduced. However, the grains retain significant angularity. After 20 cycles, the amount of cement coating the grains decreases further and the grains become noticeably smoother.
Figure 8c,e display sandstone samples after 10 and 20 all-directional freeze–thaw cycles, respectively. Similarly, progressive all-directional freeze–thaw cycling gradually degrades the cement bonding between grains. This weakening results from the volumetric expansion of water during freezing within the pores, generating stresses that damage both the grains and the cement. However, after 20 cycles, compared to the all-directional freeze–thaw, the all-directional freeze–thaw sample exhibits a more pronounced reduction in grain-coating cement and increased particle smoothness. This difference arises because unidirectional freezing creates preferential pathways for water migration. As the 0 °C isotherm advances inward from the cooled surface, the volumetric expansion associated with ice formation drives unfrozen pore water ahead of the freezing front. This migration reduces the local water content available for ice formation near the grains later, thereby diminishing the localized stresses (e.g., crystallization pressure, frictional forces) exerted by the ice on the grain surfaces during freezing. Consequently, unidirectional freeze–thaw inflicts less damage than all-directional freeze–thaw.
Figure 8f,g provide higher-magnification views of the intergranular cement before and after freeze–thaw cycling, highlighting the changes. These images reveal obvious fracturing within the intergranular cement after freeze–thaw cycling. The loss of cement also renders the boundaries between individual rock grains more distinct. Regardless of the freezing direction, sample deterioration initiates with the progressive degradation of the intergranular cement due to F-T cycling. This degradation facilitates the initiation of microcracks, which propagate and ultimately culminate in macroscopic sample failure.
4. Discussion
In studies of concrete frost resistance and durability, Gao [28] noted that the deterioration behavior under freeze–thaw cycling was assessed via accelerating laboratory tests, where specimens experienced unrestricted deformation during testing. However, the actual structural members comprise multiple constrained concrete elements. When any element deforms due to freeze–thaw, surrounding elements restrict its deformation. This constrained deformation effect similarly governs heat transfer during rock freeze–thaw cycling. In realistic field conditions, only one surface of a rock mass is exposed to freezing temperatures, while adjacent geological materials restrict heat transfer through other surfaces. In high-porosity sandstones, interconnected pore networks enable pore water migration driven by temperature gradients. This process induces spatially heterogeneous water redistribution, resulting in localized damage from ice-phase expansion. In contrast, low-porosity, low-permeability rocks exhibit minimal water content, and their limited pore connectivity prevents significant water migration [8,29]. Consequently, the temperature gradient direction exerts a negligible influence on the strength of such rocks. Pore water migration is governed by porosity and pore geometry. Future research should investigate water migration mechanisms microscopically, clarifying the linkages between frost-heave microdamage and macroscopic properties.
5. Conclusions
- The F-T strain and frost-heave strain are significantly different under the two F-T cyclic loading modes. In the process of unidirectional F-T, the maximum value of F-T strain first decreases and then tends to be stable. The maximum value increases gradually in the process of F-T in all-directions, and the maximum value increases significantly in the 30th F-T because of the macroscopic damage to the sample. The frost-heave strain fluctuated in the early stage, and the phase-change expansion of pore water in the later stage could not fill the pores, so the frost-heave strain gradually stabilized.
- The change in temperature during F-T affects the distribution of pore water, the frost-heave strain of the sample is uneven in the vertical direction with the F-T cycle in the unidirectional F-T process, and the unfrozen area of pore water is located in the center of the sample in the all-directional F-T process, so the vertical strain measured on the surface cannot show its heterogeneity. There are macroscopic frost-heaving cracks extending outward from the center in the all-directional F-T specimen, while the frost-heaving cracks in the unidirectional F-T specimen are located in the lower part of the specimen and the damage degree is lower than that in the all-directional F-T specimen.
- The early strength of rock samples subjected to unidirectional F-T decreases more rapidly, but the strength tends to be stable after 30 cycles of F-T under two loading methods.
- F-T cycles will destroy the microstructure of sandstone samples, and as the number of F-T cycles increases, the destruction of cementing materials among sandstone particles will be intensified. Due to the overflow channel of pore water in the lower part of the unidirectional F-T specimen, the microstructure of the specimen is less damaged.
Author Contributions
Methodology, Z.L. (Zhongyao Li); Investigation, Z.L. (Zhen Liu) and H.T.; Resources, Q.R. and P.W.; Data curation, Z.L. (Zhongyao Li) and Z.L. (Zhen Liu); Writing—original draft, Z.L. (Zhongyao Li); Writing—review & editing, Q.R.; Supervision, Q.R. and P.W.; Funding acquisition, P.W. All authors have read and agreed to the published version of the manuscript.
Funding
This research was funded by National Natural Science Foundation of China: U20A20314; National Natural Science Foundation of China: 2023YFC3008300, 2023YFC2008304-4; National Natural Science Foundation of China: U202A20594; Linzhi Science and Technology Bureau of Xizang Autonomous Region: 2023-SYQ-010; Xizang Autonomous Region Science and Technology Department: XZ202401JD0005. The APC was funded by National Natural Science Foundation of China: U202A20594.
Institutional Review Board Statement
Not applicable.
Informed Consent Statement
Not applicable.
Data Availability Statement
The original contributions presented in this study are included in the article. Further inquiries can be directed to the corresponding authors.
Conflicts of Interest
The authors declare no conflict of interest.
References
- Martínez-Martínez, J.; Benavente, D.; Gomez-Heras, M.; Marco-Castano, L.; García-del-Cura, M.A. Non-linear decay of building stones during freeze–thaw weathering processes. Constr. Build. Mater. 2013, 38, 443–454. [Google Scholar] [CrossRef]
- Sun, Y.Q.; Meng, S.J.; Wang, M.; Mu, H.L.; Tang, X.C. Deterioration effect of freeze-thaw on mechanical properties of roadbed clay under unfavorable conditions. Bull. Eng. Geol. Environ. 2021, 80, 4773–4790. [Google Scholar] [CrossRef]
- Liu, N.F.; Yang, Y.L.; Li, N.; Liang, S.H.; Liu, H.; Li, C. The stability issue of fractured rock mass slope under the influences of freeze-thaw cycle. Sci. Rep. 2024, 14, 5674. [Google Scholar] [CrossRef] [PubMed]
- Lei, D.X.; Lin, H.; Wang, Y.X. Damage characteristics of shear strength of joints under freeze-thaw cycles. Arch. Appl. Mech. 2022, 92, 1615–1631. [Google Scholar] [CrossRef]
- Wang, C.Y.; You, R.; Lv, W.Y.; Sui, Q.R.; Yan, Y.H.; Zhu, H.J. Damage Evolution and Acoustic Emission Characteristics of Sandstone under Freeze-Thaw Cycles. Acs Omega 2024, 9, 4892–4904. [Google Scholar] [CrossRef] [PubMed]
- Huang, S.B.; Cai, C.; Yu, S.L.; He, Y.B.; Cui, X.Z. Study on damage evaluation indexes and evolution models of rocks under freeze-thaw considering the effect of water saturations. Int. J. Damage Mech. 2022, 31, 1477–1505. [Google Scholar] [CrossRef]
- Gao, F.; Li, C.; Xiong, X.; Zhang, Y.A.; Zhou, K.P. Dynamic behaviors of water-saturated and frozen sandstone subjected to freeze-thaw cycles. J. Rock Mech. Geotech. Eng. 2023, 15, 1476–1490. [Google Scholar] [CrossRef]
- Noor-E-Khuda, S.; Albermani, F.; Veidt, M. Flexural strength of weathered granites: Influence of freeze and thaw cycles. Constr. Build. Mater. 2017, 156, 891–901. [Google Scholar] [CrossRef]
- Chen, H.G.; Zhao, C.; Zhang, R.; Xing, J.Q.; Huang, L.; Qian, Y. Macro-micro damage model of the effect of freeze-thaw on jointed rocks considering compaction deformation. Eng. Fail. Anal. 2023, 151, 107407. [Google Scholar] [CrossRef]
- Deng, S.; Chen, H.; Gong, X.; Zhou, J.; Hu, X.; Jiang, G. A Frost Heaving Prediction Approach for Ground Uplift Simulation Due to Freeze-Sealing Pipe Roof Method. Cmes-Comput. Model. Eng. Sci. 2022, 132, 251–266. [Google Scholar] [CrossRef]
- Murton, J.B.; Ozouf, J.C.; Peterson, R. Heave settlement fracture of chalk during physical modelling experiments with temperature cycling above below 0 °C. Geomorphology 2016, 270, 71–87. [Google Scholar] [CrossRef]
- Zhang, C.; Zou, P.; Wang, Y.; Jiang, T.; Lin, H.; Cao, P. An elastovisco-plastic model based on stress functions for deformation and damage of water-saturated rocks during the freeze-thaw process. Constr. Build. Mater. 2020, 250, 118862. [Google Scholar] [CrossRef]
- Matsuoka, N. Mechanisms of rock breakdown by frost action: An experimental approach. Cold Reg. Sci. Technol. 1990, 17, 253–270. [Google Scholar] [CrossRef]
- Yang, N.Y.; Zheng, H.; Cai, H.; Liu, Y.Y.; Nishimura, S. Study on multidimensional frost heave characteristics and thermal-hydro-mechanical predictive model. Cold Reg. Sci. Technol. 2024, 224, 104227. [Google Scholar] [CrossRef]
- Jia, J.; Sun, K.; Wei, Y.; Xiong, Z.; Huang, Q.; Qin, J. Prediction of frost heaving stress in saturated sandstone in unidirectional freezing conditions. Int. J. Civ. Eng. 2023, 21, 1725–1738. [Google Scholar] [CrossRef]
- Suh, H.S.; Sun, W.C. Multi-phase-field microporomechanics model for simulating ice-lens growth in frozen soil. Int. J. Numer. Anal. Methods Geomech. 2022, 46, 2307–2336. [Google Scholar] [CrossRef]
- Bai, R.Q.; Lai, Y.M.; Pei, W.S.; Zhang, M.Y. Investigation on frost heave of saturated-unsaturated soils. Acta Geotech. 2020, 15, 3295–3306. [Google Scholar] [CrossRef]
- Peppin, S.S.L.; Style, R.W. The Physics of Frost Heave and Ice-Lens Growth. Vadose Zone J. 2013, 12, 1–12. [Google Scholar] [CrossRef]
- Cheng, H.; Chen, H.Q.; Cao, G.Y.; Rong, C.X.; Yao, Z.S.; Cai, H.B. Migration mechanism of capillary-film water in frozen soil and its experimental verification. Chin. J. Geotech. Eng. 2020, 42, 1790–1799. [Google Scholar] [CrossRef]
- Wang, M.; Meng, S.J.; Sun, Y.Q.; Fu, H.Q. Shear strength of frozen clay under freezing-thawing cycles using triaxial tests. Earthq. Eng. Eng. Vib. 2018, 17, 761–769. [Google Scholar] [CrossRef]
- Huang, S.B.; Cai, Y.; Liu, Y.Z.; Liu, G.F. Experimental and Theoretical Study on Frost Deformation and Damage of Red Sandstones with Diferent Water Contents. Rock Mech. Rock Eng. 2021, 54, 4163–4181. [Google Scholar] [CrossRef]
- Weng, L.; Wu, Z.J.; Liu, Q.S.; Chu, Z.F.; Zhang, S.L. Evolutions of the unfrozen water content of saturated sandstones during freezing process and the freeze-induced damage characteristics. Int. J. Rock Mech. Min. Sci. 2021, 142, 104757. [Google Scholar] [CrossRef]
- Bai, Q.B.; Li, X.; Tian, Y.H.; Fang, J.H. Equations and numerical simulation for coupled water and heat transfer in frozen soil. Chin. J. Geotech. Eng. 2015, 37 (Suppl. 2), 131–136. [Google Scholar] [CrossRef]
- Fu, Z.T.; Wu, Q.B.; Zhang, W.X.; He, H.L.; Wang, L.Y. Water Migration and Segregated Ice Formation in Frozen Ground: Current Advances and Future Perspectives. Front. Earth Sci. 2022, 10, 826961. [Google Scholar] [CrossRef]
- Lv, Z.T.; Xia, C.C.; Wang, Y.S.; Lin, Z.L. Frost heave and freezing processes of saturated rock with an open crack under different freezing conditions. Front. Struct. Civ. Eng. 2020, 14, 947–960. [Google Scholar] [CrossRef]
- Lin, H.; Lei, D.X.; Zhang, C.S.; Wang, Y.X.; Zhao, Y.L. Deterioration of non-persistent rock joints: A focus on impact of freeze-thaw cycles. Int. J. Rock Mech. Min. Sci. 2020, 135, 104515. [Google Scholar] [CrossRef]
- Fan, L.F.; Fan, Y.D.; Xi, Y.; Gao, J.W. Spatially distributed damage in sandstone under stress-freeze-thaw coupling conditions. J. Rock Mech. Geotech. Eng. 2022, 14, 1910–1922. [Google Scholar] [CrossRef]
- Gao, Z.H.; Wang, Z.D.; Wang, L. Influence of Restraint on Salt Frost Damage of Concrete: Water Migration. J. Chin. Ceram. Soc. 2024, 52, 3361–3371. [Google Scholar] [CrossRef]
- Qi, L.R.; Wang, J.D.; Zhang, D.F.; Zhang, Y.S.; Li, Z.X.; Sun, J.X.; Ma, J.F. A study of granite damage in the macro and microscopic scales under freezing-thawing cycles. Hydrogeol. Eng. Geol. 2021, 48, 65–73. [Google Scholar] [CrossRef]
Disclaimer/Publisher’s Note: The statements, opinions and data contained in all publications are solely those of the individual author(s) and contributor(s) and not of MDPI and/or the editor(s). MDPI and/or the editor(s) disclaim responsibility for any injury to people or property resulting from any ideas, methods, instructions or products referred to in the content. |
© 2025 by the authors. Licensee MDPI, Basel, Switzerland. This article is an open access article distributed under the terms and conditions of the Creative Commons Attribution (CC BY) license (https://creativecommons.org/licenses/by/4.0/).