Abstract
Wear, fatigue, and corrosion are just a few of the issues that mechanical components in engineering experience, leading to surface deterioration. Enhancing the surface characteristics of engineering components is therefore essential. The surface properties of engineering objects can be improved by applying different surface treatments. One of these processes is shot peening (SP). Process parameters are crucial for SP. This necessitates the optimization of SP process parameters. In this study, we applied SP and vibratory shot peening (VSP) processes to different steel materials (AISI 8620, AISI 5140, AISI 4140, and AISI 1020) using different process parameters, aiming to determine the effects of these parameters on hardness, residual stress, and surface roughness. The highest compressive residual stress (CRS) and hardness values for shot-peened samples were obtained at the 24–26 A intensity for all steels. For all steel-group VSP samples, the highest CRS and hardness values were obtained at the 60 s −4 mm parameter. This paper aims to predict Almen intensity values using CRS, surface roughness, and hardness values from various steels. The supplied experimental data was utilized to estimate the SP Almen intensity value using a number of machine learning (ML) methods, eliminating the need for costly and time-consuming experimentation. With an RMSE of 0.0731, R2 of 0.9665, and MAE of 0.0613, the deep neural network (DNN) surpassed the other models in terms of prediction accuracy. The results indicate that artificial intelligence technology could be utilized to accurately evaluate Almen intensity.
1. Introduction
Wear, corrosion, fatigue, and fracture are some of the many problems that can occur on the surfaces or outermost layers of engineering components [1]. These damages originate from the surface and depend on the characteristics of the component’s surface. Consequently, improving the surface quality of the part is crucial. For this purpose, chemical, thermal, thermochemical, and mechanical surface treatments are applied to materials [2,3]. Thermochemical treatments such as nitriding and boronizing, and mechanical surface treatments such as shot peening, are used to increase the resistance of materials to wear, corrosion, and fatigue. The idea behind the SP method is tossing tiny glass, steel, or ceramic balls onto the machine component. The goal is to enhance the parts’ surface properties by creating an incredibly thin, nanoscale layer either on top of or slightly below the surface. In the SP process, the shots hitting the sample surface create CRS on the surface, causing the hardness of the surface to increase. Fatigue crack formation time can be delayed by compressive residual pressure and crack closure stresses occurring after the SP process [4]. In addition, SP causes micro cracks, micro structural changes and changes in the surface roughness of the material. The parameters of this process must be carefully chosen because they have a positive impact on the surface qualities of the material. Poorly chosen process parameters lead to weak compressive residual stress development, worsening of the surface properties, and failure to attain the intended surface properties [5,6]. This has led to many experimental studies on determining the effect of SP process parameters [7,8,9,10,11]. The main issue with experimental studies is that they need excessive numbers of trials, which adds to the expenses and delays the research process. To address this issue, analytical techniques were employed to identify the ideal parameter [12,13,14,15]. Zarka [16] and Inlebert [17] conducted the initial analytical research for this reason. Guagliano’s [18] study addressed the relationship between the residual stress after the SP process and the Almen intensity, which is the SP process parameter, with the finite element approach. As a result, it made it possible for the designers to ascertain the ideal process parameter for the forged parts’ mechanical behavior. Hong et al. [19], however, transformed a previously experimental work into an analytical one. As a result, the impact velocity, impact angle, and ball diameter, which are SP process parameters, were determined analytically in relation to the residual stress profile. Bhuvaraghan et al. [20] tried to estimate the ideal peening process parameters by using the finite element method, taking into account the surface roughness of the material and compressive residual stress variables. As an alternative to the vibropolishing approach, Gopinath et al. [21] investigated fatigue life and aerodynamic efficiency utilizing the relatively new vibratory peening method. They set out to create a novel intelligent vibratory SP method; therefore, they carried out a number of experimental operations to validate and describe the part using conventional Almen strips. Their research also sought to forecast the specified pieces and use machine learning to forecast the data gathered from the experiments. When the study results were examined, the properties of the Almen strips were estimated with the Kernel Ridge model at 0.0171 standard deviation and 0.0443 RMSE values. These results were quite consistent with the experimental results. In their study, Maleki et al. [22] applied the SP process to (TiB + TiC)/Ti–6Al–4V composite material and then aimed to estimate the hardness and residual stress distributions depending on the depth of the material. For this purpose, the authors used the deep neural network (DNN) method in their studies. While the depth from the surface and Almen density were used as input values in the study, hardness and compressive residual stress values were used as outputs. At the end of the study, it was determined that there was a positive correlation between compressive residual stress and hardness and Almen intensity. Zhang et al. [23] looked into ways to modify SP parameters to produce particular residual stresses that would lessen blade deformation. The equivalent residual stress can be calculated using the cosine function that characterizes the depth distribution of this stress. The study also investigated the effects of SP process parameters such as nozzle speed, flow rate, distance, and air-pressure velocity on the equivalent residual stress. In their study, the authors determined the effect of equivalent residual stress on wing deformation by developing a finite element model by simulating the deformation occurring in the wing. Using the inversion of the exhaustive approach, they obtained deformed stress fields of less than 0.03 mm. In order to determine the optimal SP parameter and validate the accuracy of the optimization procedure, SP experiments were employed. In a prior work, Maleki et al. [24] applied SP, severe vibration peening (SVP) and laser shock peening (LSP) methods to V-notch AlSi1Mg samples produced by the laser powder-bed-fusion method. Then, they attempted to determine the relationship between the residual stress, surface roughness, the depth of the crack initiation zone, and the fatigue behavior of these samples using experimental data, numerical models, and deep learning approaches. They utilized a stacked autoencoder (SAE) to pre-train the dataset and a six-layer deep neural network (DNN) to create the machine learning (ML) model. By utilizing SAE, the authors were able to obtain an accuracy in the projected findings at the end of their investigation that was higher than 0.96. The authors concluded that all applied SP treatments resulted in the decreased surface roughness of the specimen, surface modification, surface-layer hardening, and significant compressive residual stress formation. All changes also resulted in significant improvements in fatigue life. In addition, when the neural network model developed for the study was evaluated, it was determined that the R2 value was 0.96 and this value was within an acceptable range. The authors stated that one of the most important results of the study was that the subsurface crack initiation depth caused a significant increase in fatigue life.
Analytical investigations took the role of experimental studies, which incur large time and financial costs. Therefore, the machine learning method’s prediction helps to support experimental studies. Looking at the earlier research, it can be seen that machine learning techniques were mostly used to estimate the parameters of the SP process using a single material and one method. Unlike previous studies, this one employed various machine learning algorithms to forecast various SP process parameters and forging techniques for various steel types. The residual stress, surface roughness, and surface hardness values of four distinct materials that were shot-peened under various process conditions were ascertained for this purpose. A comparative analysis was performed on the data obtained before and after the SP operation. In the current study, this was accomplished by using the following methods: deep neural network (DNN), AdaBoost Regressor (ABR), artificial neural network (ANN), Decision Tree Regressor (DTR), Gradient Boosting Regressor (GBR), Random Forest Regressor (RFR), Support Vector Regressor (SVR) and XGBoost Regression (XGBR). Therefore, the goal was not only to identify the most efficient technique but also to make a determination using multiple estimation techniques. Furthermore, these studies were used to estimate the best SP parameter using the DNN and XGBR approaches, respectively.
2. Experimental Approach
2.1. Experimental Data
Increasing the strength of steel materials, which are widely used in the production of various machine parts, including axles, crankshafts, gears, shafts, and engine parts, operating under wear and fatigue conditions, is crucial for the manufacturing industry. For this purpose, AISI 8620, AISI 5140, AISI 4140, and AISI 1020 steel materials were used in the study. A low-carbon steel AISI 1020 is used in machine parts, structural components, fasteners, shafts, and applications. AISI 5140 is chromium steel often used in gears, connecting rods, spindles, and other mechanical parts that require moderate strength. AISI 4140 is a chromium–molybdenum alloy steel used in axles, shafts, bolts, crankshafts, and high-performance automotive and industrial components. AISI 8620 is a low-alloy, nickel–chromium–molybdenum steel commonly used for gears, camshafts, crankshafts, and fasteners, where a tough core and a wear-resistant surface are required. We aimed to see how the properties of these steels, which have a widespread use, will change with mechanical surface treatment as well as heat treatment.
Table 1 provides their chemical makeup and Table 2 displays the mechanical properties of these materials [25].

Table 1.
Chemical composition of test sample materials.

Table 2.
Mechanical properties of materials used in experimental studies.
In the study, SP (SP) and vibrating SP processes (VSP) were applied to the samples. Figure 1 schematically illustrates how the samples were shot peened.
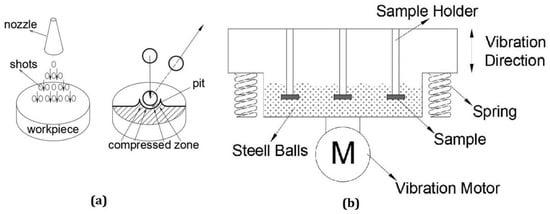
Figure 1.
A schematization of the SP processes used in the study: (a) SP process; (b) VSP process [24].
The samples were shot-peened by Sigma SP Company (Istanbul, Türkiye). The peening process was carried out in a device where the process time and air pressure could be controlled. In the SP process applied to the samples in the study, S230 standard steel balls with 90° impact angle, 6.35 mm nozzle diameter, and a 48–51 HRC hardness range were used [26]. A frequency of 50 Hz was selected for the VSP process [27]. One of the factors that significantly affects the SP process is the Almen intensity [28]. Therefore, the aim of this research is to determine the most appropriate Almen intensity. The process parameters selected for the study are shown in Table 3.

Table 3.
The study’s process parameters.
Hardness measurements were taken on a TTS Matsuzawa HWMMT-X3 micro hardness tester (Tokyo, Japan) using a Vickers indenter at a load of 2000 kgf and a duration of 10 s. Measurements of hardness were carried out along the depth profile. Additionally, the surface roughness values of the shot-peened samples were measured using the Hommel Tester T 500 apparatus. With the SP process, CRS is created on the surface of the part, thus increasing wear, corrosion, and fatigue life. Measures of residual stress were paired with measurements of surface roughness and hardness. The sin 2ψ method was used to the sample surface in order to evaluate any residual stress. Measurements were taken at the depth that was produced by gradually removing an extremely thin layer of material. The penetration depth is the key question in residual stress measurements. It is challenging to provide a conclusive response to the query, nevertheless. Prior research has shown that the density diminishes dramatically with increasing material depth. This is because the signal is becoming weaker. Stated differently, the contribution of a ray refracted from a material’s deeper layers or planes diminishes proportionately with the material’s journey distance. Equation (1) can be used to compute the active layer’s thickness [29]:
2.2. Machine Learning Methods
In this study, it was tried to predict the Almen intensity values of different steels by using residual stress, surface roughness, and surface hardness values. Artificial neural network (ANN), deep neural network (DNN), AdaBoost Regressor (ABR), Decision Tree Regressor (DTR), Support Vector Regressor (SVR), Random Forest Regressor (RFR), Gradient Boosting Regressor (GBR), and XGBoost Regression (XGBR) methods, popular machine learning methods, were used for this purpose.
The artificial neural networks (ANNs) known as deep neural networks (DNNs) include several layers between the input and output layers [30]. Before being sent to the next layer, each layer’s collection of neurons processes and transforms the incoming data. In order to learn hierarchical representations of the input data, DNNs are built with each layer learning increasingly complicated and abstract features [31]. DNNs have a wide range of applications, but training them requires a lot of labeled data and it is computationally expensive [32]. The training of significantly deeper and larger DNNs became possible through recent improvements in hardware and deep learning methods, resulting in state-of-the-art performance on a variety of applications [33,34]. The human nervous system served as inspiration for ANNs, which are machine learning algorithms. They consist of input, output, and hidden layers, with the weights being changed during training to improve accuracy [35]. The error between the projected and expected output is utilized to adjust weights by using forward propagation and back propagation [36].
Regression techniques are also utilized to solve prediction problems. The Decision Tree Regressor (DTR) is a machine learning technique for regression issues that generates a tree-like model of decisions and possible outcomes that may be used to forecast a continuous numerical output [37]. Additionally, a tool for regression problems called the Support Vector Regressor (SVR) finds a hyperplane in a high-dimensional space that optimizes the difference between expected and actual output values [38]. SVR is an effective machine learning technique for performing regression tasks, especially when dealing with high-dimensional data and detecting intricate nonlinear correlations [39]. Random Forest Regressor (RFR), another machine learning approach for regression, mixes different decision trees to produce a potent predictor of the target variable. It can capture nonlinear relationships, handle numerical and categorical data, and yield a measure of feature relevance [40]. It can, however, be computationally costly and delicate to noisy data [41].
Furthermore, boosting techniques also address the regression issues. A machine learning approach called Gradient Boosting Regressor (GBR) is used for regression tasks. Multiple weak learners (simple models) are combined to produce a powerful predictor of the target variable [42]. Different weak learners, such as decision trees, linear models, or neural networks, can be used with GBR. With only a small number of weak learners, it can attain excellent accuracy and is especially helpful for addressing nonlinear interactions [43]. However, it can be computationally expensive and sensitive to erratic data. An enhanced form of GBR is called XGBoost (Extreme Gradient Boosting) Regression [44], a technique for group learning that constructs several decision trees to correct errors made by the prior tree. Its capability to manage big datasets with high dimensionality and intricate interactions between characteristics and target variables makes it strong and well-liked. It has several hyperparameters that can be adjusted to enhance performance. Due to its adaptability and simplicity of usage, it has been widely used in many applications [45]. Another boosting approach for regression tasks is called AdaBoost Regressor (ABR), which uses multiple weak learners (simple models) combined to produce a powerful predictor of the target variable. It is especially skilled at handling noisy data [46] and can adapt to nonlinear interactions between the input and output variables. It can process both categorical and numerical data and is computationally efficient. It can, however, be sensitive to outliers and requires enough data to prevent overfitting [47].
Table 4 presents a general summary of each method’s advantages and disadvantages. Which approach is best relies on some variables, including the type of data, available computing power, interpretability standards, and intended prediction performance.

Table 4.
Comparison of ML algorithms by advantages and disadvantages.
2.3. Evaluation Metrics
Analyzing prediction techniques’ performance is crucial. The Root Mean Square Error (RMSE) is the standard deviation of prediction errors, as stated by Chai and Draxler [48]. It uses the regression line to calculate its distance from the data points and the extent to which they have been extended. Given that regression analysis and prediction applications commonly employ RMSE, a low value is expected [49]. How closely the regression line matches the actual data values is indicated by R-Squared (R2) [50]. R2 value is supposed to be close to 1 and is between 0 and 1. The average of the absolute discrepancies between goal values and predictions is known as the mean absolute error, or MAE, as stated by Chai and Draxler [48]. The MAE is expected to have a low value because of its linear value, which suggests that every variation has an equal influence on the mean.
Furthermore, the statistical method known as cross-validation (CV) [51] is employed in evaluating the effectiveness of machine learning algorithms. Because CV is easy to use and comprehend, machine learning frequently uses it to benchmark and select a model for a specific predictive modeling assignment. Furthermore, it often produces forecasts with smaller errors [52] when compared to other approaches. When forecasting using information not utilized in the model’s training, the effectiveness of a machine learning model on hypothetical data is used to forecast the model’s overall performance [51]. The ten- and five-fold CVs are frequently used.
3. Results and Discussion
3.1. Experimental Results
The surfaces of AISI 8620, AISI 5140, AISI 4140, and AISI 1020 materials were subjected to shot SP and VSP processes using a variety of process parameters in the current study. After the process, the surface roughness values of the samples were evaluated, and the outcomes are displayed in Table 5.

Table 5.
Surface roughness values of samples with SP processes at different process parameters.
Among the samples in the AISI 8620 sample group to which the SP process was applied, the highest roughness value was obtained at 12–14 A intensity. Compared to the traditional SP procedure, it was discovered that the vibratory SP methodology produced reduced surface roughness values in AISI 8620 samples. The group with the greatest surface roughness rating was the VSP procedure, which took 30 min to complete and used a 4 mm ball diameter. When the ball diameter is fixed, the surface roughness increases with decreases in processing time, but the roughness value increases when the ball diameter grows concurrently with the processing time. The increase in the ball diameter in the SP process causes the process to have a greater effect on the surface of the part. Similarly to those obtained from the AISI 4140 material, the roughness values obtained from the AISI 5140 material using the traditional SP process were maximum at the 18–20 A Almen intensity. As the Almen intensity was increased to 24–26 A, surface roughness increased as well. Because of the VSP method’s nature, surface roughness values decreased compared to traditional SP methods. When the surface roughness values of AISI 4140 samples were examined, the samples peened at 18–20 A in the traditional SP technique yielded the highest values, whereas the samples peened at 24–26 A intensity levels had lower values. Other balls with high Almen intensity struck the surface hills of the material between the pits, bringing down their height and leveling their surfaces. When a traditional SP process was applied to AISI 1020 steel, an increase in surface roughness values occurred as the Almen peening intensity increased. Conversely, in the VSP samples, the samples with small-diameter balls had lower degrees of roughness than the samples with high ball diameters. As was the case with the AISI 8620 material, the samples shot-peened using the vibratory approach had rougher values than those shot-peened using the traditional method. The effect of the SP process on hardness was determined by measuring the hardness from the surface to the center. The outcomes are displayed in Figure 2. When comparing the samples that underwent SP to those that did not, a noteworthy improvement in hardness values was observed. At 24–26 A Almen intensity, a value of 251 Vickers was recorded for the greatest hardness value of AISI 8620 material. Approximately 40% more hardness was measured following the SP procedure. This can be explained by an increase in plastic deformation leading to an increase in hardness and an increase in Almen intensity. At 24–26 A Almen intensity, AISI 1020 material’s maximum hardness value (240.7 Vickers) was recorded. Following the SP procedure, the hardness value rose by around 20%. The AISI 4140 material’s maximum hardness value, 347.3 Vickers value, was found at 24–26 A Almen intensity. The AISI 4140 material’s hardness value rose by about 40% following the SP procedure.
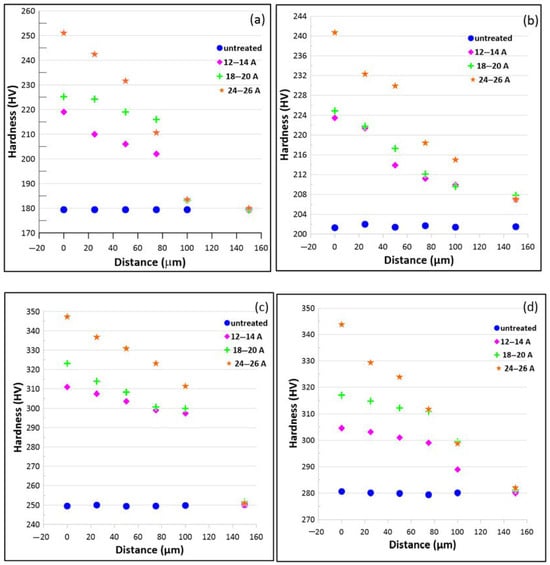
Figure 2.
The hardness values of the specimens shot-peened at various Almen intensities: (a) AISI 8620; (b) AISIS 1020; (c) AISI 4140; (d) AISI 5140.
Figure 3 displays the hardness values of the samples subjected to vibratory SP at varying times and ball diameters, along with the SP procedure. The highest hardness value of AISI 8620 material was found to have a 268 Vickers value in the sample with a ball diameter of 4 mm and a processing time of 60 min. It is clearly seen in Figure 3 that hardness increases with an increase in the processing time if the ball diameter remains constant. This is because longer processing times allow for the better development of nano-thin layers on the part’s surface. The AISI 1020 material’s maximum hardness value was discovered to be 276.10 Vickers. Similarly to AISI 8620 material, 4 mm ball diameter, and 60 min of processing time were found to yield the maximum hardness value in AISI 1020 material. The AISI 4140 material has a maximum hardness rating of 363 Vickers. Similarly to AISI 8620 material, samples treated with a ball diameter of 4 mm and a processing duration of 60 min yielded the highest hardness value in AISI 4140 material.
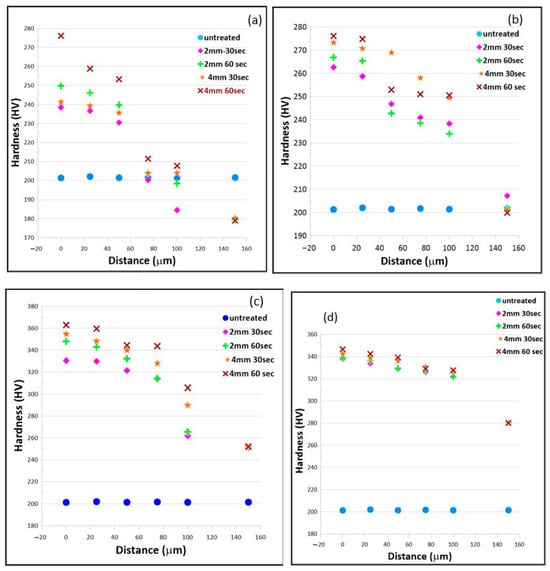
Figure 3.
Hardness values of the specimens treated with VSP using various process parameters: (a) AISI 8620; (b) AISIS 1020; (c) AISI 4140; (d) AISI 5140.
It is known that materials with nano-sized grains have better mechanical properties than materials with micron size. In order to obtain nano-sized grains, methods are applied by creating excessive plastic deformation without changing the chemical structure. The SP method is used in some fields for this purpose. The purpose of this study was to use SP to boost the material surface’s useful residual stress profile and stress value. In order to achieve this, various process parameters were used to assess the residual stress of the samples that underwent vibratory SP (ball diameter and processing time) and SP (Almen intensity). Table 6 lists the residual stress levels for each sample group. It is evident from the measurements that the shot-peened surfaces have developed compressive residual stress. When the residual stress results measured from samples peened at different Almen intensities were examined, it was determined that the highest value was obtained at 24–26 A intensities. Also, it was seen by analyzing the data that as Almen intensity grew, so did the compressive residual stress area. In the examinations, it was determined that compressive residual stress areas increased with the increase in ball diameter in the samples applied with the VSP method.

Table 6.
Residual stress values of all materials.
Figure 4 compares the residual stress values that were discovered on the material surfaces following the application of the SP procedure to the specimens. As seen in Figure 4, the residual stress values increased with increasing the Almen intensity from 11–14 A to 24–26 A. The samples to which the VSP method was applied were examined, and it was determined that the residual stress values increased as the processing time and ball diameter increased.
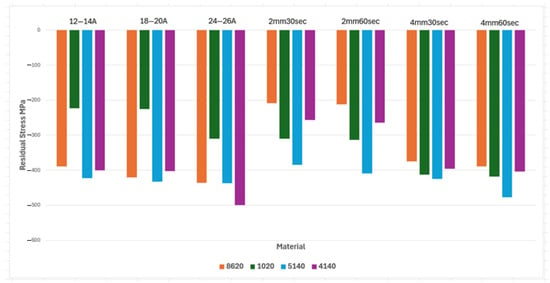
Figure 4.
Residual stress values of materials at different SP parameters.
Figure 5 shows optical microscope pictures of the SP samples. It is anticipated that the grain will be thinned as shot-peened materials’ surfaces are plastically deformed. The shot-peened samples showed evidence of both grain thinning and a plastically deformed layer following plastic deformation, as shown in Figure 6. The surface quality of the SP-treated samples was lower than the VSP-treated samples. This suggests that the vibratory SP method is better than the traditional SP method.
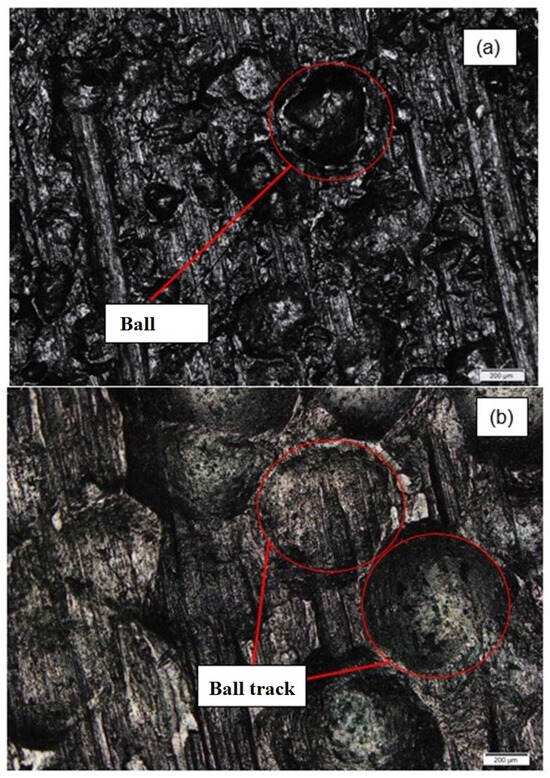
Figure 5.
Optical microscope images of the specimens used in the study: (a) SP process for AISI 4140 steel; (b) VSP process for AISI 1020 steel.
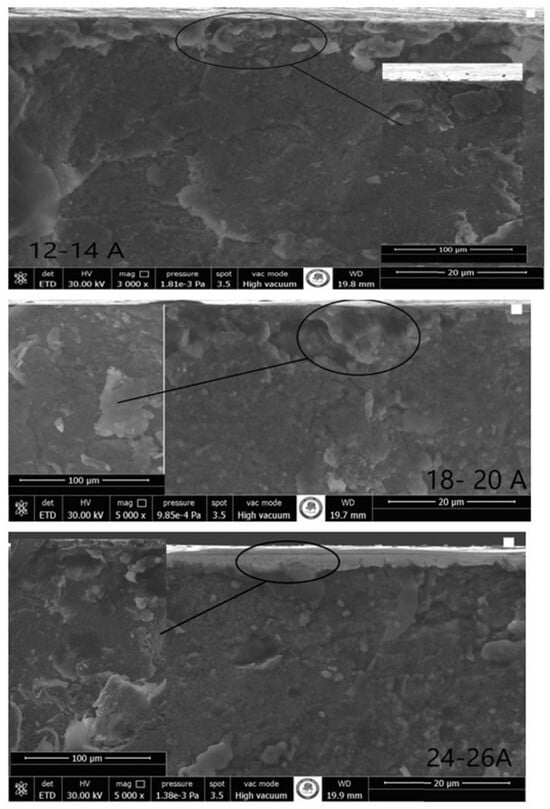
Figure 6.
SEM images of AISI 5140 samples shot-peened at different Almen intensities.
In order to determine the effect of SP and VSP processes in more detail, the samples were analyzed using SEM. Based on the findings, Figure 6 depicts the alterations in the grain structure following the SP procedure.
Figure 7 displays the macro and SEM results of vibratory shot-peened samples. Upon closer inspection, Figure 7 demonstrates that the vibratory shot-peened samples exhibit greater surface alterations than the shot-peened samples. The vibrating SP process causes more surface roughness and negatively affects the surface compared to the traditional SP approach.
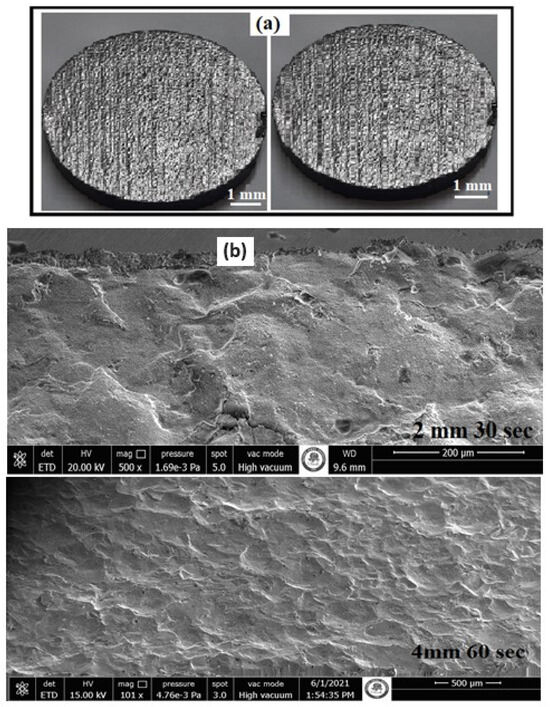
Figure 7.
Surface images of vibratory shot-peened AISI 5140 samples for (a) macro; (b) SEM.
3.2. Dataset
The surface hardness, surface roughness, and residual stress of steels in connection to the Almen intensity make up the experimental measurement results. Almen intensity (O1) was utilized as an output, while the sample values for residual stress (I1), surface roughness (I2), and surface hardness (I3) were used as inputs. For steels, 32 different sets of measurement data are available; 80 percent of these data were used for training, while the remaining 20 percent were used for testing. The test measurement data for the lowest, maximum, average, and standard deviation values of steels are shown in Table 7.

Table 7.
Experimental measurement values of different steel materials.
3.3. Implementation Details
The machine learning techniques that were suggested were implemented using Python 3. On a PC with an Intel Core i5-8265U 3.9 GHz CPU and 16 GB RAM, algorithms were executed (Figure 8). The DNN algorithm’s hidden layer makes use of 1024 units. The Adam [53] optimizer was used with 1000 epoch. Because of the objective of regression, the output layer lacks an activation function while the input layer has RELU. Moreover, the batch size is 100 and the learning rate is 0.001. Before utilizing it in any other machine learning techniques, the data were scaled using a typical min–max scaler. Also, parameters were optimized by using GridSearchCV 1.7.0 [54]. The ANN algorithm has a hidden layer with 1024 units. The epoch is 200, the activation function is linear, the batch size is 100, and the learning rate is 0.05. The ABR algorithm parameters: n_estimators is 50, learning_rate is 1, loss is linear, and random_state is 1. The DTR algorithm parameters: criterion is friedman_mse, splitter is best, max_depth size is none, and random_state is 0. The SVR algorithm parameters: kernel is linear, degree is 2, epsilon is 0.1, cache_size is 100, and max_iter is −1. The GBR algorithm parameters: loss is squared_error, learning_rate is 0.1, n_estimators is 50, criterion is friedman_mse, max_depth is 3, and random_state is none. The RFR algorithm parameters: n_estimators is 50, criterion is squared_error, max_depth is 3, and random_state is 1. The XGBR algorithm parameters: n_estimators is 1000, max_depth is 5, eta is 0.1, and colsample_bytree is 0.8.
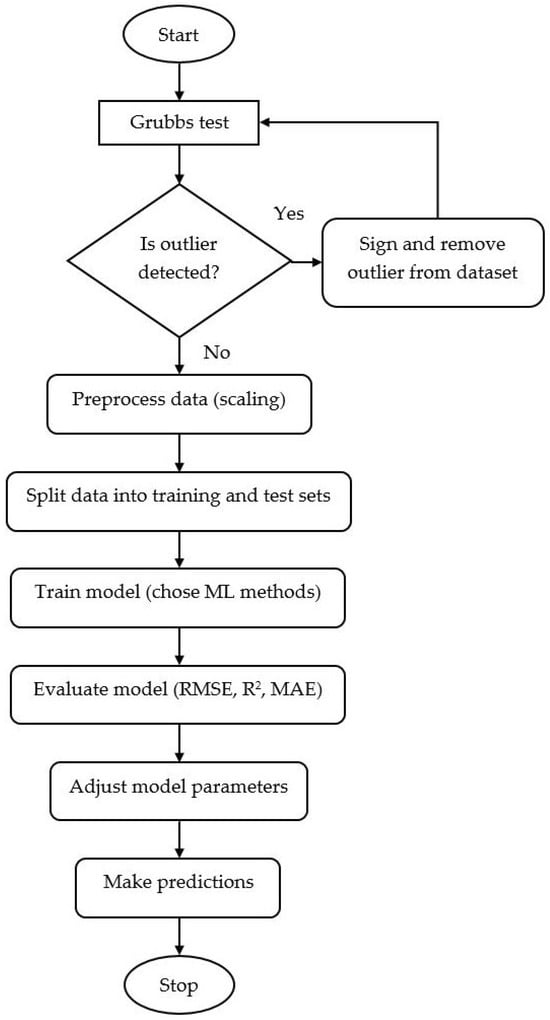
Figure 8.
A flow chart of the prediction process with ML algorithms.
3.4. Testing and Evaluation
It is important to accurately identify the features in the dataset in order to employ machine learning techniques. Due to the small sample size, Grubbs’ test was performed to determine the reliability of the measurements obtained in the study. This test is a statistical method used to detect outliers in a univariate dataset that follows a normal distribution, especially when the sample size is small [55]. In the Grubbs test, the G value is calculated as the absolute difference between the mean and the suspected outlier divided by the standard deviation, which is then compared to a critical value from the t-distribution to determine statistical significance, and if the G value exceeds the critical threshold value, the point is considered an outlier [55]. Accordingly, in this study, taking alpha = 0.05, the critical value for each input parameter was calculated as 2.938. The G value for surface hardness was 1.991, the G value for surface roughness was 2.251, the G value for residual stress was 2.182, and no outliner value was found for each parameter. For this reason, the data were used as data in machine learning algorithms. After the training and test datasets were created for this study, the dataset for each material underwent 5-fold cross-validation for all regression techniques. Consequently, the developed model can be applied to forecast the properties of various as-yet-uncreated steel material combinations, speeding up the hunt for workable materials with the optimal SP values. This study’s conclusion was that ML models can be used to create high-performance materials in light of this. Moreover, the size and quality of the input dataset have a significant impact on how well ML methods can estimate data. Additionally, the range and diversity of input characteristics can fully describe the underlying mechanisms. This study looked at the algorithms’ performance in terms of RMSE, R2, and MAE values for Almen Intensity calculated using ML models (Table 8). Any ML algorithm may yield the best results in some folds of validation, but it may yield the worst results in other folds. Since the mean of the 5-fold cross-validation should be taken into account, after analyzing mean values, the best results for the DNN algorithm were found to be RMSE of 0.0731, R2 of 0.9665, and MAE of 0.0613. The XGBR, GBR, ANN, ABR, RFR, DTR, and SVR algorithms, in that order, produced the best results.

Table 8.
Estimated performances of the ML algorithms for the shot-peeing intensity estimation of different steel materials.
The results show that, in order to achieve material with the highest Almen intensity, the ML algorithms did not yield results that were significantly different from those of the actual test data. This decreases potential experimental expenses and wasted experiment time when machine learning algorithms are used for prediction jobs.
4. Conclusions
Using well-known machine learning algorithms, this study aims to predict the level of Almen intensity of steels by making use of the data on surface roughness, surface hardness, and residual stress obtained from experiment results. The gathered dataset was examined for this purpose by using methods based on neural networks, regression models, and boosting models. The results obtained from the study are as follows:
- (1)
- When all samples used in the study were examined, the highest surface roughness values were obtained at 18–20 A intensity in the AISI 5410 (5.23 µm), AISI 4140 (4.7 µm), and AISI 1020 (5.2 µm) material groups to which the traditional SP process was applied. The sample with AISI 8620 had the highest surface roughness rating (6.27 µm) when the intensity was between 12 and 14 A. During the vibratory SP procedure, all samples showed the maximum surface roughness value when 4 mm balls were processed for 30 min. The roughness values obtained from the vibratory shot-peened samples were 2.7 µm for AISI 5410, 2.9 µm for AISI 4140, and 2.7 µm for AISI 1020.
- (2)
- When comparing the samples that underwent SP to those that did not, a noteworthy improvement in hardness values was observed. The samples shot-peened with a strength of 24–26 A using the traditional SP technique had the highest hardness values. The hardness values obtained from the shot-peened and vibratory shot-peened samples were 251 HV-268 HV for AISI 8120, 345.7 HV-342 HV for AISI 5410, 347.3 HV-363 HV for AISI 4140, and 240.7 HV-276.10 HV for AISI 1020, respectively. This can be explained by an increase in plastic deformation leading to an increase in hardness and Almen intensity. Examining the SP procedure, the hardest samples were those that had vibratory SP at varying times and ball sizes; those that underwent processing for 60 min yielded the hardest values.
- (3)
- When the residual stress values of the samples peened at different Almen intensities were examined, it was determined that the highest value was obtained at 24–26 A intensity. Residual stress values obtained from shot-peened samples were −436.5 MPa for AISI 8120; 310.6 MPa for AISI 5410, 499.3 MPa for AISI 4140; and 437.5 MPa for AISI 1020, respectively. Residual stress values obtained from shot-peened samples were −436.5 MPa for AISI 8120; 310.6 MPa for AISI 5410, 499.3 MPa for AISI 4140; and 437.5 MPa for AISI 1020, respectively. The residual stress values of the samples subjected to shot peening were measured as −388,9 MPa for AISI 8120; 418,3 MPa for AISI 5410, 404,2 MPa for AISI 4140; and 477.5 MPa for AISI 1020. It was found that as the ball diameter rises in vibratory shot-peened materials, the compressive residual stress area grows. This suggests that one of the study’s goals has been accomplished. When the results were examined, higher residual stress values were obtained in the shot-peened samples.
- (4)
- All of the machine learning methods produced materials as the most accurate prediction outcomes.
- (5)
- It was found that machine learning approaches can accurately predict the Almen intensity of steels when prediction results are compared. Therefore, it was determined that being able to predict the Almen intensity of materials without experimenting every time is advantageous in terms of time and cost.
- (6)
- Using ML models to determine the Almen intensity, the performance of the algorithms was analyzed in terms of RMSE, R2, and MAE values. After examining mean values, the DNN algorithm produced the best results, with an RMSE of 0.0731, R2 of 0.9665, and MAE of 0.0613. The best outcomes were obtained by the XGBR, GBR, ANN, ABR, RFR, DTR, and SVR algorithms, in that order.
Author Contributions
M.İ.: Conceptualization; Data curation; Software; Formal analysis; Investigation; Methodology; Writing—original draft. H.V.Ö.: Conceptualization; Data curation; Formal analysis; Investigation; Methodology; Validation; Project administration; Supervision; Writing—original draft. All authors have read and agreed to the published version of the manuscript.
Funding
This research received no external funding.
Institutional Review Board Statement
Not applicable.
Informed Consent Statement
Not applicable.
Data Availability Statement
The data presented in this study are available on request from the corresponding author. The data are not publicly available due to privacy restrictions.
Conflicts of Interest
The authors declare no conflicts of interest.
References
- Kovacı, H.; Hacısalihoğlu, İ.; Yetim, A.F.; Çelik, A. Effects of Shot Peening Pre-Treatment and Plasma Nitriding Parameters on the Structural, Mechanical and Tribological Properties of AISI 4140 Low-Alloy Steel. Surf. Coat. Technol. 2019, 358, 256–265. [Google Scholar] [CrossRef]
- Hua, L.; Du, Y.; Qian, D.; Sun, M.; Wang, F. Influence of Prior Cold Rolling on Bainite Transformation of High Carbon Bearing Steel. Metall. Mater. Trans. A 2025, 56, 640–654. [Google Scholar] [CrossRef]
- Yan, X.; Hu, J.; Zhang, X.; Xu, W. Obtaining Superior Low-Temperature Wear Resistance in Q&P-Processed Medium Mn Steel with a Low Initial Hardness. Tribol. Int. 2022, 175, 107803. [Google Scholar] [CrossRef]
- Liu, W.C.; Dong, J.; Zhang, P.; Korsunsky, A.M.; Song, X.; Ding, W.J. Improvement of fatigue properties by SP for Mg–10Gd–3Y alloys under different conditions. Mater. Sci. Eng. A 2011, 528, 5935–5944. [Google Scholar] [CrossRef]
- Bhuvaraghan, B.; Srinivasan, S.M.; Maffeo, B. Optimization of the fatigue strength of materials due to SP: A survey. Int. J. Struct. Chang. Solids 2010, 2, 33–63. [Google Scholar]
- Bagherifard, S.; Fernandez-Pariente, I.; Ghelichi, R.; Guagliano, M. Effect of severe SP on microstructure and fatigue strength of cast iron. Int. J. Fatigue 2014, 35, 64–70. [Google Scholar] [CrossRef]
- Maleki, E.; Farrahi, G.H.; Kashyzadeh, K.R.; Unal, O.; Guagliano, M.; Bagherifard, S. Effects of conventional and Severe SP on Residual Stress and fatigue Strength of Steel AISI 1060 and Residual Stress Relaxation Due to Fatigue Loading: Experimental and Numerical Simulation. Met. Mater. Int. 2020, 27, 2575–2591. [Google Scholar] [CrossRef]
- Maleki, E.; Unal, O. Optimization of SP effective parameters on surface hardness improvement. Met. Mater. Int. 2020, 27, 3173–3185. [Google Scholar] [CrossRef]
- Unal, O.; Maleki, E. SP optimization with complex decision-making tool: Multi criteria decision-making. Measurement 2018, 125, 133–141. [Google Scholar] [CrossRef]
- Maleki, E.; Unal, O. Fatigue limit prediction and analysis of nanostructured AISI 304 steel by severe SP via ANN. Eng. Comput. 2020, 37, 2663–2678. [Google Scholar] [CrossRef]
- Maleki, E.; Unal, O.; Kashyzadeh, K.R. Influences of SP parameters on mechanical properties and fatigue behaviour of 316 L Steel: Experimental, Taguchi Method and Response Surface Methodology. Met. Mater. Int. 2021, 27, 4418–4440. [Google Scholar] [CrossRef]
- Miao, H.Y.; Larose, S.; Perron, C.; Lévesque, M. An analytical approach to relate SP parameters to Almen intensity. Surf. Coat. Technol. 2010, 205, 2055–2066. [Google Scholar] [CrossRef]
- Sherafatnia, K.; Farrahi, G.H.; Mahmoudi, A.H. Effect of initial surface treatment on SP residual stress field: Analytical approach with experimental verification. Int. J. Mech. Sci. 2018, 137, 171–181. [Google Scholar] [CrossRef]
- Gallitelli, D.; Badreddine, J.; Rouhaud, E.; Micoulaut, M.; Labergere, C.; Francois, M. From process parameters to residual stress field: Complete ultrasonic SP simulation. In Proceedings of the 9th International Conference on Residual Stresses ICRS-9, Garmisch-Partenkirchen, Germany, 7–9 October 2012. [Google Scholar]
- Gallitelli, D.; Boyer, V.; Gelineau, M.; Colaitis, Y.; Rouhaud, E.; Retraint, D.; Kubler, R.; Desvignes, M.; Barrallier, L. Simulation of SP: From process parameters to residual stress fields in a structure. C. R. Méc. 2016, 344, 355–374. [Google Scholar] [CrossRef]
- Zarka, J. Non-Destructive Testing Method for Determining a Body’s Mechanical Properties and Stresses. U.S. Patent 3,969,928, 20 July 1976. [Google Scholar]
- Inglebert, G. Analyse Simplifiée des Structures Élasto-Visco-Plastiques sous Chargements Cycliques. Ph.D. Thesis, Arts and Crafts ParisTech, Paris, France, 1984. [Google Scholar]
- Guagliano, M. Relating Almen intensity to residual stresses induced by SP: A numerical approach. J. Mater. Process. Technol. 2001, 110, 277–286. [Google Scholar] [CrossRef]
- Hong, T.; Ooi, J.Y.; Shaw, B.A. A numerical study of the residual stress pattern from single shot impacting on a metallic component. Adv. Eng. Softw. 2008, 39, 743–756. [Google Scholar] [CrossRef]
- Bhuvaraghan, B.; Srinivasan, S.M.; Maffeo, B.; Prakash, O. Constrained probabilistic multi-objective optimization of SP process. Eng. Optim. 2011, 43, 657–673. [Google Scholar] [CrossRef]
- Gopinath, A.; Teoh, J.W.; Tagade, P.; Kee Khoon, G.L.; Haubold, T.; Kumar, A.S. Smart vibratory peening: An approach towards digitalisation and integration of vibratory special process into smart factories. Eng. Appl. Artif. Intell. 2023, 126, 107118. [Google Scholar] [CrossRef]
- Maleki, E.; Unal, O.; Sahebari, S.M.; Kashyzadeh, K.R. A Novel Approach for Analyzing the Effects of Almen Intensity on the Residual Stress and Hardness of Shot-Peened (TiB + TiC)/Ti–6Al–4V Composite: Deep Learning. Materials 2023, 16, 4693. [Google Scholar] [CrossRef] [PubMed]
- Zhang, J.; Yao, C.; Zhuo, W.; Tan, L.; Cui, M.; Wei, Q. Optimization of shot peening parameters for blades based on the constraint of equivalent residual stress-induced deformation. Int. J. Adv. Manuf. Technol. 2024, 131, 3781–3792. [Google Scholar] [CrossRef]
- Maleki, E.; Bagherifard, S.; Guagliano, M. Correlation of residual stress, hardness and surface roughness with crack initiation and fatigue strength of surface treated additive manufactured AlSi10Mg: Experimental and machine learning approaches. J. Mater. Res. Technol. 2023, 24, 3265–3283. [Google Scholar] [CrossRef]
- Material Properties. 2024. Available online: https://web.archive.org/save/https://www.efunda.com/home.cfm (accessed on 15 June 2024).
- Varol Özkavak, H. Wear Resistance, Hardness, and Residual Stress of Shot-Peened and Heat-Treated 8620 Nickel-Chromium-Molybdenum Steel. J. Mater. Eng. Perform. 2024, 34, 916–933. [Google Scholar] [CrossRef]
- Daş, T. Titreşim Destekli Yüzey Aşırı Plastik Deformasyon Cihazı Tasarımı ve İmalatı. Master’s Thesis, Karabük University, Karabuk, Turkey, 2019. [Google Scholar]
- Maleki, E.; Unal, O.; Kashyzadeh, K.R. Fatigue behaviour prediction and analysis of shot peened mild carbon steels. Int. J. Fatigue 2018, 116, 48–67. [Google Scholar] [CrossRef]
- Fitzpatrick, M.E.; Fry, A.T.; Holdway, P.; Kandil, F.A.; Shackleton, J.; Suominen, L. Determination of Residual Stresses by X-Ray Diffraction—Issue 2; Measurement Good Practice Guide No. 52. 2005. Available online: http://eprintspublications.npl.co.uk/id/eprint/2391 (accessed on 9 September 2024).
- Montavon, G.; Samek, W.; Müller, K.R. Methods for interpreting and understanding deep neural networks. Digit. Signal Process. 2018, 73, 1–15. [Google Scholar] [CrossRef]
- Sze, V.; Chen, Y.H.; Yang, T.J.; Emer, J.S. Efficient processing of deep neural networks: A tutorial and survey. Proc. IEEE 2017, 105, 2295–2329. [Google Scholar] [CrossRef]
- Kumar, S.; Arif, T.; Alotaibi, A.S.; Malik, M.B.; Manhas, J. Advances towards automatic detection and classification of parasites microscopic images using deep convolutional neural network: Methods, models and research directions. Arch. Comput. Methods Eng. 2022, 30, 2013–2039. [Google Scholar] [CrossRef] [PubMed]
- Miikkulainen, R.; Liang, J.; Meyerson, E.; Rawal, A.; Fink, D.; Francon, O.; Raju, B.; Shahrzad, H.; Navruzyan, A.; Duffy, N.; et al. Evolving deep neural networks. In Artificial Intelligence in the Age of Neural Networks and Brain Computing; Kozma, R., Choe, Y., Alippi, C., Morabito, F.C., Eds.; Academic Press: Cambridge, MA, USA, 2019; pp. 293–312. [Google Scholar] [CrossRef]
- Ren, D.; Wang, C.; Wei, X.; Zhang, Y.; Han, S.; Xu, W. Harmonizing Physical and Deep Learning Modeling: A Computationally Efficient and Interpretable Approach for Property Prediction. Scr. Mater. 2025, 255, 116350. [Google Scholar] [CrossRef]
- Jain, A.K.; Mao, J.; Mohiuddin, K.M. Artificial neural networks: A tutorial. Computer 1996, 29, 31–44. [Google Scholar] [CrossRef]
- Wythoff, B.J. Backpropagation neural networks: A tutorial. Chemom. Intell. Lab. Syst. 1993, 18, 115–155. [Google Scholar] [CrossRef]
- Gupta, A.; Bansal, A.; Roy, K. Solar energy prediction using decision tree regressor. In Proceedings of the 5th IEEE International Conference on Intelligent Computing and Control Systems (ICICCS), Madurai, India, 6–8 May 2021. [Google Scholar]
- Drucker, H.; Burges, C.J.; Kaufman, L.; Smola, A.; Vapnik, V. Support vector regression machines. In Advances in Neural Information Processing Systems; Mozer, M.C., Jordan, M.I., Petsche, T., Eds.; MIT Press: Cambridge, MA, USA, 1996. [Google Scholar]
- Awad, M.; Khanna, R. Support vector regression. In Efficient Learning Machines; Awad, M., Khanna, R., Eds.; Apress: Berkeley, CA, USA, 2015; pp. 67–80. [Google Scholar] [CrossRef]
- Grömping, U. Variable importance assessment in regression: Linear regression versus random forest. Am. Stat. 2012, 63, 308–319. [Google Scholar] [CrossRef]
- Ishwaran, H.; Lu, M. Standard errors and confidence intervals for variable importance in random forest regression, classification, and survival. Stat. Med. 2018, 38, 558–582. [Google Scholar] [CrossRef] [PubMed]
- Prettenhofer, P.; Louppe, G. Gradient Boosted Regression Trees in Scikit-Learn; PyData: London, UK, 2014. [Google Scholar]
- Zemel, R.; Pitassi, T. A gradient-based boosting algorithm for regression problems. In Advances in Neural Information Processing Systems; Leen, T.K., Dietterich, T.G., Tresp, V., Eds.; MIT Press: Cambridge, MA, USA, 2001. [Google Scholar]
- Chen, T.; He, T.; Benesty, M.; Khotilovich, V.; Tang, Y.; Cho, H.; Zhou, T. XGBoost: Extreme Gradient Boosting, R Package Version; XGBoost: Seattle, WA, USA, 2015. [Google Scholar]
- Chang, Y.C.; Chang, K.H.; Wu, G.J. Application of eXtreme gradient boosting trees in the construction of credit risk assessment models for financial institutions. Appl. Soft Comput. 2018, 73, 914–920. [Google Scholar] [CrossRef]
- Xiao, F.; Wang, Y.; He, L.; Wang, H.; Li, W.; Liu, Z. Motion estimation from surface electromyogram using adaboost regression and average feature values. IEEE Access 2019, 7, 13121–13134. [Google Scholar] [CrossRef]
- Solomatine, D.P.; Shrestha, D.L. AdaBoost.RT: A boosting algorithm for regression problems. In Proceedings of the IEEE International Joint Conference on Neural Networks, Budapest, Hungary, 25–29 July 2004. [Google Scholar]
- Chai, T.; Draxler, R.R. Root mean square error (RMSE) or mean absolute error (MAE)? Arguments against avoiding RMSE in the literature. Geosci. Model Dev. 2014, 7, 1247–1250. [Google Scholar] [CrossRef]
- Willmott, C.J.; Matsuura, K. Advantages of the mean absolute error (MAE) over the root mean square error (RMSE) in assessing average model performance. Clim. Res. 2005, 30, 79–82. [Google Scholar] [CrossRef]
- Cameron, A.C.; Windmeijer, F.A. An R-squared measure of goodness of fit for some common nonlinear regression models. J. Econom. 1997, 77, 329–342. [Google Scholar] [CrossRef]
- Refaeilzadeh, P.; Tang, L.; Liu, H. Cross-Validation. In Encyclopedia of Database Systems; Liu, L., Özsu, M.T., Eds.; Springer: Boston, MA, USA, 2009; pp. 532–538. [Google Scholar] [CrossRef]
- Xiong, Z.; Cui, Y.; Liu, Z.; Zhao, Y.; Hu, M.; Hu, J. Evaluating explorative prediction power of machine learning algorithms for materials discovery using k-fold forward cross-validation. Comput. Mater. Sci. 2020, 171, 109203. [Google Scholar] [CrossRef]
- Khaire, U.M.; Dhanalakshmi, R. High-dimensional microarray dataset classification using an improved adam optimizer (iAdam). J. Ambient Intell. Humaniz. Comput. 2020, 11, 5187–5204. [Google Scholar] [CrossRef]
- GridSearchCV. Sklearn Model Selection. 2023. Available online: https://web.archive.org/web/20240000000000 (accessed on 5 July 2024).
- Grubbs, F.E. Sample Criteria for Testing Outlying Observations. Ann. Math. Stat. 1950, 21, 27–58. [Google Scholar] [CrossRef]
Disclaimer/Publisher’s Note: The statements, opinions and data contained in all publications are solely those of the individual author(s) and contributor(s) and not of MDPI and/or the editor(s). MDPI and/or the editor(s) disclaim responsibility for any injury to people or property resulting from any ideas, methods, instructions or products referred to in the content. |
© 2025 by the authors. Licensee MDPI, Basel, Switzerland. This article is an open access article distributed under the terms and conditions of the Creative Commons Attribution (CC BY) license (https://creativecommons.org/licenses/by/4.0/).