Study Protocol

Analysis and Verification Results of Manual Inspection of Pavement Condition Index

Department of Civil Engineering, National Central University, Taoyuan City 320317, Taiwan
*
Author to whom correspondence should be addressed.
Appl. Sci. 2025, 15(10), 5600; https://doi.org/10.3390/app15105600
Submission received: 20 February 2025 / Revised: 17 April 2025 / Accepted: 14 May 2025 / Published: 16 May 2025

Abstract

The aim of this study is to establish an analysis of certification indicators for the Pavement Condition Index (PCI) to address previously unaccredited issues. In the management of road infrastructure, the PCI serves as a crucial indicator for assessing road pavement conditions. However, the lack of standardized detection and accreditation mechanisms in the past may have led to variations in the reliability of detection results among different personnel. This study observes the accuracy and precision of the data obtained by different inspectors. The analysis is based on repeated manual inspections conducted by four inspectors across 12 road units on Zhongda Road, using the ASTM D6433-23 (2023) standard. To ensure the reliability of the inspection results, the Coefficient of Variation (CV) is used to measure repeatability, while the Mean Relative Error (MRE) is used to evaluate accuracy. Training was introduced between inspection phases to assess performance improvement. The results showed that the average CV decreased from 27.2% to 7.5% and the average MRE reduced from 45.3% to 5.9% after training. These findings demonstrate that targeted training significantly enhances the repeatability and accuracy of manual PCI assessments. This study concludes with recommendations to set a CV threshold of ≤0.1 and an MRE threshold of ≤10% as practical benchmarks for manual PCI Quality Control. These standards can serve as validation criteria for future automated inspection systems.

1. Introduction

The Pavement Condition Index (PCI) is a critical metric for evaluating the condition of road surfaces and guiding maintenance strategies. In modern transportation infrastructure, accurate PCI evaluation is essential to ensure road safety and optimize resource allocation. However, the lack of a unified standard and certification mechanism in the past has raised concerns about the consistency and reliability of PCI inspection results. To address these issues, this study aims to improve the accuracy and reproducibility of manual PCI inspections by developing a robust validation framework. ASTM D6433-23 [1], a globally recognized standard for assessing flexible and rigid pavements, serves as the foundation for this research. By focusing on flexible pavements commonly found in Taiwan, this study establishes a comprehensive methodology for PCI evaluation, covering 20 distinct types of pavement distresses and their corresponding severity levels.
Recent research has emphasized the need for consistent validation mechanisms in manual PCI inspections to serve as a benchmark for automated systems (Zhang et al., 2022; Lee et al., 2021) [2,3]. Studies such as those conducted by Wang et al. and Lo et al. (2023) [4,5] have also explored AI-based inspection frameworks, but many lack rigorous ground-truth verification from human inspection, which remains essential in practice, especially for smaller municipalities.
This study aims to fill that gap by providing a practical validation mechanism that is applicable to current manual inspections and potentially usable as a reference for future automated evaluation. The proposed validation mechanism includes statistical methods such as the coefficient of variation to assess the precision of inspection data. Furthermore, this study emphasizes the importance of inspector training in minimizing subjective errors and improving the identification of pavement distresses. By addressing these challenges, this research not only enhances the standardization of PCI inspections but also provides valuable insights for road maintenance and management practices [6].

2. Materials and Methods
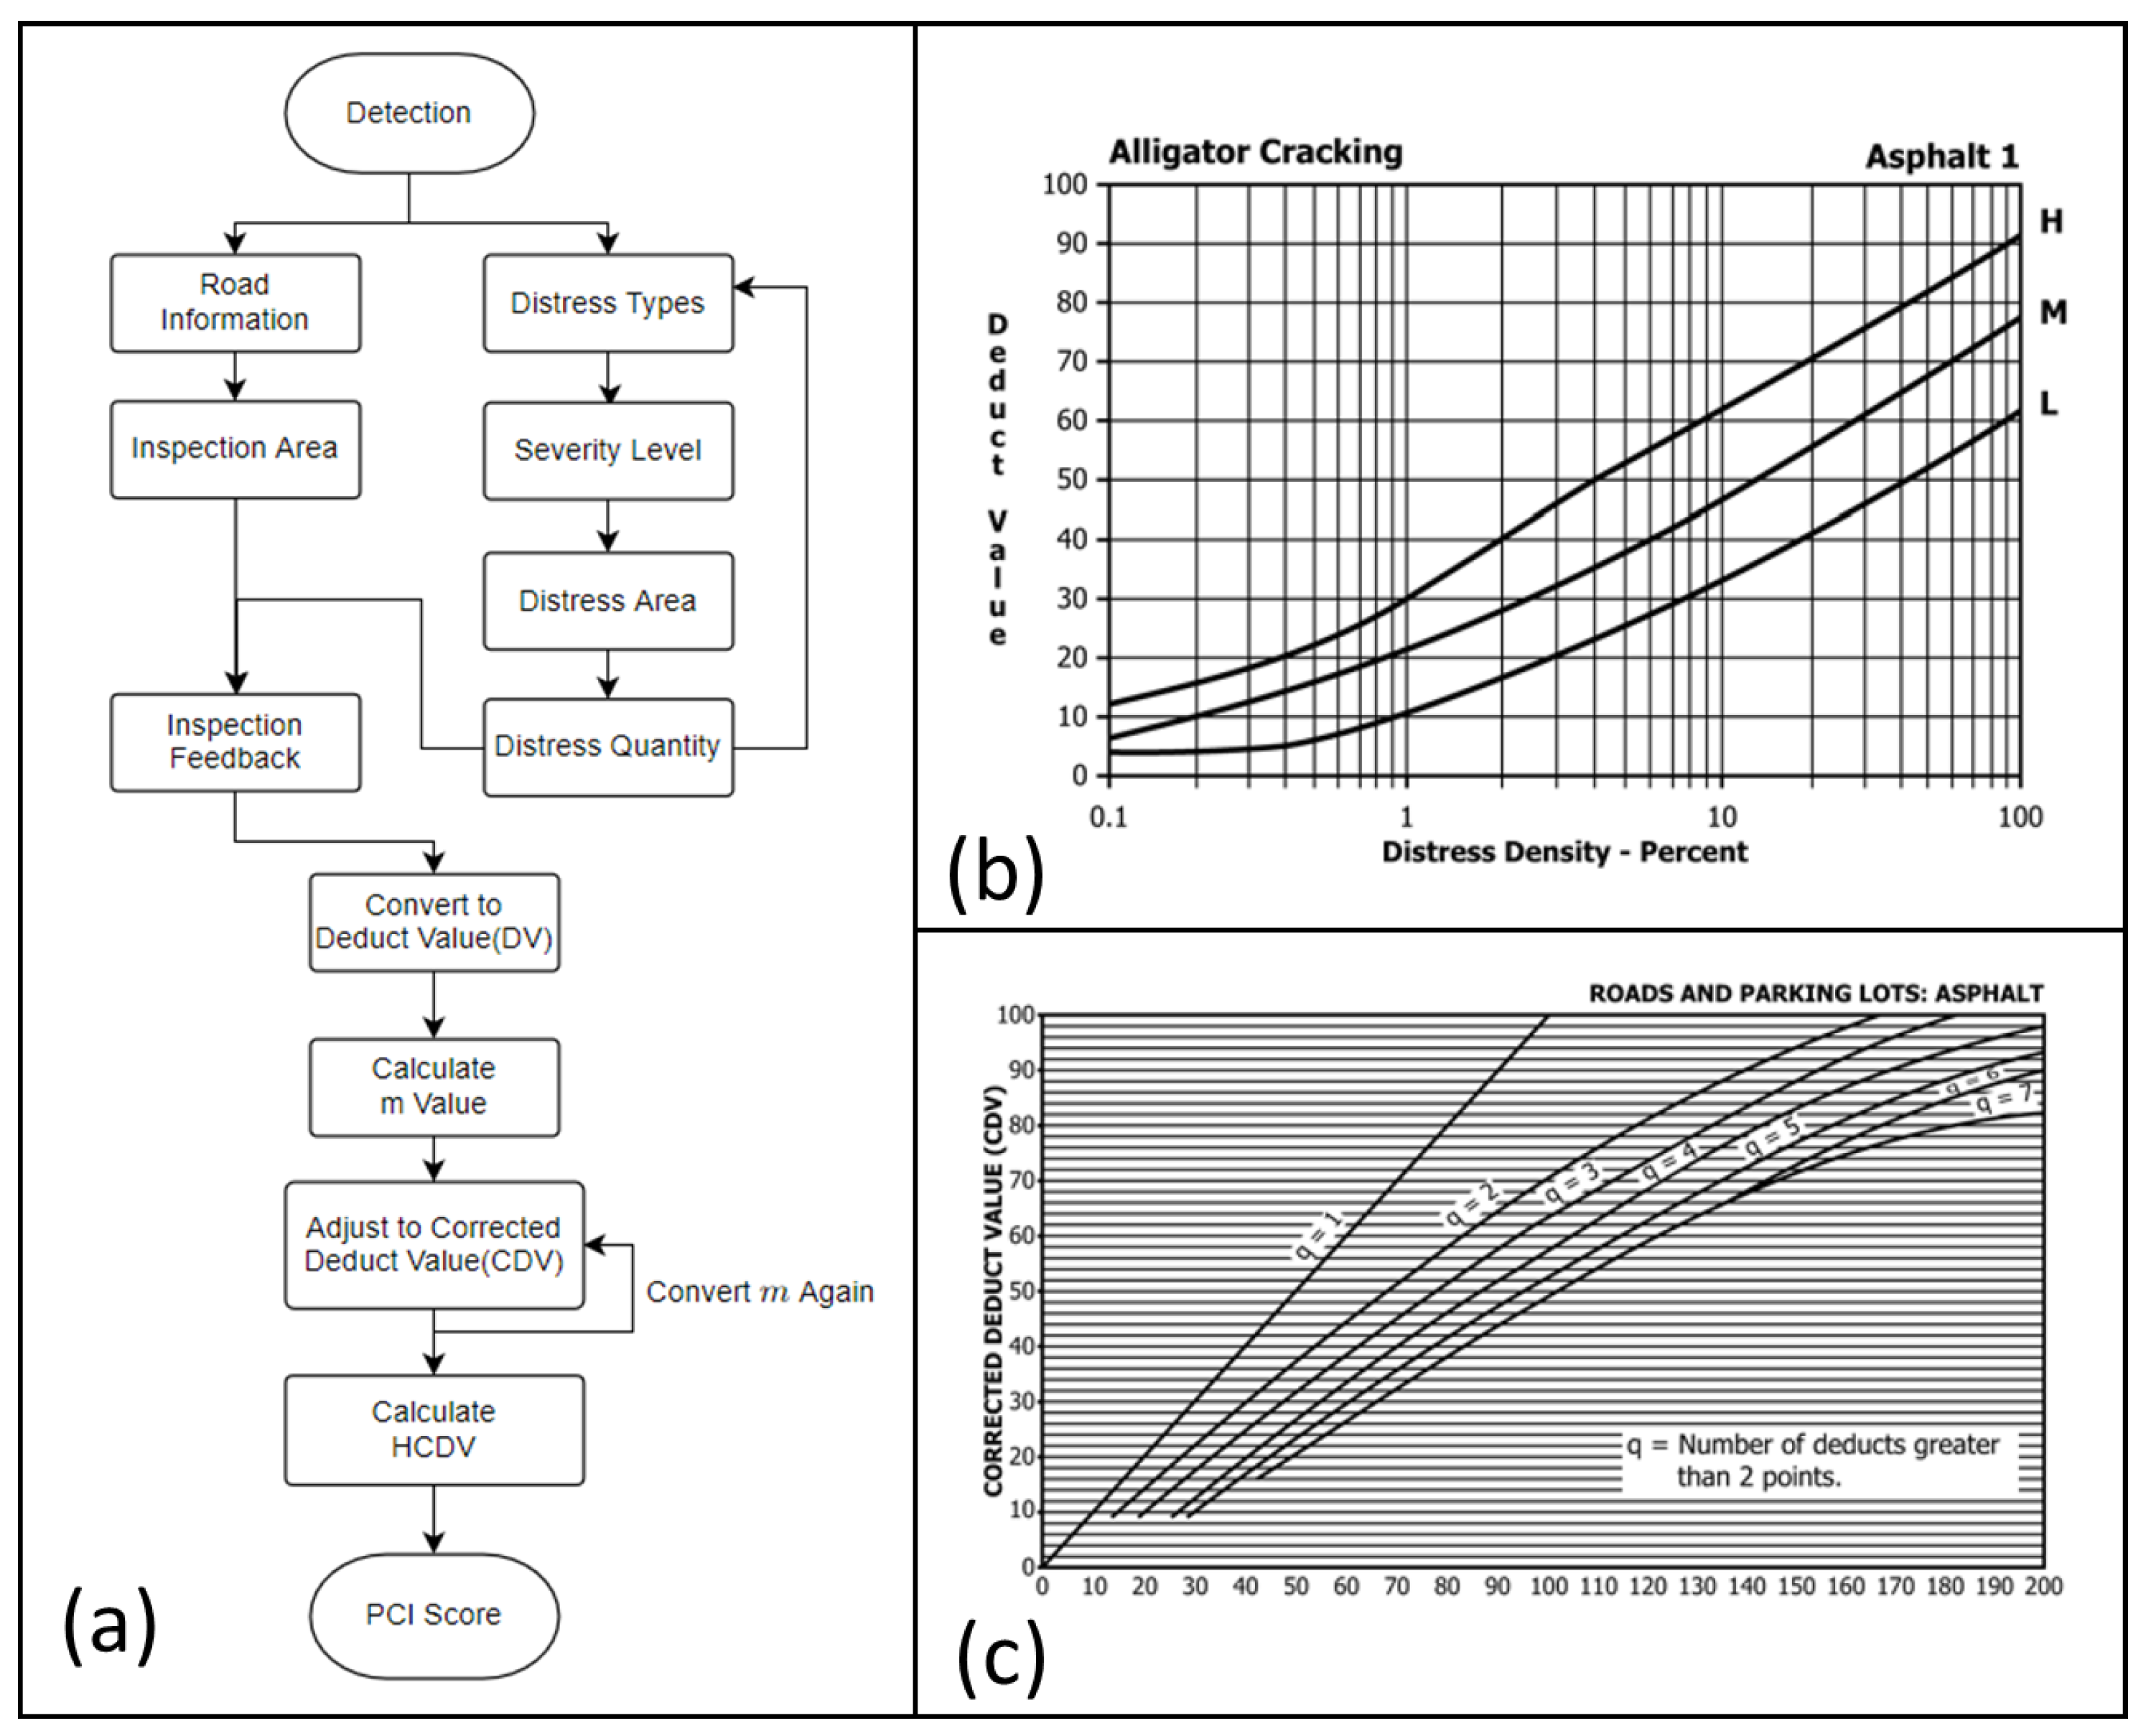
2.1. ASTM D6433-23

ASTM D6433-23 [1] is an international standard published by the American Society for Testing and Materials (ASTM). It provides a systematic approach for evaluating the condition and deterioration of flexible and rigid pavements. This standard details methods for quantifying and documenting various types of pavement distresses, such as cracks, potholes, and deformations, and classifies each type of distress into three levels of severity: low (L), medium (M), and high (H). ASTM D6433-23 defines 20 distinct distress indicators for flexible pavements (asphalt concrete pavement) and another 20 for rigid pavements (Portland cement concrete pavement). Each indicator is accompanied by specific descriptions and scoring criteria, enabling inspectors to accurately assess pavement conditions.
This study focuses on flexible pavements commonly observed in Taiwan, particularly urban roads with low traffic volume and stable surface conditions. To minimize the potential influence of pavement deterioration over time, the selected road segments were visually confirmed prior to each inspection round to ensure consistent surface conditions. The process for calculating the Pavement Condition Index (PCI) is illustrated in Figure 1a. The computation of deduct values (DVs) involves determining the distress type, severity level, and distress density. For instance, if the distress type is alligator cracking with low severity and a distress density of 10%, Figure 1b shows that the corresponding DV is approximately 33. After obtaining the DV values for all distresses, they are summed and adjusted using the corrected deduct value table. The corrected deduct values (CDVs) are compared, and the maximum value, referred to as the high corrected deduct value (HCDV), is subtracted from the perfect score of 100. This results in the PCI score for the flexible pavement, as depicted in Figure 1c.

2.2. Research Workflow

This study adopts manual Pavement Condition Index (PCI) inspection data as the basis for verifying the consistency and accuracy of results obtained by different inspectors. A standardized inspection process was developed to ensure the reproducibility and reliability of the PCI data. The research workflow consists of the following steps:
  • Defining the research focus and reviewing relevant background information and standards, such as ASTM D6433-23.
  • Selecting road and inspectors for evaluation: determining the roads to be inspected and assigning inspectors to carry out the manual assessments.
  • Grouping and training inspectors: dividing the inspectors into groups and conducting comparative evaluations of their performance before and after training.
  • Analyzing and comparing inspection data: evaluating the consistency (repeatability) and accuracy of the inspection results using statistical analysis.
  • Establishing validation standards: differentiating the validation into personnel verification, equipment verification, and software verification. Recommendations for standard validation protocols were made based on the results of the data analysis.
This study also focuses on the effect of inspector training on the performance of manual PCI evaluations. The inspectors, labeled as A, B, C, and D, were assessed both before and after the training. By comparing the data from these two stages, this study evaluated their repeatability and analyzed the accuracy of the PCI inspection process. This approach aims to provide insights into the impact of training on inspection reliability and offers a basis for developing effective validation standards.

2.3. Study Area and Road Units

This study was conducted on Zhongda Road, located in Zhongli District, Taoyuan City. Zhongda Road spans from Henan Road to Zhongzheng Road, with a total length of 570 m. The road consists of two directional lanes, each measuring 3.6 m in width, resulting in a total pavement area of 4104 square meters (Figure 2a).
To facilitate the analysis of the Pavement Condition Index (PCI), the road was divided into roadway units of 100 m each. For segments shorter than 100 m but greater than 50 m, they were categorized as independent roadway units. Considering both the forward and reverse directions, a total of 12 roadway units were defined for this study. The inspection start and end points are illustrated in Figure 2b and Figure 2c, respectively.

2.4. Introduction to Manual Inspection Method

The primary objective of this study is to gain an in-depth understanding of the manual inspection process, inspection equipment, procedures, and reliability in order to establish a solid foundation for subsequent certification methods and assessments of pavement damage. The inspection process is conducted by inspectors both before and after training, who evaluate pavement damage types in accordance with the 20 categories of distress outlined in ASTM D6433-23, including cracks, potholes, patches, etc. The inspectors use distance measuring wheels to measure the length and area of the damages and record the results on a smartphone-based website system, capturing information such as the type of distress, location, length, and area. Finally, the Pavement Condition Index (PCI) is calculated to comprehensively assess the overall condition of the pavement. The validity of the PCI score is further verified against relevant standards [7,8].

2.4.1. Inspection Procedure

When conducting pavement damage surveys, the use of appropriate equipment and systems is crucial for obtaining accurate and reliable data. Below is the main manual inspection equipment used in this study, along with their corresponding functions:
  • Manual inspection equipment: The selection and use of appropriate equipment and systems are essential for accurate and reliable data collection. Improper or outdated equipment can lead to inaccurate data, which may affect the overall assessment and subsequent inspections. The primary equipment used in this study includes the following:
    • Distance measuring wheel: This device is used to precisely measure the length and width of pavement areas. It is particularly useful for assessing the size of cracks, potholes, and other damages.
    • Leveling staff and tape measure: The leveling staff is used to determine the flatness of the pavement, while the tape measure is used to measure crack depth and other specific dimensions.
    • Reflective vest and other safety equipment: These ensure the safety of the inspection personnel during fieldwork.
    • Smartphone: A smartphone is used to record the identified pavement damage types and document them, uploading the related inspection photos to the cloud for further processing.
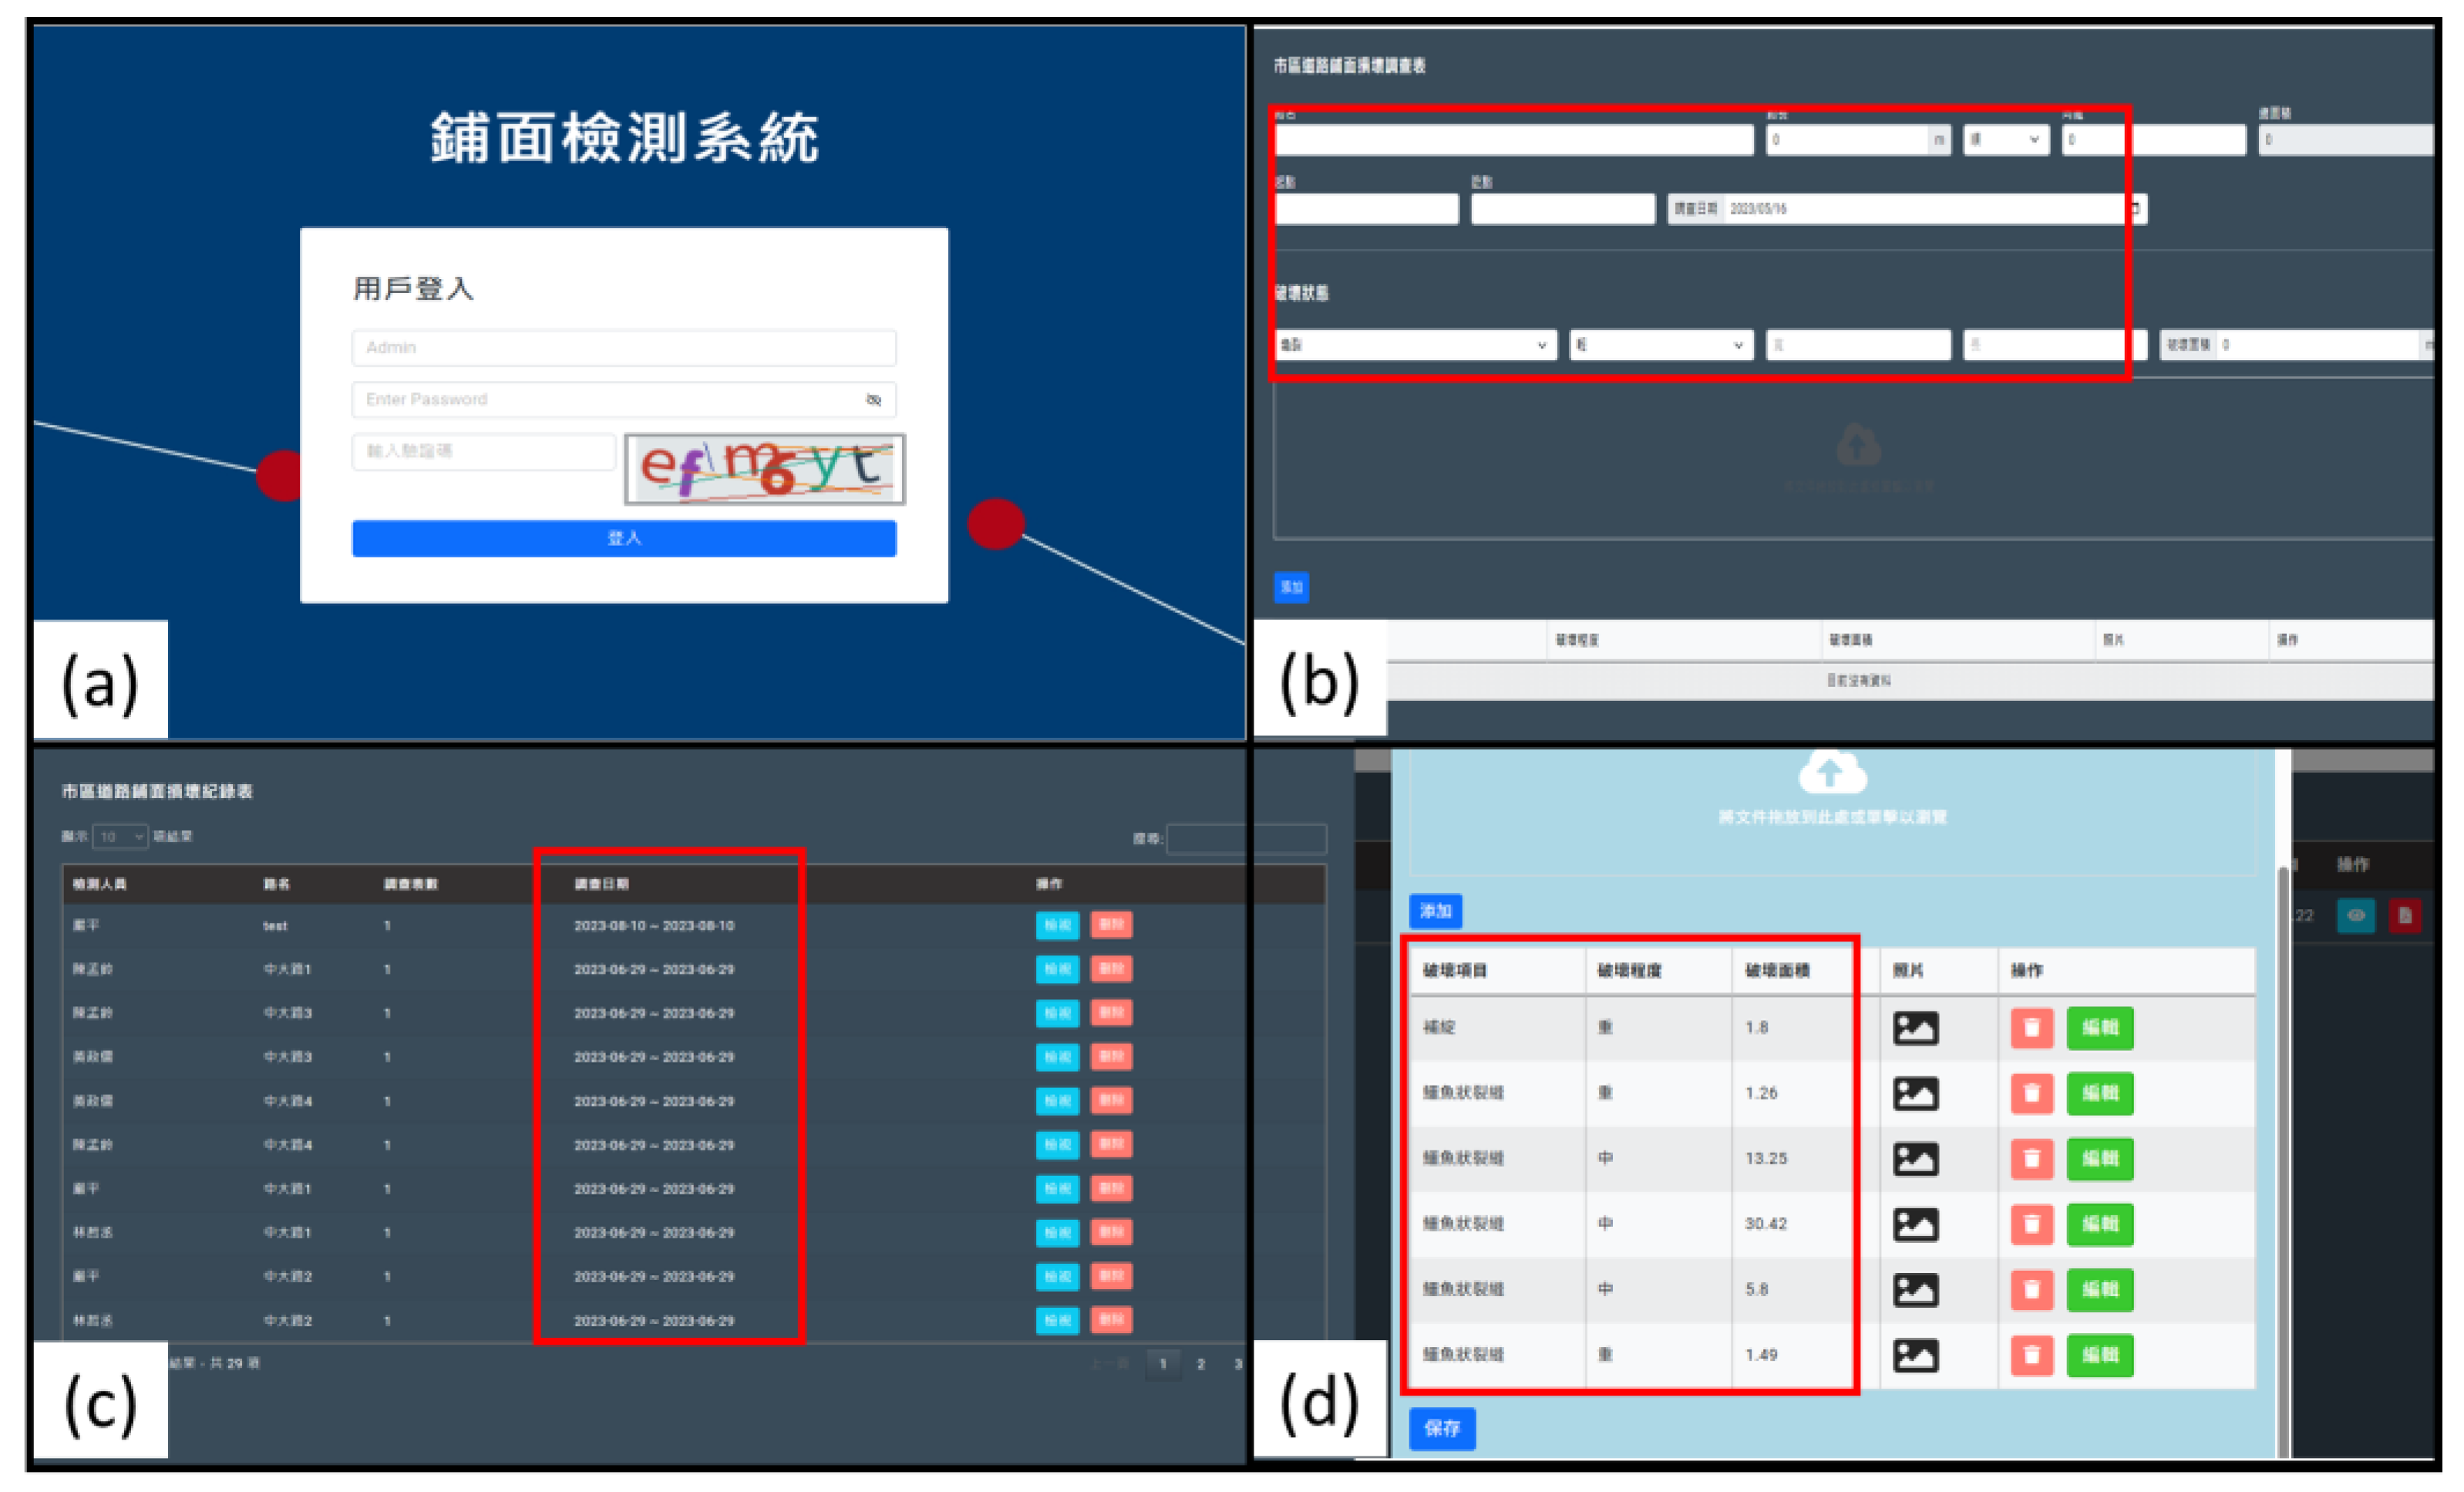
  • Pavement inspection system: A custom-designed web-based system was developed specifically for comprehensive pavement condition assessment. This system is optimized for mobile use and allows inspectors to perform all inspection tasks on-site using a smartphone. It is used to record distress data, upload geotagged photos, and automatically calculate PCI scores based on standard procedures. The system includes the following components (Figure 3) [2,9,10]:
    • Damage survey form: Inspectors enter the distress type, severity, and dimensions (length and width) through a mobile-friendly interface. Photos of the pavement condition can also be uploaded directly. All data are synchronized in real time to a secure server.
    • Record table: This module displays the full set of historical inspection records, allowing inspectors to query, compare, or export inspection results.
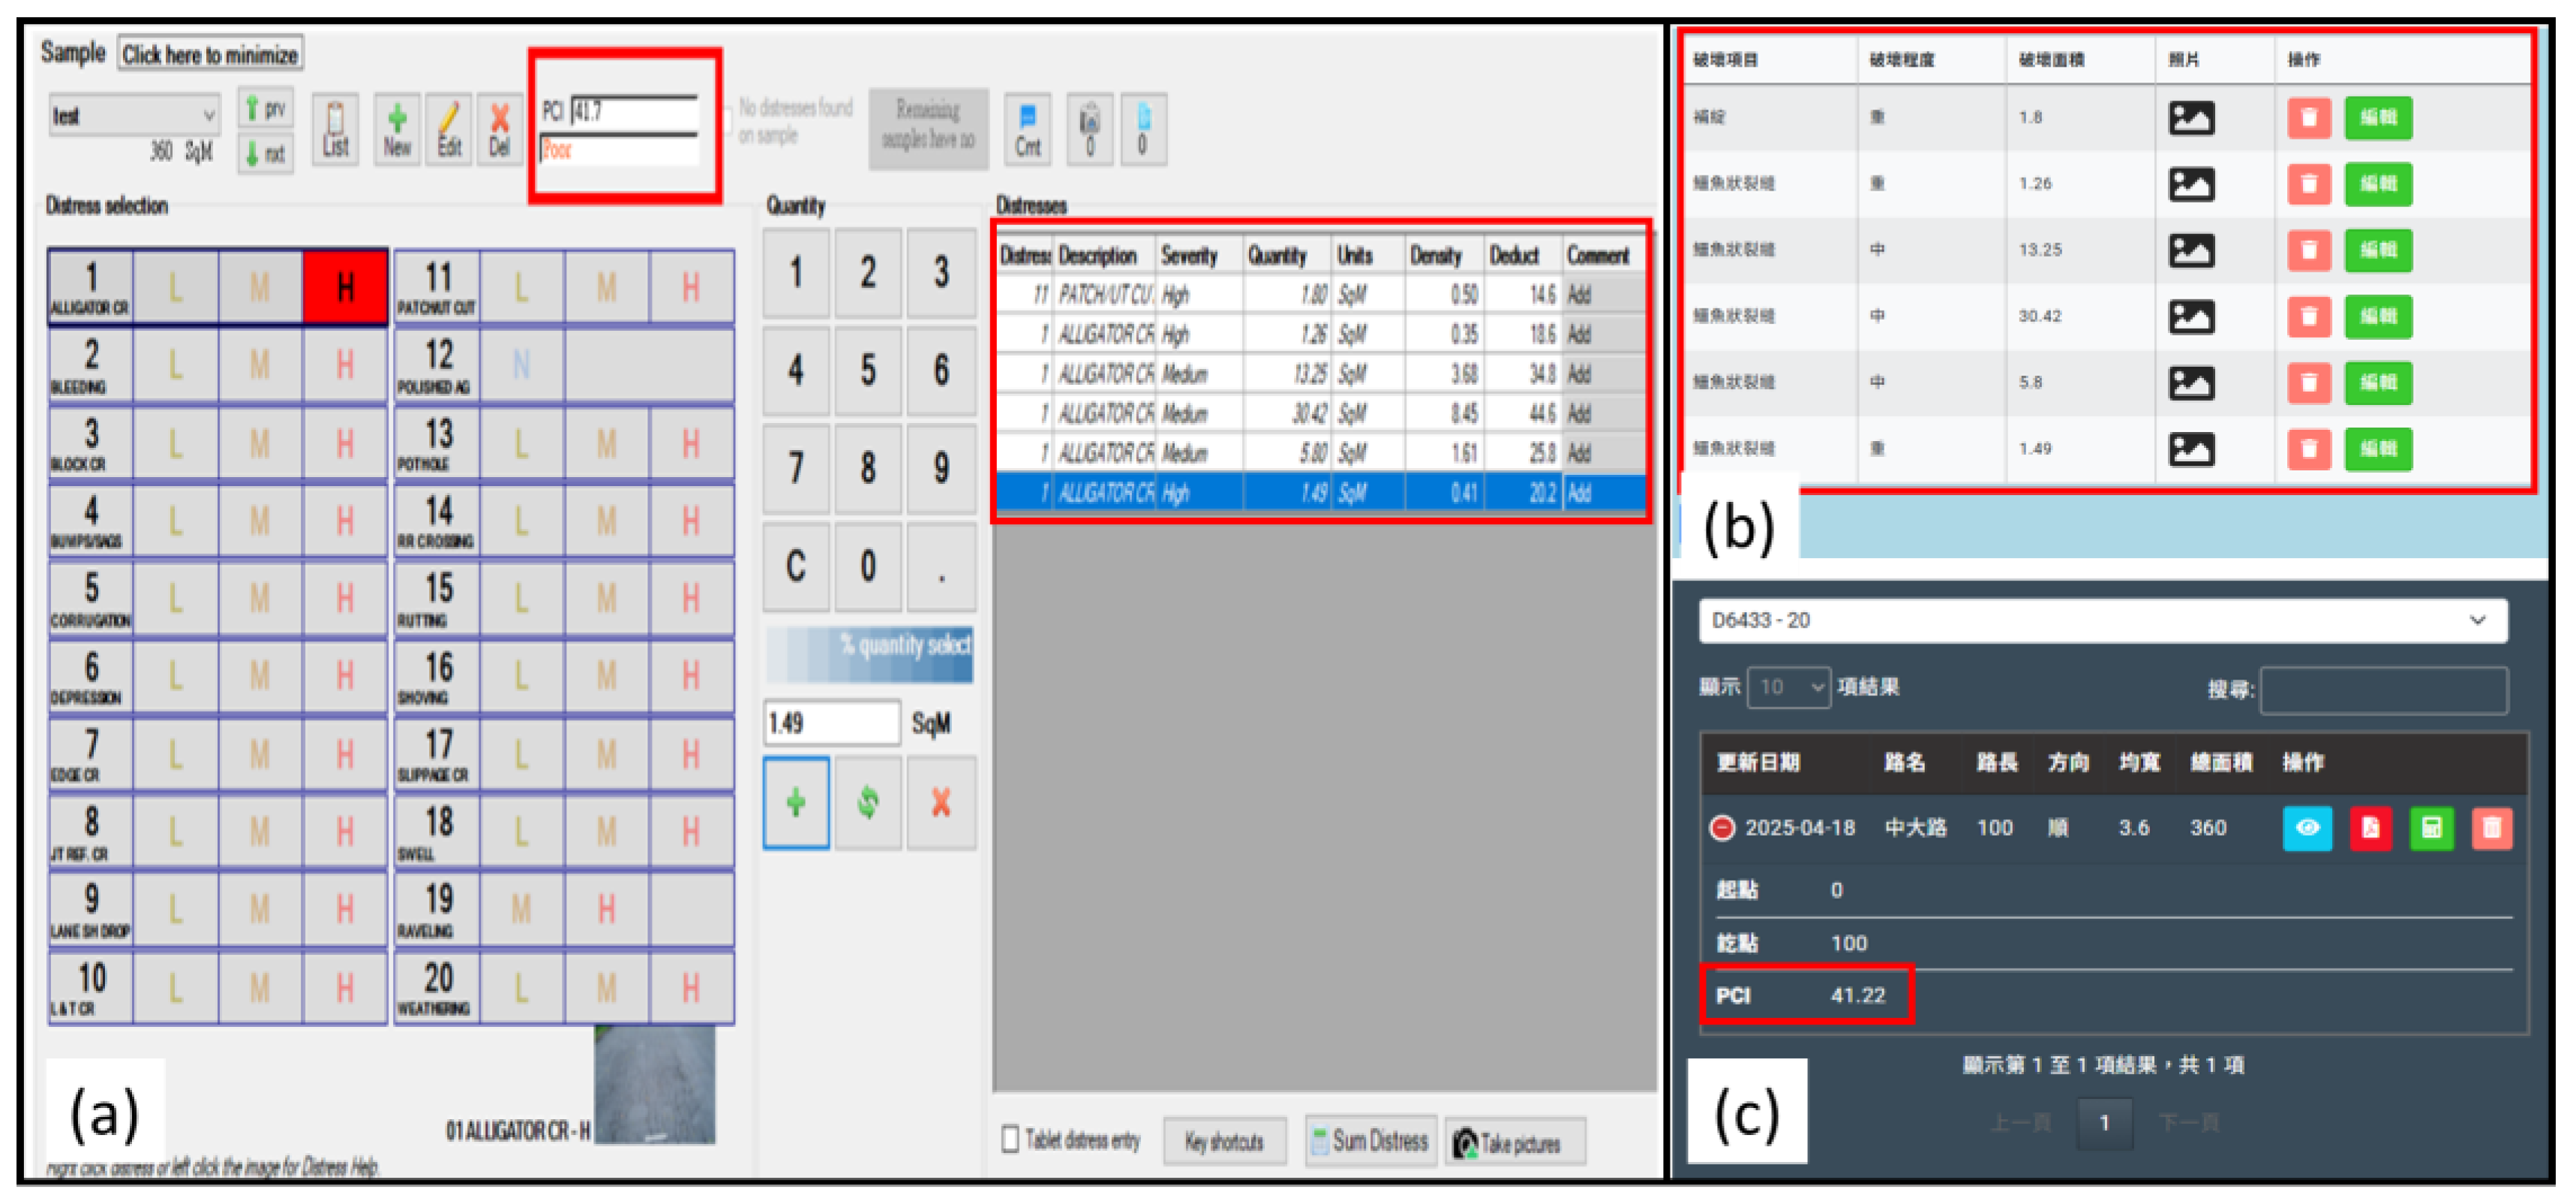
    • PCI verification: A verification page compares automatically calculated PCI scores with field data from re-inspections, enhancing reliability and traceability.
  • Training content: The training provided in this study focuses on improving the repeatability and accuracy of the manual Pavement Condition Index data. The training includes the following:
    • Identification of pavement damage types and severity: Training materials and case studies are used to introduce various types of pavement distress and their impact on pavement quality, with field demonstrations and exercises.
    • Measurement of pavement damage area: Proper measurement techniques for cracks, potholes, and other damage types (length, width, and depth) are demonstrated. Practical exercises are provided to ensure accurate measurements.
    • Measurement equipment operation: Training on the correct operation of commonly used measurement equipment, ensuring that the inspectors can accurately and reliably use the tools.
    • Software application: The use of related inspection software is taught to eliminate the need for paper records, reducing the risk of human error in data entry and calculation. Simulated exercises help inspectors master the software and effectively manage and analyze the data.
  • Verification items: This study validates the manual inspection PCI method through three key verification items:
    • Inspector verification: Assessing the repeatability and accuracy of inspection results.
    • Equipment verification: Ensuring that the equipment measurements meet the required precision standards, with a focus on verifying the accuracy of the distance-measuring wheel.
    • Software calculation verification: Comparing the PCI data calculated by the system with results obtained from standard software.

2.4.2. Verification Methods

The repeatability and accuracy of manual inspection results are critical indicators of inspection method reliability. Manual inspections may be influenced by the experience, skills, or subjective judgment of the inspector, potentially causing some degree of bias in the measurement results. To improve reliability, multiple measurements and inspectors are used to minimize random or systematic errors. This study uses the Coefficient of Variation (CV) to assess the precision and accuracy of the manual inspection results, comparing the data as follows:
  • Repeatability: Repeatability assesses the consistency of PCI scores obtained by the same inspector under identical conditions during multiple inspections of the same road segment. To evaluate repeatability, this study arranged for the same inspector to perform four repeated inspections of the same road segment, resulting in four sets of PCI data. First, one outlier (i.e., the value with the largest deviation from the others) was excluded to minimize the impact of abnormal data. The Coefficient of Variation (CV) was then calculated for the remaining three datasets. The C V is used to quantify the relative dispersion of the measurement results, and its calculation formula is as follows:
    C V = σ 1 N 1 i = 1 N X i R e f e r e n c e   v a l u e i 2 R e f e r e n c e   v a l u e × 100 %
  • Accuracy: Accuracy measures the consistency of PCI scores among different inspectors. This is evaluated by comparing the measurements to a reference value, which is the average PCI score from multiple inspectors. Each inspector will perform four measurements on the same section, and the average PCI score will be calculated. The consistency of the individual measurements compared to the reference value will determine the accuracy [11,12].

2.5. Data from Manual Inspections

This section presents the inspection data collected before the personnel validation process. Four inspectors, labeled as A through D, conducted the manual inspections, with each inspector performing five rounds of inspection. In each round, all inspectors assessed 12 road units covering a total length of 1140 m. Due to the substantial length of each inspection, the assessments were conducted on different dates: 17 February, 17 March, 13 April, 27 April, and 11 May 2023.
Table 1 provides the average data from all four inspectors for each round of inspection. For further analysis, one specific road unit containing four distinct types of pavement distresses and with a Pavement Condition Index (PCI) score below 70 was selected. Specifically, the 100–200 m segment in the forward direction was identified as the validation section.
From the table above, it can be observed that the scores from each inspection exhibit significant variations. Therefore, personnel validation is necessary to improve the repeatability and accuracy of each inspection. Based on the data presented, this study selects the forward direction section of Zhongda Road from 100 to 200 m as the road unit for validation.

3. Results

3.1. Comparison of Inspection Data

This section focuses on analyzing the changes in Pavement Condition Index (PCI) data collected by manual inspectors before and after undergoing training, aiming to evaluate the impact of training on inspection accuracy and repeatability. The purpose of the training was to enhance the inspectors’ professional knowledge and practical skills, thereby improving the consistency and reliability of inspection results. Prior to training, the inspectors conducted multiple PCI measurements independently, with the resulting data revealing measurement deviations and inconsistencies among different inspectors. Following the training, the inspectors remeasured the same road sections, and the data from each inspection were recorded. In this section, the impact of training on inspection performance is quantified by comparing the accuracy and repeatability of the data before and after training. Metrics such as the Mean Relative Error (MRE) and Coefficient of Variation (CV) are utilized to evaluate improvements in performance attributable to the training.

3.1.1. Inspection Data Before Training

Prior to validation, the accuracy of the inspectors was assessed by conducting four PCI measurements, with the results recorded in the manual inspection system. Among the four measurements, one dataset with significantly poorer performance was excluded, and the excluded data were marked with a strikethrough. The relevant inspection results are presented in Table 2:
The second step involves analyzing the accuracy before validation, focusing on determining whether the scores measured by different inspectors are similar. An average relative error analysis was conducted, and the results are presented in Table 3.

3.1.2. Inspection Data After Training

After undergoing professional training, the inspectors performed multiple PCI measurements on the same road segments to evaluate the impact of the training on inspection accuracy and repeatability. The training focused on enhancing inspection techniques, strengthening the understanding of standard operating procedures, and minimizing errors caused by subjective judgment.
Each inspector conducted four measurements after the training, with the results fully recorded and compared to the pre-training data. To quantify the improvements in inspection performance due to training, this section analyzes the accuracy and repeatability of the post-training inspection data. Key comparison metrics include the Mean Relative Error (MRE) and the Coefficient of Variation (CV), which reflect the consistency and stability of the inspection data.
The post-training inspection results demonstrate a significant reduction in the Coefficient of Variation (CV). Table 4 lists the CVs for the four measurements conducted by each inspector. Compared to the pre-training results, Inspector D’s CV decreased notably from 56.1% to 8.8%, indicating a substantial improvement in data repeatability. This suggests that, following the training, all inspectors were able to adhere more closely to the standard operating procedures, thereby reducing variability and individual differences in the measurement results.
The accuracy after training also showed significant improvement. As shown in Table 5, the Mean Relative Error (MRE) between each inspector’s results and the standard PCI score decreased notably after training. The post-training average MRE dropped to 5.88%, compared to 45.28% before training, representing a substantial improvement. This indicates that the training enabled inspectors to more accurately identify and assess pavement conditions, thereby reducing the impact of human errors.

3.1.3. Comparison of Pre- and Post-Training Results

To comprehensively evaluate the impact of training on the accuracy and repeatability of inspectors’ measurements, this section compares the inspection data collected before and after the training. The analysis focuses on changes in key metrics, including the Mean Relative Error (MRE) and the Coefficient of Variation (CV). These comparisons provide a clearer understanding of the specific improvements in inspection performance achieved through the training program. The results of the comparison are summarized in Table 6.
The inspection data before and after training reveal a significant reduction in the Coefficient of Variation (CV) among inspectors following the training program (see Table 3 and Table 5). Before training, Inspector D had a CV as high as 56.1%, which decreased to 8.8% after training, demonstrating remarkable improvement. Similarly, the CVs of other inspectors also decreased to varying extents, with an average reduction of 69.4%. These results indicate that after undergoing training, the stability and consistency of inspection data improved significantly, effectively reducing random fluctuations and individual discrepancies in measurements.

3.2. Data Validation

The primary goal of this study is to determine the validation criteria for manual Pavement Condition Index (PCI) inspections and standardize the validation data. This will serve as a unified reference standard for future studies according to FHWA quality guidelines [13,14].
This section focuses on the validation of three key aspects:
  • Inspector accuracy: validating the individual accuracy of manual inspection results and the consistency of scores among different inspectors.
  • Equipment validation: ensuring the reliability and precision of the equipment used for inspecting pavement distresses.
  • System validation: verifying the PCI scores calculated by the system against actual field data.
The following subsections provide detailed explanations for each validation item.

3.2.1. Personnel Validation

After the training program, it is crucial to validate the performance of the inspectors to ensure the repeatability and accuracy of the measurements. The following standards were established for this validation:
  • Repeatability: Inspectors performed four measurements on the validation road unit. One extreme outlier from the four sets of data was excluded, and the Coefficient of Variation (CV) was calculated for the remaining three sets. The CV must be less than or equal to 0.1 to ensure consistency in the measurement results.
  • Accuracy: Inspectors performed four measurements on the validation road unit. One extreme outlier from the four sets of data was excluded, and the remaining three sets were recorded. The average of 12 measurements collected by all inspectors was taken as the reference value. Each inspector’s measurements were then compared against the reference value to calculate the relative error, and the Mean Relative Error (MRE) was determined. The MRE must not exceed 10% to ensure the reliability of measurement results across the inspection team.

3.2.2. Equipment Validation

The primary purpose of equipment validation is to ensure that distance measurements obtained using the distance measuring wheel meet the required standards of accuracy. The validation process involves performing three consecutive measurements over a straight 160 m section and recording the results. The average relative error between the three measured distances and the reference distance must not exceed 1% to be considered acceptable. Table 7 presents the validation results for the distance measuring wheel used in this study.

3.2.3. Software Validation

The first type of software validation involves using the PCI software “MicroPAVER v7.0,” [15,16] developed by the United States Army Corps of Engineers, to assess the consistency of the system used in this study. The validation process ensures that the results generated by the system align with those produced by the MicroPAVER v7.0 software (Figure 4).
The validation method involves inputting the same pavement distress types and severity levels into both the manual inspection system and the MicroPAVER system. The PCI scores calculated by the manual inspection system are then compared with those generated by the MicroPAVER software to evaluate the relative error. An average relative error of less than 5% is required for the validation to pass. The results are presented in Table 8.

4. Discussion

Repeatability and accuracy are both essential indicators for evaluating the quality of pavement condition assessments. Accuracy reflects the closeness of the measured PCI value to the actual condition of the pavement, while repeatability reflects the consistency of measurements conducted by the same or different inspectors. In this study, variability among inspectors before training was notable, but both repeatability and accuracy improved significantly after structured training and validation processes [17].
By adopting the Coefficient of Variation (CV) and Mean Relative Error (MRE) as statistical indicators, this study establishes clear, quantitative criteria to assess the performance of manual inspections. These indicators provide an objective framework to standardize the evaluation of PCI results—filling the gap in previous practices where inspector consistency and accuracy were not systematically measured [12,18,19].
Although there has been increasing focus on automated or intelligent pavement inspection systems in recent years, manual inspections remain widely used in many regions, especially where resources for automation are limited. Therefore, improving the reliability of manual inspection methods continues to hold practical significance. The validation framework proposed in this study serves not only to enhance manual practices but also to support the future calibration and benchmarking of automated systems. It is recommended that validated manual PCI procedures be integrated into Quality Control (QC) and Quality Assurance (QA) frameworks to improve the overall consistency in pavement management. These efforts will contribute to better resource allocation, more consistent maintenance planning, and ultimately a safer and more efficient road environment for the public [20].

5. Conclusions

This study analyzed the variability in Pavement Condition Index (PCI) scores obtained through manual inspection and proposed a validation framework based on repeatability and accuracy. Using the Coefficient of Variation (CV) and Mean Relative Error (MRE) as performance indicators, we demonstrated that both metrics significantly improved after inspector training. Based on the findings, it is recommended that future manual PCI inspection guidelines adopt a CV threshold of ≤0.1 for repeatability and an MRE threshold of ≤10% for accuracy. These quantitative criteria can serve as reference standards in field applications, particularly for local government agencies or organizations that rely on manual inspection methods. Implementing these indicators as part of a Quality Control (QC) and Quality Assurance (QA) framework can help improve inspection reliability and data consistency [15,16].
In terms of equipment validation, the distance measuring wheel achieved an average relative error of less than 1%, and the PCI scores computed by the developed pavement inspection system showed less than 5% deviation when compared to MicroPAVER software, confirming the system’s measurement accuracy [21,22].
This study contributes a practical and measurable method for evaluating manual PCI inspections—an area that has been largely overlooked in recent literature. Future work could focus on extending this validation framework to automated or AI-based pavement inspection systems, enabling performance benchmarking across both manual and intelligent inspection methods [5,23,24].

Author Contributions

Conceptualization, S.-H.L. and J.-D.L.; methodology, S.-H.L.; validation, J.-D.L. and Y.-S.C.; formal analysis, S.-H.L.; investigation, S.-H.L. and Y.-S.C.; resources, J.-D.L.; data curation, S.-H.L.; writing—original draft preparation, S.-H.L.; writing—review and editing, J.-D.L. and Y.-S.C.; visualization, S.-H.L.; supervision, J.-D.L.; project administration, J.-D.L.; funding acquisition, not applicable. All authors have read and agreed to the published version of the manuscript.

Funding

This research received no external funding.

Institutional Review Board Statement

Not applicable.

Informed Consent Statement

Not applicable.

Data Availability Statement

No new data were created or analyzed in this study. Data sharing is not applicable.

Conflicts of Interest

The authors declare no conflict of interest.

References

  1. D6433–16; Standard Practice for Roads and Parking Lots Pavement Condition Index Surveys. ASTM International: West Conshohocken, PA, USA, 2016.
  2. Ibragimov, E.; Kim, Y.; Lee, J.H.; Cho, J.; Lee, J.-J. Automated Pavement Condition Index Assessment with Deep Learning and Image Analysis: An End-to-End Approach. Sensors 2024, 24, 2333. [Google Scholar] [CrossRef] [PubMed]
  3. Majidifard, H.; Adu-Gyamfi, Y.; Buttlar, W.G. Deep machine learning approach to develop a new asphalt pavement condition index. Constr. Build. Mater. 2020, 247, 118513. [Google Scholar] [CrossRef]
  4. Lo, H.-H. Research on the Application of AI Artificial Intelligence in Urban Road Damage Analysis. Master’s Thesis, National Central University, Taoyuan, Taiwan, 2020. (In Chinese). [Google Scholar]
  5. Wang, K.C.P.; Elliott, R.P. Investigation of Image Archiving for Pavement Surface Distress Survey; Final Report; Mack-Blackwell Transportation Center, University of Arkansas: Fayetteville, AR, USA, 1999. [Google Scholar]
  6. Uddin, W.; Hudson, W.; Haas, R. Framework for Infrastructure Asset Management. In Public Infrastructure Asset Management, 2nd ed.; McGraw-Hill Education: Columbus, OH, USA, 2013. [Google Scholar]
  7. Hung, C.-T. The Study on Establishing the Present Serviceability Index and Predictive Model of Flexible Pavement. Master’s Thesis, National Central University, Taoyuan, Taiwan, 2000. (In Chinese). [Google Scholar]
  8. Teng, C.-Y. Automated Pavement Distress Detection System. Master’s Thesis, National Central University, Taoyuan, Taiwan, 2008. (In Chinese). [Google Scholar]
  9. Hsu, S.-M. Application of Automatic Image Recognition in Pavement Distress for Improving Pavement Inspection. Master’s Thesis, National Central University, Taoyuan, Taiwan, 2017. (In Chinese). [Google Scholar]
  10. Huang, L.-L.; Lin, J.-D.; Huang, W.-H.; Kuo, C.-H.; Huang, M.-Y. Application of Automated Pavement Inspection Technology in Provincial Highway Pavement Maintenance Decision-Making. Appl. Sci. 2024, 14, 6549. [Google Scholar] [CrossRef]
  11. Flintsch, G.W.; McGhee, K.K. Quality Management of Pavement Condition Data Collection; National Cooperative Research Program; National Academies Press: Washington, DC, USA, 2009. [Google Scholar]
  12. Suh, Y.-C.; Kwon, H.-J.; Park, K.-S.; Ohm, B.-S.; Kim, B.-I. Correlation Analysis between Pavement Condition Indices in Korean Roads. KSCE J. Civ. Eng. 2018, 22, 1162–1170. [Google Scholar] [CrossRef]
  13. Zheng, C.-Y. Auto Pavement Damage Image Detection System Importing Pavement Distress Maintenance Management System. Master’s Thesis, National Central University, Taoyuan, Taiwan, 2013. (In Chinese). [Google Scholar]
  14. Federal Highway Administration (FHWA). Practical Guide for Quality Management of Pavement Condition Data Collection. In FHWA-HIF-11-039; U.S. Department of Transportation: Washington, DC, USA, 2011. [Google Scholar]
  15. Department of the Army, United States. Pavement Maintenance Management (PAVER 1982). In Technical Manual TM 5-623; Department of the Army: Washington, DC, USA, 1982. [Google Scholar]
  16. Shahin, M.Y.; Darter, M.J.; Kohn, S.D. Development of a Pavement Maintenance Management System, Volume V. In Technical Report CEEDO-TR-77-44; Air Force Civil Engineering Center: Tyndall Air Force Base, FL, USA, 1977. [Google Scholar]
  17. Moretti, L.; Cantisani, G.; Di Mascio, P. Management of road tunnels: Construction, maintenance and lighting costs. Tunn. Undergr. Space Technol. 2016, 55, 79–87. [Google Scholar] [CrossRef]
  18. Karim, F.M.A.; Rubasi, K.A.H.; Saleh, A.A. The Road Pavement Condition Index (PCI) Evaluation and Maintenance: A Case Study of Yemen. Organ. Technol. Manag. Constr. Int. J. 2016, 8, 1446–1455. [Google Scholar] [CrossRef]
  19. World Road Association (PLARC). The Importance of Road Maintenance; World Road Association: London, UK, 2014. [Google Scholar]
  20. Setyawan, A.; Nainggolan, J.; Budiarto, A. Predicting the Remaining Service Life of Road Using Pavement Condition Index. Procedia Eng. 2015, 125, 100–106. [Google Scholar] [CrossRef]
  21. Zafar, M.S. Condition survey for evaluation of pavement condition index of a highway. Civ. Eng. J. 2019, 5, 1367–1383. [Google Scholar] [CrossRef]
  22. Pinatt, J.M.; Chicati, M.L.; Ildefonso, J.S. Evaluation of Pavement Condition Index by Different Methods: Case Study of Maringá, Brazil. Transp. Res. Interdiscip. Perspect. 2020, 4, 100011. [Google Scholar] [CrossRef]
  23. Sung, T.-H. The Study of Surveying Asphalt Pavement Condition Index. Master’s Thesis, Department of Civil Engineering, National Central University, Taoyuan, Taiwan, 2003. (In Chinese). [Google Scholar]
  24. Wang, K.C.P.; Gong, W.; Wilson, D.; Macky, C.; Addo, K. Application and Advanced Development of the Next-Generation Highway Data Vehicle; Final Report; Mack-Blackwell Transportation Center and Arkansas State Highway and Transportation Department: Fayetteville, AR, USA, 2003. [Google Scholar]
Figure 1. Flowchart illustrating the procedure for calculating the Pavement Condition Index (PCI) adapted from ASTM D6433-23 [1]: (a) the process of collecting basic road data and identifying distress types and severity levels; (b) calculation of distress density and deduct values (DVs), followed by adjustment to corrected deduct values (CDVs); (c) selection of the high corrected deduct value (HCDV) and computation of the final PCI score.
Applsci 15 05600 g001
Figure 2. Road inspection details: (a) basic road data; (b) inspection starting point; (c) inspection ending point.
Applsci 15 05600 g002
Figure 3. Interface of the developed pavement inspection system for manual PCI assessment: (a) login page where inspectors enter credentials to access the system; (b) input section for basic road segment information such as section ID, length, width, direction, and inspection date (highlighted in red); (c) historical records page showing previous inspection results, with the highlighted area displaying different inspected road segments and their inspection timestamps; (d) input interface for pavement distress types, severity levels, and measured dimensions (highlighted in red), including options to upload photos and edit records.
Applsci 15 05600 g003
Figure 4. Comparison of software validation systems. (a) MicroPAVER software developed by the United States Army Corps of Engineers. The left red box indicates the computed PCI value, while the right red box shows the input distress types, quantities, and severities required to calculate the PCI. (b) Custom manual inspection system developed in this study, showing the input interface for distress types and measurements. (c) The PCI value automatically computed by the custom system. The calculated PCI values in (a,c) must maintain a Relative Error within 5% for validation purposes.
Applsci 15 05600 g004
Table 1. Inspection scores of Zhongda Road before validation (AVG = average PCI score). Note: “AVG” in each row refers to the average score across all inspectors for a given section; “AVG” in the last row refers to the overall average score per inspector.
SectionForward
Start to End
Reverse
End to Start
startend1234AVGCV1234AVGCV
010034.341.538.037.737.97.8%16.450.445.846.239.739.5%
10020025.224.419.021.022.413.0%59.377.970.570.469.511.1%
20030017.122.220.19.917.331.1%37.871.760.565.458.825.1%
30040030.648.241.637.539.518.7%90.375.077.568.277.811.9%
40050021.638.329.522.027.828.3%54.864.059.258.559.16.4%
50057063.971.771.468.868.95.2%33.548.450.031.440.823.8%
AVG32.141.136.632.835.617.3%48.764.660.656.757.619.6%
Table 2. Repeatability data of inspectors before validation.
InspectorFirstSecondThirdFourthSDCV (%)
Inspector A52.030.742.830.96.9319.9%
Inspector B10.36.21.912.63.2433.4%
Inspector C24.216.215.918.61.488.8%
Inspector D14.244.615.322.115.3456.1%
Table 3. Accuracy data of inspectors before validation.
InspectorMeasured DataAverageRelative Error (%)
Inspector A30.722.238.41%
42.892.97%
30.939.31%
Inspector B10.353.56%
6.272.05%
12.643.19%
Inspector C16.226.96%
15.928.31%
18.616.14%
Inspector D44.6101.08%
15.331.02%
22.10.36%
Average45.28%
Table 4. Repeatability data of inspectors after validation.
InspectorFirstSecondThirdFourthSDCV (%)
Inspector A15.813.215.613.71.167.7%
Inspector B16.111.616.517.90.955.6%
Inspector C15.116.313.515.10.694.5%
Inspector D15.313.08.915.11.278.8%
Table 5. Accuracy data of inspectors after validation.
InspectorMeasured DataAverageRelative Error (%)
Inspector A15.815.52.20%
15.60.91%
13.711.38%
Inspector B16.14.14%
16.56.73%
17.915.78%
Inspector C15.12.33%
16.35.43%
15.12.33%
Inspector D15.31.03%
13.015.91%
15.12.33%
Average5.88%
Table 6. Comparison of precision and accuracy before and after training.
InspectorCoefficient of Variation (%)Mean Relative Error (%)
Before TrainingAfter
Training
PercentageBefore TrainingAfter
Training
Percentage
Inspector A19.9%7.7%61.3%45.28%5.88%87.0%
Inspector B33.4%5.6%83.2%
Inspector C8.8%4.5%48.9%
Inspector D56.1%8.8%84.3%
Table 7. Validation records for distance measuring wheel.
Measured Distance (m)Reference Length (m)Absolute Error (m)Relative Error (%)
159.97160.00.031.88%
159.99160.00.010.62%
160.00160.00.000.00%
Average Relative Error0.83%
After conducting three consecutive distance measurements, the average relative error was calculated to be 0.83%, meeting the required standard.
Table 8. Comparison of PCI Scores from Pavement Management System and MicroPAVER: Relative Error Analysis.
Pavement Management SystemMicroPAVERRelative Error (%)
42.843.34.7%
36.837.10.6%
52.151.24.8%
Average Relative Error3.2%
Disclaimer/Publisher’s Note: The statements, opinions and data contained in all publications are solely those of the individual author(s) and contributor(s) and not of MDPI and/or the editor(s). MDPI and/or the editor(s) disclaim responsibility for any injury to people or property resulting from any ideas, methods, instructions or products referred to in the content.

