
Study of Rock Damage Constitutive Model Considering Temperature Effect Based on Weibull Distribution


Abstract
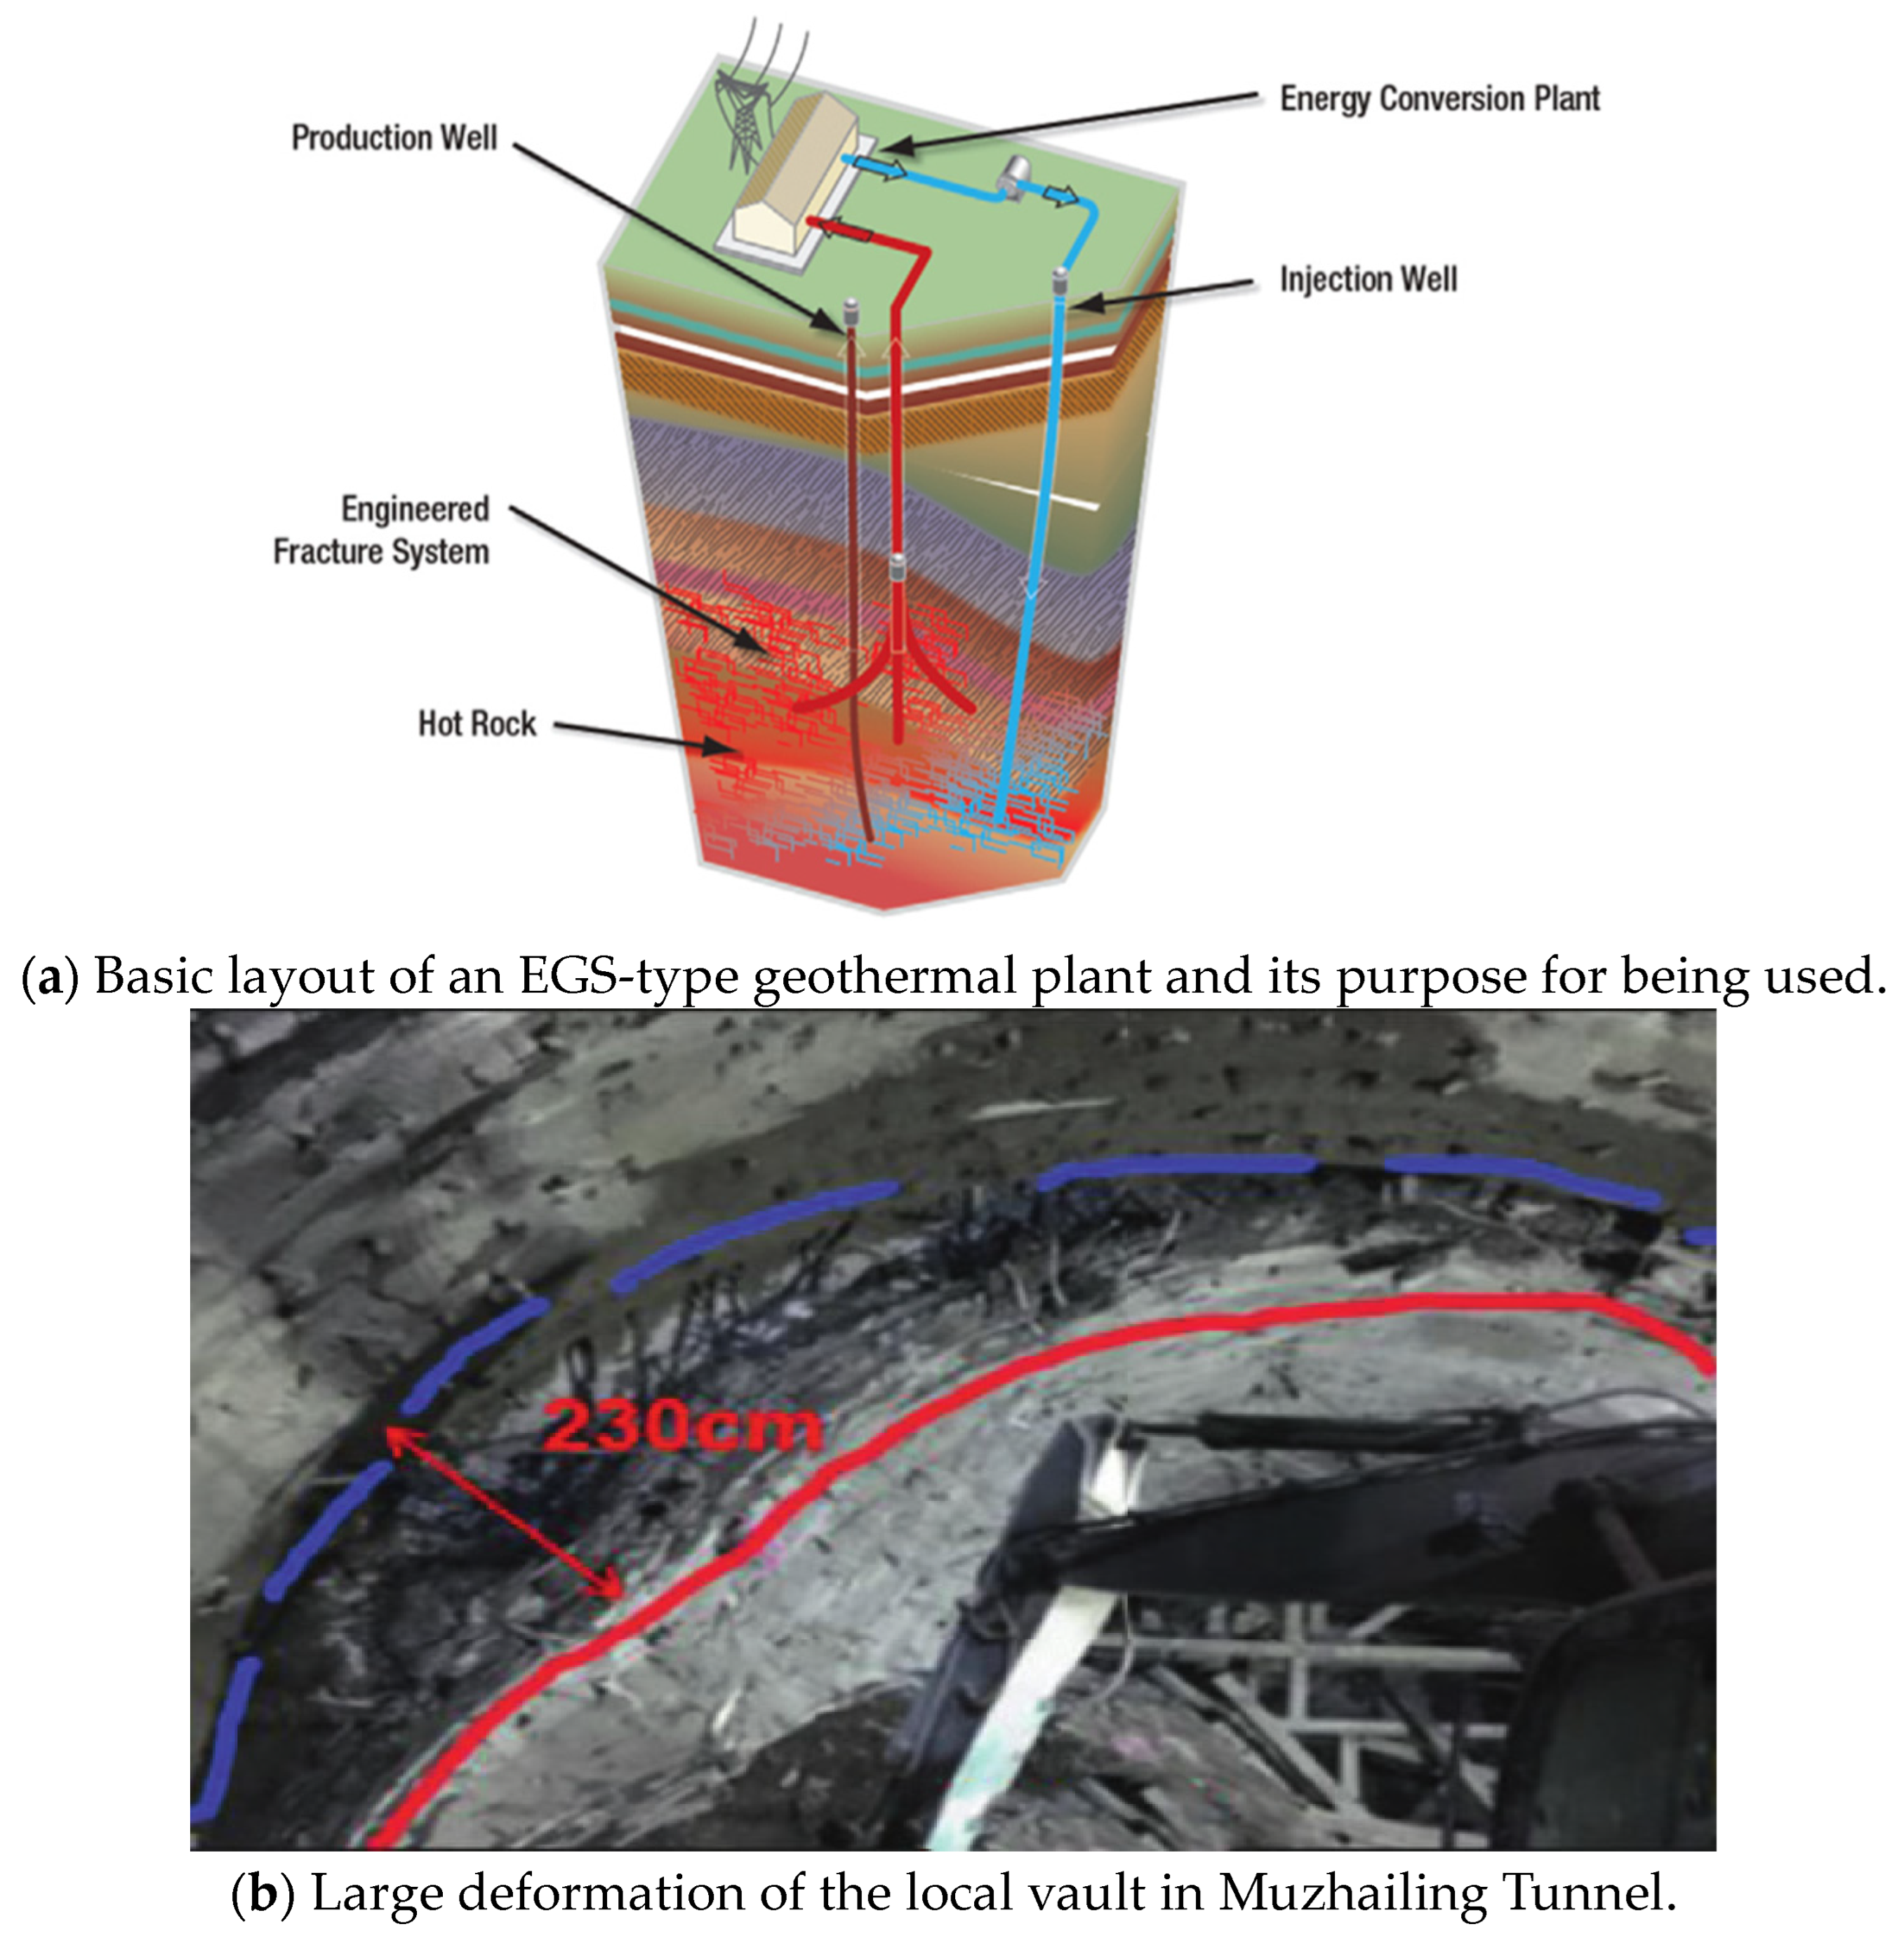
1. Introduction
2. Statistical Thermal Damage Constitutive Modeling of Rocks
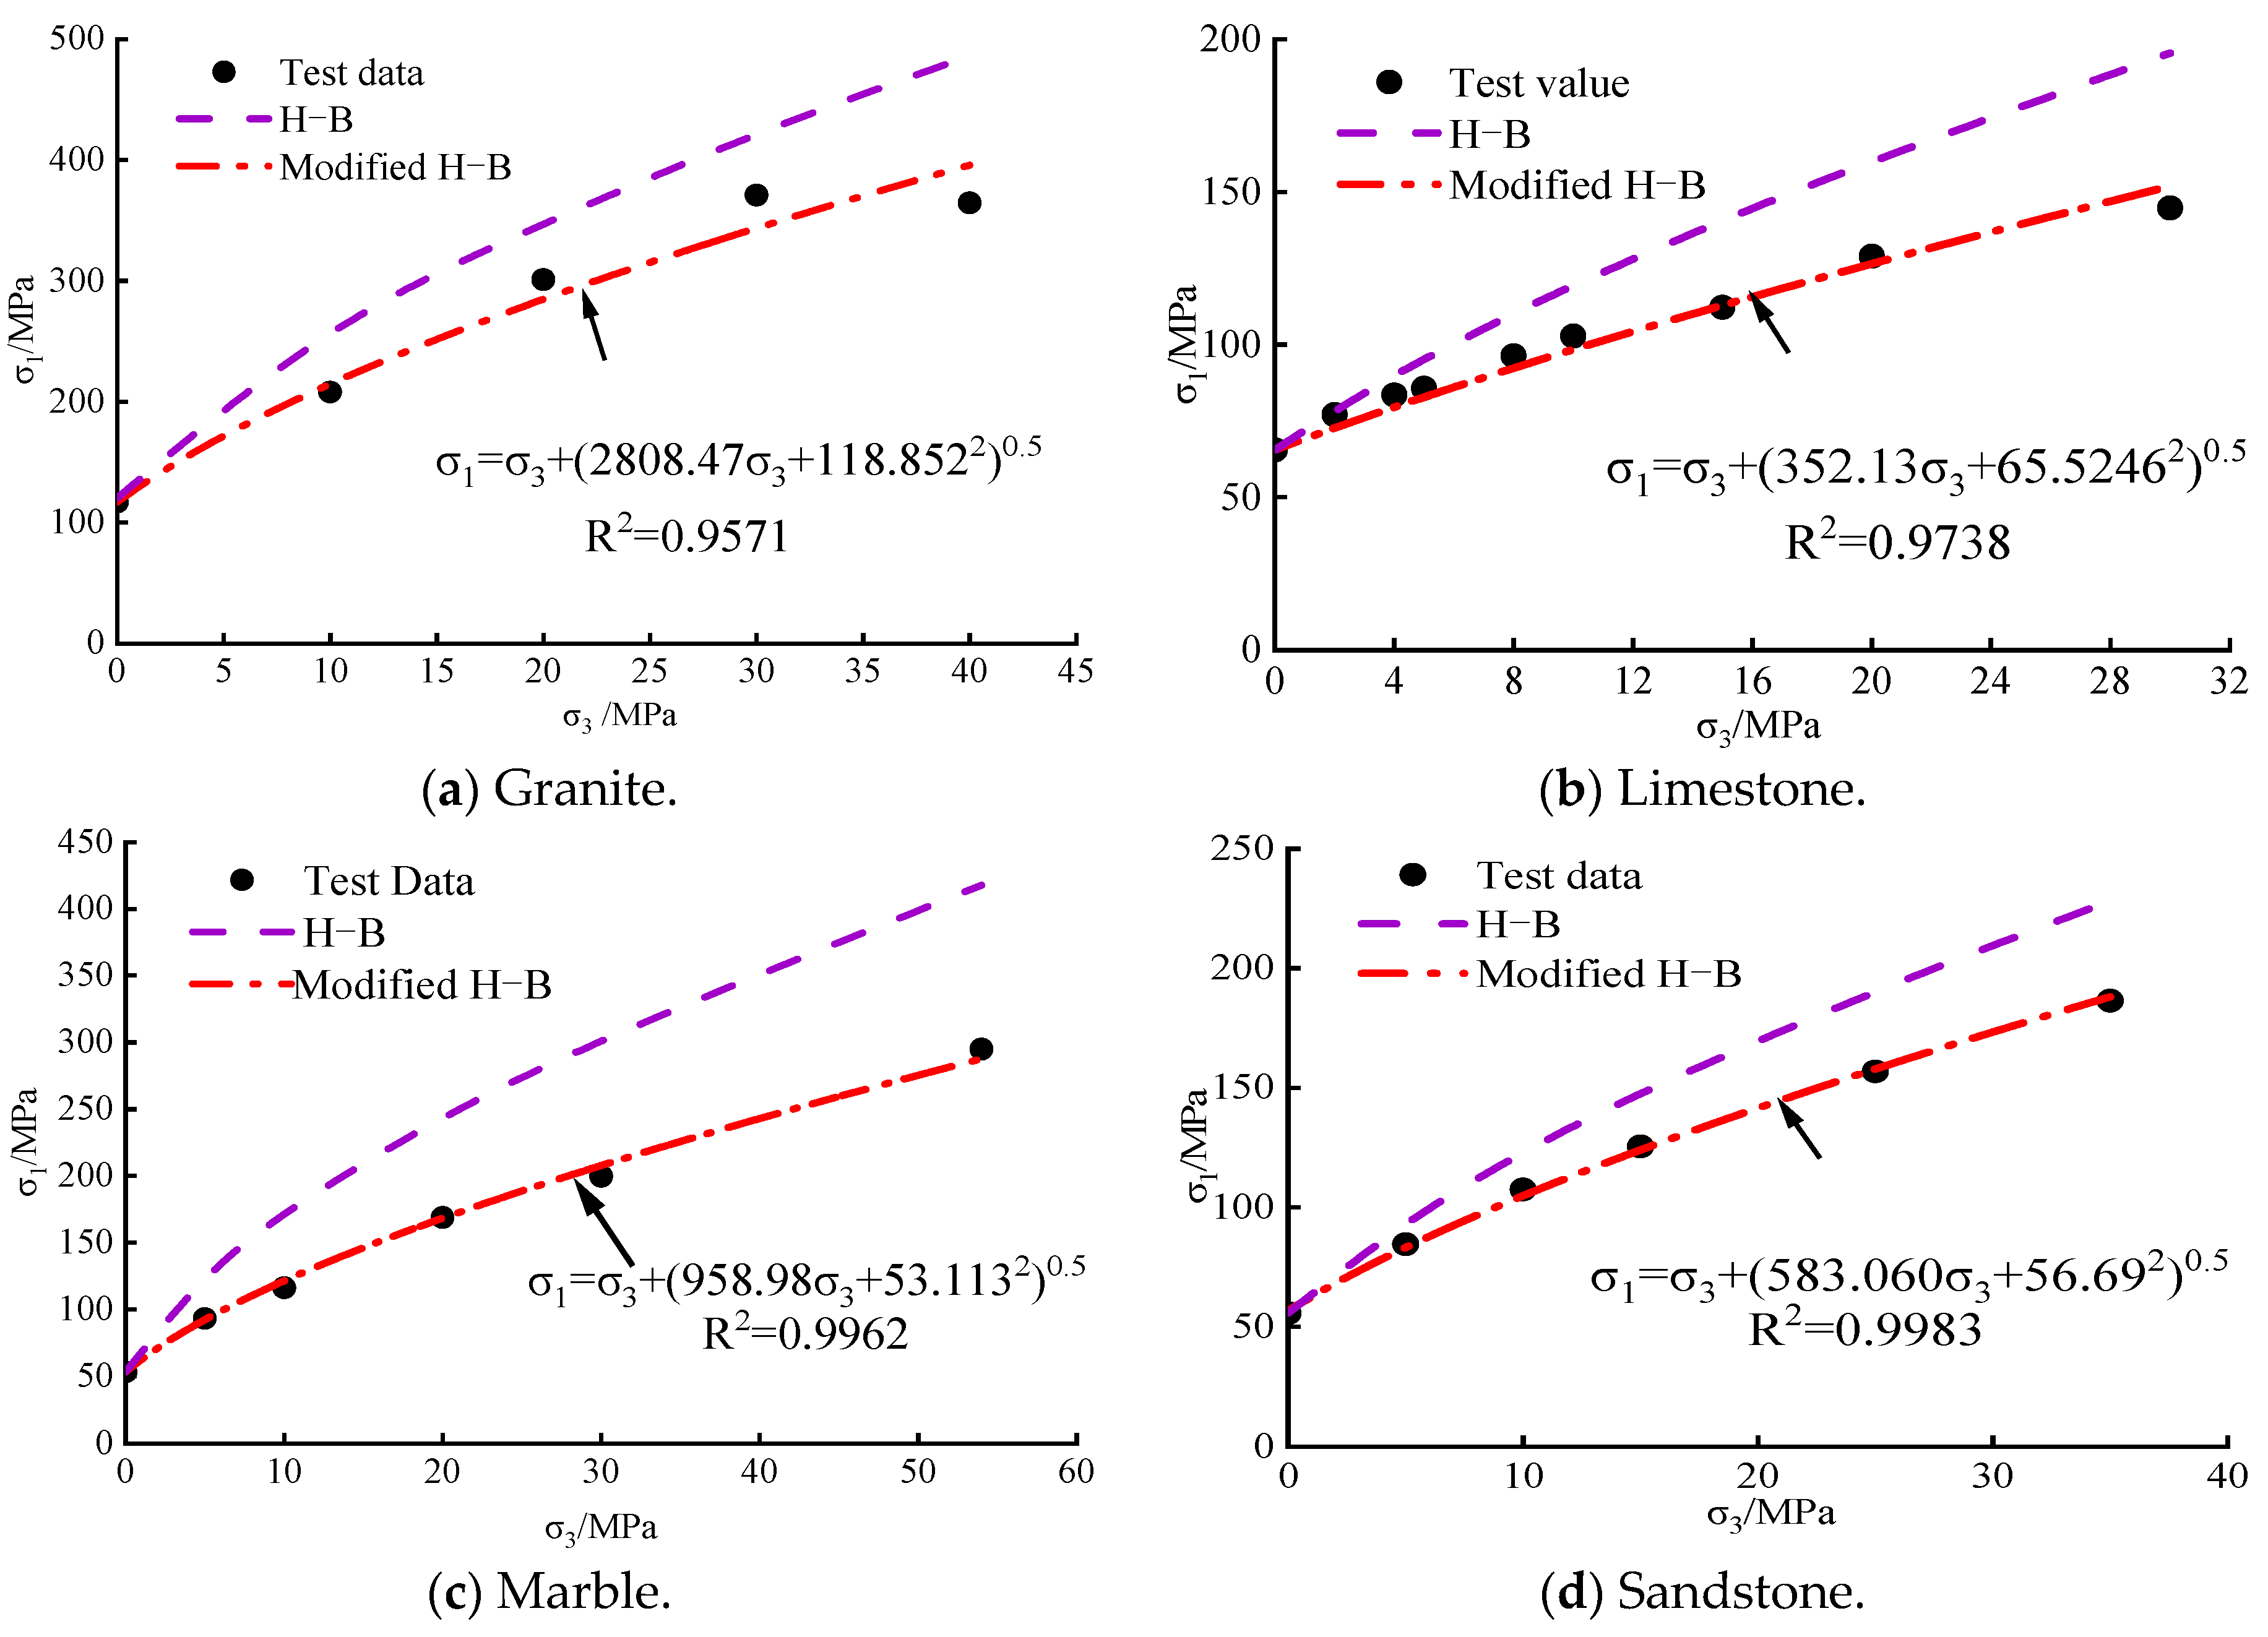
2.1. Applicability of the Strength Criterion
2.2. Establishment of a Constitutive Model
3. Determination of Model Parameters
4. Model Validation and Parameter Analysis at Room Temperature
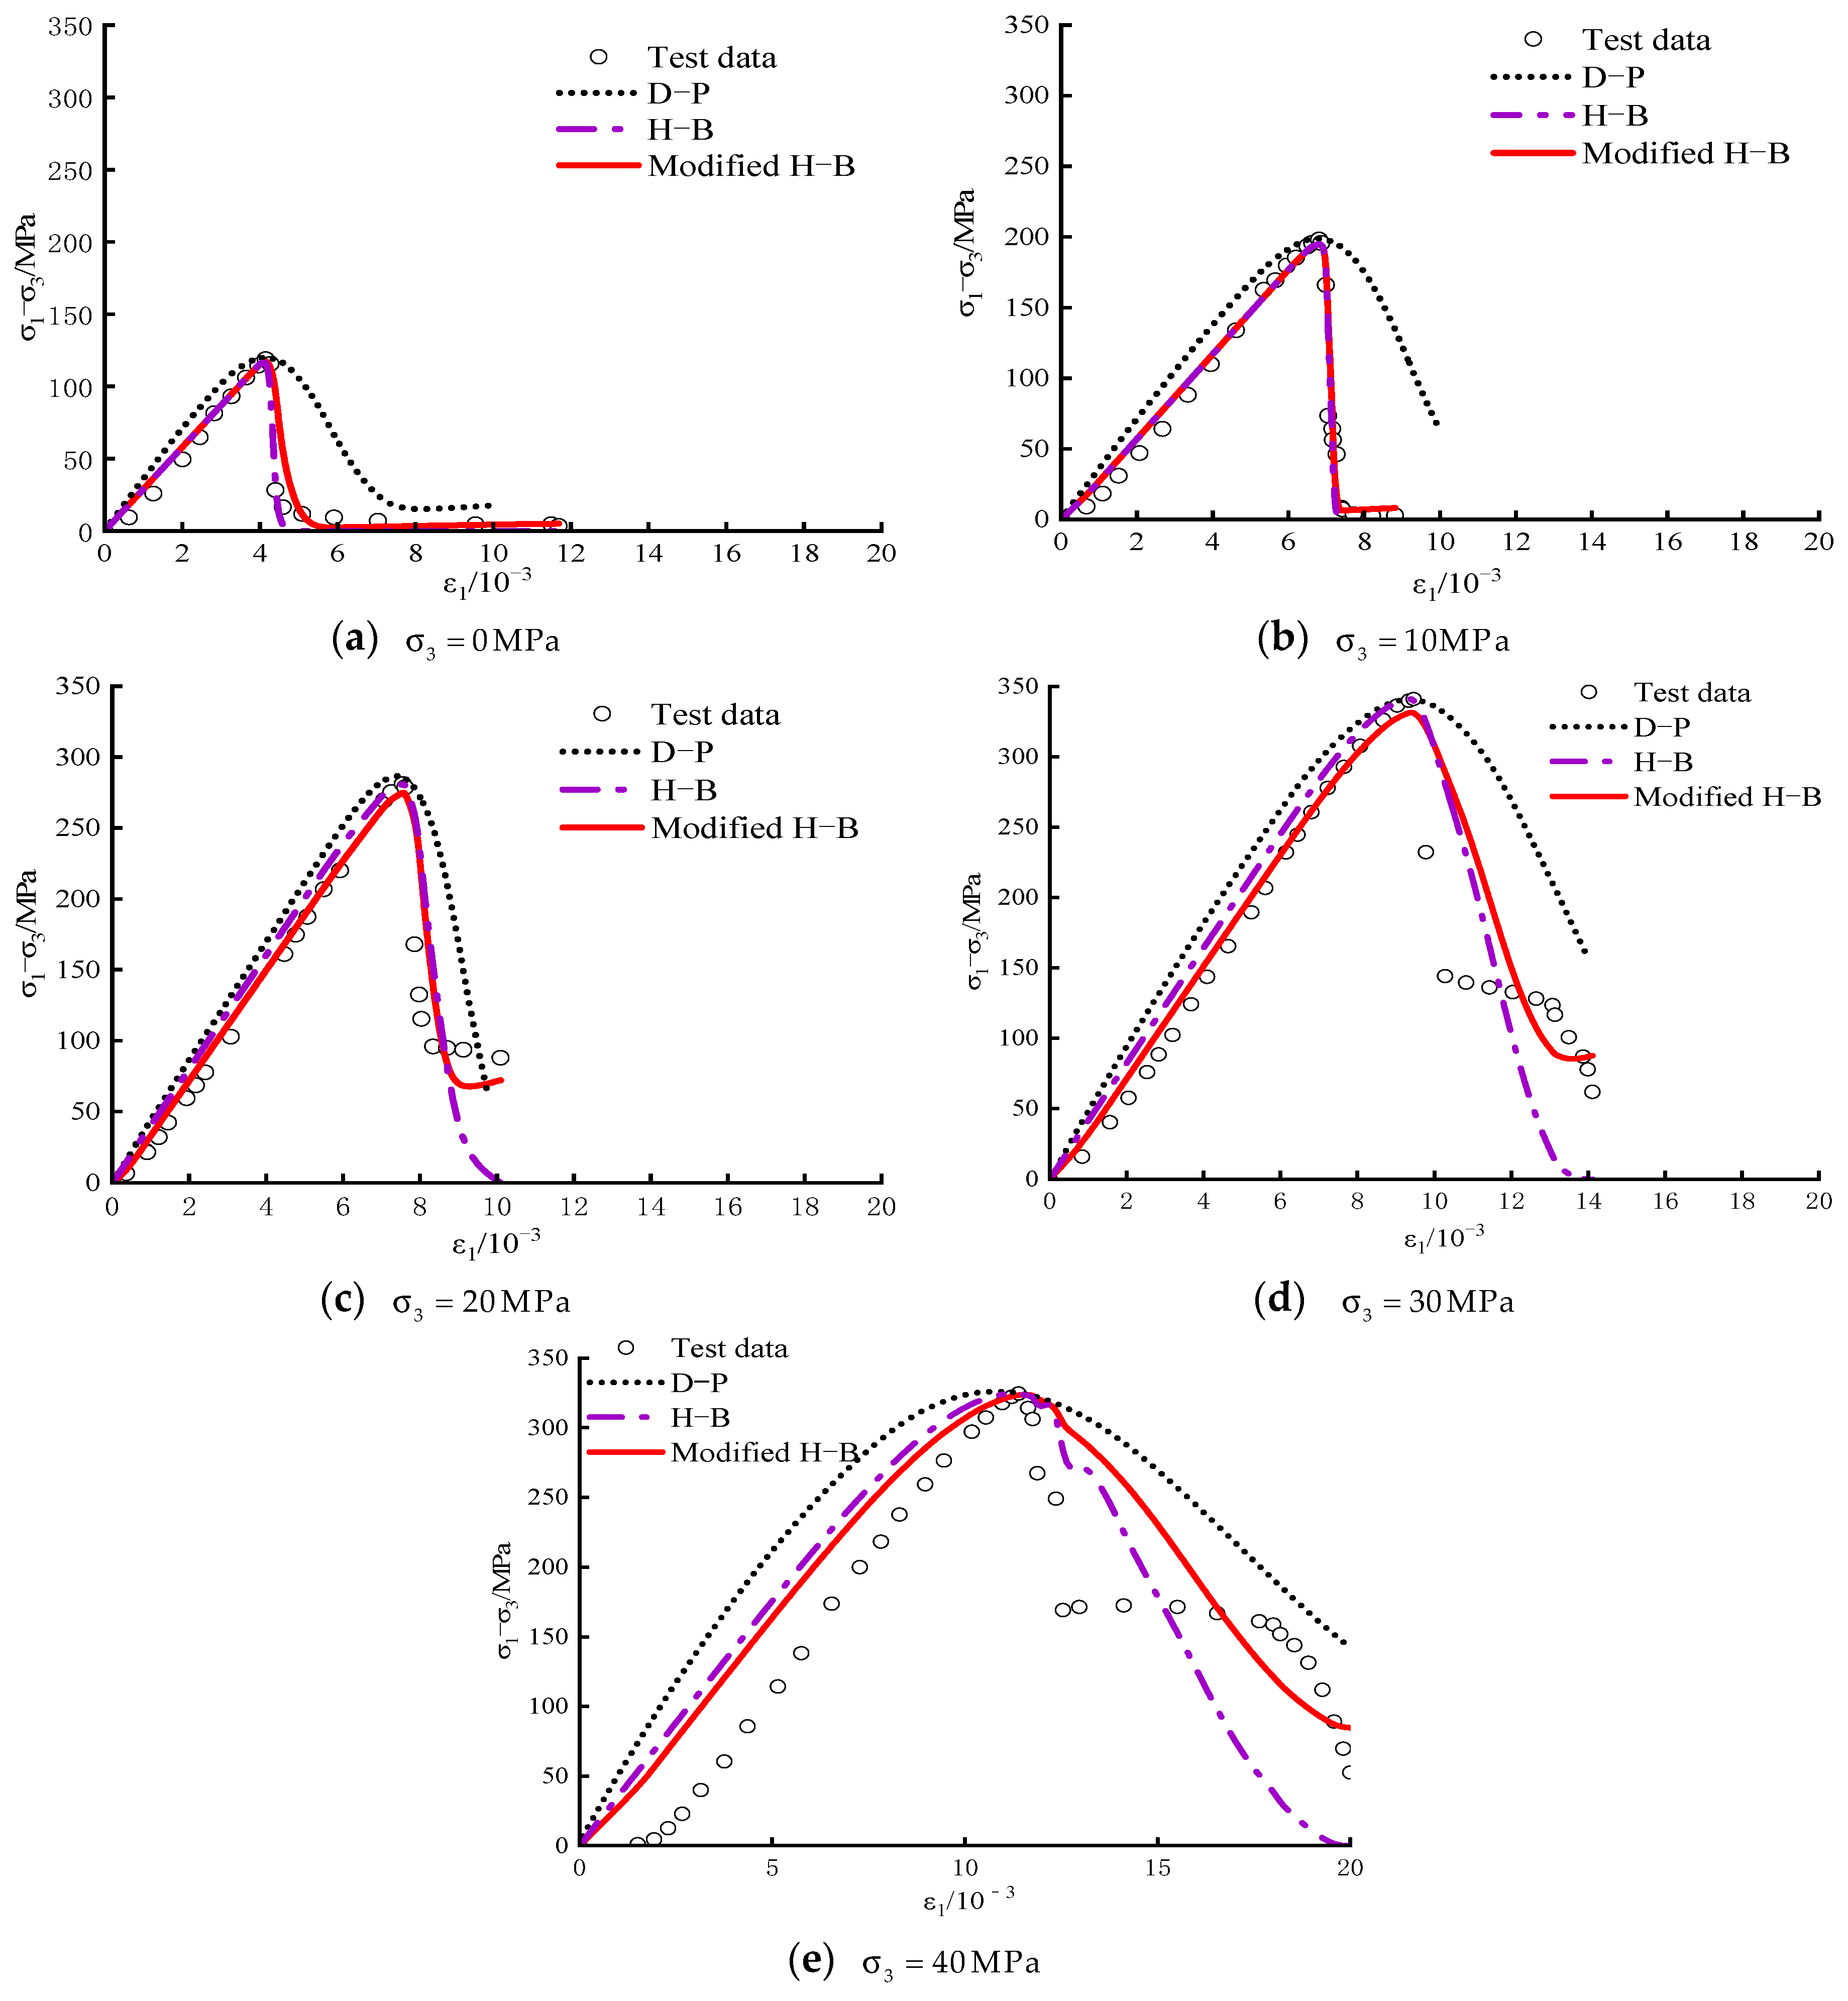
4.1. Model Validation
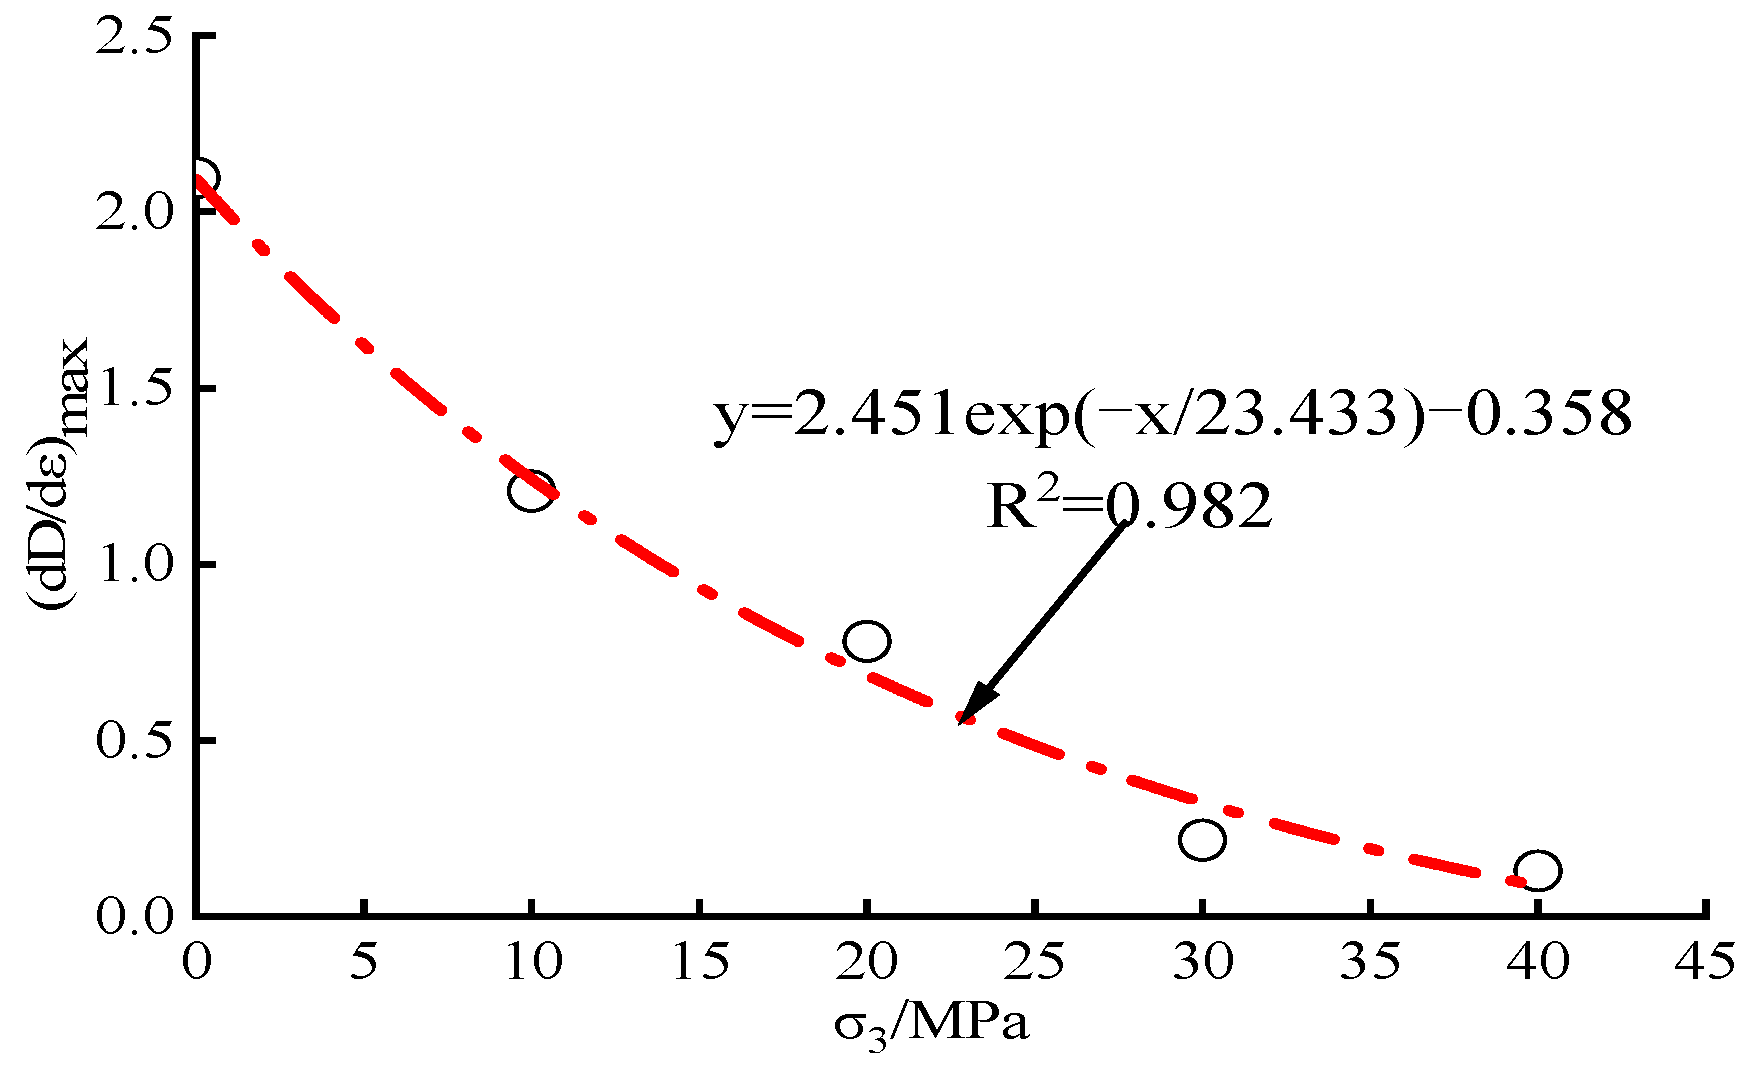
4.2. Model Parameter Analysis
5. The Damage Constitutive Model under a Thermo-Mechanical Coupling Condition Is Considered
6. Conclusion and Discussion
- (1)
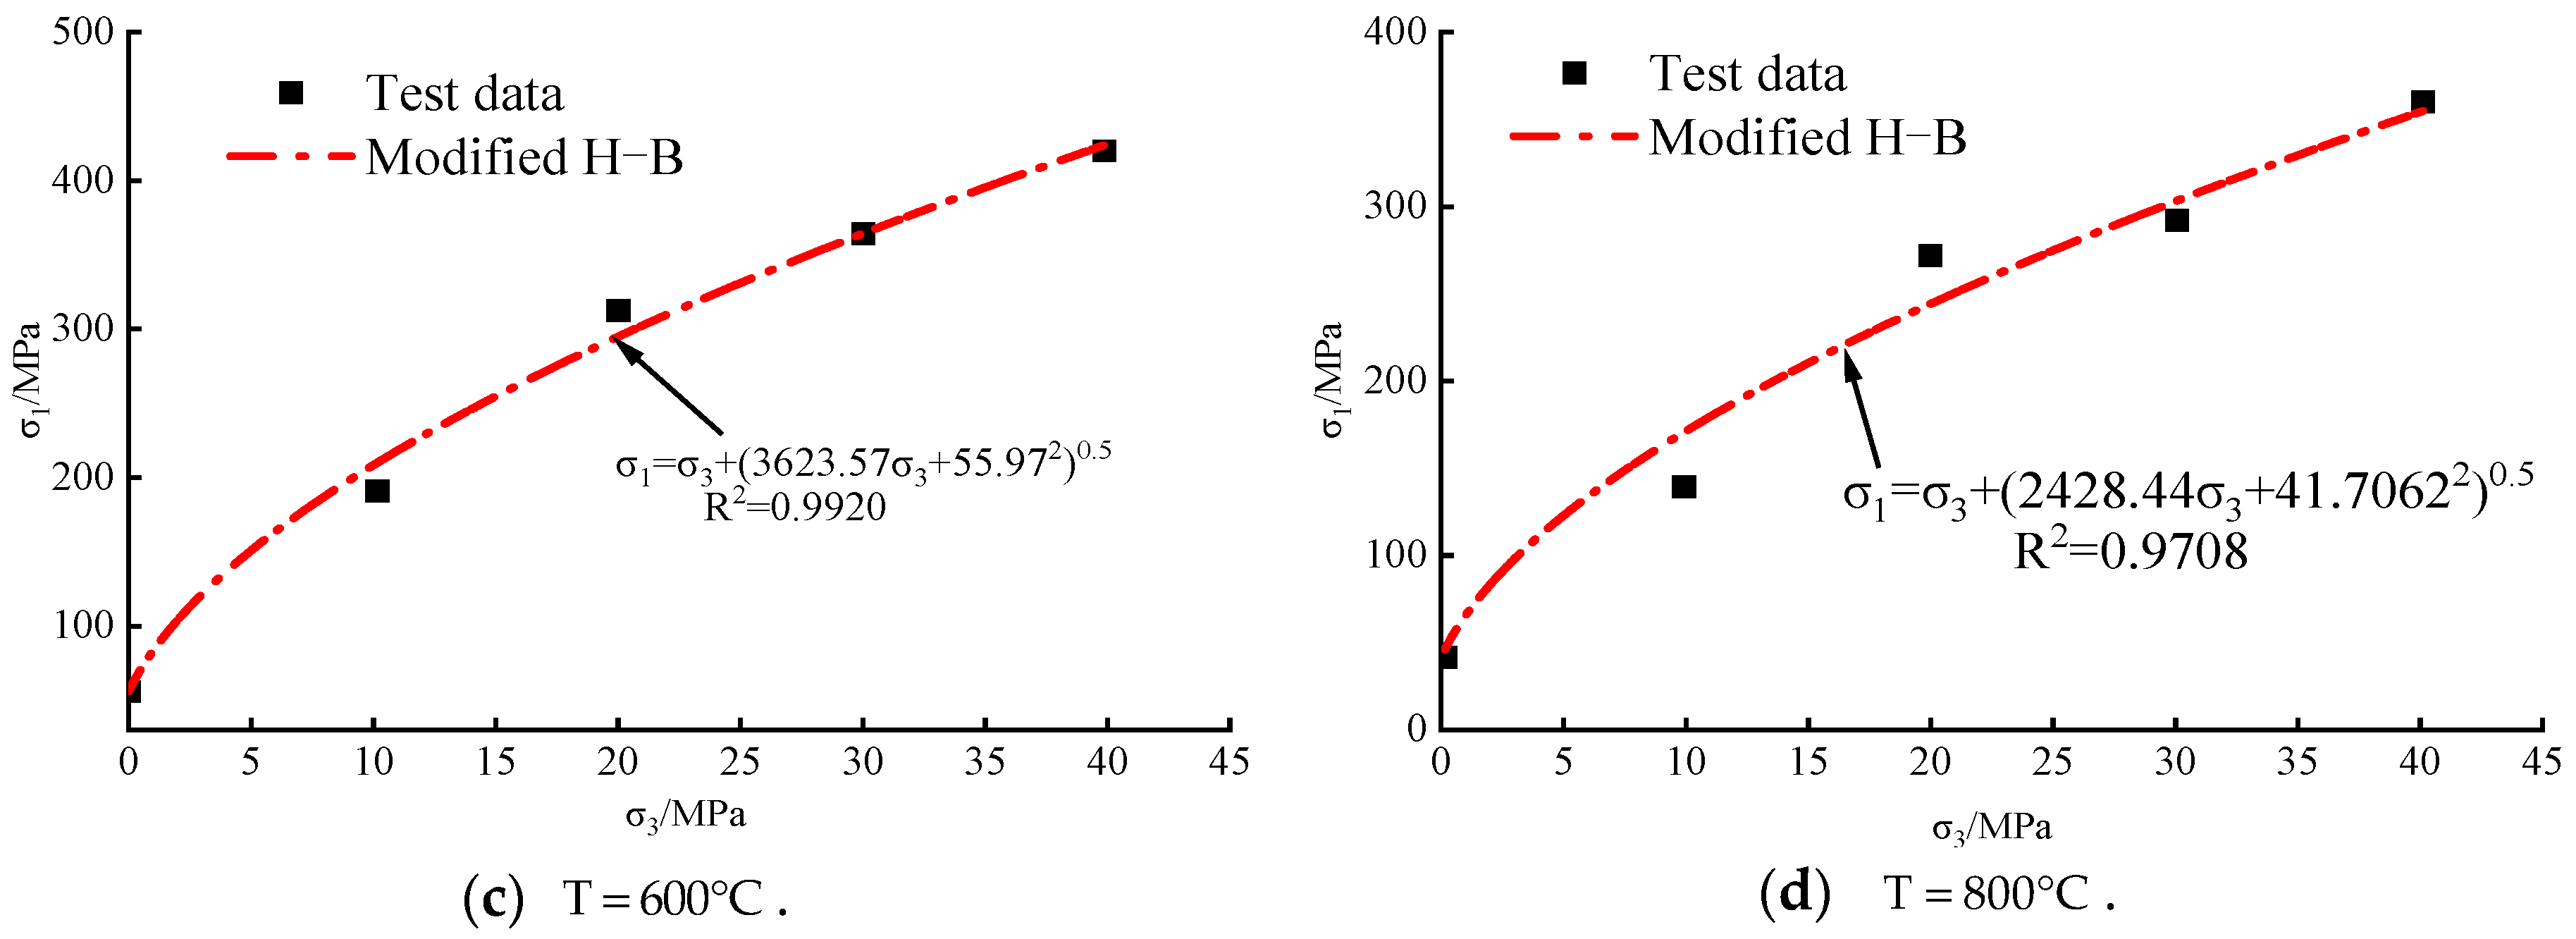
- Considering the effect of the presence of initial cracks in the rock on the strength of the rock, the H–B strength criterion is modified to solve the problem of the predicted strength value of H–B still being high under high confining pressures. The rationality of the revised strength criterion is verified by selecting rock sample data at normal temperatures and at high temperatures.
- (2)
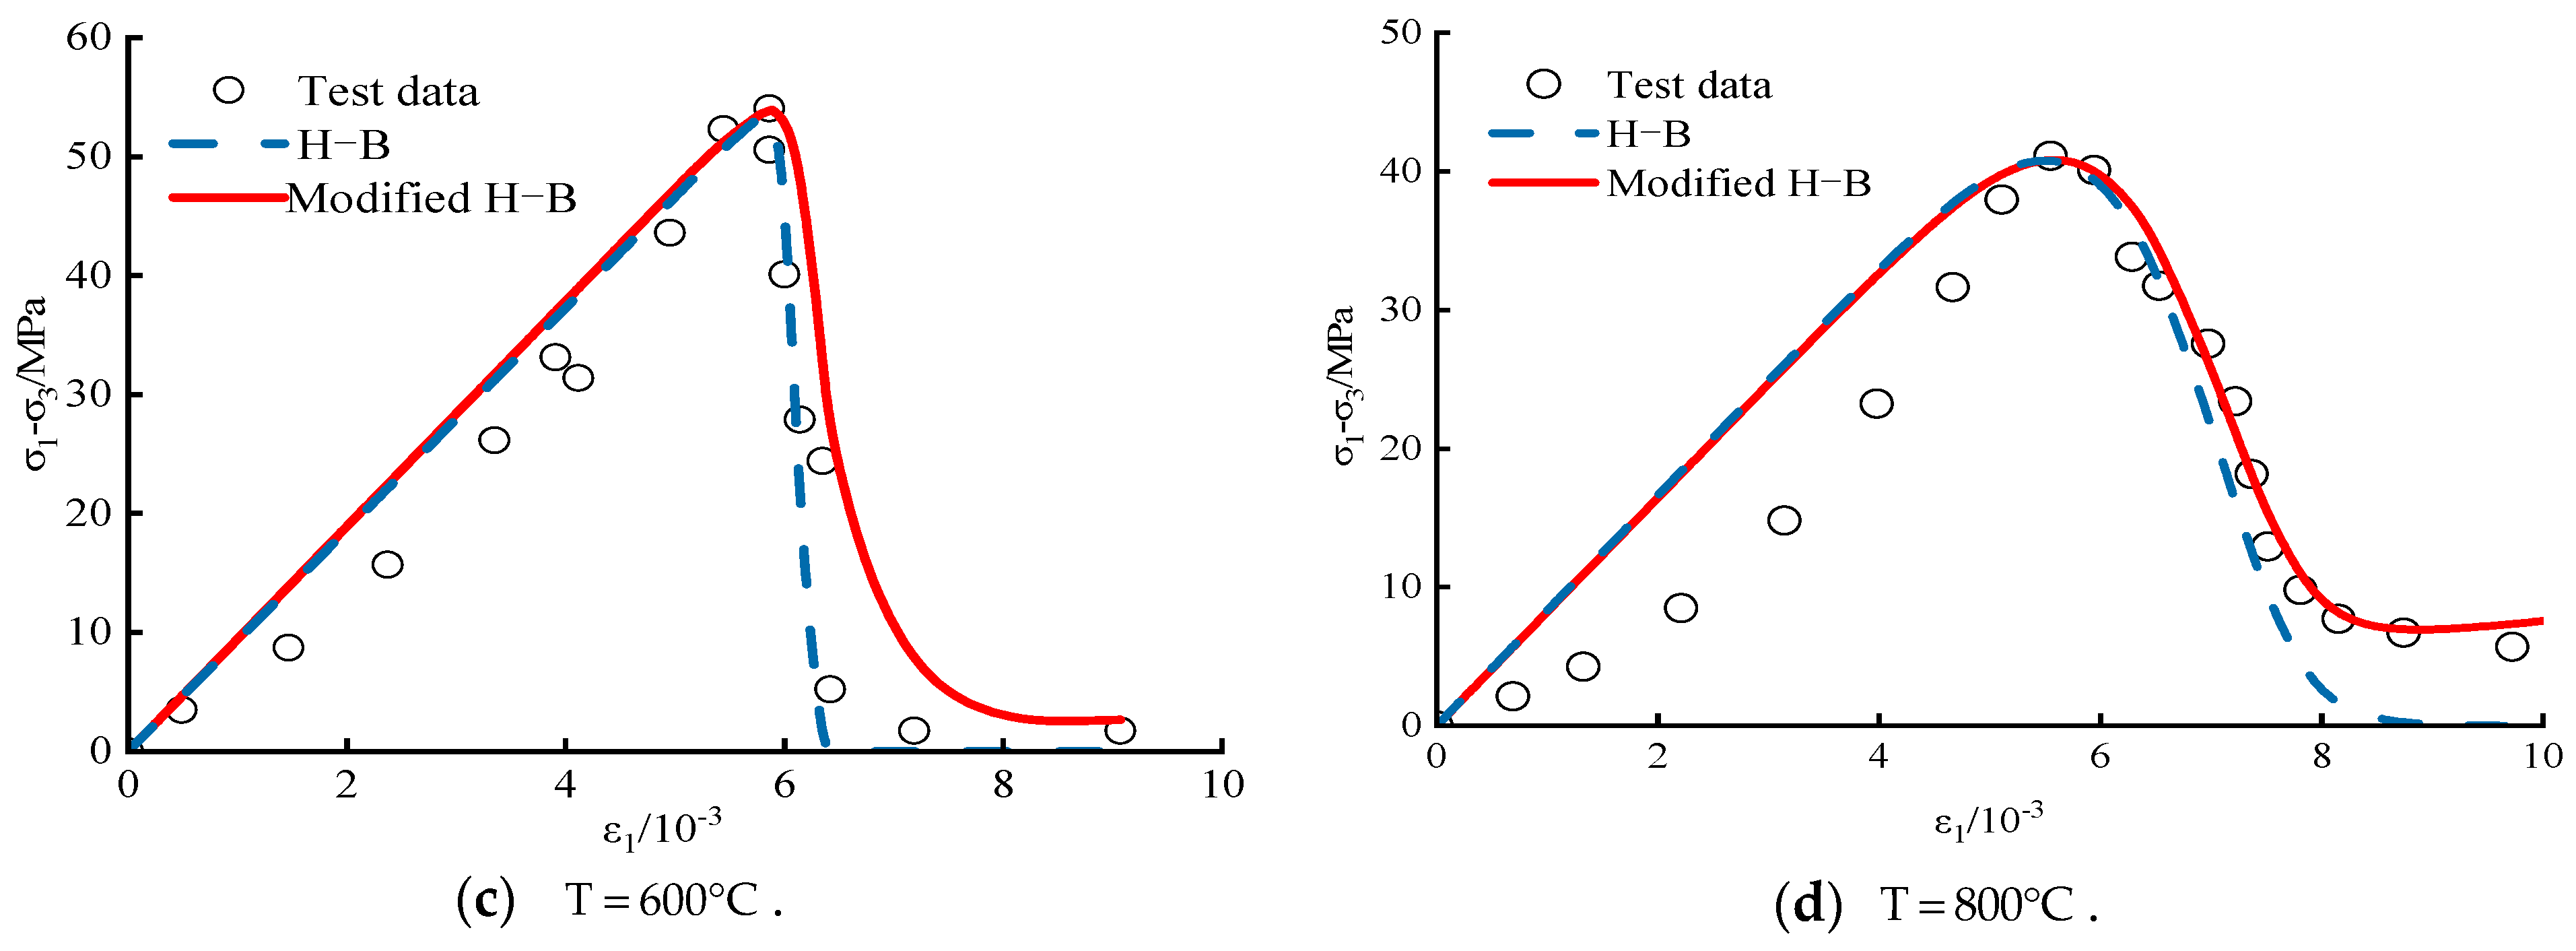
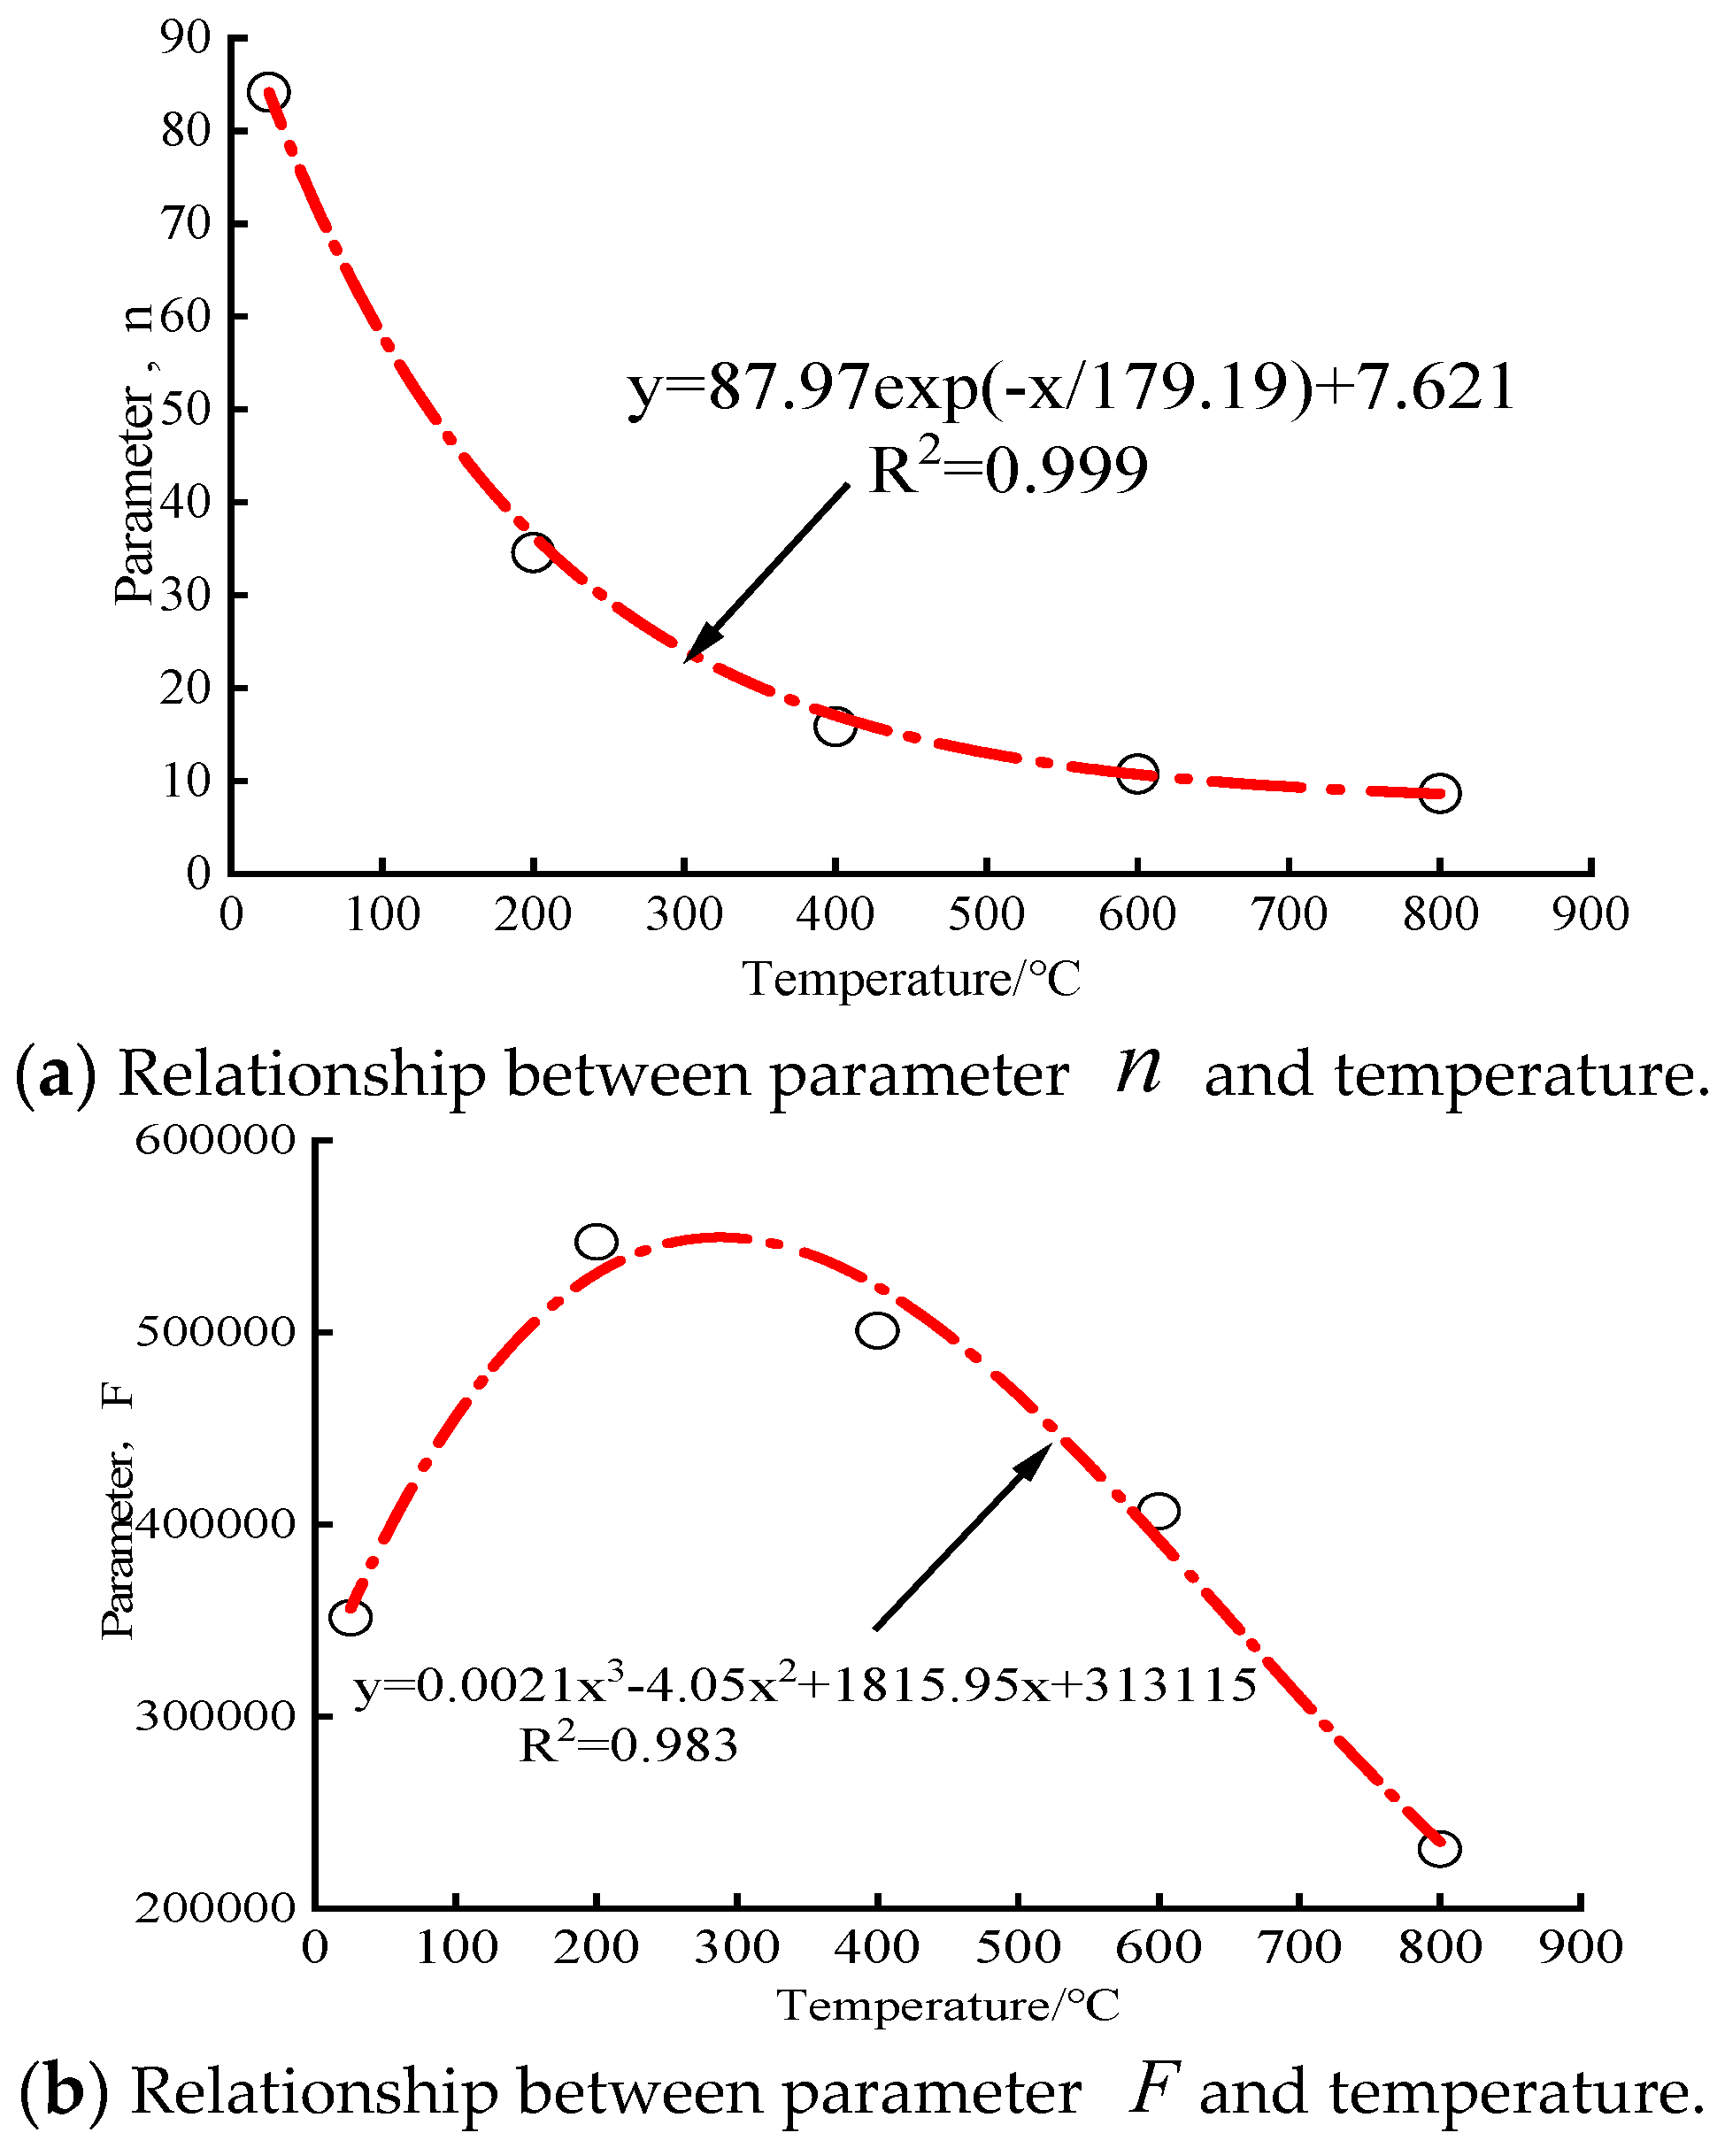
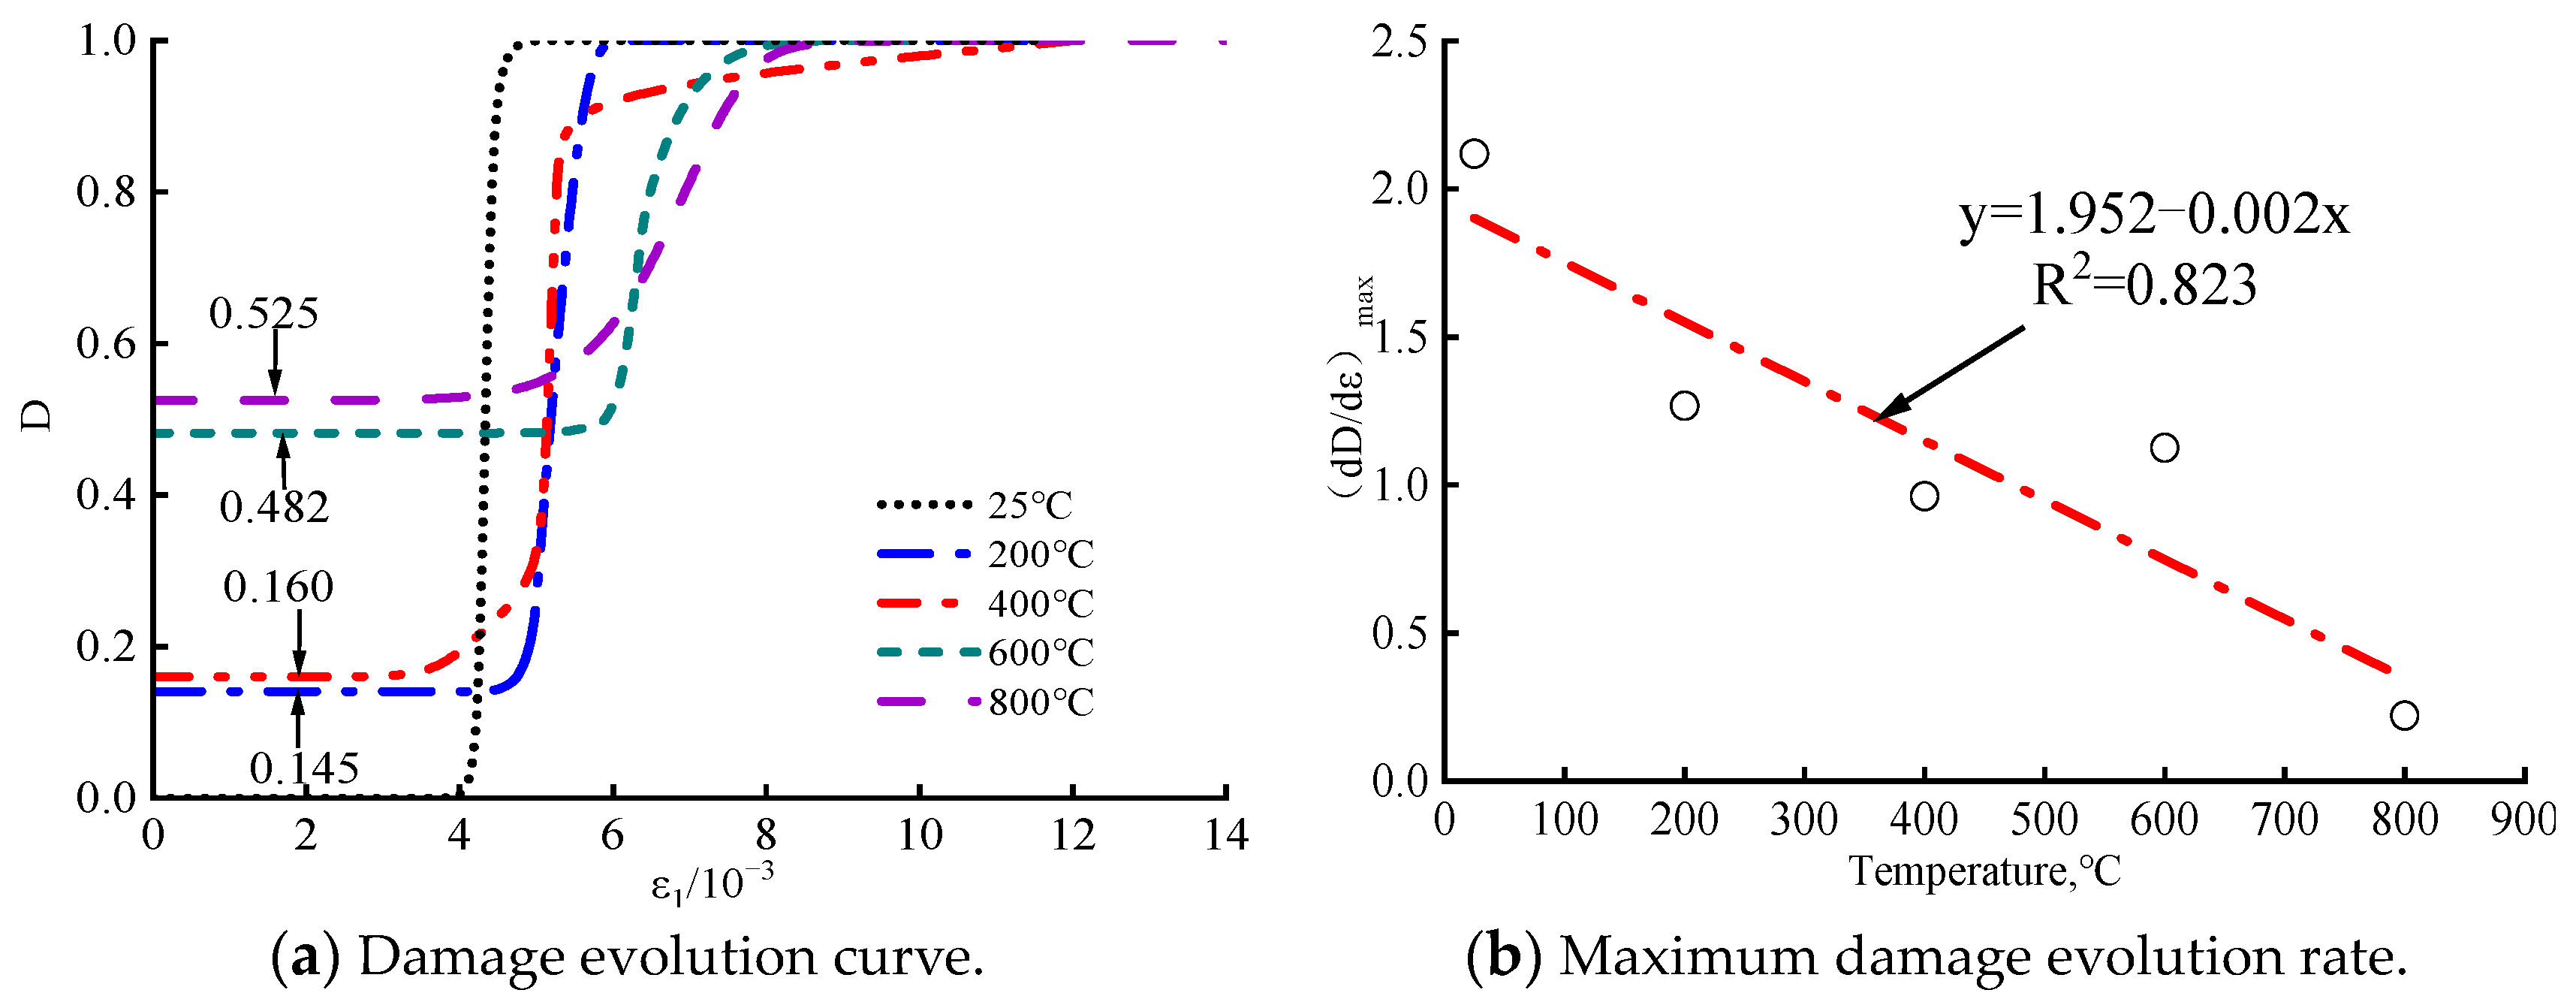
- Based on the statistical damage theory, it is assumed that rock strength follows the Weibull distribution, combined with the revised H–B strength criterion and considering the damage correction coefficient related to residual strength. A statistical thermal damage constitutive model of rock under the condition of high temperatures and high confining pressures is established, and the physical significance of the model distribution parameters and their patterns of change, as well as the damage evolution of the rocks, are analyzed. By comparing the model in this paper with the model established by the H–B criterion, the model established in this paper is more consistent with the experimental data and has good applicability, which can provide a reference for the establishment of rock constitutive models under high temperatures and confining pressures.
- (3)
- The damage correction coefficient selected in this paper can better characterize the residual strength values of rocks and provide reference for the prediction of residual strength values of rocks, but there is still an error between the damage modification coefficients and the actual residual strength values, which needs to be further discussed and improved. In addition, this article only focuses on the investigation of the intrinsic model of the rock under high temperatures and high confining pressures, and the modeling of deep rock under high hydrostatic pressures and high perturbation conditions needs to be further considered in the future.
Author Contributions
Funding
Institutional Review Board Statement
Informed Consent Statement
Data Availability Statement
Conflicts of Interest
References
- Wang, Y.J.; Liang, W.; Du, Z.Q.; Wang, L.; Zhang, T.; Tong, Z. Exploration of the application of drill bits in the formation of flint dolomite in the D05 well of Xiong’an New Area. Drill. Eng. 2023, 50, 142–148. [Google Scholar]
- Olasolo, P.; Juárez, M.; Morales, M.; D’amico, S.; Liarte, I. Enhanced geothermal systems (EGS): A review. Renew. Sustain. Energy Rev. 2016, 56, 133–144. [Google Scholar] [CrossRef]
- Wu, A.Q.; Zhu, J.B. Summary of research on mechanical properties and in-situ stress testing of deep rock engineering. J. Yangtze River Sci. Res. Inst. 2014, 31, 43–50. [Google Scholar]
- Zhang, X.; He, M.; Wang, F.; Li, G.; Xu, S.; Tao, Z. Study on the large deformation characteristics and disaster mechanism of a thin-layer soft-rock tunnel. Adv. Civ. Eng. 2020, 2020, 8826337. [Google Scholar] [CrossRef]
- Li, B.; Xu, M.G.; Liu, Y.Z.; Wang, P. Improvement of Hoek Brown strength criterion for intact rocks under triaxial conditions. J. Min. Saf. Eng. 2015, 32, 1010–1016. [Google Scholar]
- Guo, J.Q.; Jiang, J.G.; Liu, X.R.; Chen, J.X.; Lu, X.F.; Yang, Q.T. Correction of D-P strength criterion based on elastic strain energy. China Civ. Eng. J. 2021, 54, 110–116. [Google Scholar]
- Guo, J.; Liu, X.R.; Huang, W.F.; Luo, X.; Niu, L. Discussion of Mohr-Coulomb strength criterion based on elastic strain energy. J. Tongji Univ. Nat. Sci. Ed. 2018, 46, 1168–1174. [Google Scholar] [CrossRef]
- Hu, X.; Qi, Y.; Hu, H.; Lei, G.; Xie, N.; Gong, X. A micromechanical-based failure criterion for rocks after high-temperature treatment. Eng. Fract. Mech. 2023, 284, 109275. [Google Scholar] [CrossRef]
- Pan, Y.W.; Huang, D.W. Statistical damage constitutive model for rocks considering compaction processes and residual strength. Min. Technol. 2021, 21, 38–42. [Google Scholar] [CrossRef]
- Li, S.N.; Xiao, J.; Li, Y.; Liu, X.; Liang, Q.; Chang, J.; Liu, J. Research on rock damage constitutive model based on microscopic crack propagation evolution. Chin. J. Rock Mech. Eng. 2023, 42, 640–648. [Google Scholar] [CrossRef]
- Zhang, C.; Yang, C.Q.; Zhu, D.P.; Yang, Z.W.; Xia, Z.R. Applicability analysis of rock deformation statistical damage simulation considering strain rate changes. Chin. J. Appl. Mech. 2023, 40, 1–10. [Google Scholar]
- Ding, S.M.; Zhao, Z.H.; Wang, N.N. Classification and review of rock strength theory. Water Resour. Archit. Eng. 2017, 15, 95–102. [Google Scholar] [CrossRef]
- Zhang, C.; Yu, J.; Bai, Y.; Cao, W.G.; Zhang, S.; Guo, Z.G. A Statistical damage constitutive model for rock embrittlement transformation based on strength theory. Chin. J. Rock Mech. Eng. 2023, 42, 307–310. [Google Scholar]
- Wang, Z.; Qi, C.; Ban, L.; Yu, H.; Wang, H.; Fu, Z. Modified Hoek–Brown failure criterion for anisotropic intact rock under high confining pressures. Bull. Eng. Geol. Environ. 2022, 81, 333. [Google Scholar] [CrossRef]
- Ismael, M.; Konietzky, H. Constitutive model for inherent anisotropic rocks: Ubiquitous joint model based on the Hoek-Brown failure criterion. Comput. Geotech. 2019, 105, 99–109. [Google Scholar] [CrossRef]
- Yang, Y.; Gao, F.; Lai, Y. Modified Hoek-Brown criterion for nonlinear strength of frozen soil. Cold Reg. Sci. Technol. 2013, 86, 98–103. [Google Scholar] [CrossRef]
- Griffiths, L.; Heap, M.; Baud, P.; Schmittbuhl, J. Quantification of microcrack characteristics and implications for stiffness and strength of granite. Int. J. Rock Mech. Min. Sci. 2017, 100, 138–150. [Google Scholar] [CrossRef]
- Brown, E.T.; Hoek, E. Underground Excavations in Rock; CRC Press: Boca Raton, FL, USA, 1980. [Google Scholar]
- Hoek, E.; Kaiser, P.K.; Bawden, W.F. Support of Underground Excavations in Hard Rock AA BALKEMA; Rotterdam/Brookfield: Rotterdam, The Netherlands, 1995. [Google Scholar]
- Hoek, E.; Kaiser, P.K.; Bawden, W.F. Support of Underground Excavations in Hard Rock; CRC Press: Boca Raton, FL, USA, 2000. [Google Scholar]
- Hoek, E.; Carranza, T.C.; Corkum, B. Hoek-Brown failure criterion-2002 edition. Proc. NARMS-Tac 2002, 1, 267–273. [Google Scholar]
- Hoek, E.; Brown, E.T. The Hoek–Brown failure criterion and GSI—2018 edition. J. Rock Mech. Geotech. Eng. 2019, 11, 445–463. [Google Scholar] [CrossRef]
- Nuismer, R.J. An energy release rate criterion for mixed mode fracture. Int. J. Fract. 1975, 11, 245–250. [Google Scholar] [CrossRef]
- Sun, C.; Jin, C.; Wang, L.; Ao, Y.; Zhang, J. Creep damage characteristics and local fracture time effects of deep granite. Bull. Eng. Geol. Environ. 2022, 81, 79. [Google Scholar] [CrossRef]
- Zhang, C.Q.; Feng, X.-T.; Zhou, H.; Qiu, S.L.; Wu, W.P. Case histories of four extremely intense rockbursts in deep tunnels. Rock Mech. Rock Eng. 2012, 45, 275–288. [Google Scholar] [CrossRef]
- Huang, X. Time-Dependent behavior of Jinping deep marble taking into account the coupling between excavation damage and high pore pressure. Rock Mech. Rock Eng. 2022, 2022, 4893–4912. [Google Scholar] [CrossRef]
- Zhao, J.; Feng, X.T.; Zhang, X.; Yang, C.; Zhou, Y. Time-dependent behavior and modeling of Jinping marble under true triaxial compression. Int. J. Rock Mech. Min. Sci. 2018, 110, 218–230. [Google Scholar] [CrossRef]
- Rao, J.; Tao, Y.; Xiong, P.; Nie, C.; Peng, H.; Xue, Y.; Xi, Z. Research on the large deformation prediction model and supporting measures of soft rock tunnel. Adv. Civ. Eng. 2020, 2020, 6630546. [Google Scholar] [CrossRef]
- Xu, X.L.; Gao, F.; Zhang, Z.Z. The effect of confining pressure after high temperature on the deformation and strength characteristics of granite. Chin. J. Geotech. Eng. 2014, 36, 2246–2252. [Google Scholar] [CrossRef]
- Chen, Y.; Lin, H.; Wang, Y.; Xie, S.; Zhao, Y.; Yong, W. Statistical damage constitutive model based on the Hoek–Brown criterion. Arch. Civ. Mech. Eng. 2021, 21, 117. [Google Scholar] [CrossRef]
- Walton, G.; Hedayat, A.; Kim, E.; Labrie, D. Post-yield strength and dilatancy evolution across the brittle–ductile transition in indiana limestone. Rock Mech. Rock Eng. 2017, 50, 1691–1710. [Google Scholar] [CrossRef]
- Xu, S.L.; Wu, W.; Wang, G.Y.; Zhang, Q.H.; Xu, J.P. Study on the whole process of triaxial compression of marble with equal perimeter pressure I: Experiments on the whole process of triaxial compression and the whole process of unloading of perimeter pressure before and after peaks. Chin. J. Rock Mech. Ang Eng. 2001, 20, 763–767. [Google Scholar]
- Zhang, H.M.; Yang, G.S. Research on damage model of rock under coupling action of freeze-thaw and load. China J. Rock Mech. Eng. 2010, 29, 471–476. [Google Scholar]
- Ju, Y.; Xie, H.P. The applicable conditions for defining damage based on the strain equivalence hypothesis. Chin. J. Appl. Mech. 1998, 45–51, 144–145. [Google Scholar]
- Xu, Y.H. Research on Statistical Damage Constitutive Model of Rock under Thermodynamic Coupling Effect; Nantong University: Nantong, China, 2016. [Google Scholar]
- Cao, R.L.; He, S.H.; Wei, J.; Wang, F. Research on statistical constitutive model of rock damage softening based on residual strength correction. Rock Soil Mech. 2013, 34, 1652–1660. [Google Scholar] [CrossRef]
- Yu, T. Statistical damage constitutive model of quasi-brittle materials. J. Aerosp. Eng. 2009, 22, 95–100. [Google Scholar] [CrossRef]
- Ting, C.L.; Lian, X.L.; Shi, L.Z.; Jie, C.S. Development and application of a statistical constitutive model of damaged rock affected by the load-bearing capacity of damaged elements. J. Zhejiang Univ. SCI. A 2015, 16, 644–655. [Google Scholar] [CrossRef]
- Wang, J.; Song, Z.; Zhao, B.; Liu, X.; Liu, J.; Lai, J. A study on the mechanical behavior and statistical damage constitutive model of sandstone. Arab. J. Sci. Eng. 2018, 43, 5179–5192. [Google Scholar] [CrossRef]
- Chen, J.T.; Feng, X.T. Constitutive model of hard rock under high ground stress. Rock Soil Mech. 2007, 2007, 2271–2278. [Google Scholar]
- Zhang, C.; Cao, W.G.; Zhao, H.; He, M. Statistical damage simulation method for rock stress-strain curves considering confining pressure effects and brittle strength drop. Chin. J. Geotech. Eng. 2022, 44, 936–944. [Google Scholar] [CrossRef]
- Chen, Y.; Zhang, L.; Xie, H.; Liu, J.; Liu, H.; Yang, B. Damage ratio based on statistical damage constitutive model for rock. Math. Probl. Eng. 2019, 2019, 3065414. [Google Scholar] [CrossRef]
- Chen, S.; Qiao, C.; Ye, Q.; Khan, M.U. Comparative study on three-dimensional statistical damage constitutive modified model of rock based on power function and Weibull distribution. Environ. Earth Sci. 2018, 77, 108. [Google Scholar] [CrossRef]
- Zhou, S.-W.; Xia, C.C.; Zhao, H.-B.; Mei, S.-H.; Zhou, Y. Statistical damage constitutive model for rocks subjected to cyclic stress and cyclic temperature. Acta Geophys. 2017, 65, 893–906. [Google Scholar] [CrossRef]
- Liu, W.; Dan, Z.; Jia, Y.; Zhu, X. On the statistical damage constitutive model and damage evolution of hard rock at high-temperature. Geotech. Geol. Eng. 2020, 38, 4307–4318. [Google Scholar] [CrossRef]
- Chen, Z.; Sha, S.; Xu, L.; Quan, J.; Rong, G.; Jiang, M. Damage Evaluation and statistic constitutive model of high-temperature granites subjected to liquid nitrogen cold shock. Rock Mech. Rock Eng. 2022, 55, 2299–2321. [Google Scholar] [CrossRef]
- Luo, J.; He, J. Constitutive model and fracture failure of sandstone damage under high temperature–cyclic stress. Materials. 2022, 15, 4903. [Google Scholar] [CrossRef] [PubMed]
- Wang, S.; Liao, H.; Chen, Y.; Fernández-Steeger, T.M.; Du, X.; Xiong, M.; Liao, S. Damage evolution constitutive behavior of rock in thermo-mechanical coupling processes. Materials. 2021, 14, 7840. [Google Scholar] [CrossRef]


| Rock Type | Confining Pressure/MPa | Peak Strength/MPa | Internal Friction Angle/° | φ | ψT | mσu/MPa | R2 |
|---|---|---|---|---|---|---|---|
| Granite | 0 | 116.852 | 47.36 | 1.08 | 8.493 | 2808.47 | 0.9571 |
| 10 | 208.038 | ||||||
| 20 | 301.143 | ||||||
| 30 | 370.961 | ||||||
| 40 | 364.571 | ||||||
| Limestone | 0 | 65.525 | 34.56 | 0.69 | 2.687 | 352.13 | 0.9738 |
| 2 | 77.088 | ||||||
| 4 | 83.512 | ||||||
| 5 | 85.653 | ||||||
| 8 | 96.360 | ||||||
| 10 | 102.784 | ||||||
| 15 | 112.206 | ||||||
| 20 | 128.908 | ||||||
| 30 | 144.754 | ||||||
| Marble | 0 | 53.115 | 46.99 | 1.07 | 7.842 | 958.98 | 0.9962 |
| 5 | 126.738 | ||||||
| 10 | 173.766 | ||||||
| 20 | 245.427 | ||||||
| 30 | 303.524 | ||||||
| 54 | 417.883 | ||||||
| Sandstone | 0 | 55.69 | 26.39 | 0.50 | 3.262 | 583.06 | 0.9983 |
| 5 | 84.57 | ||||||
| 10 | 107.37 | ||||||
| 15 | 125.43 | ||||||
| 25 | 156.80 | ||||||
| 35 | 186.43 |
| Confining Pressure /MPa | Peak Strength /MPa | Peak Strain /10−3 | Residual Strength /MPa | Residual Strain /10−3 | δ | λ |
|---|---|---|---|---|---|---|
| 0 | 116.852 | 4.147 | 7.082 | 7.037 | 0.940 | 0.865 |
| 10 | 208.038 | 6.805 | 17.210 | 8.200 | 0.958 | 0.910 |
| 20 | 301.143 | 7.557 | 108.000 | 10.096 | 0.801 | 0.877 |
| 30 | 370.961 | 9.458 | 107.714 | 14.111 | 0.842 | 0.867 |
| 40 | 364.571 | 11.394 | 144.000 | 18.546 | 0.704 | 0.646 |
| Temperature/°C | Confining Pressure/MPa | Peak Strength/MPa |
|---|---|---|
| 200 | 0 | 118.800 |
| 10 | 197.785 | |
| 20 | 276.863 | |
| 30 | 427.773 | |
| 40 | 450.177 | |
| 400 | 0 | 98.548 |
| 10 | 231.120 | |
| 20 | 335.685 | |
| 30 | 376.763 | |
| 40 | 449.585 | |
| 600 | 0 | 55.974 |
| 10 | 191.372 | |
| 20 | 312.832 | |
| 30 | 364.602 | |
| 40 | 420.354 | |
| 800 | 0 | 41.706 |
| 10 | 139.573 | |
| 20 | 272.275 | |
| 30 | 292.180 | |
| 40 | 360.190 |
| Temperature/°C | Peak Strength/MPa | Residual Strength/MPa | δ | Thermal Damage Value | λ |
|---|---|---|---|---|---|
| 200 | 118.800 | 7.412 | 0.968 | 0.086 | 0.820 |
| 400 | 98.529 | 11.76 | 0.938 | 0.120 | 0.676 |
| 600 | 54.070 | 1.744 | 0.984 | 0.656 | 0.751 |
| 800 | 41.132 | 7.724 | 0.901 | 0.724 | 0.786 |
Disclaimer/Publisher’s Note: The statements, opinions and data contained in all publications are solely those of the individual author(s) and contributor(s) and not of MDPI and/or the editor(s). MDPI and/or the editor(s) disclaim responsibility for any injury to people or property resulting from any ideas, methods, instructions or products referred to in the content. |
© 2024 by the authors. Licensee MDPI, Basel, Switzerland. This article is an open access article distributed under the terms and conditions of the Creative Commons Attribution (CC BY) license (https://creativecommons.org/licenses/by/4.0/).
Share and Cite
Lu, T.; Wu, H.; Yin, S.; Xu, X. Study of Rock Damage Constitutive Model Considering Temperature Effect Based on Weibull Distribution. Appl. Sci. 2024, 14, 3766. https://doi.org/10.3390/app14093766
Lu T, Wu H, Yin S, Xu X. Study of Rock Damage Constitutive Model Considering Temperature Effect Based on Weibull Distribution. Applied Sciences. 2024; 14(9):3766. https://doi.org/10.3390/app14093766
Chicago/Turabian StyleLu, Tianci, Hao Wu, Shuiming Yin, and Xiaoli Xu. 2024. "Study of Rock Damage Constitutive Model Considering Temperature Effect Based on Weibull Distribution" Applied Sciences 14, no. 9: 3766. https://doi.org/10.3390/app14093766
APA StyleLu, T., Wu, H., Yin, S., & Xu, X. (2024). Study of Rock Damage Constitutive Model Considering Temperature Effect Based on Weibull Distribution. Applied Sciences, 14(9), 3766. https://doi.org/10.3390/app14093766