
Multi-Session Electrocardiogram–Electromyogram Database for User Recognition

 ,
,  ,
,  ,
, 

Abstract
1. Introduction
2. Related Work
2.1. Benchmarking ECG DBs
2.2. Benchmarking EMG DBs
2.3. Benchmarking Multi-Biosignal DBs
3. Measured Method of Multi-Session Biosignal Benchmarking DBs
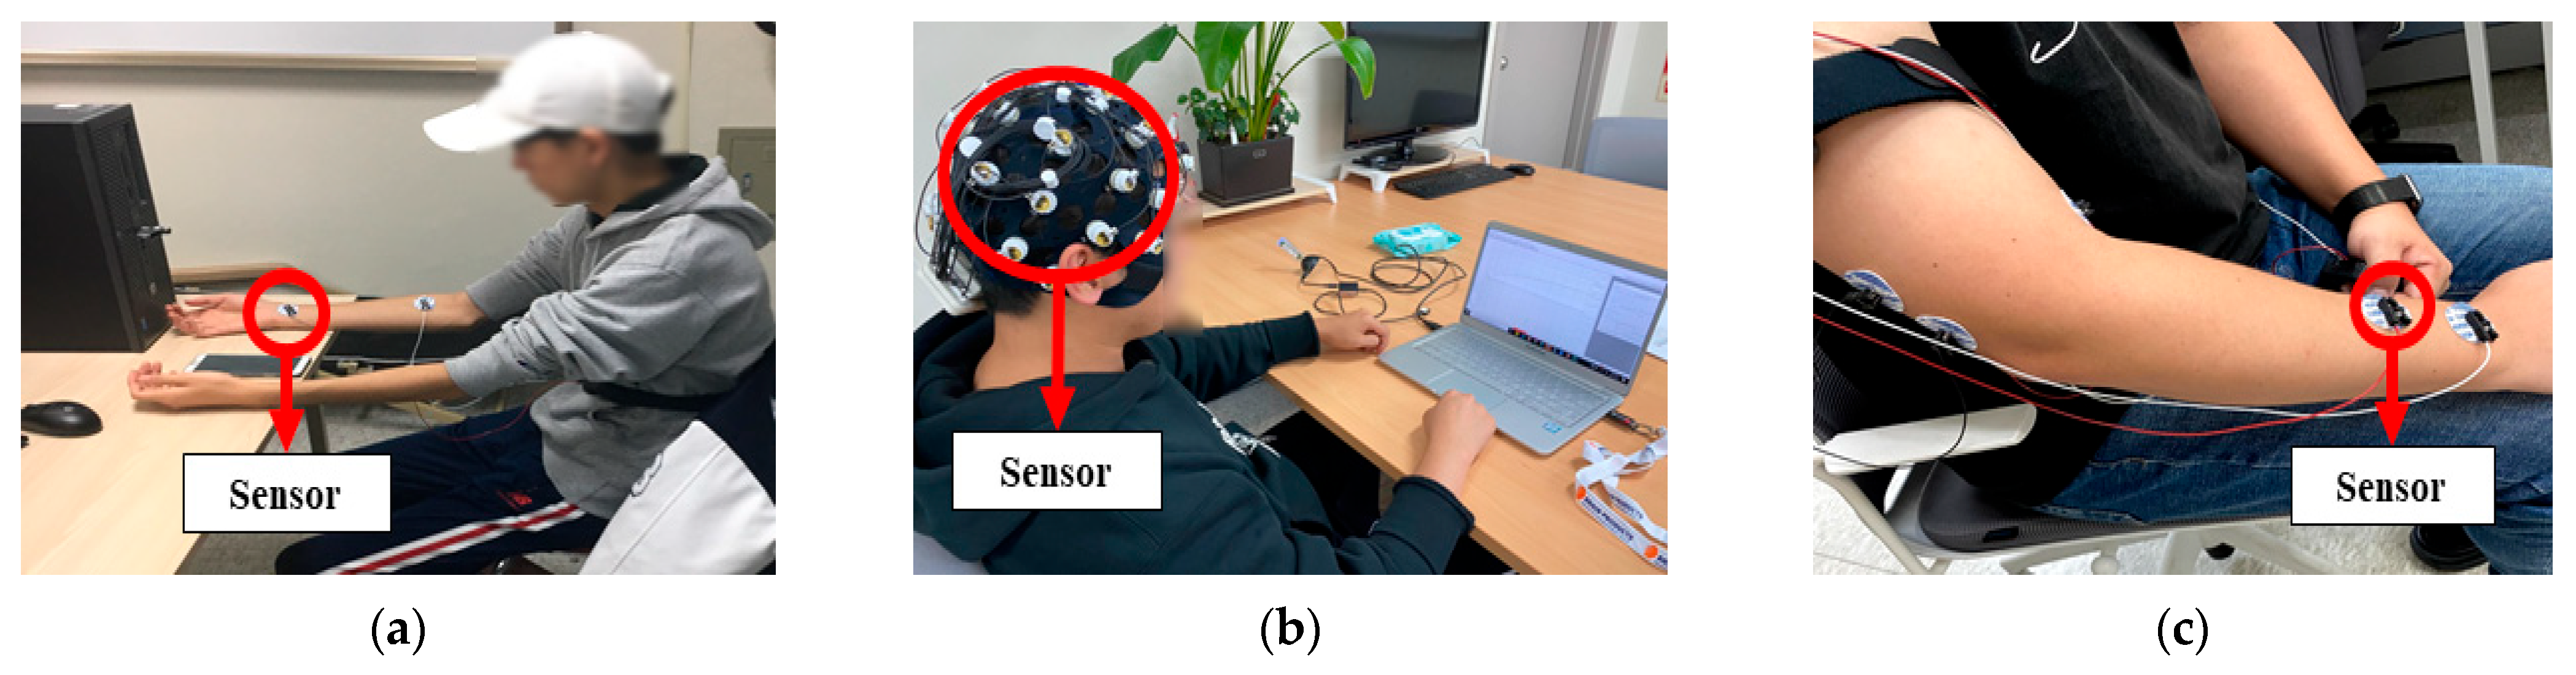
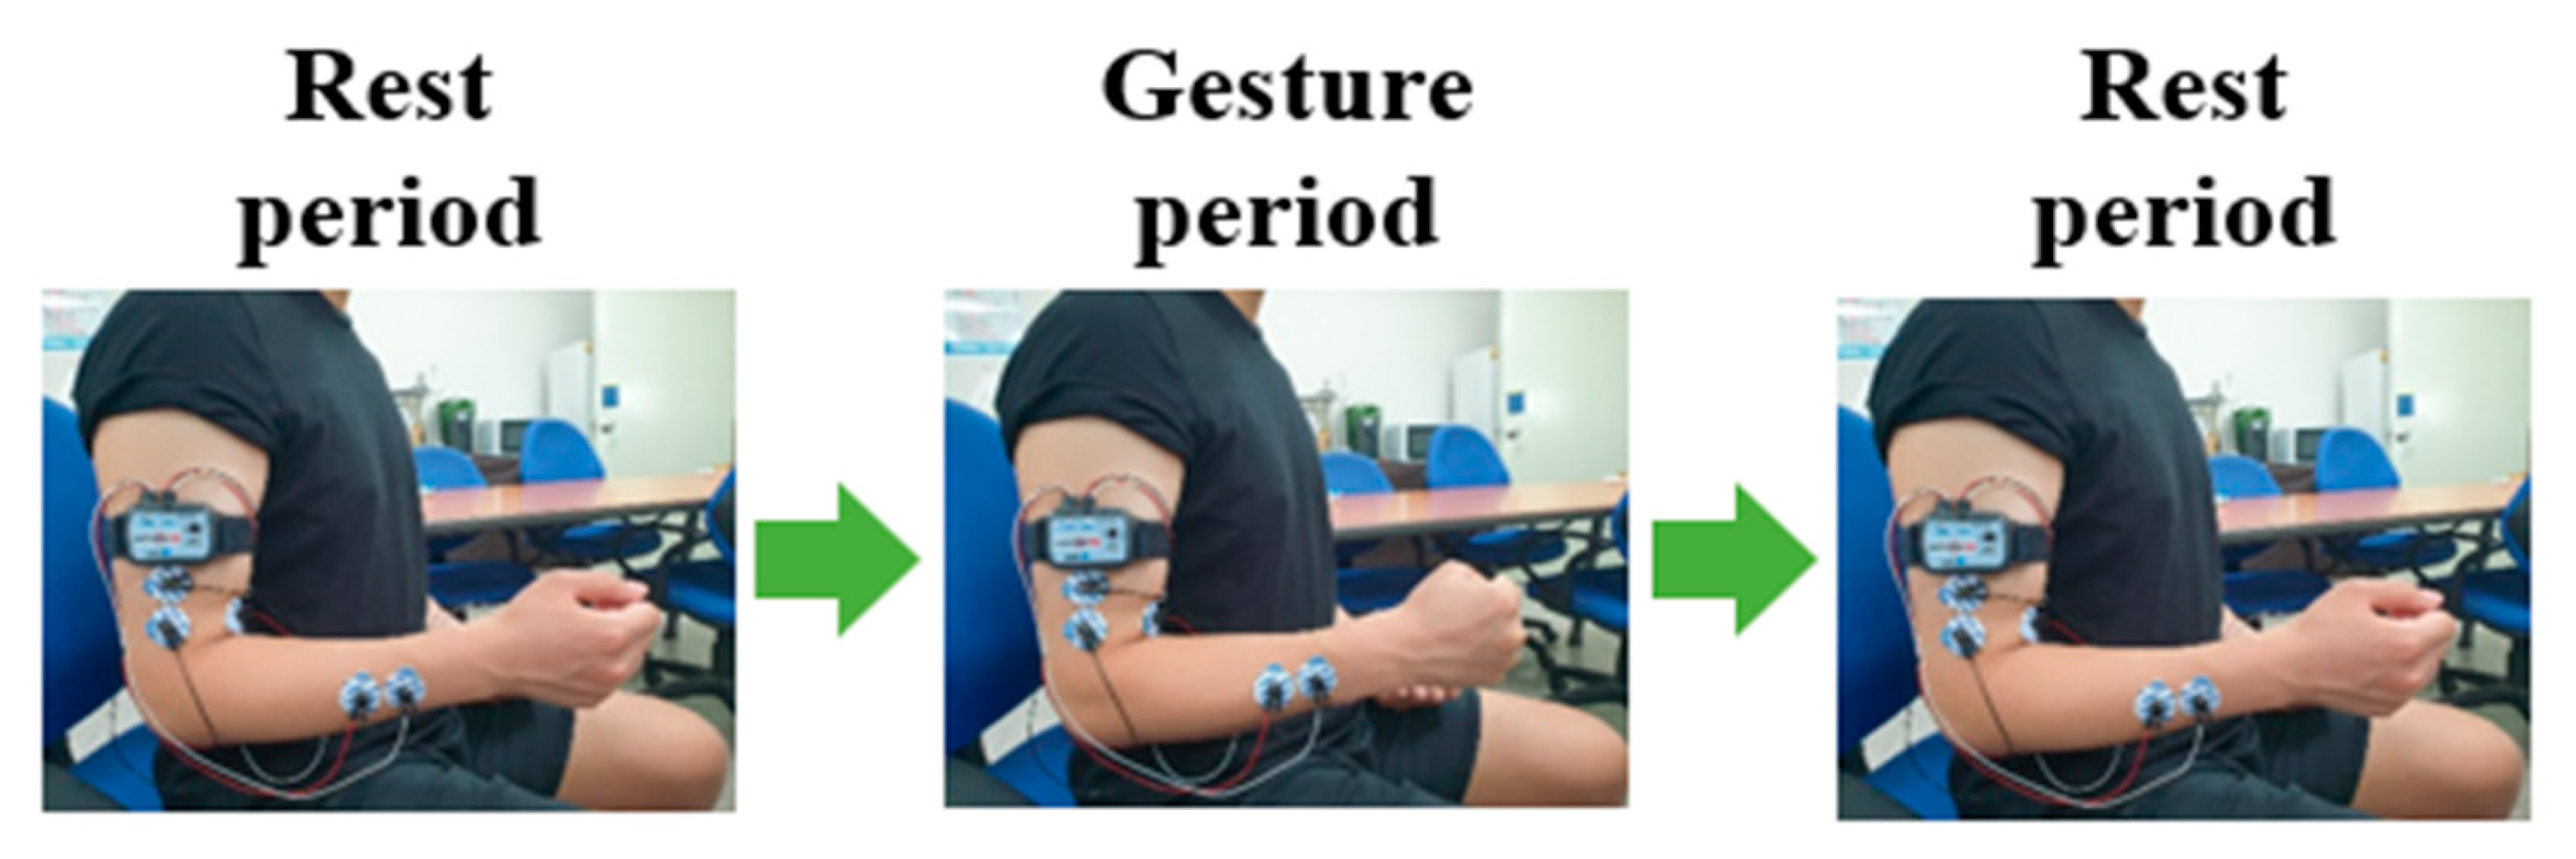
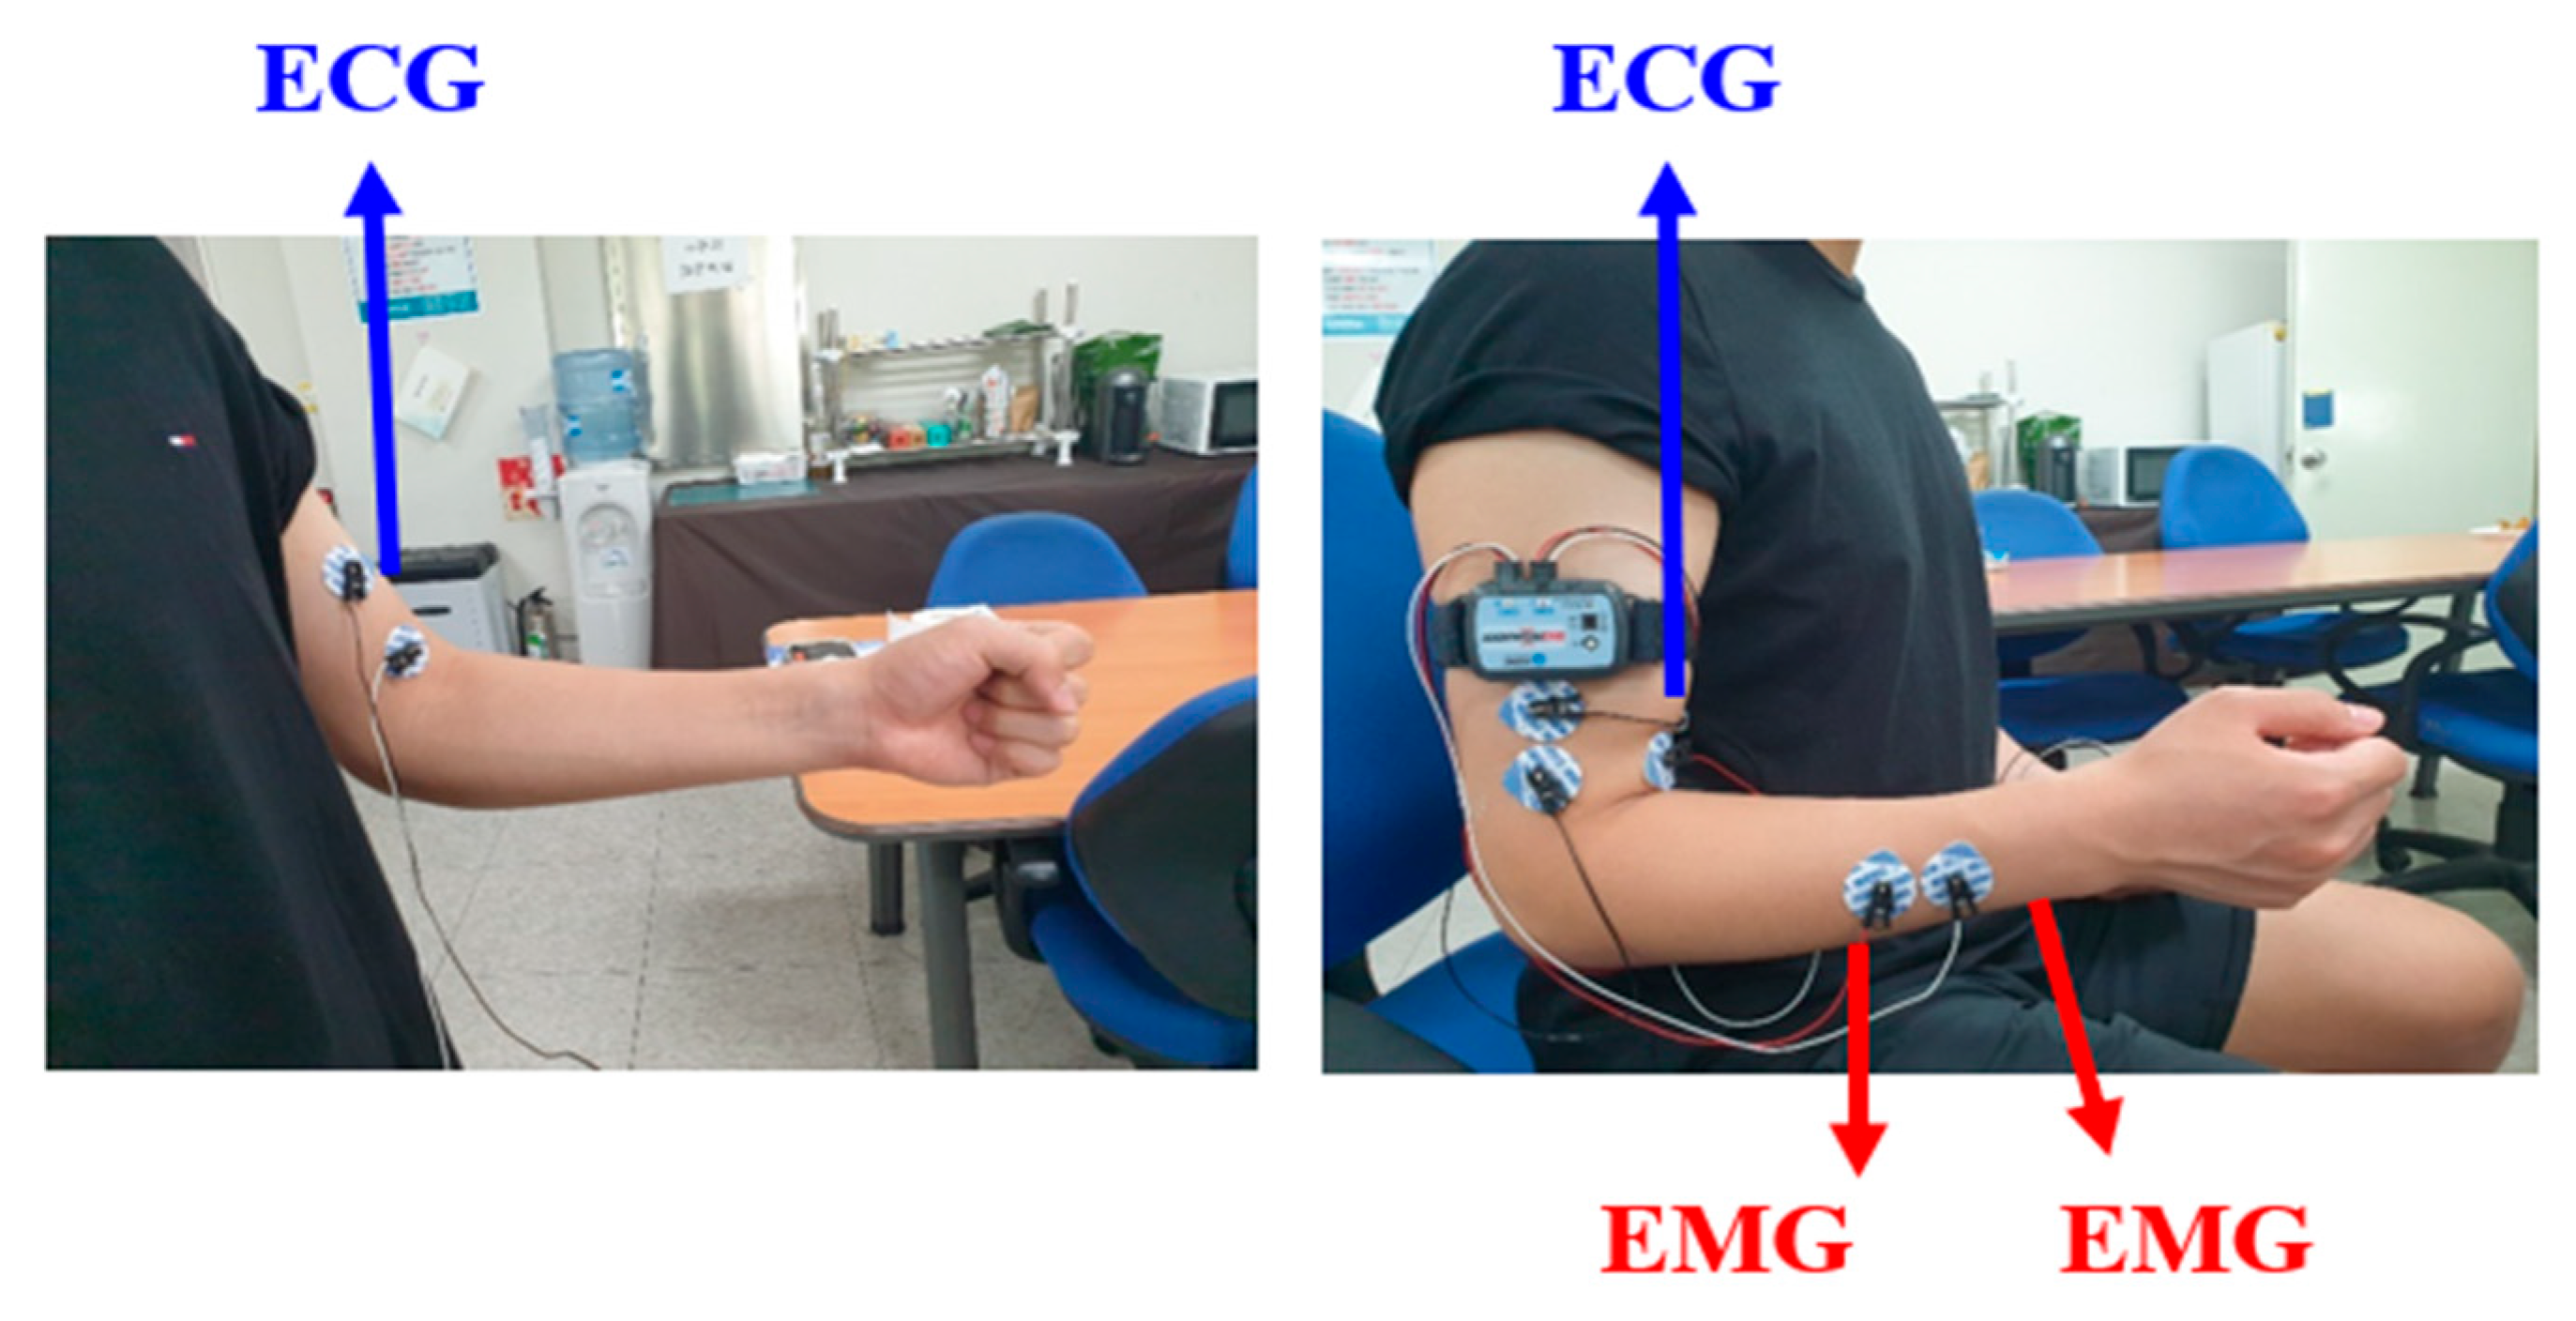
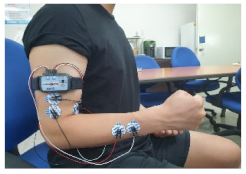
3.1. Multi-Biosignal Measurement Method
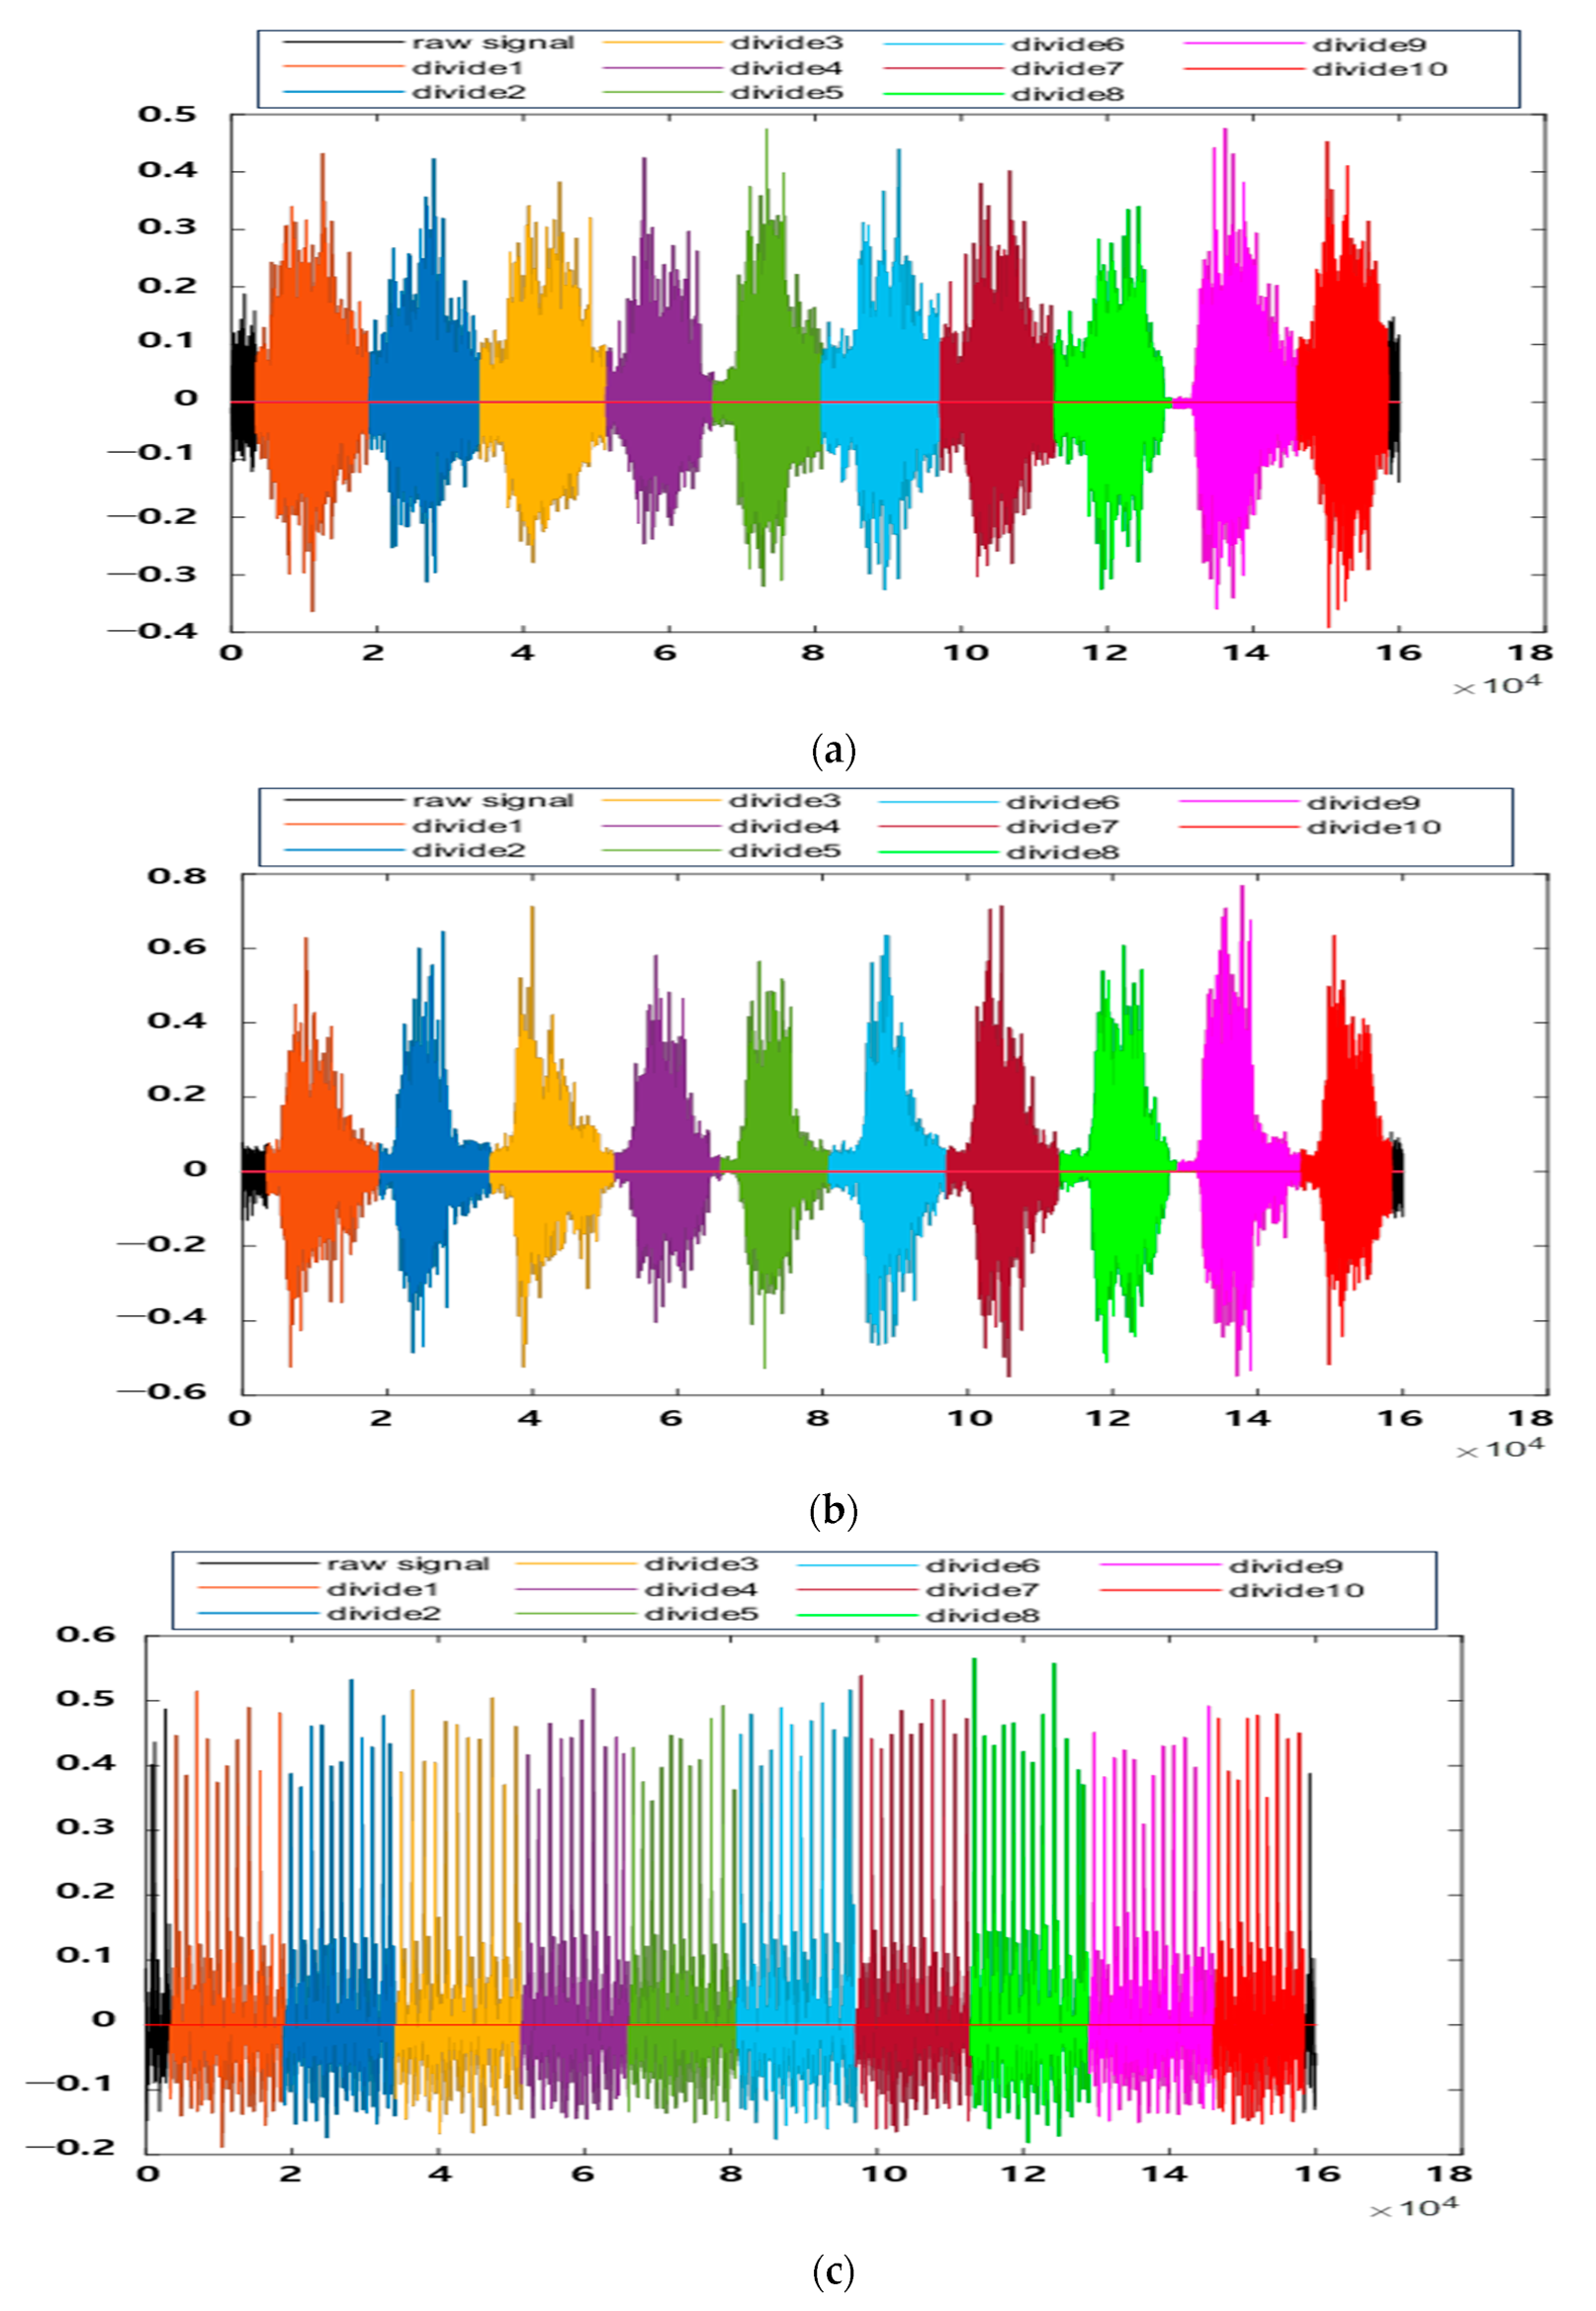
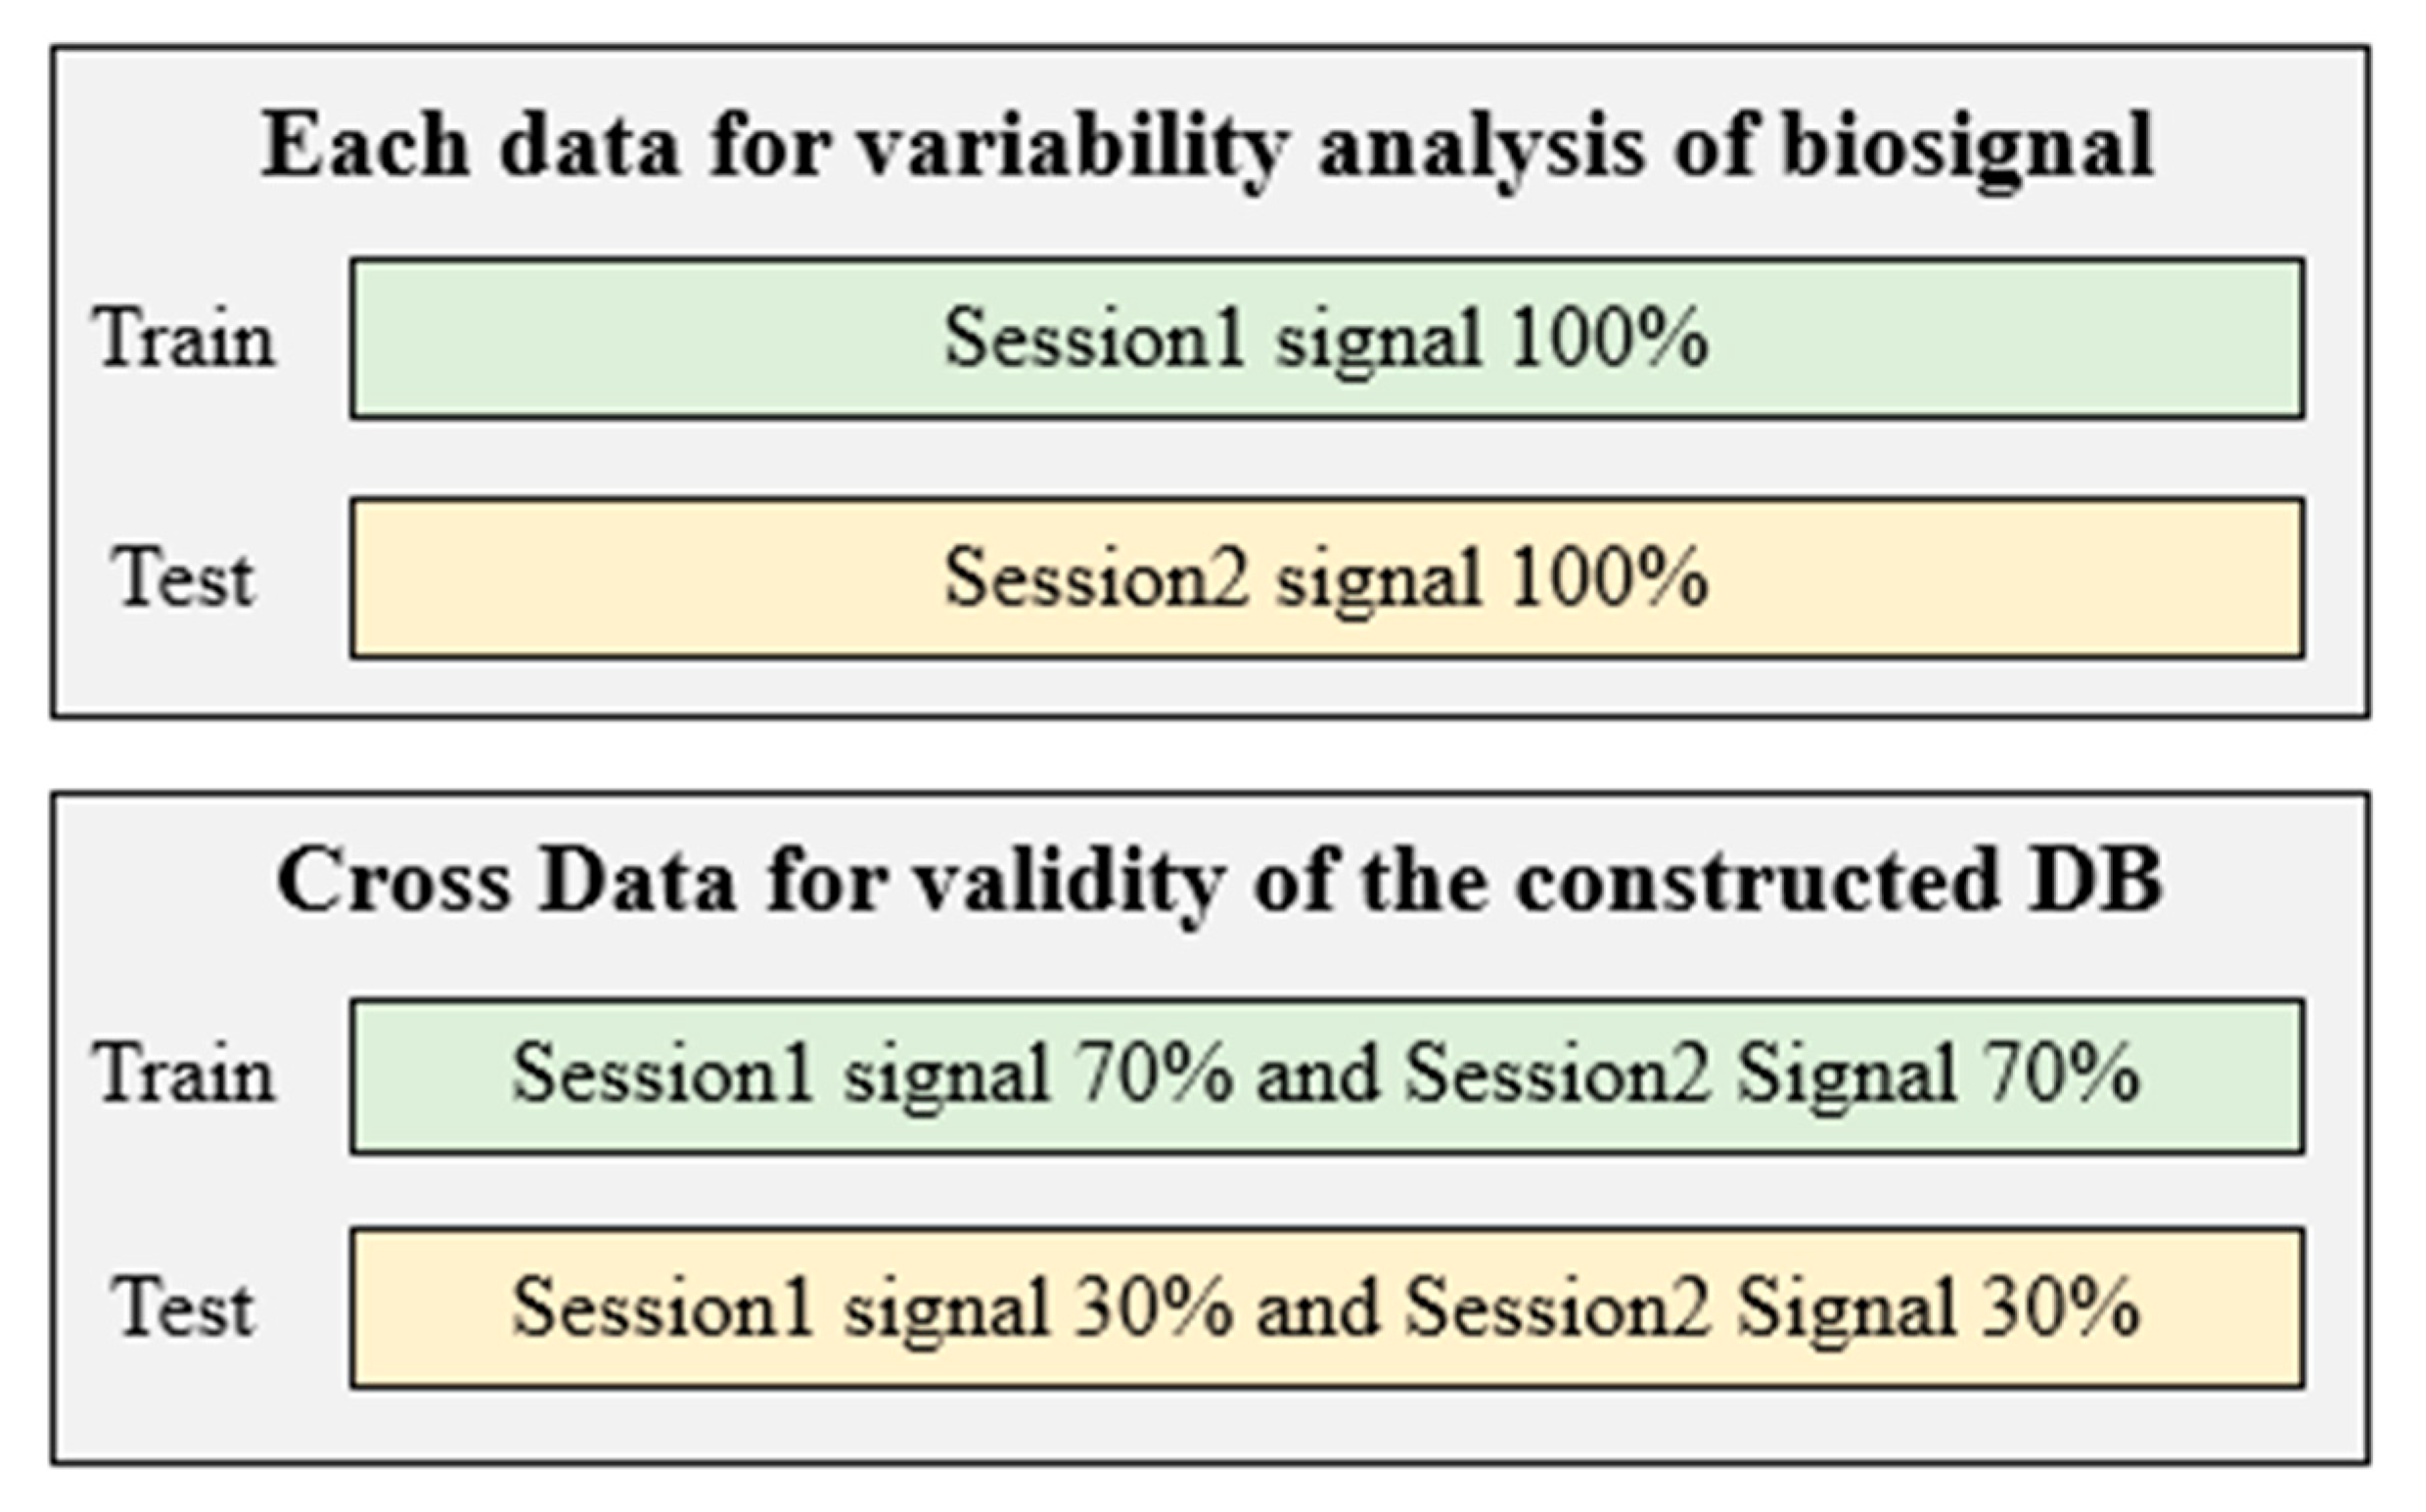
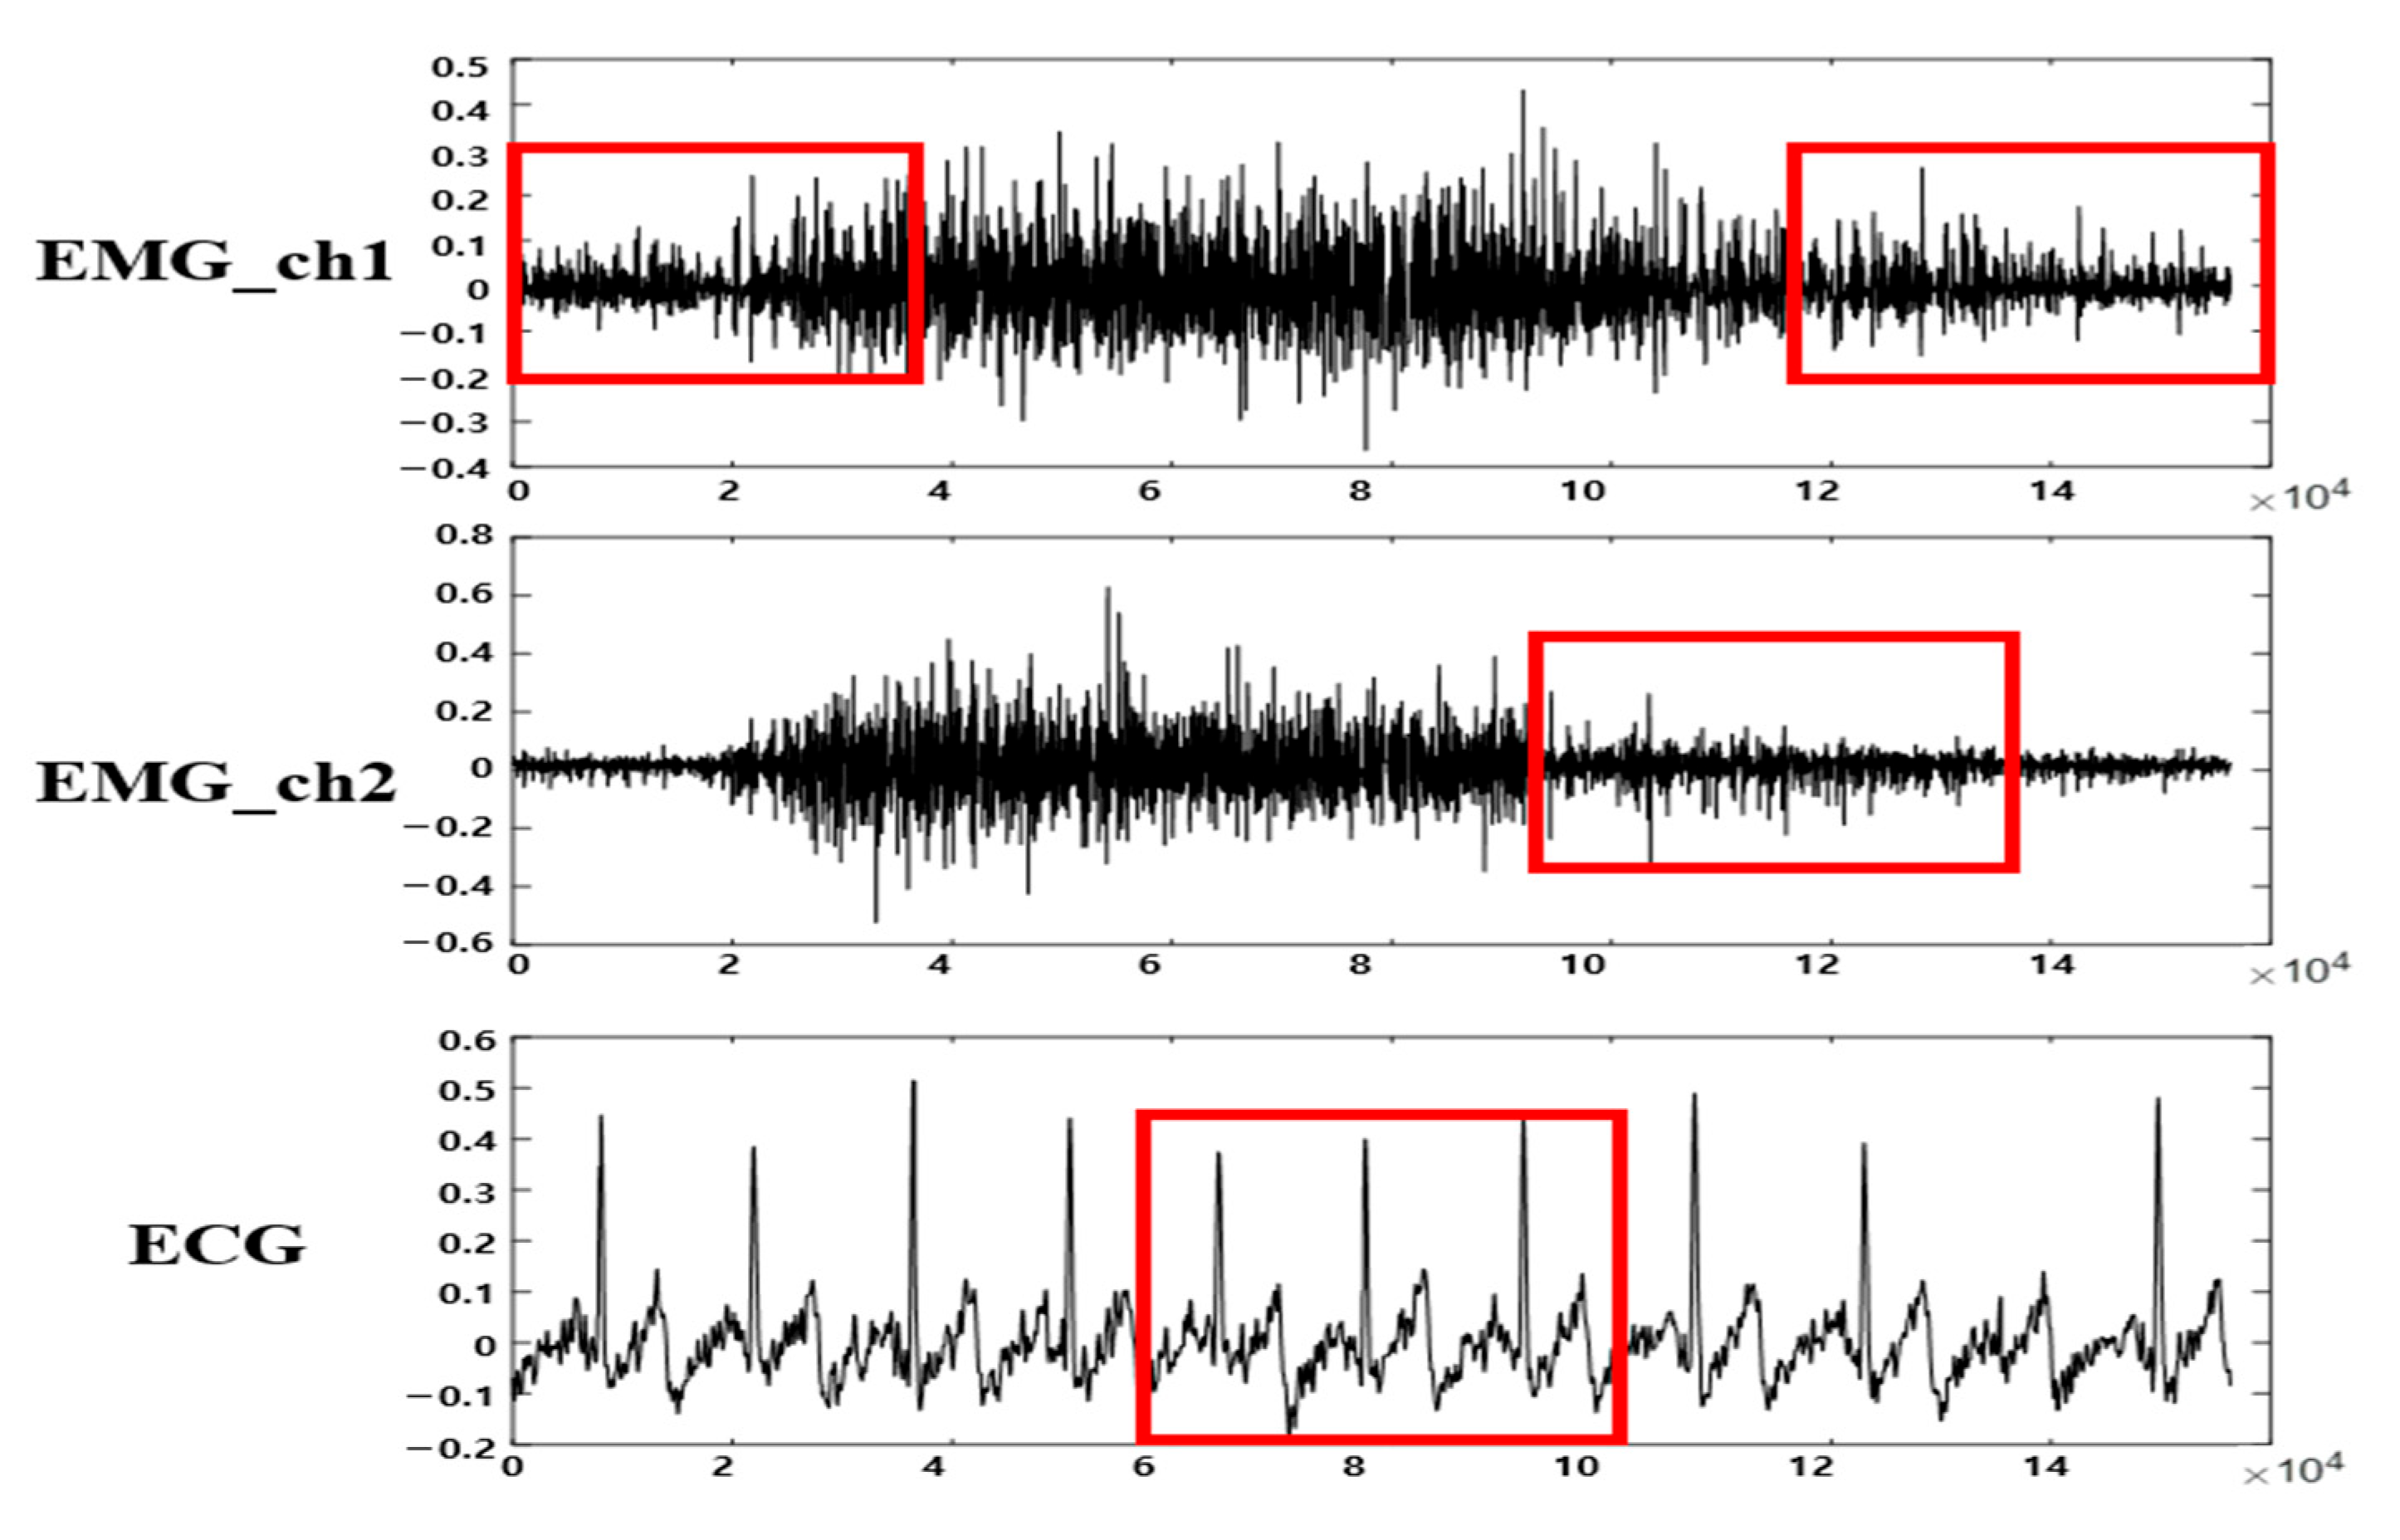
3.2. Multi-Biosignal DB Verification and Segmentation
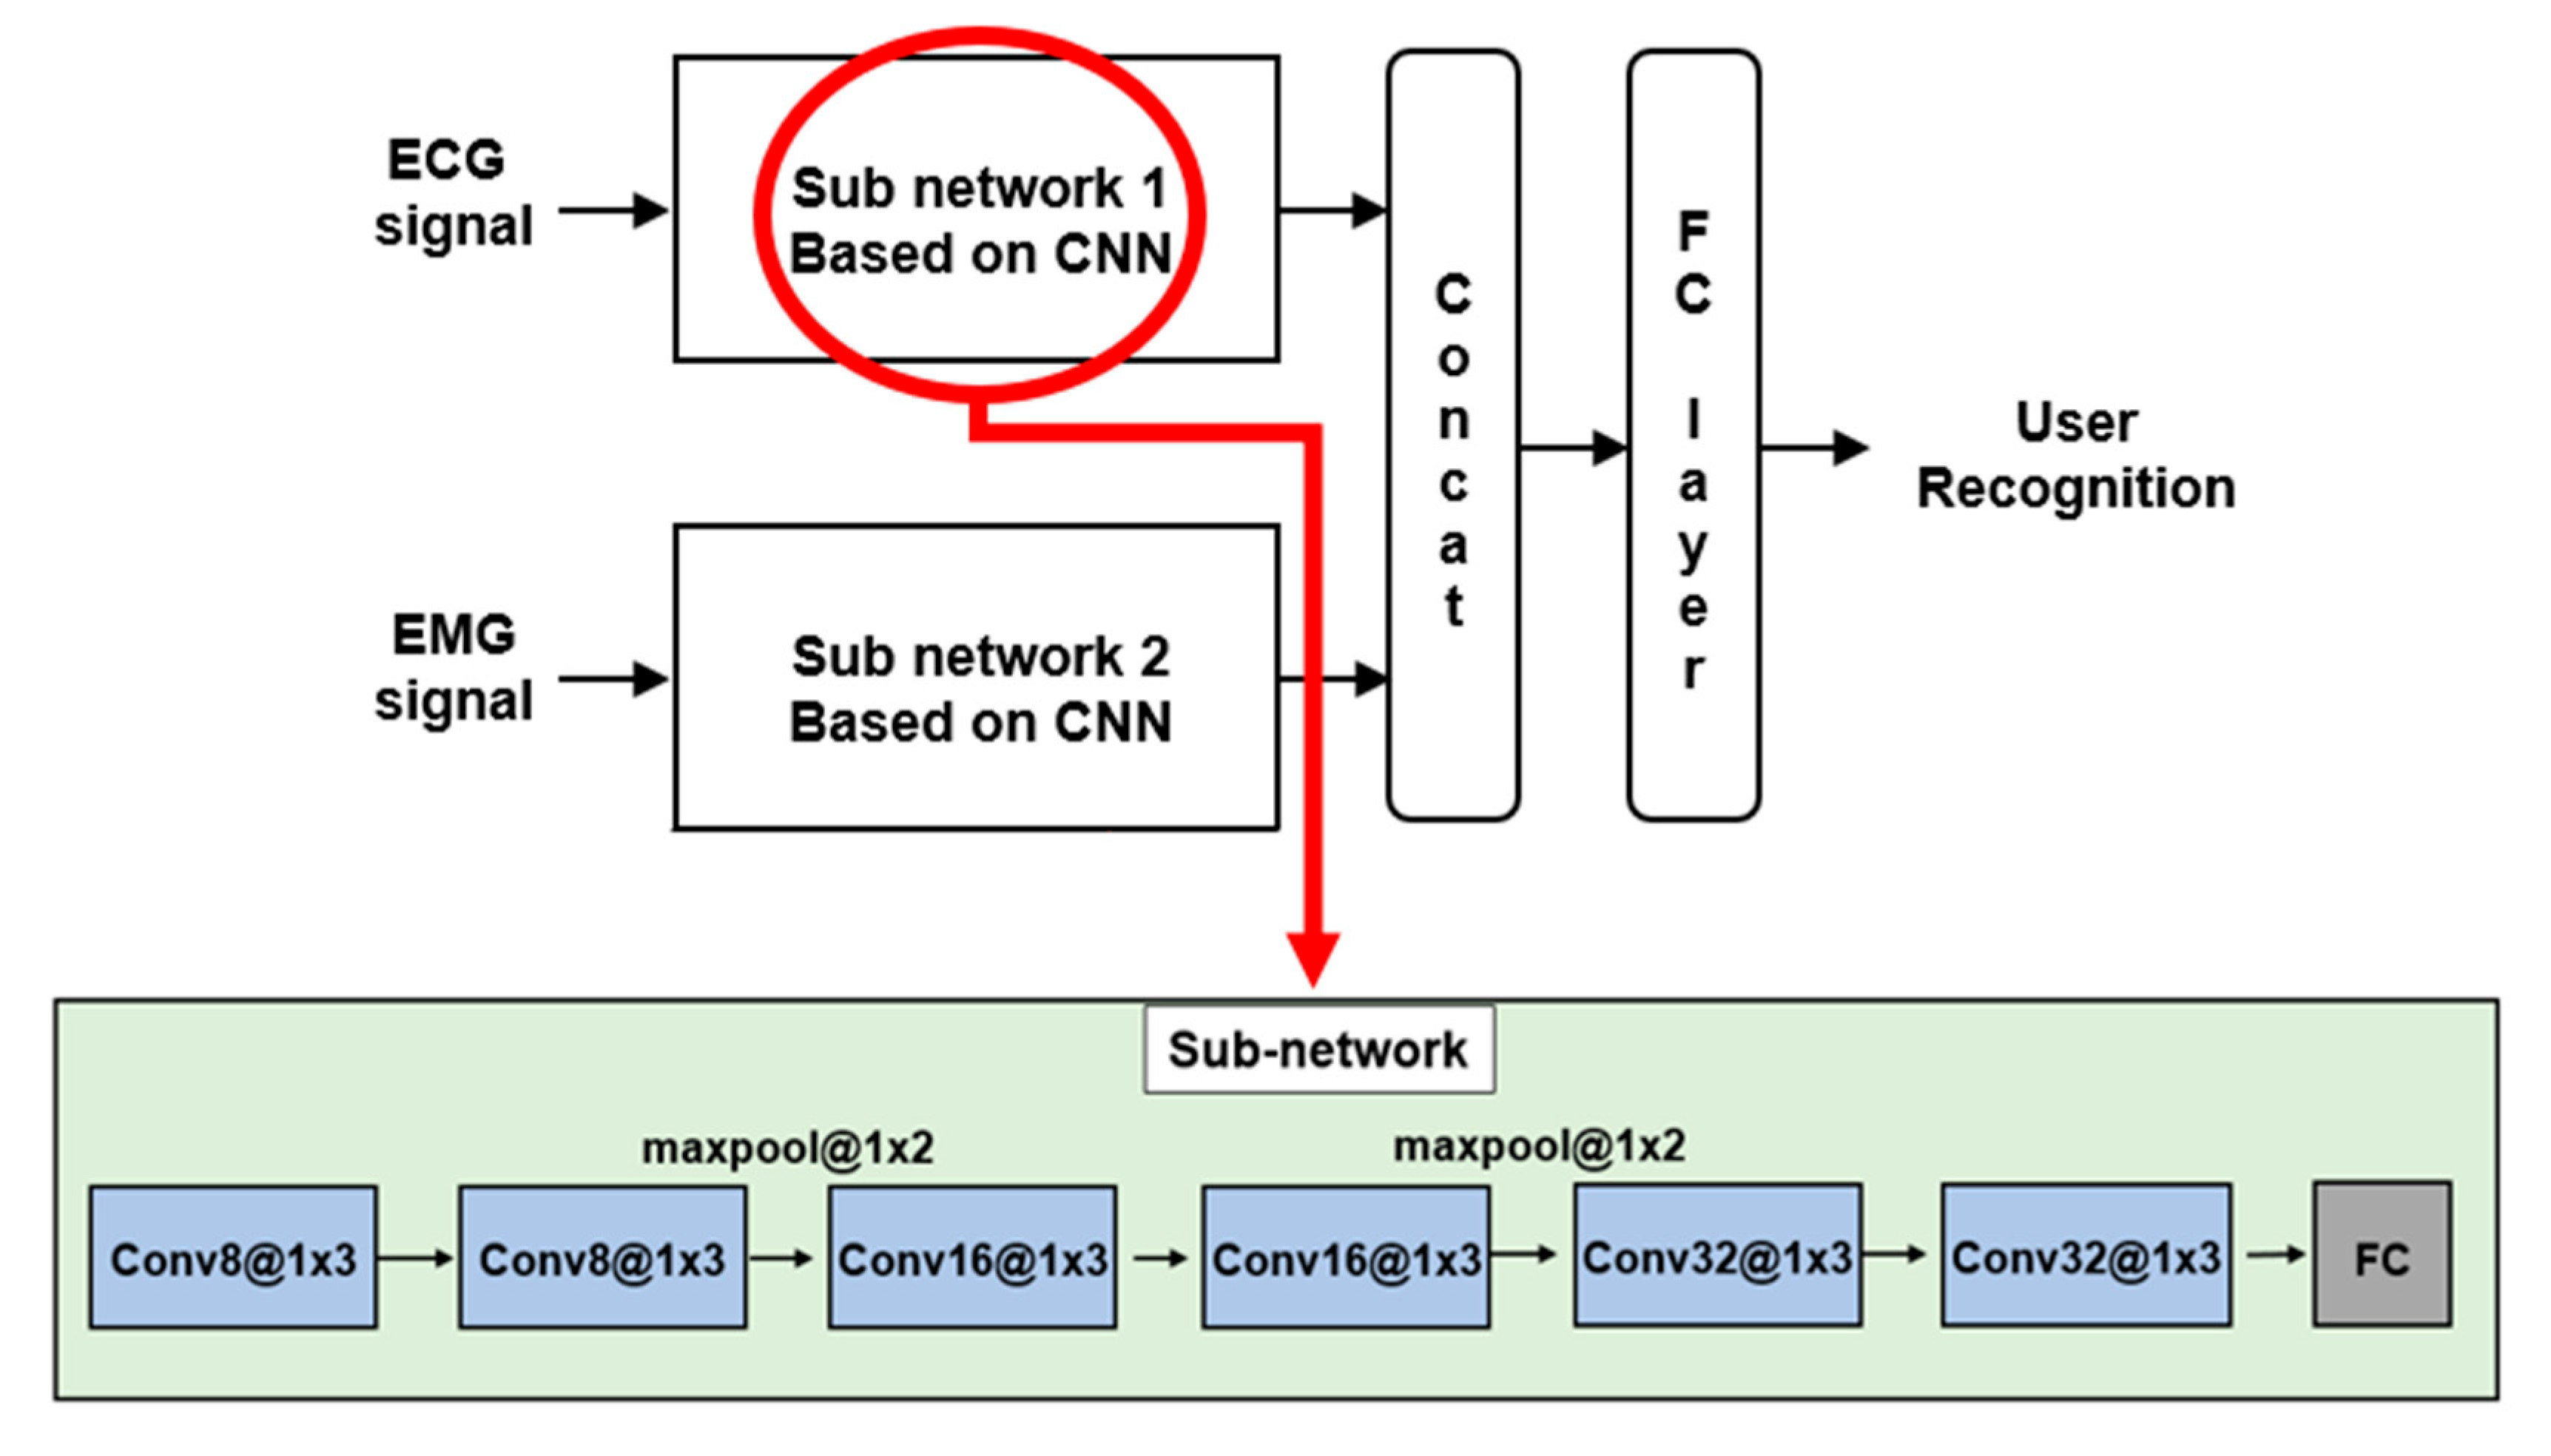
4. User Recognition Method, Results, and Discussion
5. Conclusions
Author Contributions
Funding
Institutional Review Board Statement
Informed Consent Statement
Data Availability Statement
Conflicts of Interest
References
- Caputo, D.; Verderame, L.; Ranieri, A.; Merlo, A.; Caviglione, L. Fine-bearing google home: Why silence will not protect your privacy. J. Wirel. Mob. Netw. Ubiquitous Comput. Dependable Appl. 2020, 11, 35–53. [Google Scholar]
- Kim, J.S.; Kim, M.G.; Pan, S. Two-step biometrics using electromyogram signal based on convolutional neural network-long short-term memory networks. Appl. Sci. 2021, 11, 6824. [Google Scholar] [CrossRef]
- Kim, J.S. A Study on Personal Recognition Using Electromyogram Based on Multi-Stream Siamese Fusion Network Combining Auxiliary Classifier. Ph.D. Thesis, Chosun University, Gwangju, Republic of Korea, 2022. [Google Scholar]
- Goldberger, A.L.; Amaral, L.A.; Glass, L.; Hausdorff, J.M.; Ivanov, P.C.; Mark, R.G.; Mietus, J.E.; Moody, G.B.; Peng, C.K.; Stanley, H.E. Physiobank, physiotoolkit, and physionet: Components of a new research resource for complex physiologic signal. Circulation 2000, 101, 215–220. [Google Scholar] [CrossRef]
- PhysioNet. Available online: https://physionet.org/ (accessed on 2 January 2024).
- Mark, R.G.; Schluter, P.S.; Moody, G.B.; Devlin, P.H.; Chernoff, D. An annotated ECG database for evaluating arrhythmia detectors. IEEE. Trans. Biomed. Eng. 1982, 29, 600. [Google Scholar]
- Moody, G.B.; Mark, R.G. The MIT-BIH arrhythmia database on CD-ROM and software for use with it. Comput. Cardiol. 1990, 17, 185–188. [Google Scholar]
- Albrecht, P.S.T. S-T Segment Characterization for Long-Term Automated ECG Analysis. Master’s Thesis, MIT, Cambridge, MA, USA, 1983. [Google Scholar]
- Laguna, P.; Mark, R.G.; Goldberger, A.L.; Moody, G.B. A database for evaluation of algorithms for measurement of QT and other waveform intervals in the ECG. Comput. Cardiol. 1997, 24, 673–676. [Google Scholar]
- Jezewski, J.; Matonia, A.; Kupka, T.; Roj, D.; Czabanski, R. Determination of the fetal heart rate from abdominal signal: Evaluation of beat-to-beat accuracy in relation to the direct fetal electrocardiogram. Biomed. Eng./Biomed. Tech. 2012, 57, 383–394. [Google Scholar] [CrossRef] [PubMed]
- Bousselijot, R.; Kreiseler, D.; Schnabel, A. Nutzung der EKG-signaldatenbank CARDIODAT der PTB uber das internet. Biomed. Eng./Biomed. Tech. 1995, 40, 317–318. [Google Scholar]
- Lugovaya, T.S. Biometric Human Identification Based on Electrocardiogram. Master’s Thesis, Electrotechnical University, Saint-Petersburg, Russia, 2005. [Google Scholar]
- Choi, G.H.; Ko, H.; Pedrycz, W.; Pan, S.B. Post-exercise electrocardiogram identification system using normalized tachycardia based on P, T, wave. In Proceedings of the Information Technology, Electronics and Mobile Communication Conference, Vancouver, BC, Canada, 17–19 October 2019. [Google Scholar]
- Sapsanic, C.; Georgoulas, G.; Tzes, A.; Lymberopoulos, D. Improving EMG based classification of basic hand movements using EMD. In Proceedings of the International Conference of the IEEE Engineering in Medicine and Biology Society, Osaka, Japan, 3–7 July 2013. [Google Scholar]
- UCI Machine Learning Repository. Available online: http://archive.ics.uci.edu/ml/datasets/sEMG+for+Basic+Hand+movements (accessed on 14 December 2023).
- Atzori, M.; Gijsberts, A.; Kuzborskij, I.; Elsig, S.; Hager, A.G.M.; Deriaz, O.; Castellini, C.; Müller, H.; Caputo, B. Characterization of a benchmark database for myoelectric movement classification. IEEE Trans. Neural Syst. Rehabil. Eng. 2015, 23, 73–83. [Google Scholar] [CrossRef] [PubMed]
- Atzori, M.; Gijsberts, A.; Castellini, C.; Caputo, B.; Hager, A.G.M.; Elsig, S.; Giatsidis, G.; Bassetto, F.; Müller, H. Electromyography data for non-invasive naturally-controlled robotic hand prostheses. Sci. Data 2014, 1, 140053. [Google Scholar] [CrossRef] [PubMed]
- Pizzolato, S.; Tagliapietra, L.; Cognolato, M.; Reggiani, M.; Müller, H.; Atzori, M. Comparison of six electromyography acquisition setups on hand movement classification tasks. PLoS ONE 2017, 12, 0186132. [Google Scholar] [CrossRef]
- Amma, C.; Krings, T.; Boer, J.; Schultz, T. Advancing muscle-computer interfaces with high-density electromyography. In Proceedings of the Conference on Human Factors in Computing Systems, Seoul, Republic of Korea, 18–23 April 2015. [Google Scholar]
- Figshare. Available online: https://figshare.com/articles/dataset/Data_from_Gesture_Recognition_by_Instantaneous_Surface_EMG_Images_CapgMyo-DBa/7210397 (accessed on 30 January 2024).
- Coker, J.; Chen, H.; Schall, M.C., Jr.; Zabala, M. EMG and joint angle-based machine learning to predict future joint angles at the knee. Sensors 2021, 21, 3622. [Google Scholar] [CrossRef] [PubMed]
- Fang, Y.; Zhang, X.; Zhou, D.; Liu, H. Improve inter-day hand gesture recognition via convolutional neural network based feature fusion. Int. J. Humanoid Robot. 2020, 18, 2050025. [Google Scholar] [CrossRef]
- Pradhan, A.; He, J.; Jiang, N. Open access dataset for electromyography based multi-code biometric authentication. arXiv 2022, arXiv:2201.01051. [Google Scholar]
- Kim, J.S.; Song, C.H.; Bak, E.S.; Pan, S.B. Multi-session surface-electromyogram signal database for personal identification. Sustainability 2022, 14, 5739. [Google Scholar] [CrossRef]
- Cognolato, M.; Gijsberts, A.; Gregori, V.; Saetta, G.; Giacomino, K.; Hager, A.G.M.; Gigli, A.; Faccio, D.; Tiengo, C.; Bassetto, F.; et al. Gaze, visual, myoelectric, and inertial data of grasps for intelligent prosthetics. Sci. Data 2020, 7, 43. [Google Scholar] [CrossRef] [PubMed]
- Koelstra, S.; Muhl, C.; Soleymani, M.; Lee, J.S.; Yazdani, A.; Ebrahimi, T.; Pun, T.; Nijholt, A.; Patras, I. DEAP: A database for emotion analysis using physiological signals. IEEE Trans. Affect. Comput. 2012, 3, 18–31. [Google Scholar] [CrossRef]
- Katsigiannis, S.; Ramzan, N. DREAMER: A database for emotion recognition through EEG and ECG signals from wireless low-cost off-the-shelf devices. IEEE J. Biomed. Health Inform. 2018, 22, 98–107. [Google Scholar] [CrossRef]
- Healey, J.A.; Picard, R.W. Detecting stress during real-world driving tasks using physiological sensors. IEEE Trans. Intell. Transp. Syst. 2005, 6, 156–166. [Google Scholar] [CrossRef]
- Soleymani, M.; Lichtenauer, J.; Pun, T.; Pantic, M. A multimodal database for affect recognition and implicit tagging. IEEE Trans. Affect. Comput. 2012, 3, 42–55. [Google Scholar] [CrossRef]
- Kim, J.S.; Pan, S. Weight sharing-based user recognition using multi-biosignal. In Proceedings of the KIIT Conference, Jeju, Republic of Korea, 1–2 June 2023. [Google Scholar]
- Belgacem, N.; Fournier, R.; Nait-Ali, A.; Bereksi-Reguig, F. A novel biometric authentication approach using ECG and EMG signals. J. Med. Eng. Technol. 2015, 39, 226–238. [Google Scholar] [CrossRef] [PubMed]
- Zhu, Y.; Tang, G.; Liu, W. How post 90’s gesture interact with automobile skylight. Int. J. Hum. Comput. Interact. 2021, 38, 395–405. [Google Scholar] [CrossRef]


| Category | DB Name | Channels | Session Type | No. of Subjects | |
|---|---|---|---|---|---|
| 1 | MIT-BIH | Normal [4,5] | 2 | Single | 18 |
| Arrhythmia [6,7] | 2 | Single | 47 | ||
| ST Change [8] | 2 | Single | 28 | ||
| 2 | QT [9] | 2 | Single | 105 | |
| 3 | Abdominal and direct fetal ECG [10] | 5 | Single | 5 | |
| 4 | PTB Diagnostic [11] | 14 | Single | 290 | |
| 5 | ECG-ID [12] | 1 | Multi | 90 | |
| 6 | CSU_ECG [13] | 1 | Multi | 506 | |
| Category | DB Name | Channels | Session Type | No. of Subjects | No. of Gesture | |
|---|---|---|---|---|---|---|
| 1 | sEMG Basic Hand Movements Upatras [14,15] | 2 | Single | 5 | 6 | |
| 2 | Multi | 1 | 6 | |||
| 2 | Ninapro [16,17,18] | DB1 | 10 | Single | 27 | 52 |
| DB2 | 12 | Single | 40 | 49 | ||
| DB5 | 16 | Single | 10 | 52 | ||
| 3 | CapgMyo [19,20] | DB-a | 128 | Single | 18 | 8 |
| DB-b | 128 | Multi | 10 | 8 | ||
| 4 | Anglese EMG [21] | 12 | Single | 10 | 1 | |
| 5 | ISRMyo-I [22] | 16 | Multi | 6 | 12 | |
| 6 | GrabMyo [23] | 28 | Multi | 43 | 16 | |
| 7 | CSU_sEMG [24] | 2 | Multi | 200 | 12 | |
| Category | DB Name | Biosignal Types | Session Type | No. of Subjects |
|---|---|---|---|---|
| 1 | MeganePro MDS1 [25] | EMG, video, gaze tracking, etc. | Single | 45 |
| 2 | DEAP dataset [26] | EEG, EOG, EMG, etc. | Single | 32 |
| 3 | DREAMER dataset [27] | EEG, ECG | Single | 25 |
| 4 | Stress Recognition in Automobile Drivers [28] | ECG, EMG, EDA, etc. | Multi | 9 |
| 5 | MAHNOD-implicit-tagging [29] | ECG, EEG, gaze tracking, etc. | Single | 30 |
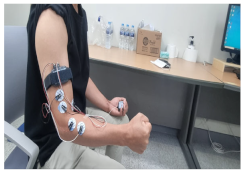
 | 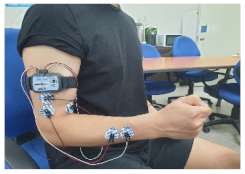 |
| 1. Clenching the fist | 2. Pressing the index finger with the thumb while clenching the fist |
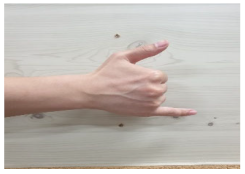 |  |
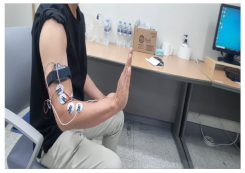
| 3. Simultaneously flexing the index, middle, and ring fingers | 4. Flexing the wrist |
 |  |
| 5. Extending the wrist outward | 6. Rotating the wrist 90 degrees to the left |
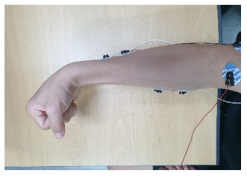
 |  |
| 1. Clenching the fist | 2. Flexing the wrist |
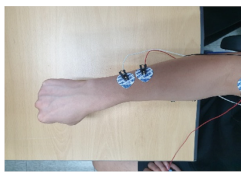
 | 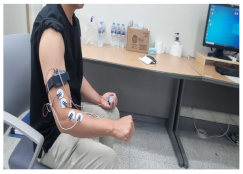 |
| 3. Extending the wrist upward | 4. Rotating the wrist 90 degrees to the left |
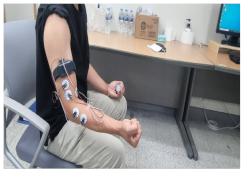 |  |
| 5. Rotating the wrist 90 degrees to the right | 6. Raising the cell phone 90 degrees |
| DB Name | CSU_MBDB1 | CSU_MBDB2 |
| Biosignal types | ECG, EMG | ECG, EMG |
| Session type | Multi | Multi |
| No. of participants/construction subjects | 60/36 | 100/58 |
| No. of channels | ECG 1ch, EMG 2ch | ECG 1ch, EMG 2ch |
| No. of gestures | 6 | 6 |
| Sampling rate | 2000 Hz | 2000 Hz |
| Remark | In the form of raw signals. The R-peak positions and the divide points that facilitate the signal division are provided. | |
| Category | Round 1 (%) | Round 2 (%) | Round 3 (%) | Mean (%) | |
|---|---|---|---|---|---|
| Each Data | 10 subjects | 46.62 | 43.67 | 45.05 | 45.11 |
| 36 subjects | 34.18 | 36.29 | 35.37 | 35.28 | |
| Cross Data | 10 subjects | 62.44 | 62.22 | 65.61 | 63.42 |
| 36 subjects | 46.01 | 45.59 | 44.52 | 45.37 | |
| Category | Round 1 (%) | Round 2 (%) | Round 3 (%) | Mean (%) | |
|---|---|---|---|---|---|
| Each Data | 10 subjects | 48.33 | 47.17 | 49.83 | 48.44 |
| 58 subjects | 29.14 | 26.43 | 27.56 | 27.71 | |
| Cross Data | 10 subjects | 67.67 | 65.17 | 66.33 | 66.39 |
| 58 subjects | 50.19 | 49.49 | 48.59 | 49.42 | |
| Category | Round 1 (%) | Round 2 (%) | Round 3 (%) | Mean (%) | |
|---|---|---|---|---|---|
| Cross Data (94 subjects) | With noise | 25.89 | 27.42 | 27.84 | 27.05 |
| Without noise | 30.14 | 31.86 | 30.83 | 30.94 | |
| DB Name | Gesture No. 1 | Gesture No. 2 | Gesture No. 3 | Gesture No. 4 | Gesture No. 5 | Gesture No. 6 |
|---|---|---|---|---|---|---|
| CSU_MBDB1 | 0.4766 | 0.4555 | 0.4462 | 0.4524 | 0.4324 | 0.4718 |
| CSUMBDB2 | 0.4607 | 0.4492 | 0.4583 | 0.4574 | 0.4656 | 0.4580 |
Disclaimer/Publisher’s Note: The statements, opinions and data contained in all publications are solely those of the individual author(s) and contributor(s) and not of MDPI and/or the editor(s). MDPI and/or the editor(s) disclaim responsibility for any injury to people or property resulting from any ideas, methods, instructions or products referred to in the content. |
© 2024 by the authors. Licensee MDPI, Basel, Switzerland. This article is an open access article distributed under the terms and conditions of the Creative Commons Attribution (CC BY) license (https://creativecommons.org/licenses/by/4.0/).
Share and Cite
Kim, J.S.; Song, C.H.; Kim, J.M.; Lee, J.; Byeon, Y.-H.; Jung, J.; Choi, H.-S.; Kwak, K.-C.; Kim, Y.T.; Bak, E.; et al. Multi-Session Electrocardiogram–Electromyogram Database for User Recognition. Appl. Sci. 2024, 14, 2607. https://doi.org/10.3390/app14062607
Kim JS, Song CH, Kim JM, Lee J, Byeon Y-H, Jung J, Choi H-S, Kwak K-C, Kim YT, Bak E, et al. Multi-Session Electrocardiogram–Electromyogram Database for User Recognition. Applied Sciences. 2024; 14(6):2607. https://doi.org/10.3390/app14062607
Chicago/Turabian StyleKim, Jin Su, Cheol Ho Song, Jae Myung Kim, Jimin Lee, Yeong-Hyeon Byeon, Jaehyo Jung, Hyun-Sik Choi, Keun-Chang Kwak, Youn Tae Kim, EunSang Bak, and et al. 2024. "Multi-Session Electrocardiogram–Electromyogram Database for User Recognition" Applied Sciences 14, no. 6: 2607. https://doi.org/10.3390/app14062607
APA StyleKim, J. S., Song, C. H., Kim, J. M., Lee, J., Byeon, Y.-H., Jung, J., Choi, H.-S., Kwak, K.-C., Kim, Y. T., Bak, E., & Pan, S. (2024). Multi-Session Electrocardiogram–Electromyogram Database for User Recognition. Applied Sciences, 14(6), 2607. https://doi.org/10.3390/app14062607