

Fragility and Leakage Risk Assessment of Nuclear Containment Structure under Loss-of-Coolant Accident Conditions Considering Liner Corrosion

Abstract
1. Introduction
2. Corrosion Mechanisms and Simulation Schemes for Corroded Liner
2.1. Corrosion Mechanism of the Liner
2.2. Simulation Scheme for Corroded Liners
3. Numerical Analysis Model of the NCS
3.1. Basic Parameters of the NCS
3.2. Numerical Analysis Model of the NCS
3.3. Material Parameters
3.3.1. Concrete
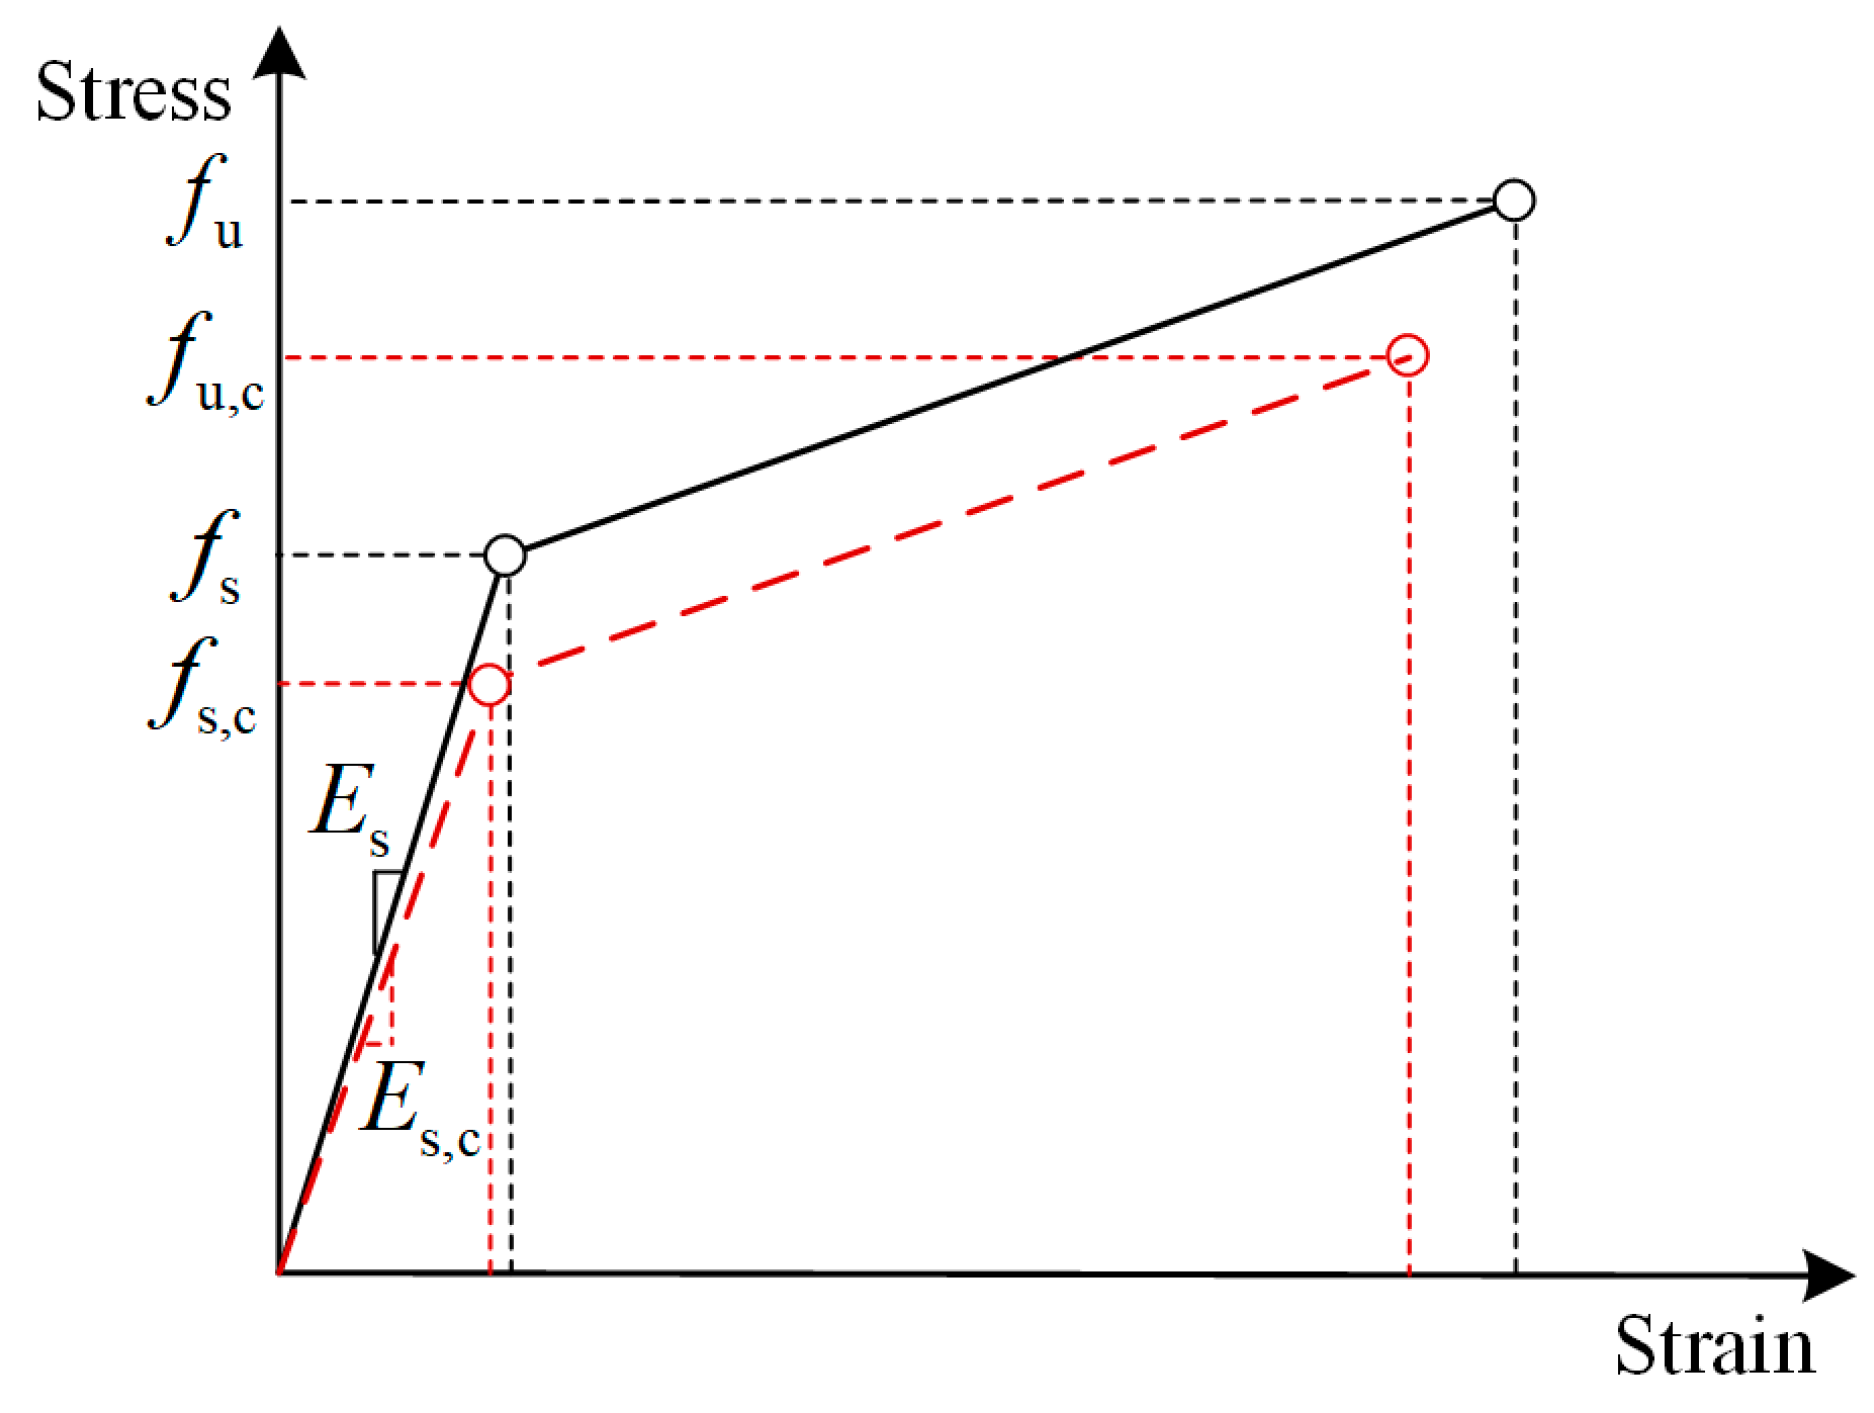
3.3.2. Steel
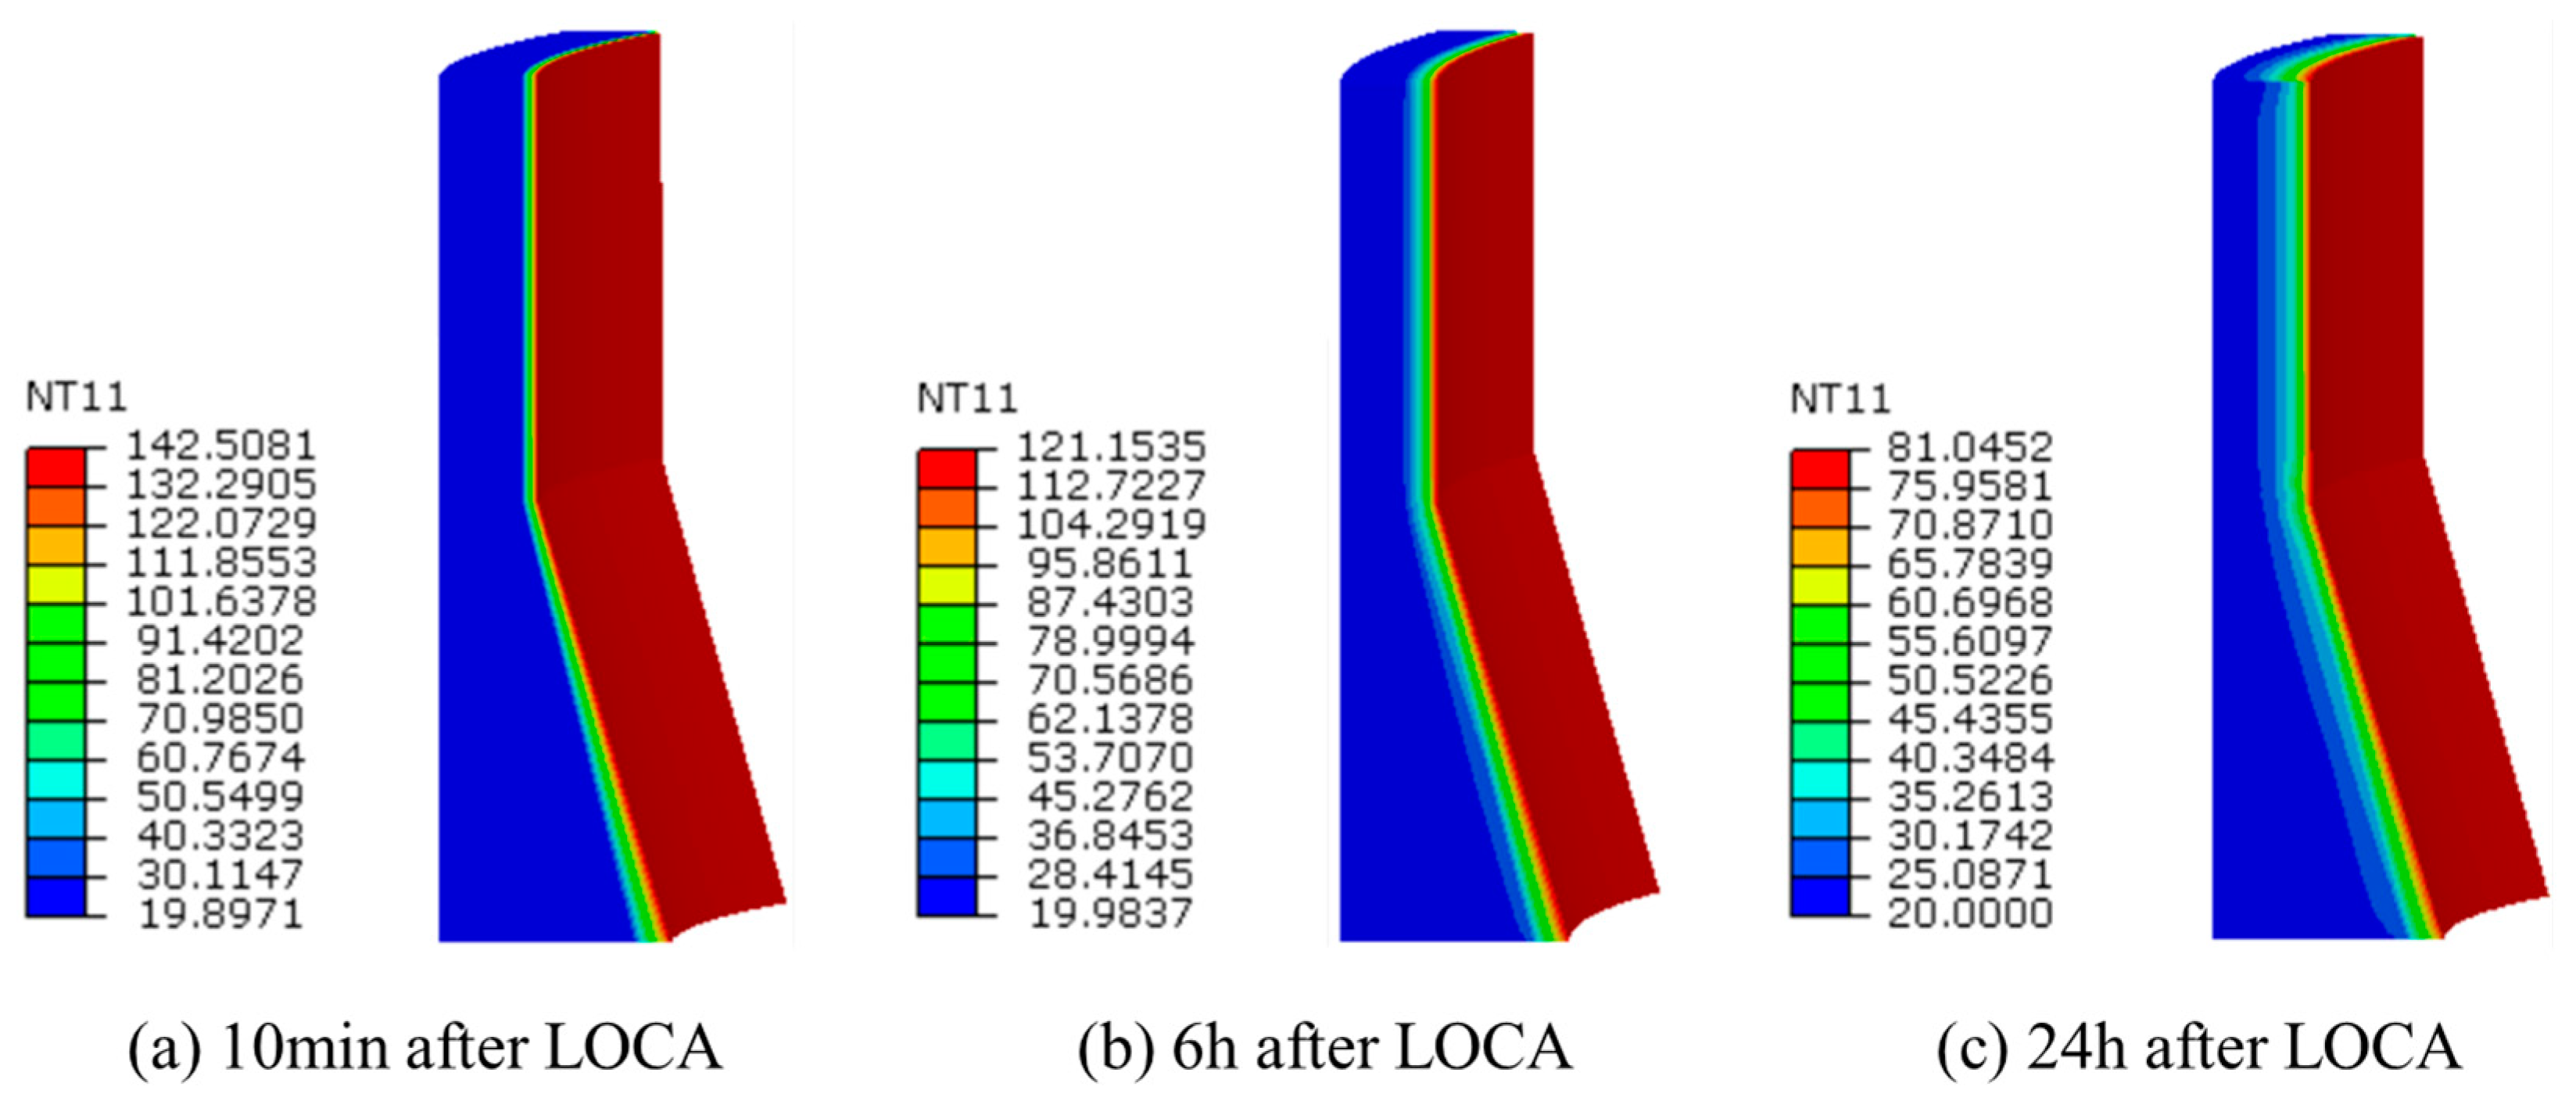
3.4. Boundary Conditions and Loading Procedures
4. Analysis Program for Liner Corrosion
4.1. Corrosion Analysis Method
4.2. Sub-Model for the Corroded Liner
4.3. Validity of Gusset Sub-Model
4.4. Definition of the Corrosion Area
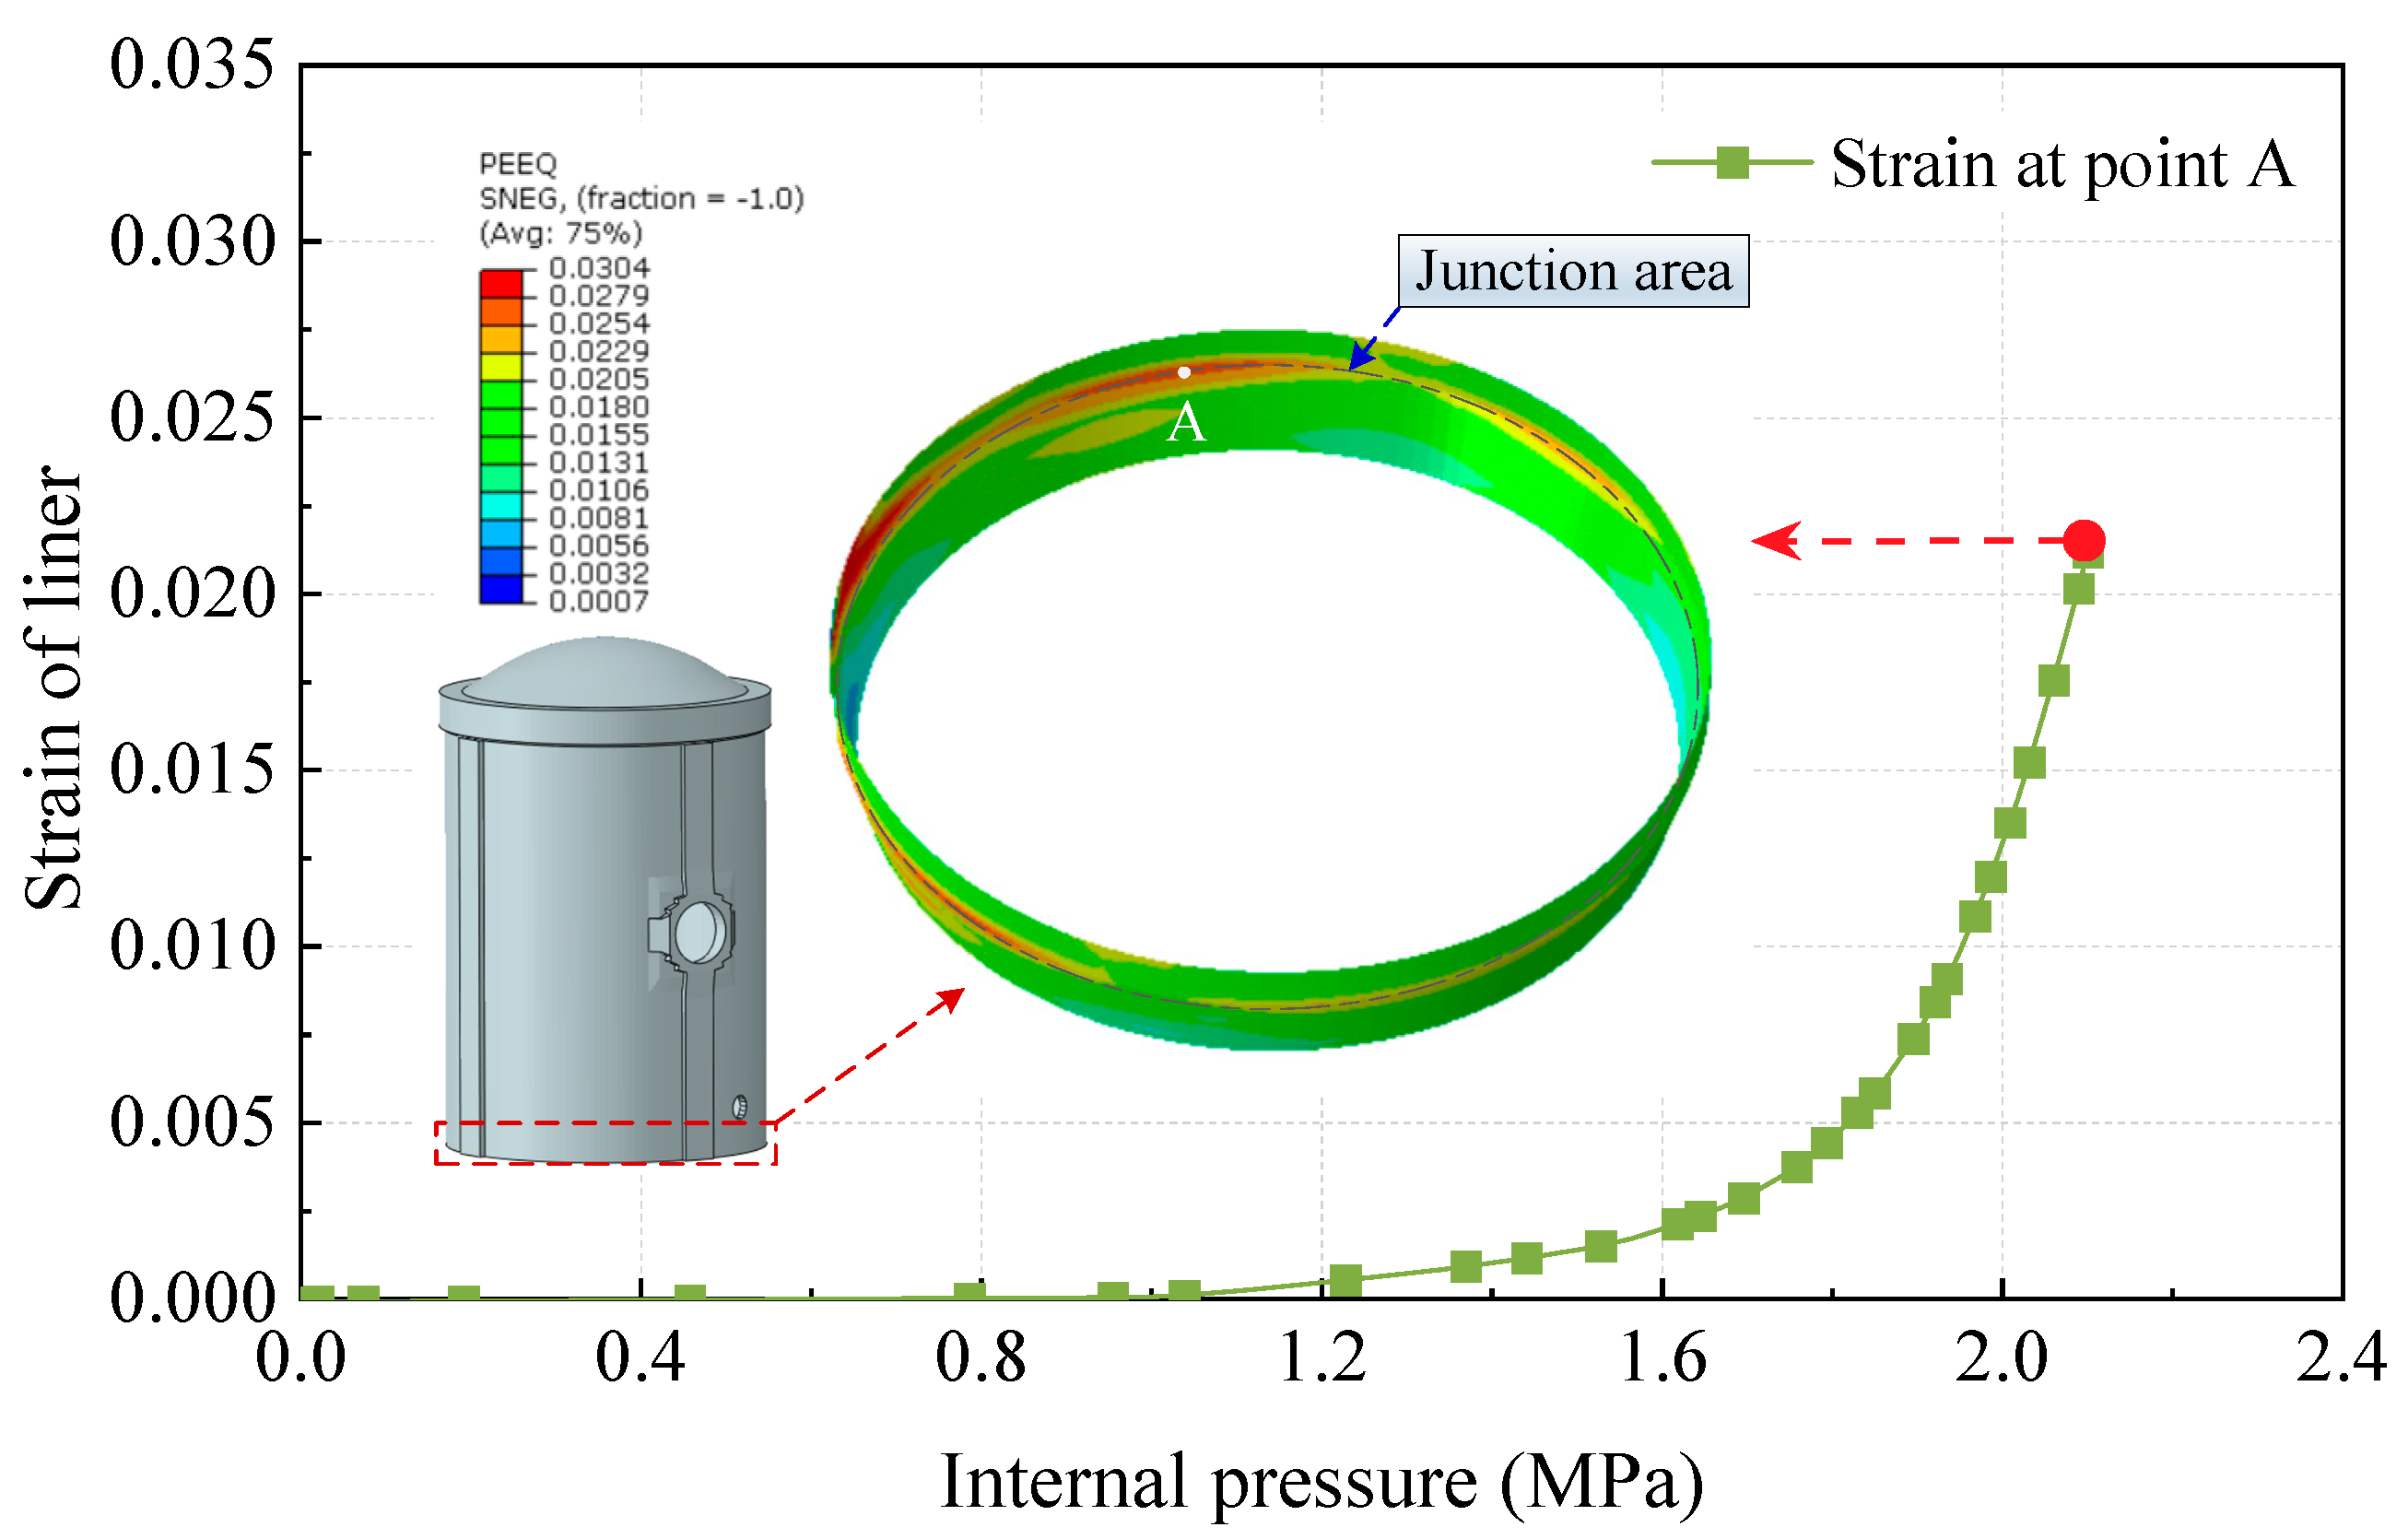
4.5. Failure Criteria
5. Fragility and Leakage Risk Assessment of the NCS
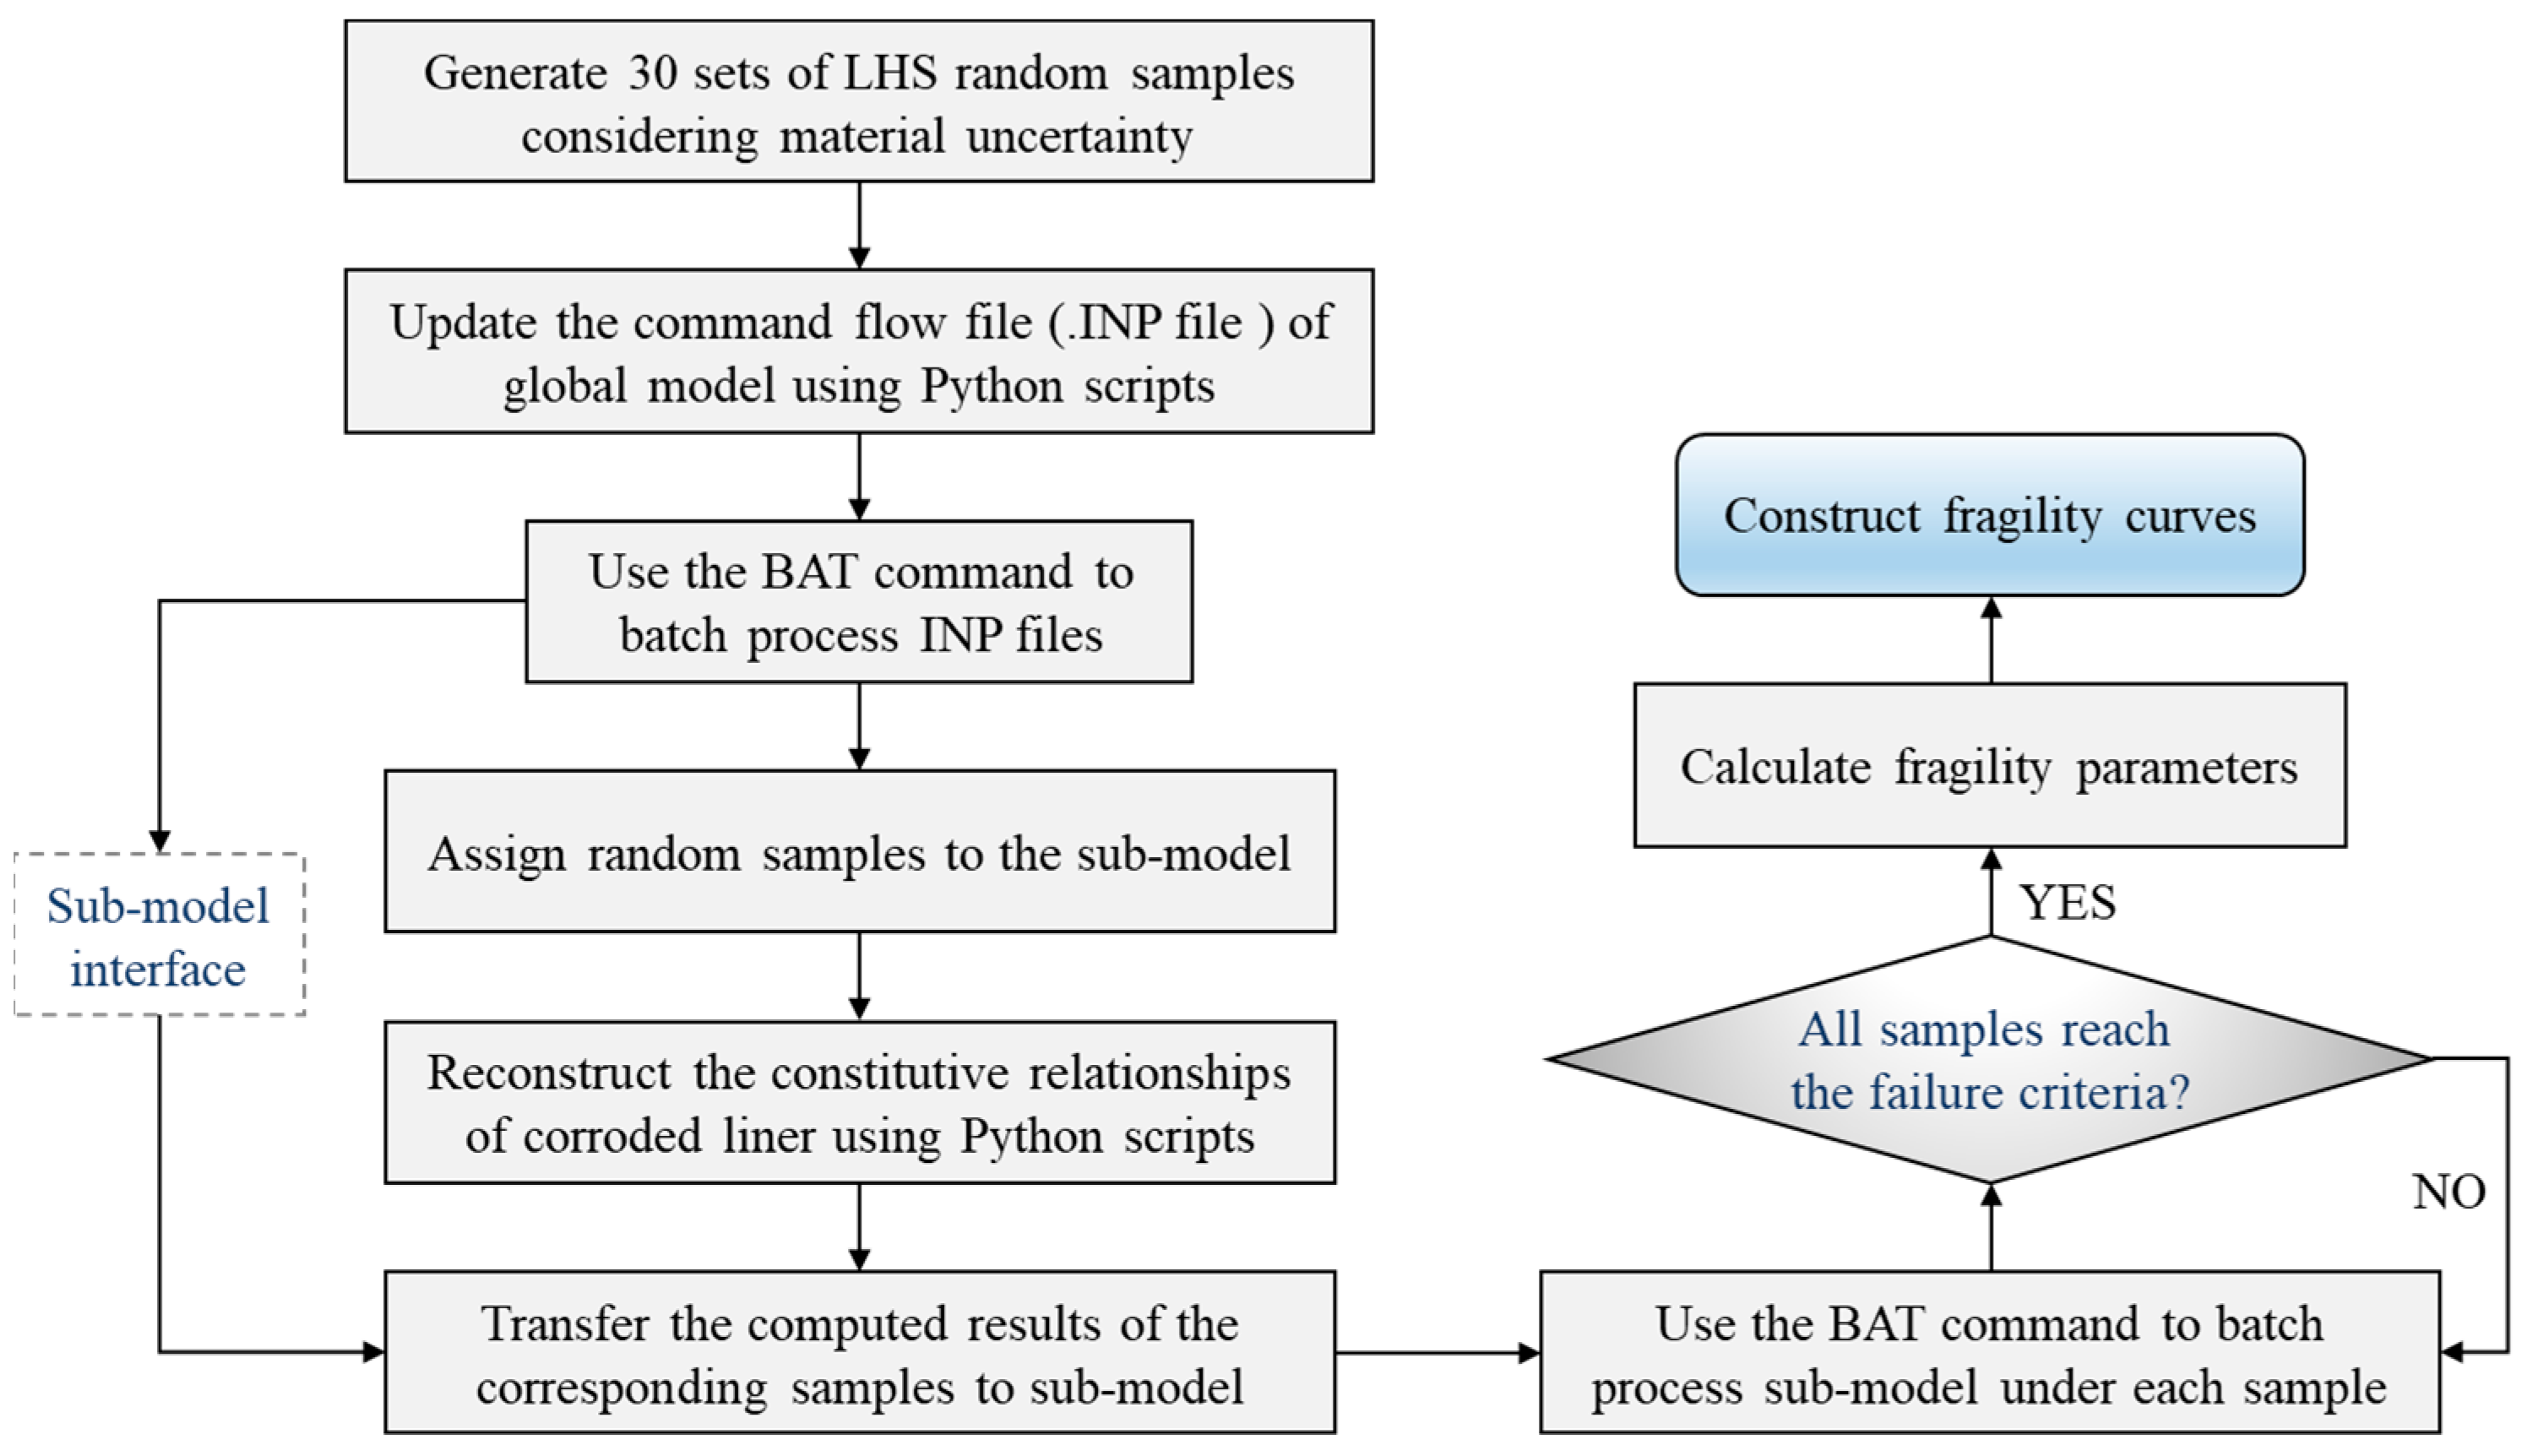
5.1. Fragility Assessment Process
5.2. Fragility Assessment Results
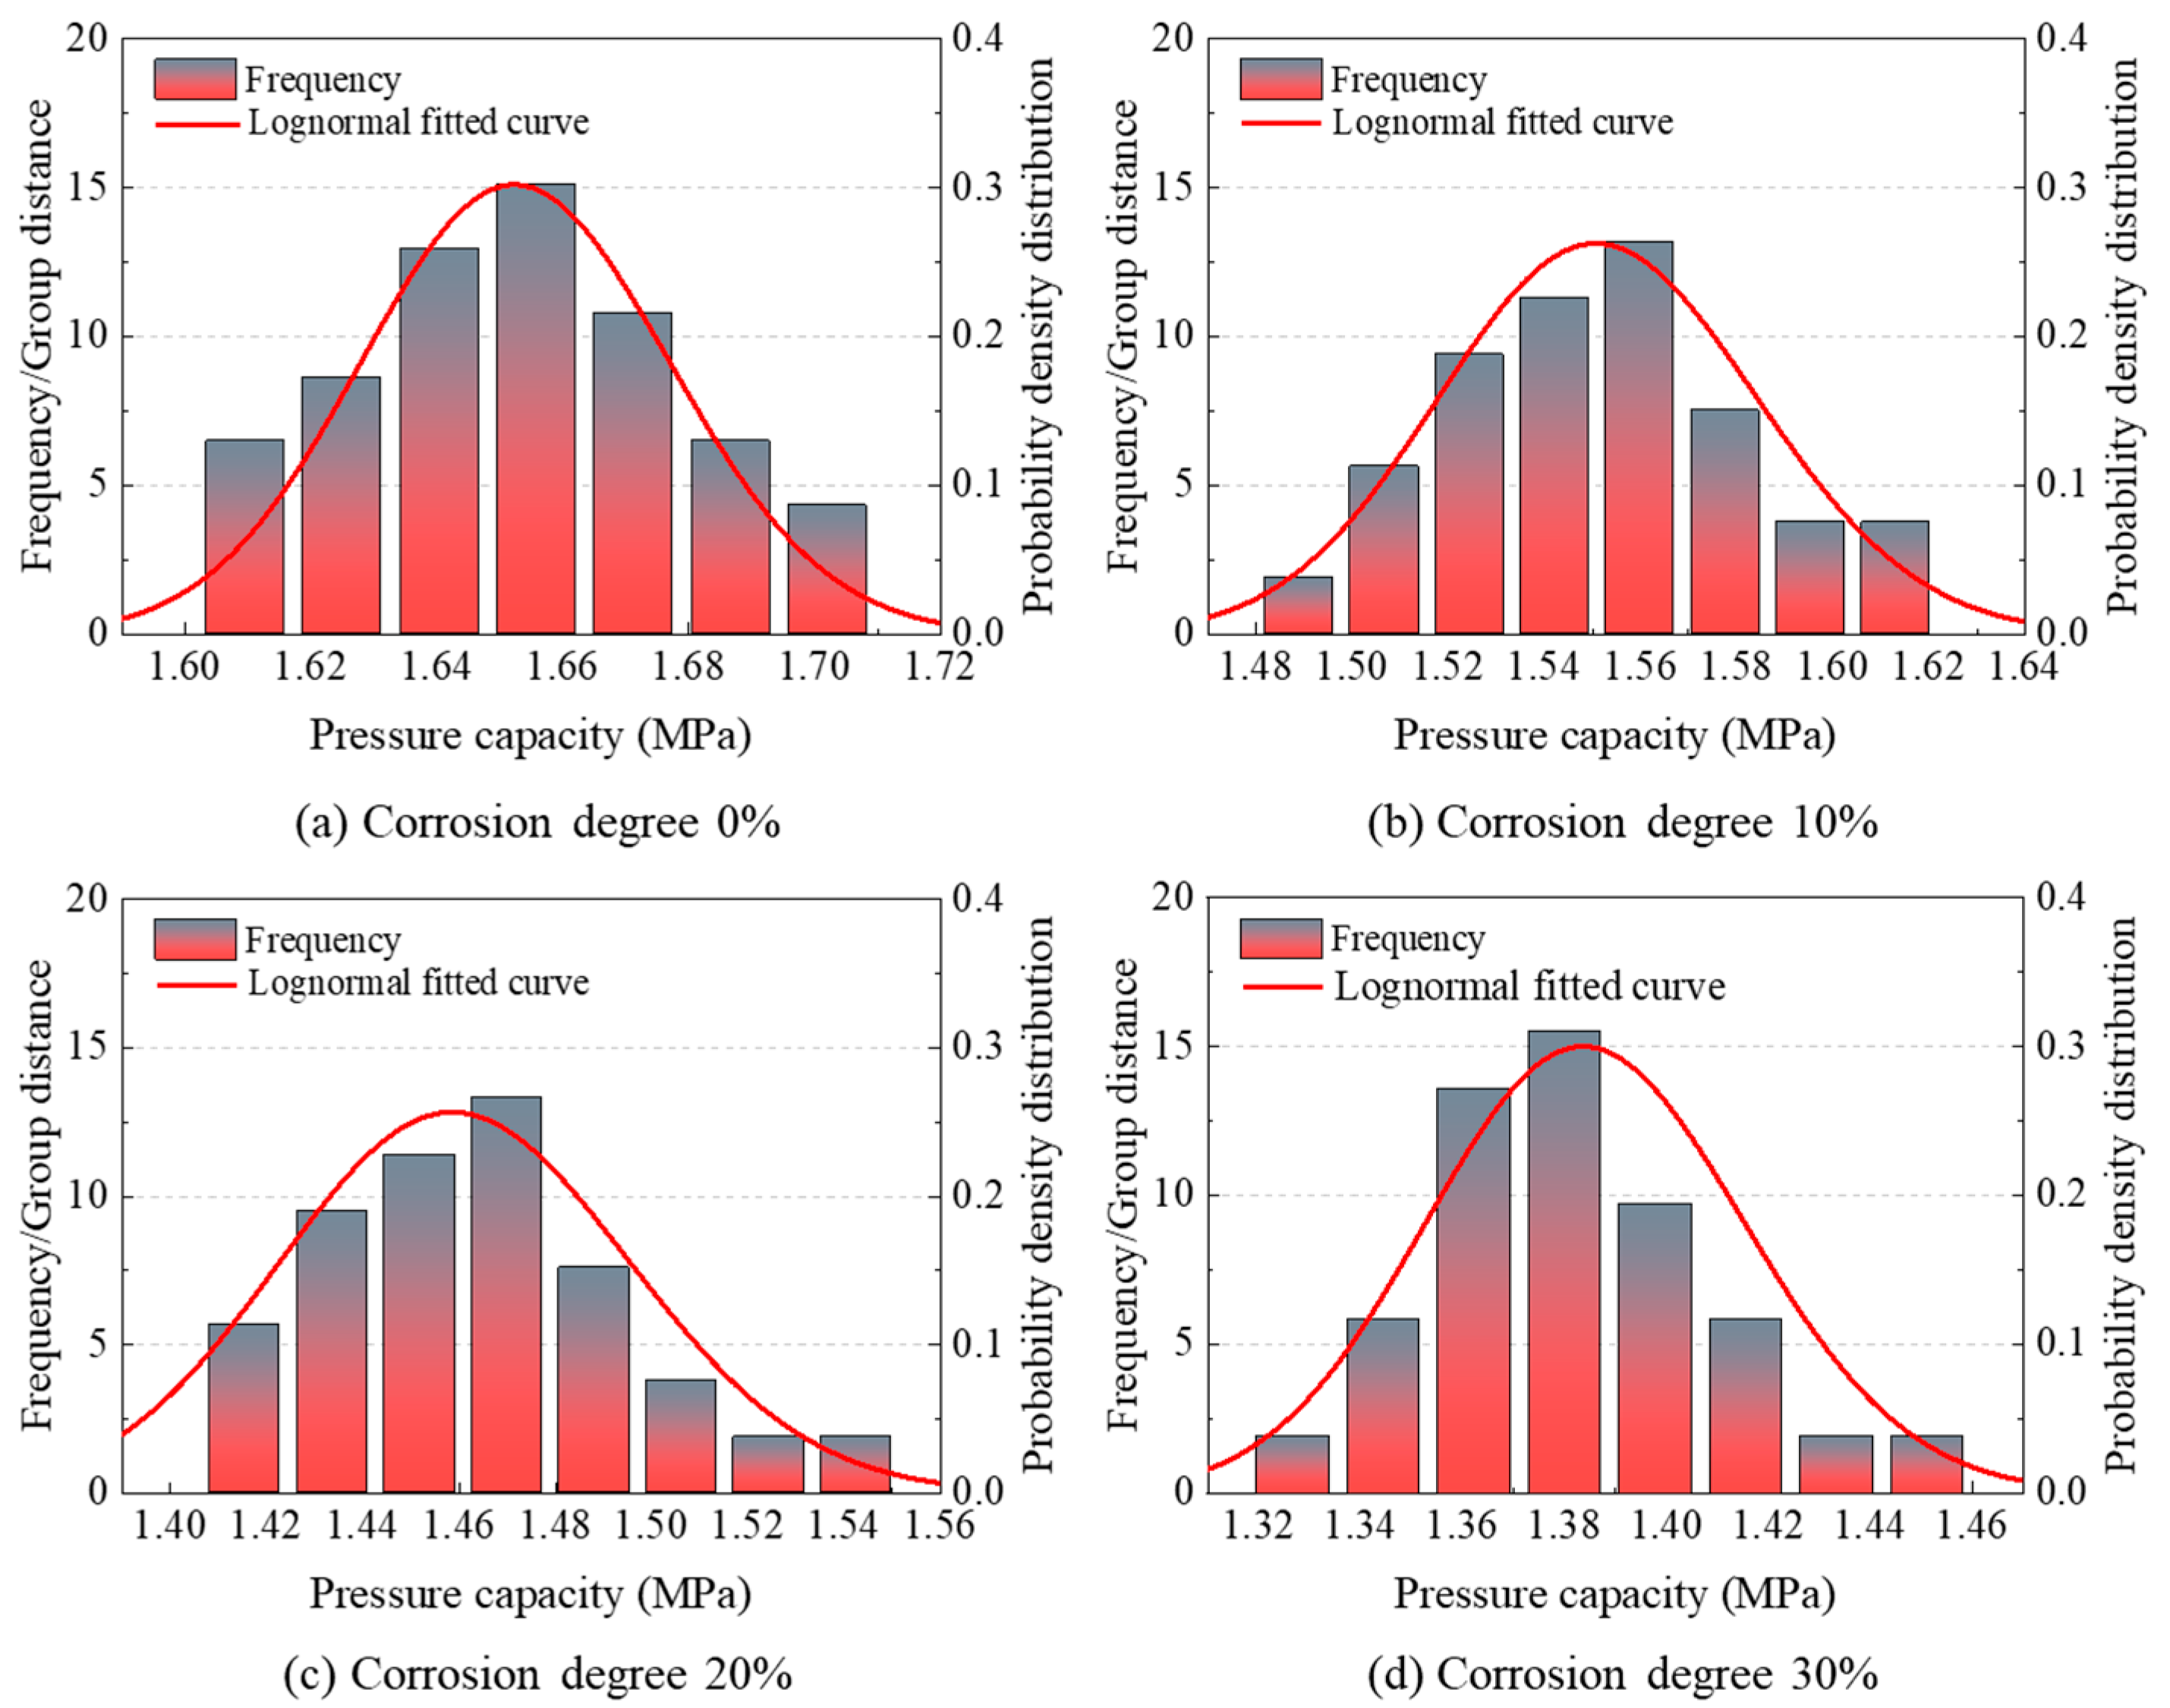
5.2.1. Probability Distribution of the Pressure Capacity of the NCS
5.2.2. Fragility Curves of the NCS
5.2.3. HCLPF Capacity of the NCS
5.3. Leakage Risk Assessment
5.3.1. Probabilistic Safety Margin
5.3.2. Total Probability of Failure
6. Conclusions
- (1)
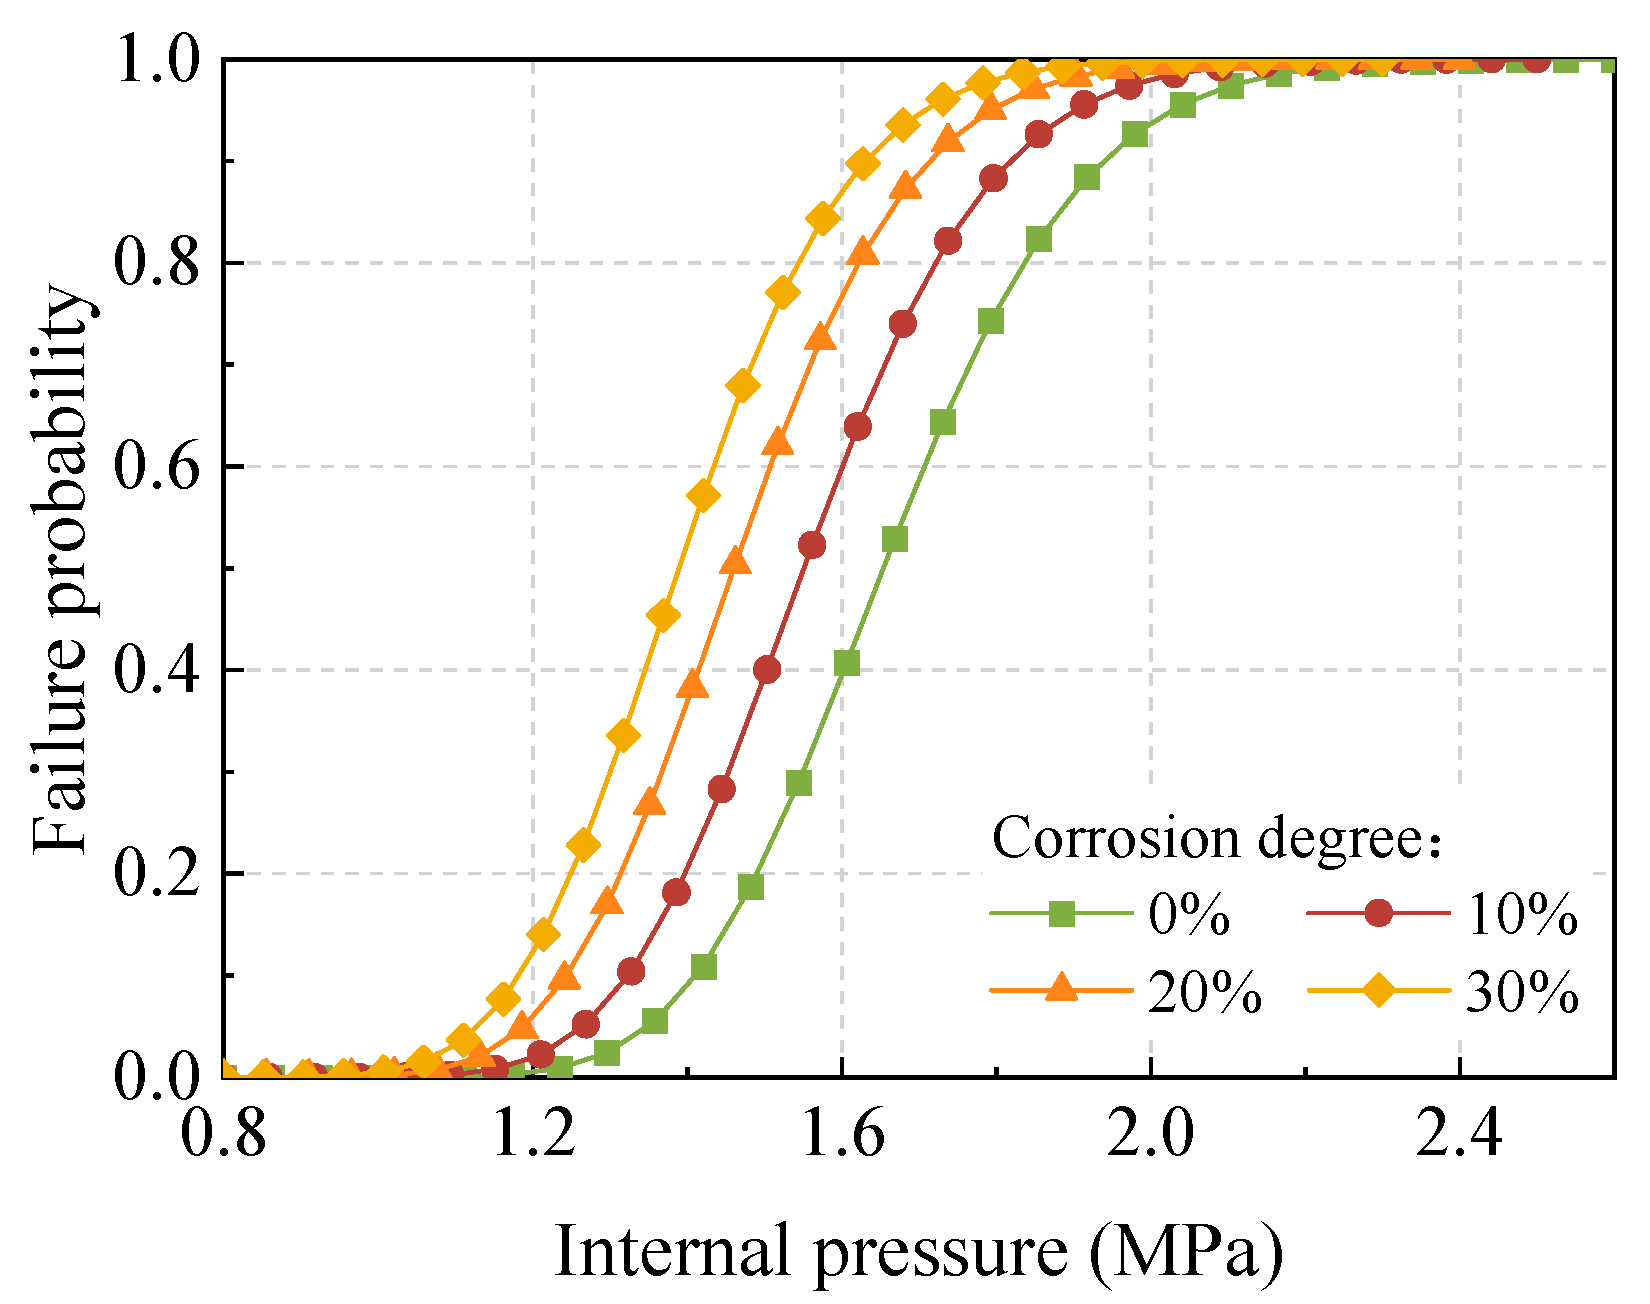
- The fragility curve of the NCS under LOCA conditions gradually moves to the left as the corrosion degree of the liner increases, which indicates that the risk of containment leakage increases under the same internal pressure.
- (2)
- The NCS under liner corrosion conditions is susceptible to functional failure at lower levels of accident pressure. Compared to the uncorroded case, the median pressure capacity of the NCS with 10%, 20%, and 30% corrosion degrees is reduced by 6.26%, 11.72%, and 16.02%, respectively.
- (3)
- The HCLPF capacity reflects the most conservative pressure capacity of the NCS. Compared with the uncorroded case, the HCLPF capacity of the NCS with 10%, 20%, and 30% corrosion degrees of the liner is reduced by 6.79%, 12.83%, and 17.35%, respectively, which is slightly higher than the reduction rates calculated based on the median pressure capacity.
- (4)
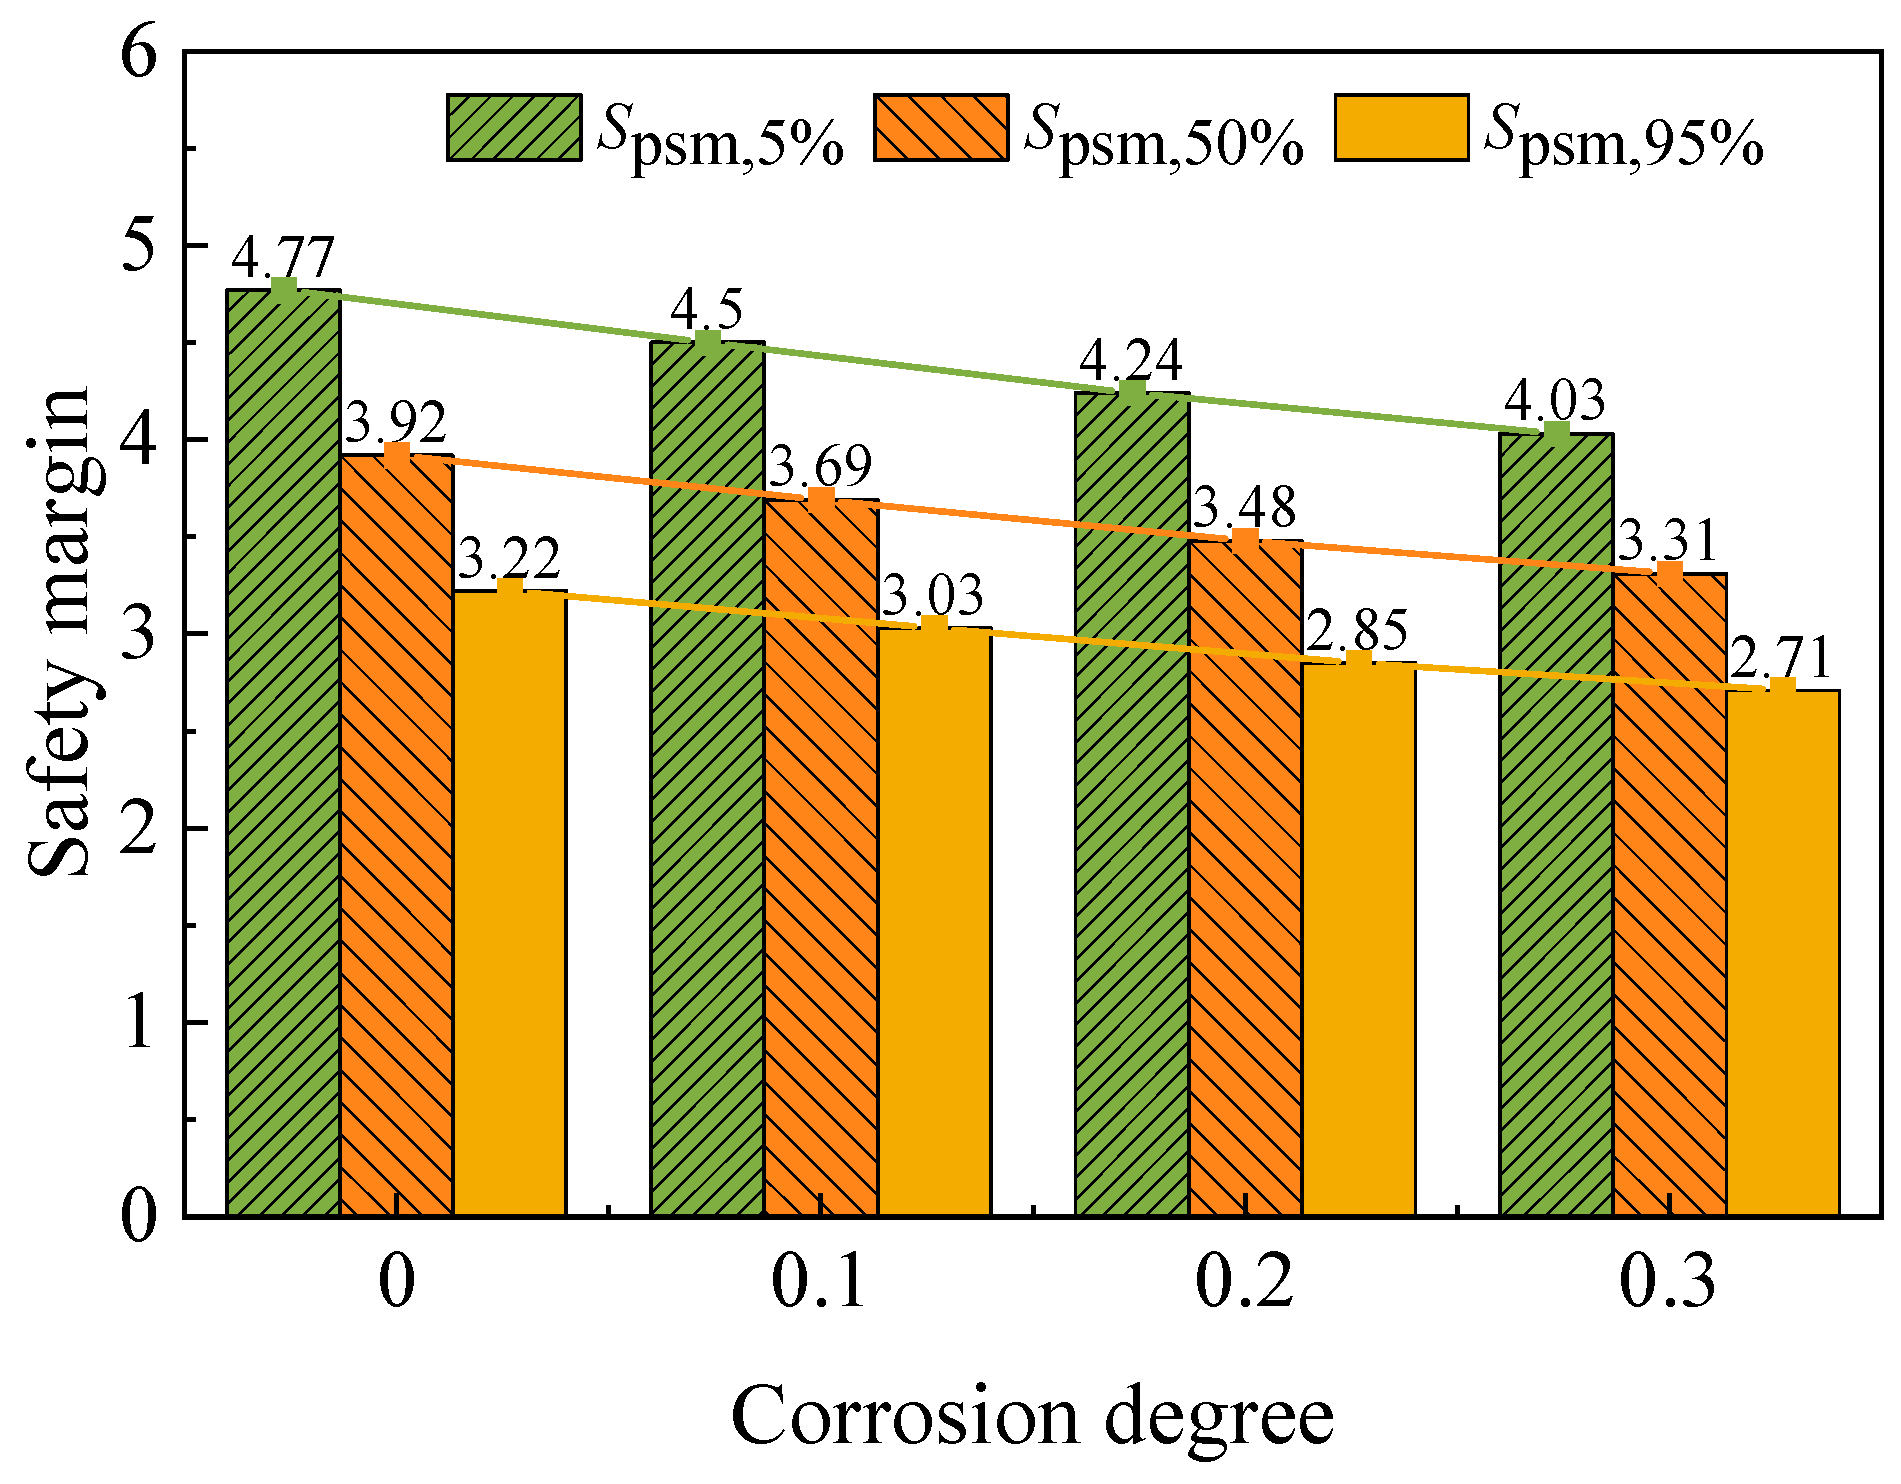
- The probabilistic safety margin gradually decreases as the corrosion degree and confidence level increase. When the corrosion degree reaches 30%, the probabilistic safety margin with a 95% confidence level drops to 2.7.
- (5)
- Liner corrosion can significantly increase the total probability of failure of the NCS under LOCA conditions. Within the scope of this paper, the investigated NCS can fulfill the probabilistic safety requirements.
Author Contributions
Funding
Institutional Review Board Statement
Informed Consent Statement
Data Availability Statement
Conflicts of Interest
Appendix A

| fc | f335 | E335 | f400 | E400 | fp | Ep | fs | Es |
|---|---|---|---|---|---|---|---|---|
| 53.95 | 412.14 | 195,953.9 | 390.39 | 209,923.8 | 1869.47 | 188,789.2 | 320.35 | 202,368.1 |
| 51.78 | 424.46 | 194,770.9 | 449.46 | 202,622.1 | 1777.45 | 199,473.4 | 316.26 | 204,811.5 |
| 36.53 | 373.86 | 195,493.7 | 411.31 | 205,194.2 | 1886.82 | 194,023.5 | 312.51 | 197,666.7 |
| 55.35 | 344.27 | 199,883.2 | 459.56 | 199,662.3 | 1796.41 | 186,391.2 | 283.03 | 199,276.9 |
| 39.66 | 384.3 | 199,147.4 | 445.75 | 192,487.3 | 1819.6 | 198,174.6 | 326.73 | 201,879.5 |
| 49.94 | 387.65 | 201,158.5 | 438.34 | 208,356.7 | 1834.01 | 197,708.1 | 300.6 | 205,878.8 |
| 38.76 | 318.35 | 202,968.9 | 426.72 | 199,219.5 | 1844.34 | 183,712.1 | 354.87 | 189,230.3 |
| 46.2 | 367.35 | 197,469.4 | 444.34 | 190,751.9 | 1873.38 | 195,027.4 | 345.8 | 200,398.1 |
| 42.95 | 381.37 | 210,406.4 | 418 | 196,763.5 | 1880.3 | 196,263.6 | 305.08 | 194,952.5 |
| 35.84 | 375.08 | 200,134 | 453.14 | 207,073.7 | 1902.39 | 202,488.3 | 295.56 | 194,633.8 |
| 40.27 | 391.91 | 213,003.1 | 435.19 | 211,545.4 | 1827.75 | 193,693.1 | 289.51 | 209,357.9 |
| 44.63 | 380.34 | 201,810 | 424.7 | 204,188.8 | 1863.66 | 205,089.5 | 341.48 | 193,913.1 |
| 45.12 | 358.63 | 202,567.4 | 412.1 | 200,140.3 | 1855.71 | 201,687.8 | 307.67 | 186,227.7 |
| 45.79 | 396.18 | 191,617.3 | 470.74 | 204,752.4 | 1822.84 | 208,752.5 | 338.15 | 204,366.6 |
| 41.95 | 412.6 | 207,108.3 | 439.95 | 201,717.4 | 1896.2 | 190,862.9 | 359.37 | 196,453.6 |
| 42.24 | 366.19 | 188,008.1 | 422.56 | 200,972.7 | 1847.3 | 191,538.7 | 318.79 | 196,047.8 |
| 46.44 | 401.56 | 206,127.6 | 456.82 | 203,265.1 | 1916.91 | 191,970.1 | 350.99 | 208,858.6 |
| 50.97 | 333.47 | 193,139.5 | 460.08 | 201,211.2 | 1749.98 | 188,763.3 | 342.68 | 201,428.6 |
| 43.13 | 398.63 | 197,211 | 476.99 | 196,037.9 | 1837.85 | 200,264 | 329.37 | 192,745.6 |
| 48.99 | 361.68 | 198,796.7 | 416.97 | 198,122.3 | 1838.64 | 200,940.1 | 333.69 | 205,215.4 |
| 30.71 | 406.69 | 205,705.8 | 433.92 | 193,788.8 | 1858.64 | 194,732.9 | 328.34 | 200,639.4 |
| 33.63 | 350.32 | 207,932.9 | 430.21 | 206,521.1 | 1911.11 | 192,667 | 323.42 | 198,891.7 |
| 37.86 | 348.14 | 196,594.7 | 420.06 | 191,234.2 | 1808.7 | 180,479.4 | 369.89 | 206,893.3 |
| 43.82 | 444.17 | 204,084.2 | 466.64 | 197,295.4 | 1875.59 | 186,966.1 | 310.3 | 197,005.6 |
| 41.41 | 364.45 | 204,723.8 | 430.84 | 202,362.1 | 1932.24 | 196,983.2 | 323.01 | 203,184.2 |
| 40.38 | 392.55 | 200,521.8 | 447.92 | 186,365.4 | 1803.17 | 195,568.6 | 332 | 202,798.9 |
| 36.93 | 385.84 | 198,085.9 | 437.44 | 194,661 | 1770.61 | 193,101.5 | 313.76 | 198,284 |
| 47.62 | 355.03 | 190,018.8 | 441.72 | 197,560.4 | 1794.57 | 198,805.1 | 298.79 | 192,089.3 |
| 48.4 | 377.85 | 203,567.3 | 401.54 | 195,064.7 | 1812.53 | 189,614.6 | 335.07 | 199,510.6 |
| 33.26 | 370.08 | 194,046 | 406.96 | 198,574.6 | 1852.56 | 204,551.7 | 347.35 | 212,671.2 |
References
- Shah, V.N.; Hookham, C.J. Long-Term Aging of Light Water Reactor Concrete Containments. Nucl. Eng. Des. 1998, 185, 51–81. [Google Scholar] [CrossRef]
- Hora, Z.; Patzák, B. Analysis of Long-Term Behaviour of Nuclear Reactor Containment. Nucl. Eng. Des. 2007, 237, 253–259. [Google Scholar] [CrossRef]
- Lundqvist, P.; Nilsson, L.-O. Evaluation of Prestress Losses in Nuclear Reactor Containments. Nucl. Eng. Des. 2011, 241, 168–176. [Google Scholar] [CrossRef]
- Hu, H.T.; Lin, J.X. Ultimate Analysis of PWR Prestressed Concrete Containment under Long-Term Prestressing Loss. Ann. Nucl. Energy 2016, 87, 500–510. [Google Scholar] [CrossRef]
- Alhanaee, S.; Yi, Y.; Schiffer, A. Ultimate Pressure Capacity of Nuclear Reactor Containment Buildings under Unaged and Aged Conditions. Nucl. Eng. Des. 2018, 335, 128–139. [Google Scholar] [CrossRef]
- Saouma, V.E.; Hariri-Ardebili, M.A. Seismic Capacity and Fragility Analysis of an ASR-Affected Nuclear Containment Vessel Structure. Nucl. Eng. Des. 2019, 346, 140–156. [Google Scholar] [CrossRef]
- Kim, S.H.; Choi, M.S.; Joung, J.Y.; Kim, K.S. Long-Term Reliability Evaluation of Nuclear Containments with Tendon Force Degradation. Nucl. Eng. Des. 2013, 265, 582–590. [Google Scholar] [CrossRef]
- Francesco, D.M.; Matteo, F.; Carlo, G.; Federico, P.; Enrico, Z. Time-Dependent Reliability Analysis of the Reactor Building of a Nuclear Power Plant for Accounting of Its Aging and Degradation. Reliab. Eng. Syst. Saf. 2021, 205, 107173. [Google Scholar] [CrossRef]
- Hessheimer, M.F.; Klamerus, E.W.; Lambert, L.D.; Rightley, G.S.; Dameron, R.A. Overpressurization Test of a 1:4-Scale Prestressed Concrete Containment Vessel Model; Nuclear Regulatory Commission: Washington, DC, USA, 2003. [Google Scholar]
- Hanson, N.W.; Schultz, D.M.; Roller, J.J.; Azizinamini, A.; Tang, H.T. Testing of Large-Scale Concrete Containment Structural Elements. Nucl. Eng. Des. 1987, 100, 129–149. [Google Scholar] [CrossRef]
- Hanson, N.W.; Schultz, D.M.; Roller, J.J.; Tang, H.T. Results of Large-Scale Test of Discontinuity Region in a Prestressed Concrete Containment. Nucl. Eng. Des. 1987, 104, 321–328. [Google Scholar] [CrossRef]
- Petti, J.P.; Spencer, B.W.; Graves, H.L., III. Risk-Informed Assessment of Degraded Containment Vessels. Nucl. Eng. Des. 2008, 238, 2038–2047. [Google Scholar] [CrossRef]
- Anderson, P. Concentration of Plastic Strains in Steel Liners Due to Concrete Cracks in the Containment Wall. Int. J. Press. Vessel. Pip. 2008, 85, 711–719. [Google Scholar] [CrossRef]
- Cherry, J.L.; Smith, J.A. Capacity of Steel and Concrete Containment Vessels with Corrosion Damage; Sandia National Laboratories: Albuquerque, NM, USA, 2001. [Google Scholar]
- Smith, J.A.; Cherry, J.L. Analyses of a Reinforced Concrete Containment with Liner Corrosion Damage; Saiadia National Laboratories: Albuquerque, NM, USA, 1999. [Google Scholar]
- Spencer, B.W.; Petti, J.P.; Kunsman, D.M. Risk-Informed Assessment of Degraded Containment Vessels; Nuclear Regulatory Commission: Washington, DC, USA, 2006. [Google Scholar]
- Zhou, Z.; Wu, C.; Meng, S.P.; Wu, J. Mechanical Analysis for Prestressed Concrete Containment Vessels under Loss of Coolant Accident. Comput. Concr. 2014, 14, 127–143. [Google Scholar] [CrossRef]
- Klamerus, E.W.; Bohn, M.P.; Wesley, D.A.; Krishnanswamy, C.N. Containment Performance of Prototypical Reactor Containments Subjected to Severe Accident Conditions; Nuclear Regulatory Commission: Washington, DC, USA, 1996. [Google Scholar]
- Zubair, M.; Zhang, Z.; Khan, S.U.D. Calculation and Updating of Reliability Parameters in Probabilistic Safety Assessment. J. Fusion Energy 2010, 30, 13–15. [Google Scholar] [CrossRef]
- Cho, J.; Lee, S.H.; Bang, Y.S.; Lee, S.; Park, S.Y. Exhaustive Simulation Approach for Severe Accident Risk in Nuclear Power Plants: OPR-1000 Full-Power Internal Events. Reliab. Eng. Syst. Saf. 2022, 225, 108580. [Google Scholar] [CrossRef]
- Dunn, D.S.; Pulvirenti, A.L.; Hiser, M.A. Containment Liner Corrosion Operating Experience Summary Technical Letter Report—Revision 1; U.S. Nuclear Regulatory Commission Office of Nuclear Regulatory Research: Washington, DC, USA, 2011. [Google Scholar]
- Paek, Y.; Kim, S.; Yoon, E. Introduction of Containment Liner Plate (CLP) Corrosion. In Proceedings of the Transactions of the Korean Nuclear Society Spring Meeting, Jeju, Republic of Korea, 17–18 May 2018. [Google Scholar]
- Petti, J.P.; Naus, D.; Sagüés, A.; Weyers, R.E.; Erler, B.A.; Berke, N.S.; Sandia National Laboratories. Nuclear Containment Steel Liner Corrosion Workshop: Final Summary and Recommendation Report; Sandia National Laboratories: Albuquerque, NM, USA, 2011. [Google Scholar]
- Li, X.; Gong, J. Effects of Steel Liner Corrosion on the Leak-Tightness of Prestressed Concrete Containment Structure under Severe Accident Loads. Ann. Nucl. Energy 2023, 180, 109487. [Google Scholar] [CrossRef]
- Birtel, V.; Mark, P. Parameterised Finite Element Modelling of RC Beam Shear Failure. In Proceedings of the 19th Annual International ABAQUS Users Conference, Cambridge, MA, USA, 23–25 May 2006. [Google Scholar]
- Wang, Z.; Yan, J.; Lin, Y.; Fang, T.; Ma, J. Study on Failure Mechanism of Prestressed Concrete Containments Following a Loss of Coolant Accident. Eng. Struct. 2020, 202, 109860. [Google Scholar] [CrossRef]
- EN-1992-1-1:2010; Design of Concrete Structures-Part 1-2: General Rules-Structural Fire Design. The European Union: Brussels, Belgium, 2010.
- Tong, L.; Zhou, X.; Cao, X. Ultimate Pressure Bearing Capacity Analysis for the Prestressed Concrete Containment. Ann. Nucl. Energy 2018, 121, 582–593. [Google Scholar] [CrossRef]
- Hessheimer, M.F.; Dameron, R.A. Containment Integrity Research at Sandia National Laboratories; Sandia National Laboratories: Albuquerque, NM, USA, 2006. [Google Scholar]
- Anderson, P. Analytic Study of the Steel Liner near the Equipment Hatch in a 1:4 Scale Containment Model. Nucl. Eng. Des. 2008, 238, 1641–1650. [Google Scholar] [CrossRef]
- Dameron, R.A.; Zhang, L.; Rashid, Y.R.; Vargas, M.S. Pretest Analysis of a 1:4-Scale Prestressed Concrete Containment Vessel Model; Nuclear Regulatory Commission: Washington, DC, USA, 2000. [Google Scholar]
- Li, X.; Gong, J. Probabilistic Evaluation of the Leak-Tightness Function of the Nuclear Containment Structure Subjected to Internal Pressure. Reliab. Eng. Syst. Saf. 2024, 241, 109684. [Google Scholar] [CrossRef]
- Su, L.; Li, X.X.; Jiang, Y.Y. Comparison of Methodologies for Seismic Fragility Analysis of Unreinforced Masonry Buildings Considering Epistemic Uncertainty. Eng. Struct. 2020, 205, 110059. [Google Scholar] [CrossRef]
- GB50010-2010; Code for Design of Concrete Structures. The Ministry of Construction of the People’s Republic of China: Beijing, China, 2015.
- Balomenos, G.P.; Pandey, M.D. Probabilistic Finite Element Investigation of Prestressing Loss in Nuclear Containment Wall Segments. Nucl. Eng. Des. 2017, 311, 50–59. [Google Scholar] [CrossRef]
- Lilliefors, H.W. On the Kolmogorov-Smirnov Test for Normality with Mean and Variance Unknown. J. Am. Stat. Assoc. 1967, 62, 399–402. [Google Scholar] [CrossRef]
- Huang, Y.; Whittaker, A.S.; Luco, N. A Probabilistic Seismic Risk Assessment Procedure for Nuclear Power Plants: (I) Methodology. Nucl. Eng. Des. 2011, 241, 3996–4003. [Google Scholar] [CrossRef]
- Hoseyni, S.M.; Hoseyni, S.M.; Yousefpour, F.; Karimi, K. Probabilistic Analysis of Containment Structural Performance in Severe Accidents. Int. J. Syst. Assur. Eng. Manag. 2016, 8, 625–634. [Google Scholar] [CrossRef]
- RCC-CW-2015; Rules for Design and Construction of PWR Nuclear Civil Works. French Association for Design, Construction and In- Service Inspection Rules for Nuclear Island Components: Paris, France, 2015.
- Mandal, T.K.; Ghosh, S.; Pujari, N.N. Seismic Fragility Analysis of a Typical Indian PHWR Containment: Comparison of Fragility Models. Struct. Saf. 2016, 58, 11–19. [Google Scholar] [CrossRef]


| Ψ | Kc | λ | fb0/fc | μ |
|---|---|---|---|---|
| 38° | 0.6667 | 0.1 | 1.16 | 0.005 |
| Random Variable | Mean (MPa) | Coefficient of Variation | Probability Distribution |
|---|---|---|---|
| 42.9 | 0.149 | Normal | |
| 378.6 | 0.05 | Normal | |
| 200,000 | 0.03 | Normal | |
| 435.9 | 0.05 | Normal | |
| 200,000 | 0.03 | Normal | |
| 1845.9 | 0.025 | Normal | |
| 195,000 | 0.033 | Normal | |
| 325 | 0.07 | Normal | |
| 200,000 | 0.03 | Normal |
| (%) | (MPa) | Decrease Rate of (%) | |
|---|---|---|---|
| 0 | 1.654 | 0.022 | 0.00 |
| 10 | 1.551 | 0.029 | 6.26 |
| 20 | 1.46 | 0.033 | 11.72 |
| 30 | 1.389 | 0.035 | 16.02 |
(%) | (MPa) | (MPa) | (MPa) | HCLPF (MPa) | Reduction Rate of HCLPF (%) |
|---|---|---|---|---|---|
| 0 | 2.004 | 1.645 | 1.35 | 1.302 | 0 |
| 10 | 1.889 | 1.551 | 1.273 | 1.214 | 6.79 |
| 20 | 1.779 | 1.46 | 1.199 | 1.135 | 12.83 |
| 30 | 1.692 | 1.389 | 1.14 | 1.076 | 17.35 |
| 0% | 10% | 20% | 30% | |
|---|---|---|---|---|
| 0.0024 | 0.0044 | 0.0075 | 0.0114 |
Disclaimer/Publisher’s Note: The statements, opinions and data contained in all publications are solely those of the individual author(s) and contributor(s) and not of MDPI and/or the editor(s). MDPI and/or the editor(s) disclaim responsibility for any injury to people or property resulting from any ideas, methods, instructions or products referred to in the content. |
© 2024 by the authors. Licensee MDPI, Basel, Switzerland. This article is an open access article distributed under the terms and conditions of the Creative Commons Attribution (CC BY) license (https://creativecommons.org/licenses/by/4.0/).
Share and Cite
Li, X.; Gong, J. Fragility and Leakage Risk Assessment of Nuclear Containment Structure under Loss-of-Coolant Accident Conditions Considering Liner Corrosion. Appl. Sci. 2024, 14, 2407. https://doi.org/10.3390/app14062407
Li X, Gong J. Fragility and Leakage Risk Assessment of Nuclear Containment Structure under Loss-of-Coolant Accident Conditions Considering Liner Corrosion. Applied Sciences. 2024; 14(6):2407. https://doi.org/10.3390/app14062407
Chicago/Turabian StyleLi, Xinbo, and Jinxin Gong. 2024. "Fragility and Leakage Risk Assessment of Nuclear Containment Structure under Loss-of-Coolant Accident Conditions Considering Liner Corrosion" Applied Sciences 14, no. 6: 2407. https://doi.org/10.3390/app14062407
APA StyleLi, X., & Gong, J. (2024). Fragility and Leakage Risk Assessment of Nuclear Containment Structure under Loss-of-Coolant Accident Conditions Considering Liner Corrosion. Applied Sciences, 14(6), 2407. https://doi.org/10.3390/app14062407