1. Introduction
Multimedia is one of the most influential technological fields today. With the continuous advancement of multimedia technology, people are paying more and more attention to the visual experience. The introduction of advanced sensors has paved the way for the widespread adoption of 3D visual representation models. The digitization of 3D space allows for the exploration of content from any angle [
1,
2,
3,
4,
5]. In addition, numerous innovative models for visual representation have emerged, particularly the video point cloud. A video point cloud consists of frames of point cloud data, which are collections of points in space. Each point is composed of coordinate and attribute information (e.g., texture, reflectance, color, and normal). Because video point clouds are more detailed than 2D representations, they contain a larger amount of data. Point cloud data in its raw format requires a significant amount of memory space and bandwidth [
6]. Even under the conditions of fifth-generation mobile communication technology (5G), if no compression operation is performed, for an uncompressed DPC with one million points in each frame, its bitrate will reach up to 180 MB/s if its frame rate is 30 fps [
7]. This presents significant challenges for data transmission and storage. Therefore, point cloud compression has become a crucial task. Point cloud compression can effectively reduce the amount of data, lower transmission costs, and preserve the integrity of key information, making point cloud technology more widely used in practice. In the fields of virtual reality, augmented reality, autonomous driving, 3D reconstruction, and object detection, point cloud compression can achieve more efficient data transmission and storage, thereby providing a more realistic and immersive experience. Therefore, there is a strong demand for effective point cloud compression technology in various industries [
8,
9,
10,
11,
12,
13]. Its importance and application prospects cannot be ignored, and it is of great significance for technological development and practical application.
MPEG has established standards, including Geometric-based Point Cloud Compression (G-PCC) [
14,
15], and Video-based Point Cloud Compression (V-PCC) [
16,
17]. For G-PCC, the concept is to encode the content directly in 3D space. For V-PCC, MPEG published the Final Draft International Standard for V-PCC in 2020 [
18]. In the draft, the point cloud is projected onto a 2D grid. This idea allows the traditional video compression algorithm to be used for point cloud compression. It achieves the objective of converting 3D data into 2D data for compression and subsequent recovery. MPEG has also developed the corresponding software, test model for category 2 (TMC2), which is still being updated. V-PCC has a high compression ratio with the assistance of a 2D video codec, enabling efficient processing of video point cloud data [
19]. Therefore, this paper focuses on V-PCC.
Although V-PCC has achieved point cloud compression, it also has some limitations. In addition to the 2D video coding load, the process of generating patches through the orthogonal projection of 3D points has the highest computational complexity in the V-PCC encoder. It has been found that refined segmentation treats each voxel equally, resulting in a significantly time-consuming process. At the same time, the size of the generated occupancy map during the point cloud compression process is large, which will result in a decrease in the performance of point cloud compression. To address these issues, we have made enhancements in the refining segmentation and patch packing. The main contributions of this paper can be summarized as follows:
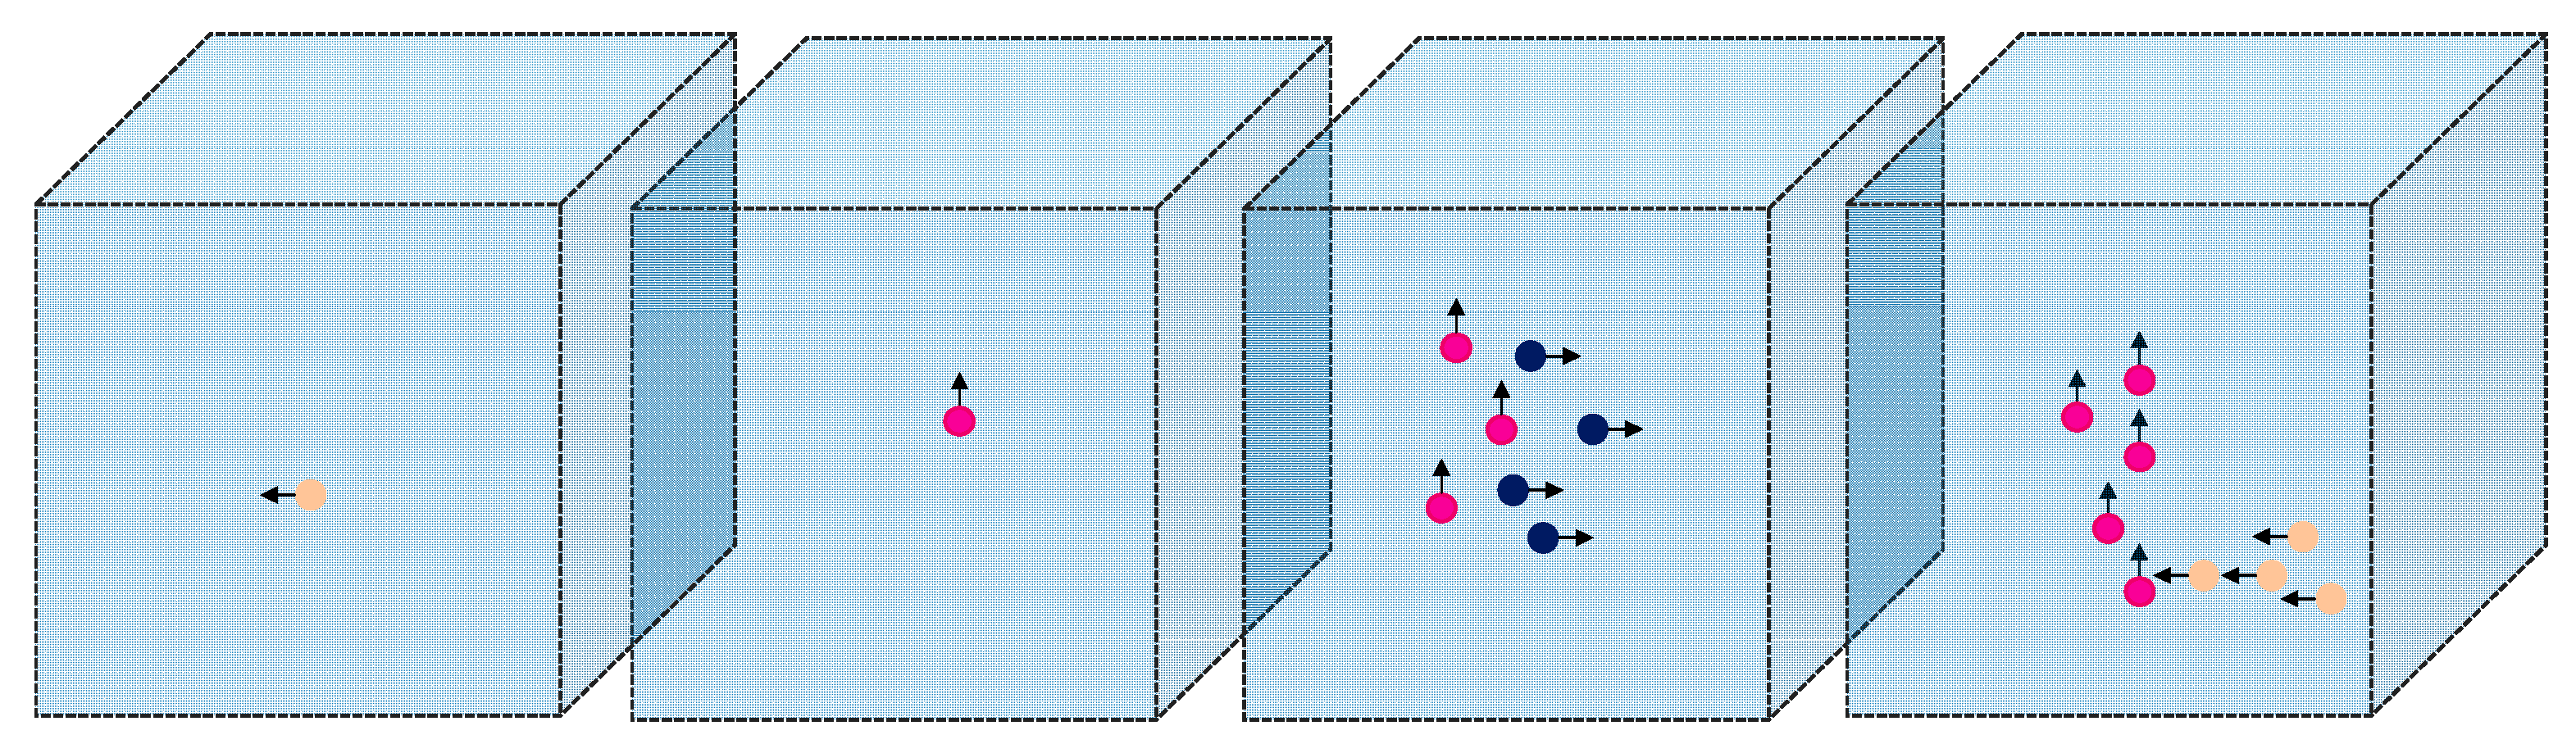
Addressing the issue of a high time-consuming ratio of the refining segmentation module in the patch generation process, we propose the Voxel Selection-based Refining Segmentation (VS-RS). This method introduces a new voxel selection strategy that accurately selects voxels requiring refinement, eliminating the need for subsequent operations on voxels that do not require refinement. The VS-RS can reduce time consumption while ensuring rate–distortion (RD) performance and decreasing computation time by up to 43.50%.
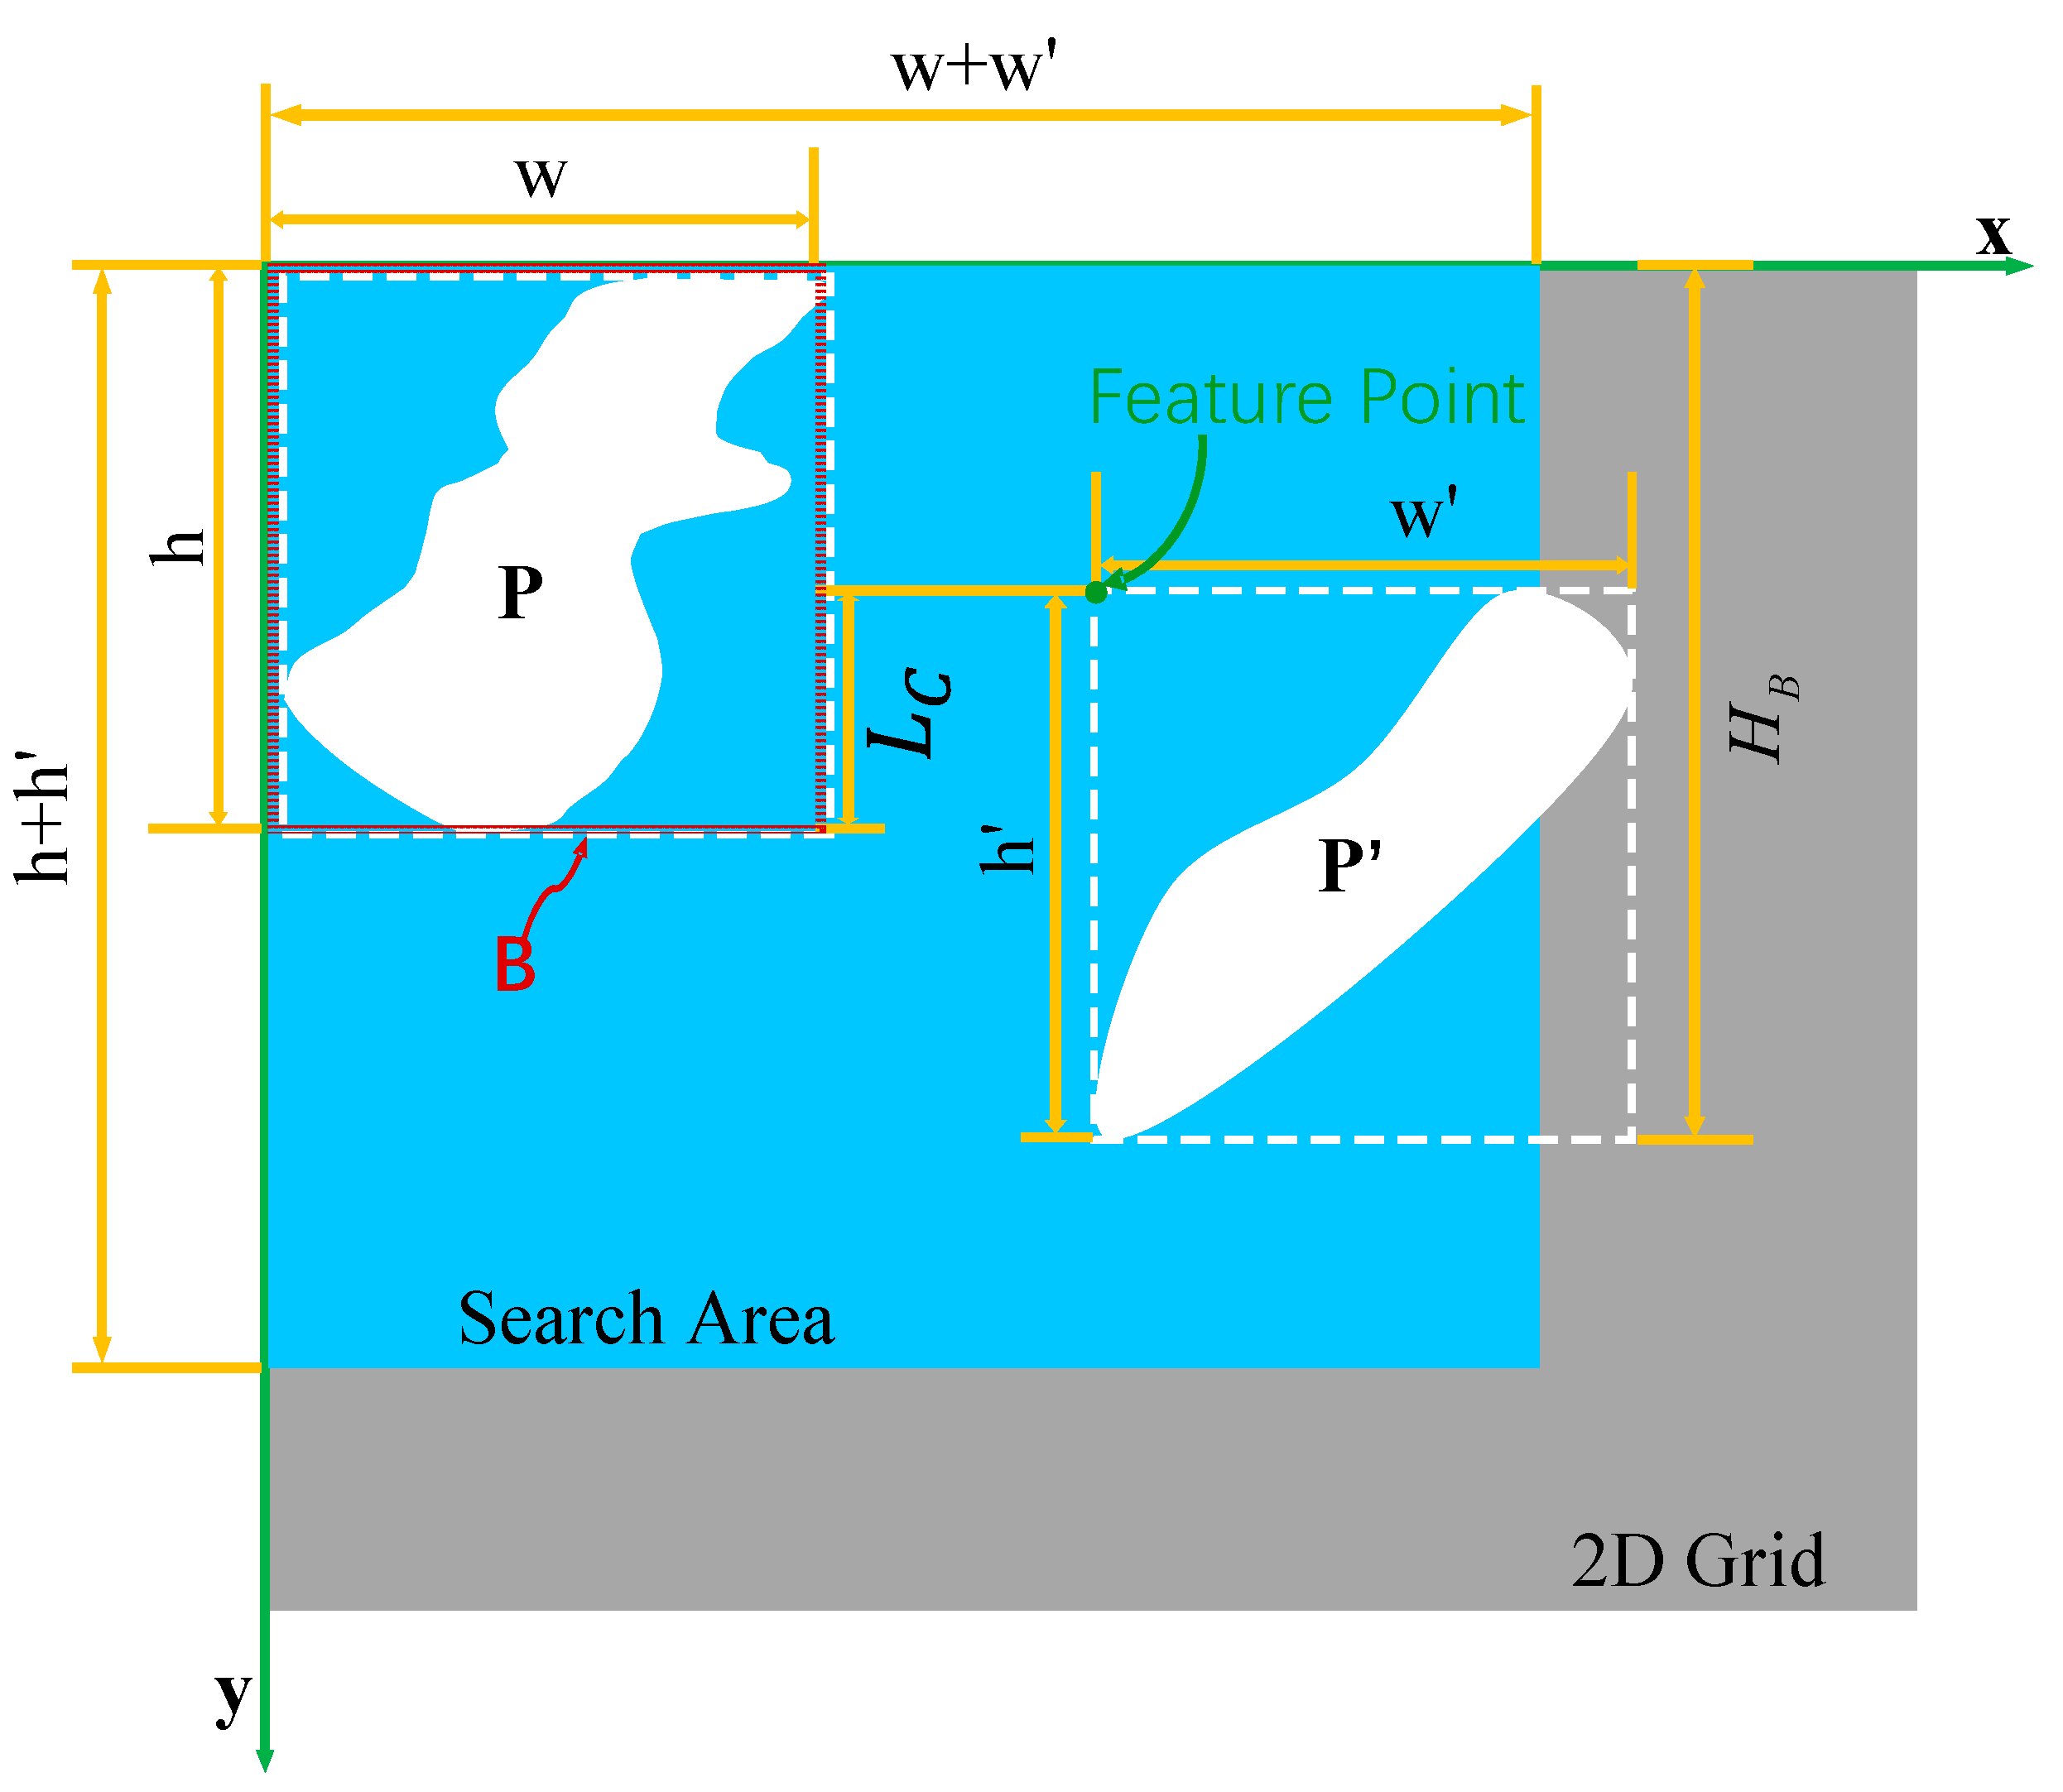
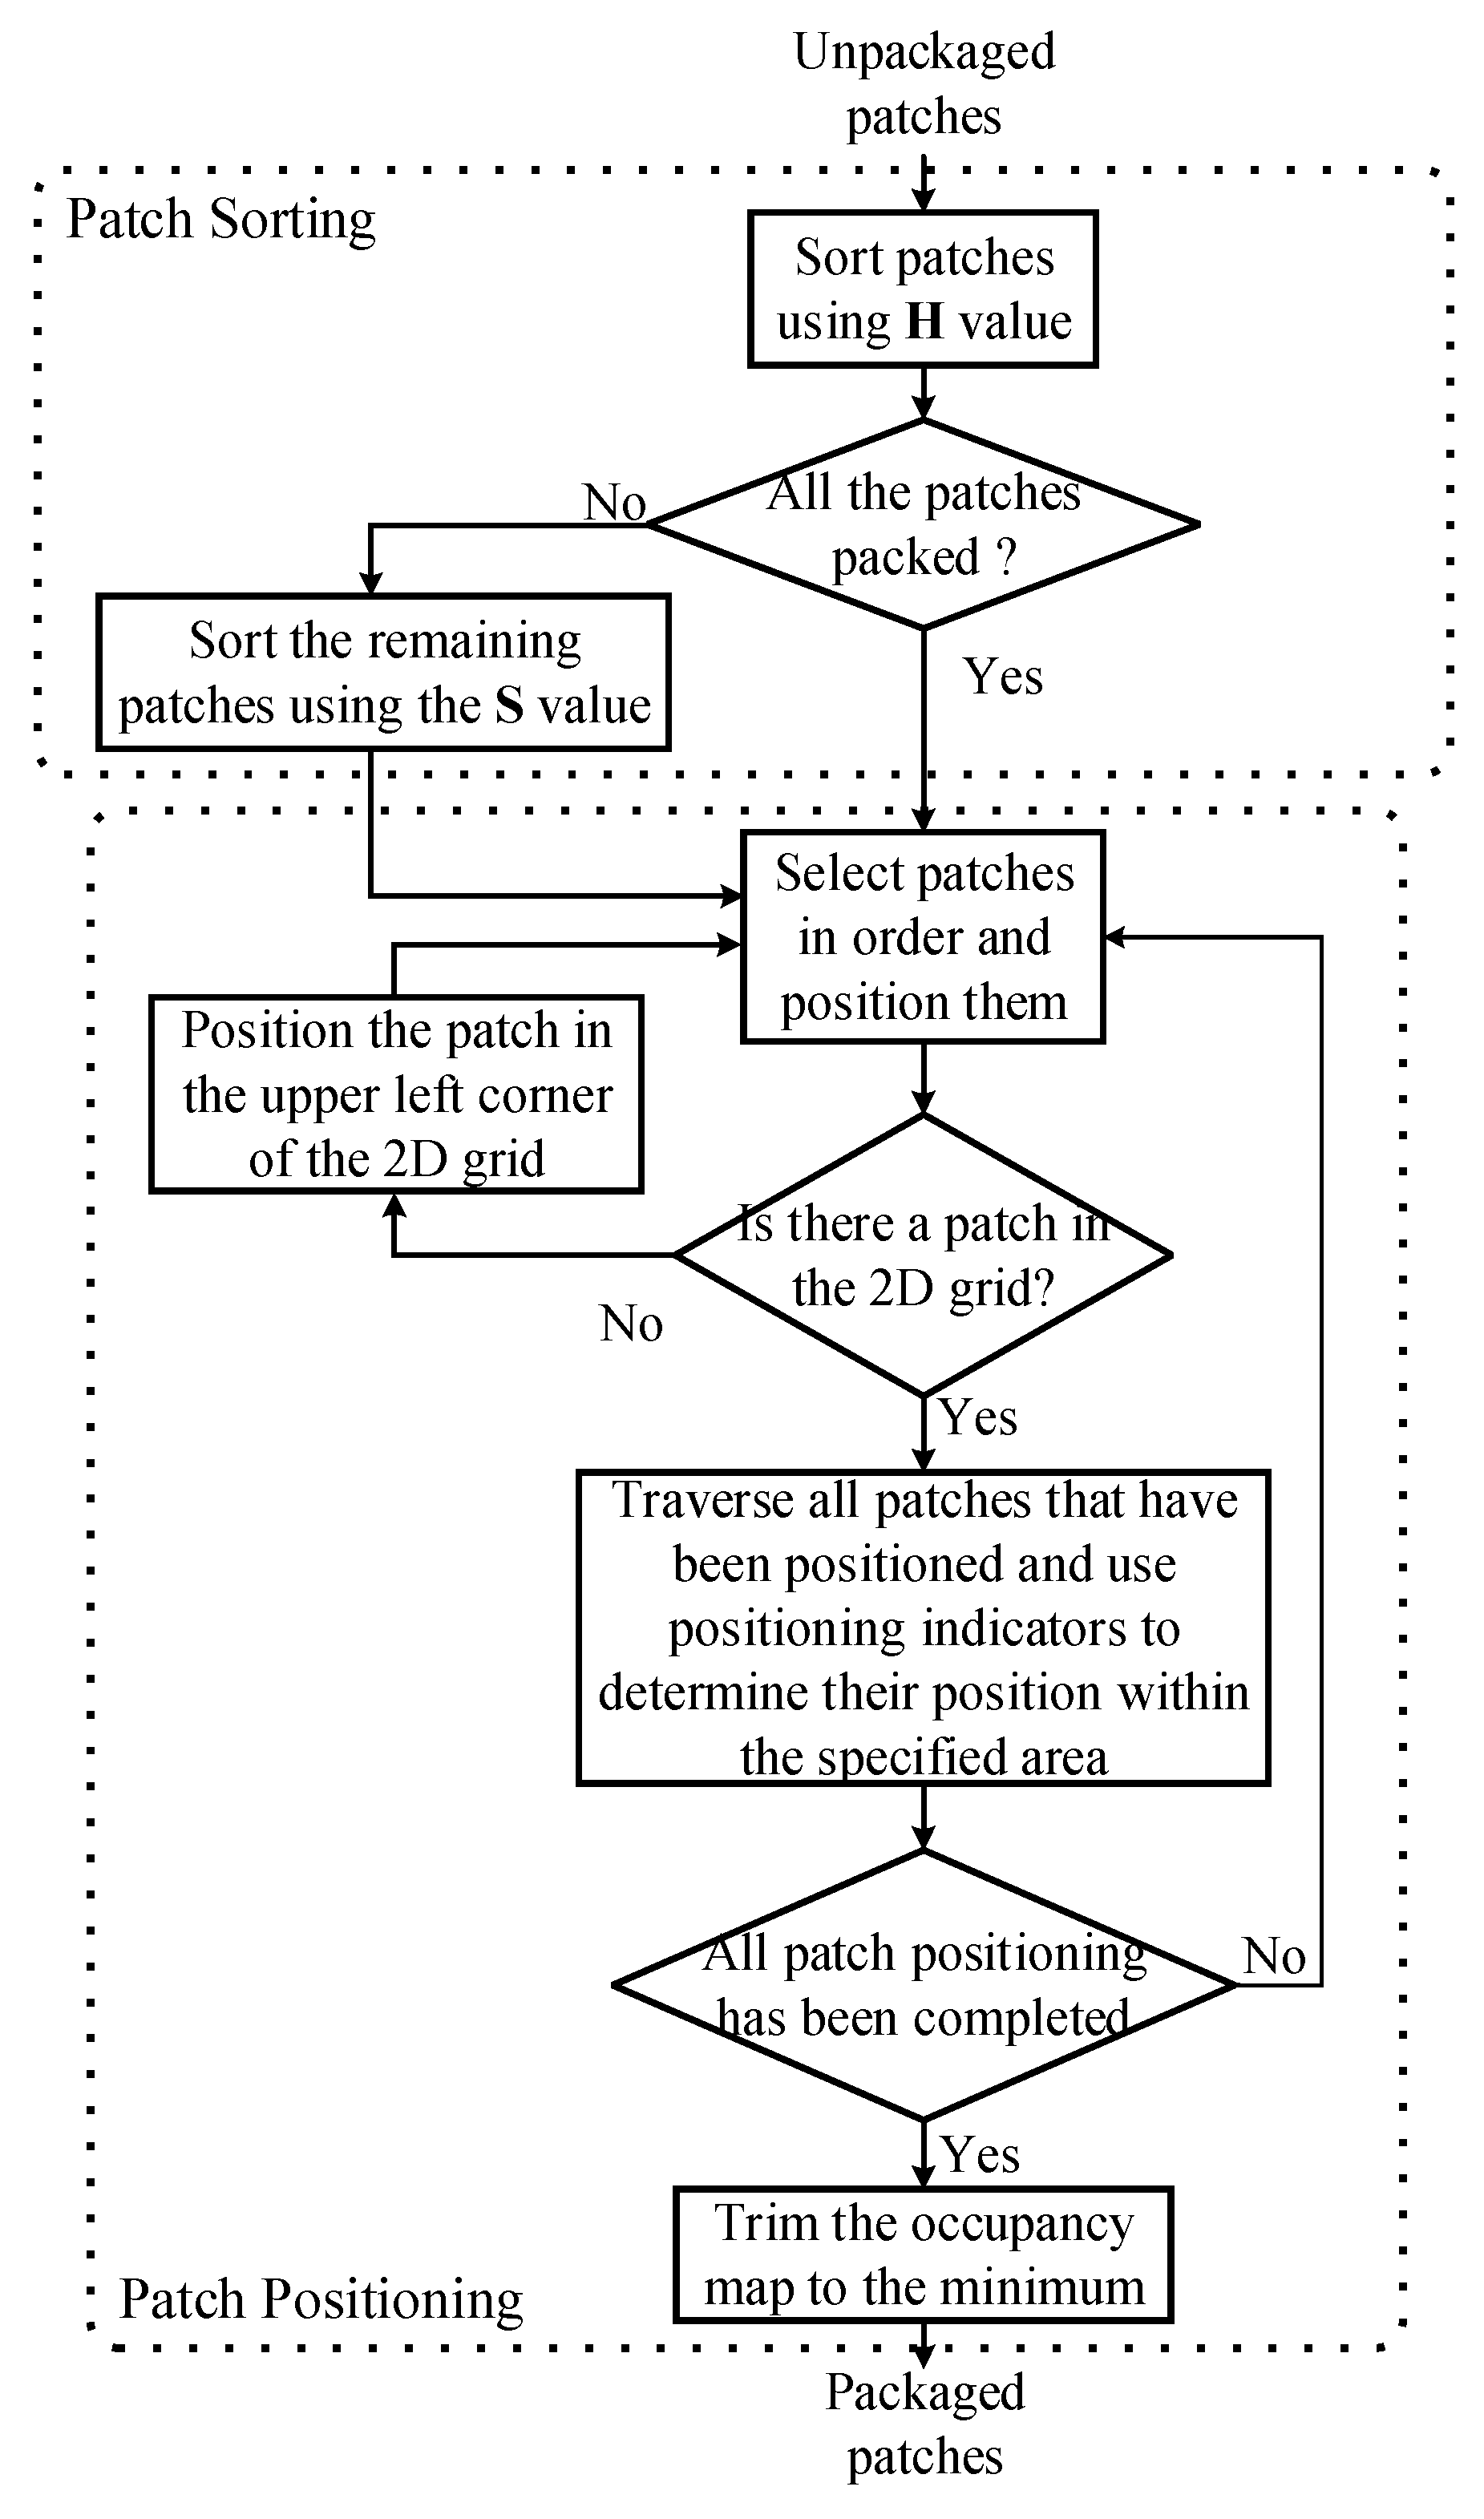
In order to solve the problem of the original patch packaging method generating a lot of unoccupied areas and VS-RS generating additional small patches, this paper proposes a data-adaptive patch packing (DAPP), which includes more detailed sorting and positioning metrics as well as novel packing strategies. The DAPP can reduce the unoccupied size by up to 20.14%. They improve compression performance in a fully compatible manner.
Combining the two methods can lead to a significant improvement in overall performance. Extensive experiments have verified the proposed compression performance, which can save encoding time and achieve a BD-rate gain of −1.58% in the V-PCC benchmark.
In addition to using common testing conditions to test the proposed method, we have also designed new evaluation metrics to measure improved performance.
The remainder of this paper is organized as follows.
Section 2 briefly describes the V-PCC and its related work.
Section 3 first introduces refining segmentation and patch packing and their respective deficiencies, then focuses on the proposed method.
Section 4 shows a series of experimental results obtained from the proposed method.
Section 5 serves as the conclusion of the entire paper.
2. Related Work
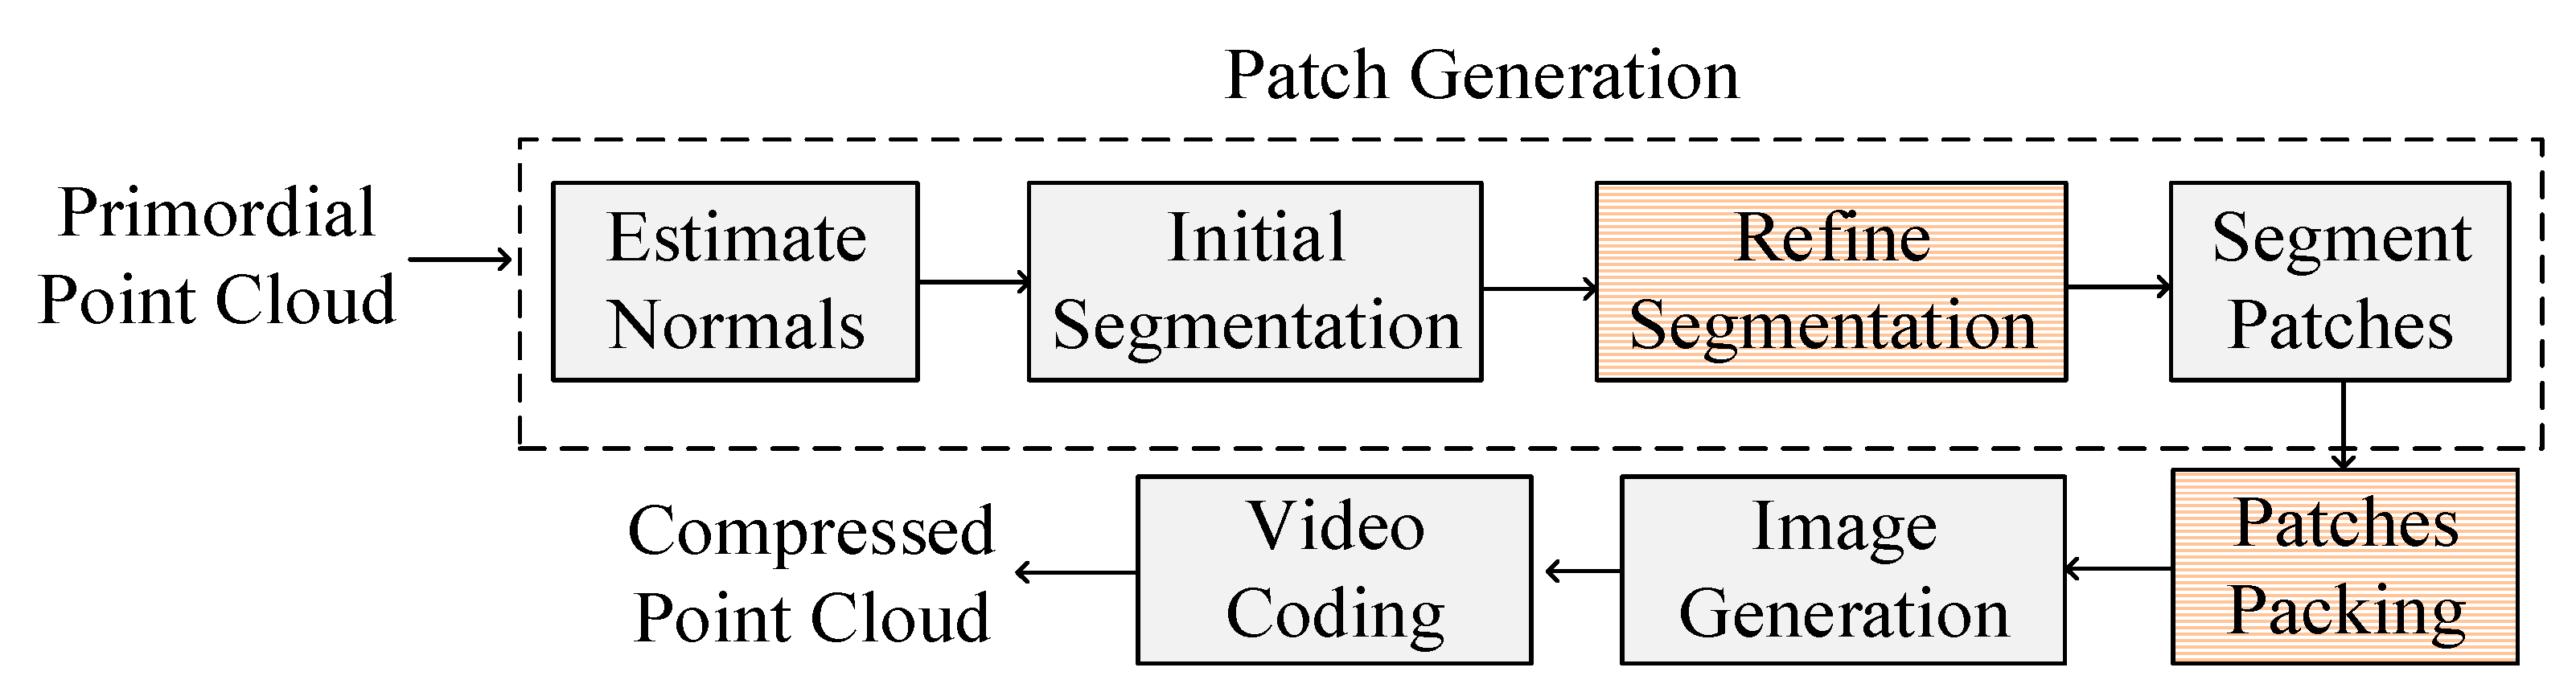
Figure 1 illustrates the encoding process of TMC2 developed based on V-PCC mainly includes four steps: patch generation, patch packaging, image generation, and video encoding.
Patches generation aims to utilize the optimal segmentation strategy for projecting 3D data onto a specified plane and decomposing point cloud frames by converting them into 2D data. In TMC2, the objective of patch generation is to divide the point cloud into groups of patches with smooth boundaries, while also ensuring minimal reconstruction errors. The steps include principal component analysis to obtain the normal vector, initial segmentation of point clouds based on the normal vector, refining segmentation based on smoothing scores, and extraction of patches from connected components [
6]. The area within the dashed line in
Figure 1 represents the patch generation process. The goal of the patch packaging process is to generate geometric and texture images that contribute to video compression. During this process, auxiliary information, such as occupancy maps, will also be generated to indicate effective positions. The occupancy map size should be as small as possible, and the internal patches should be arranged tightly. The image generation process includes optimization operations such as geometric pixel filling, attribute pixel filling, and global allocation. Finally, all the generated images are combined into a video and encoded using HEVC [
19] or other video encoders. This paper focuses on refining segmentation and patch-packing sessions. The details of these two parts will be presented in
Section 3. A comprehensive description of the remaining components of V-PCC can be found in the literature [
11].
Even though MPEG has identified the latest standard, it still has some limitations. Researchers are attempting to enhance coding efficiency by employing various methods, including that of Faramarzi et al. [
20,
21]. A grid-based refining segmentation (G-RS) method was proposed to reduce the complexity of a point-based refining segmentation method, and its performance was evaluated additionally in a dedicated core experiment [
22]. Despite these efforts, the G-RS procedure still accounted for a large time consuming of the V-PCC encoders [
23]. Later, Higa et al. [
24] proposed an optimization method to avoid unnecessary hash map access. Kim et al. [
25,
26] used a voxel classification algorithm to improve the refining segmentation process, and, on this basis, they proposed a radius search method for the FGRS algorithm. However, it brings other problems such as a decrease in the quality of point cloud reduction.
In addition to improving coding efficiency, researchers have also made improvements based on patches. Sheikhipour et al. [
27] estimate the most important patches of the second layer and incorporate them into the patch generation of the first layer. Compared to the single-layer scheme, the proposed method reduces the bit rate, but it also degrades the subjective quality of the point cloud after reduction. Zhu et al. [
28] proposed to optimize the user’s visual experience by allocating more patches related to predefined views and increasing codec time. Li et al. [
29] have proposed a method for decreasing unoccupied pixels among different patches due to the inefficiency of coding unused space during video compression. Rhyl et al. [
30] proposed their method for obtaining a contextual homogeneity-based patch decomposition affecting compression efficiency. However, it does not work on additional attributes such as reflection and material. There are also some other similar methods [
31,
32]. The idea of using patch packaging methods to improve occupancy maps is also worth studying.
4. Experimental Results
This paper aims to reduce time consumption while improving RD performance and compares the proposed algorithm with TMC2-v18.0 to demonstrate its advantages. We also compare with methods from [
25,
26,
35]. Generally, the bit rates generated by various methods do not match perfectly. The Bjøntegaard-Delta rate (BD-rate) [
36] is used for a fair comparison, allowing the comparison of two coding solutions while considering multiple RD points. We report D1 (point-to-point) PSNR and D2 (point-to-plane) PSNR as geometric distortions [
37]. For attributes, the distortions of Luma PSNR, Cb PSNR, and Cr PSNR components are given. The PSNR is calculated using the mean squared error (MSE) [
38]. In order to better evaluate performance, we have defined additional evaluation metrics for testing in the refinement segmentation and patch packaging stages.
4.1. Experimental Conditions
The test platform is the Ubuntu 22.04.3 with an Intel Xeon(R) CPU E5-2650 processor and 256 GB of memory. All coding experiments follow the V-PCC Common Test Condition (CTC) [
37]. Using the five quantization parameters (QP) shown in
Table 4, from low bit rate (R01) to high bit rate (R05) [
33]. It has good generalization. Moreover, the test sequence is
Loot,
Redandblanck,
Soldier,
Longdress,
Basketball_player and
Dancer recommended in CTC, where
Basket ball_player and
Dancer are 11 bit [
39,
40]. The remaining test sequences are 10 bit. The encoding configuration is set to all intra. The time-saving ratios
are calculated as follows:
where
and
are the coding time consumption of the original version and our method, respectively. For a fair comparison, all test PCs use the same encoding parameters to achieve comparable RD points.
4.2. Correctness Analysis of Selected Voxels
In this paper, the accuracy rate (AR) and determination rate (DR) are designed to measure the accuracy of the VS-RS. They are defined as follows:
where
A is the voxel set that changes the projection plane after refining segmentation in the process of using TMC2, and
P is the set of voxels selected using VS-RS.
N(·) denotes the number of voxels. AR denotes the proportion of
A in
P to
P. DR denotes the proportion of
A in
P to
A. As shown in
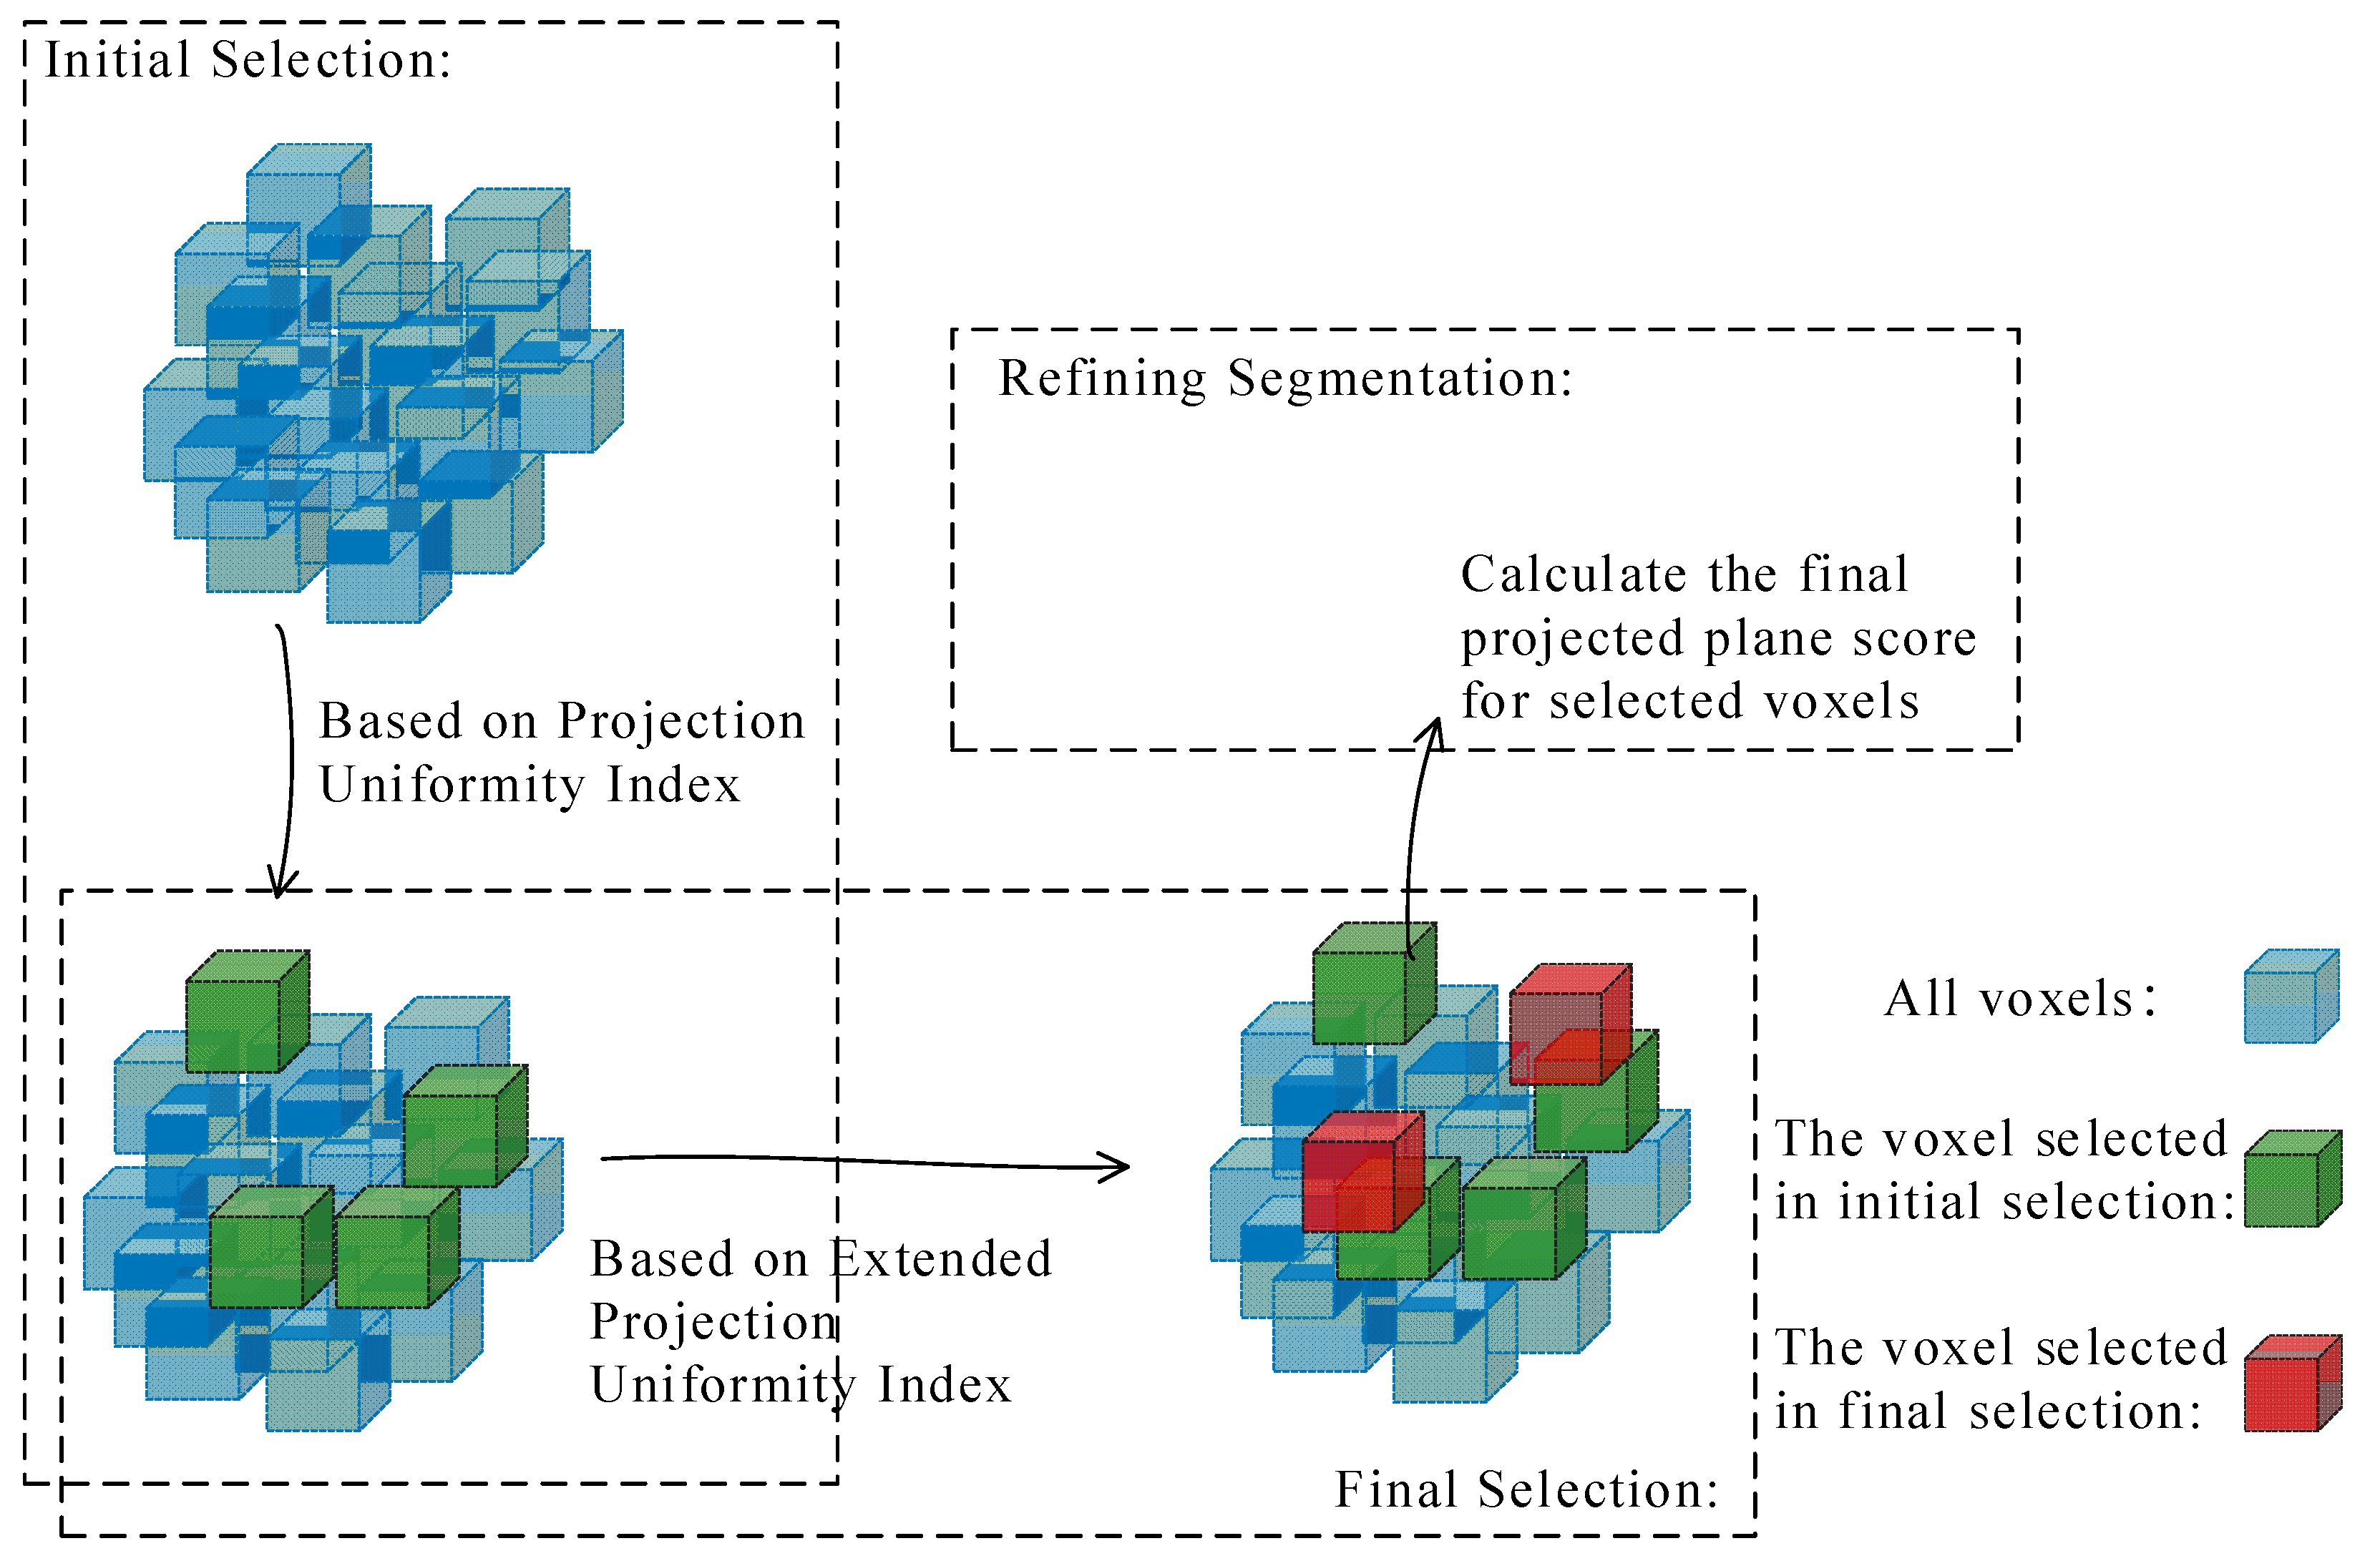
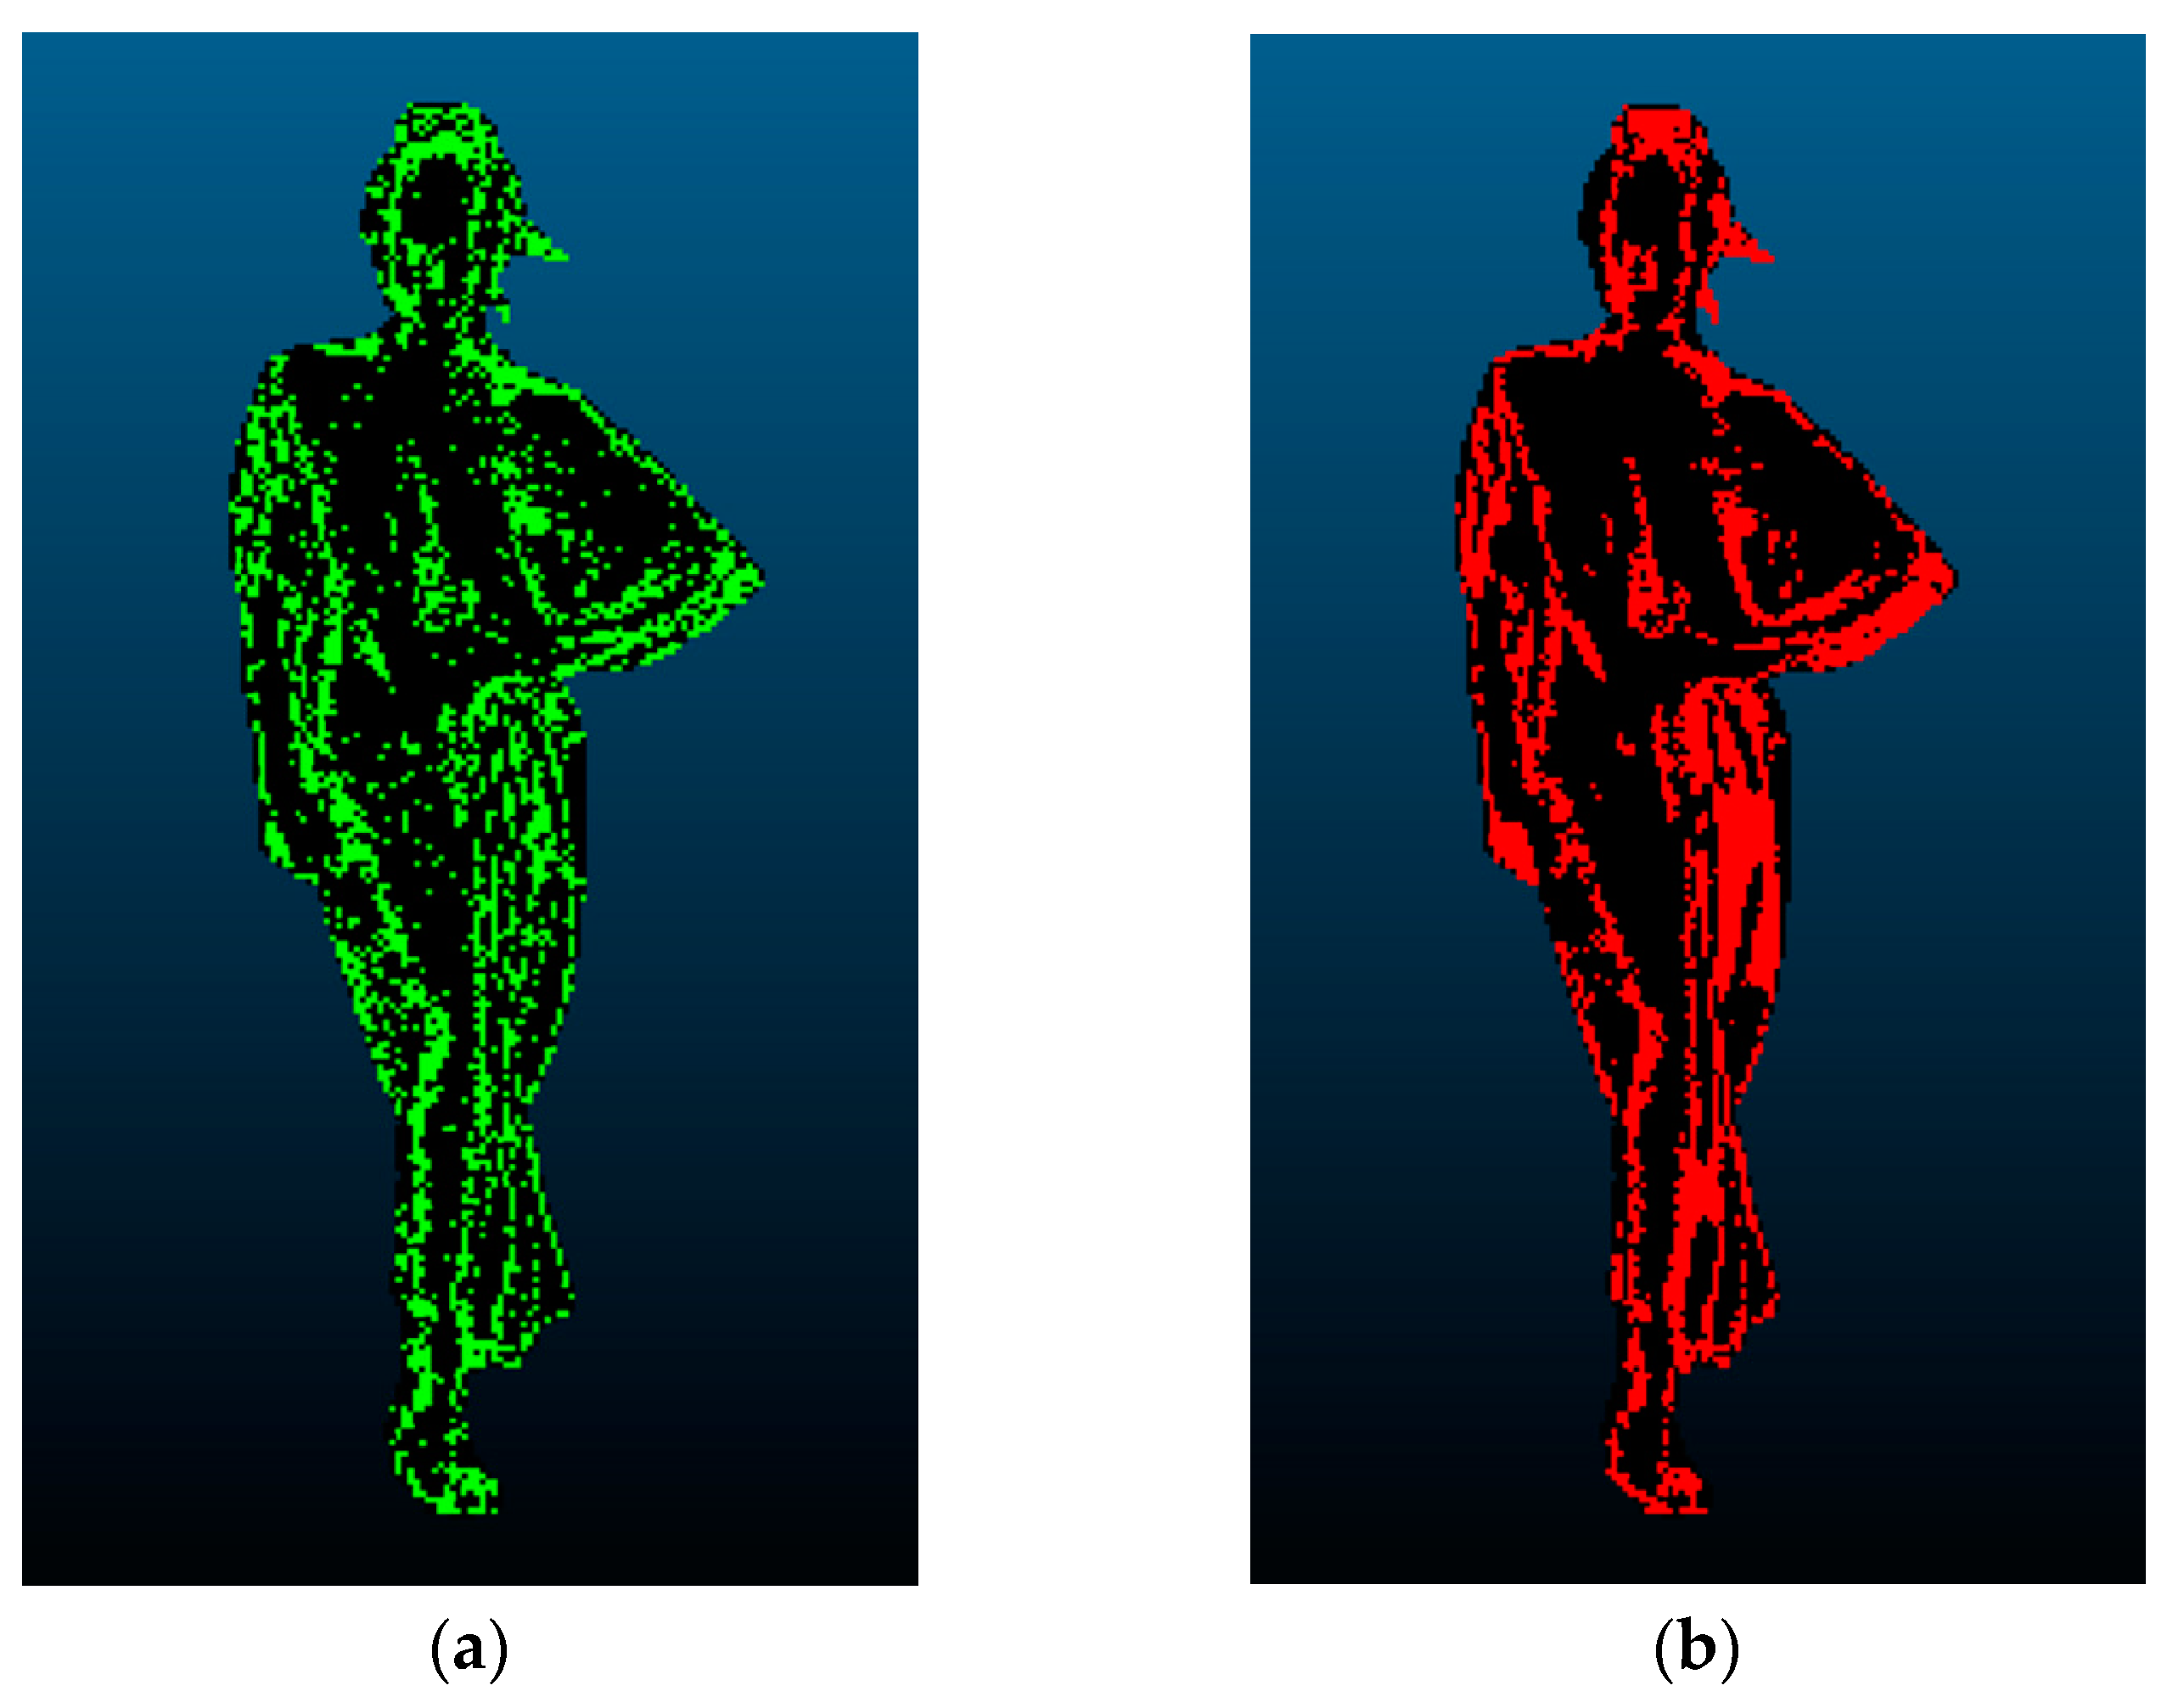
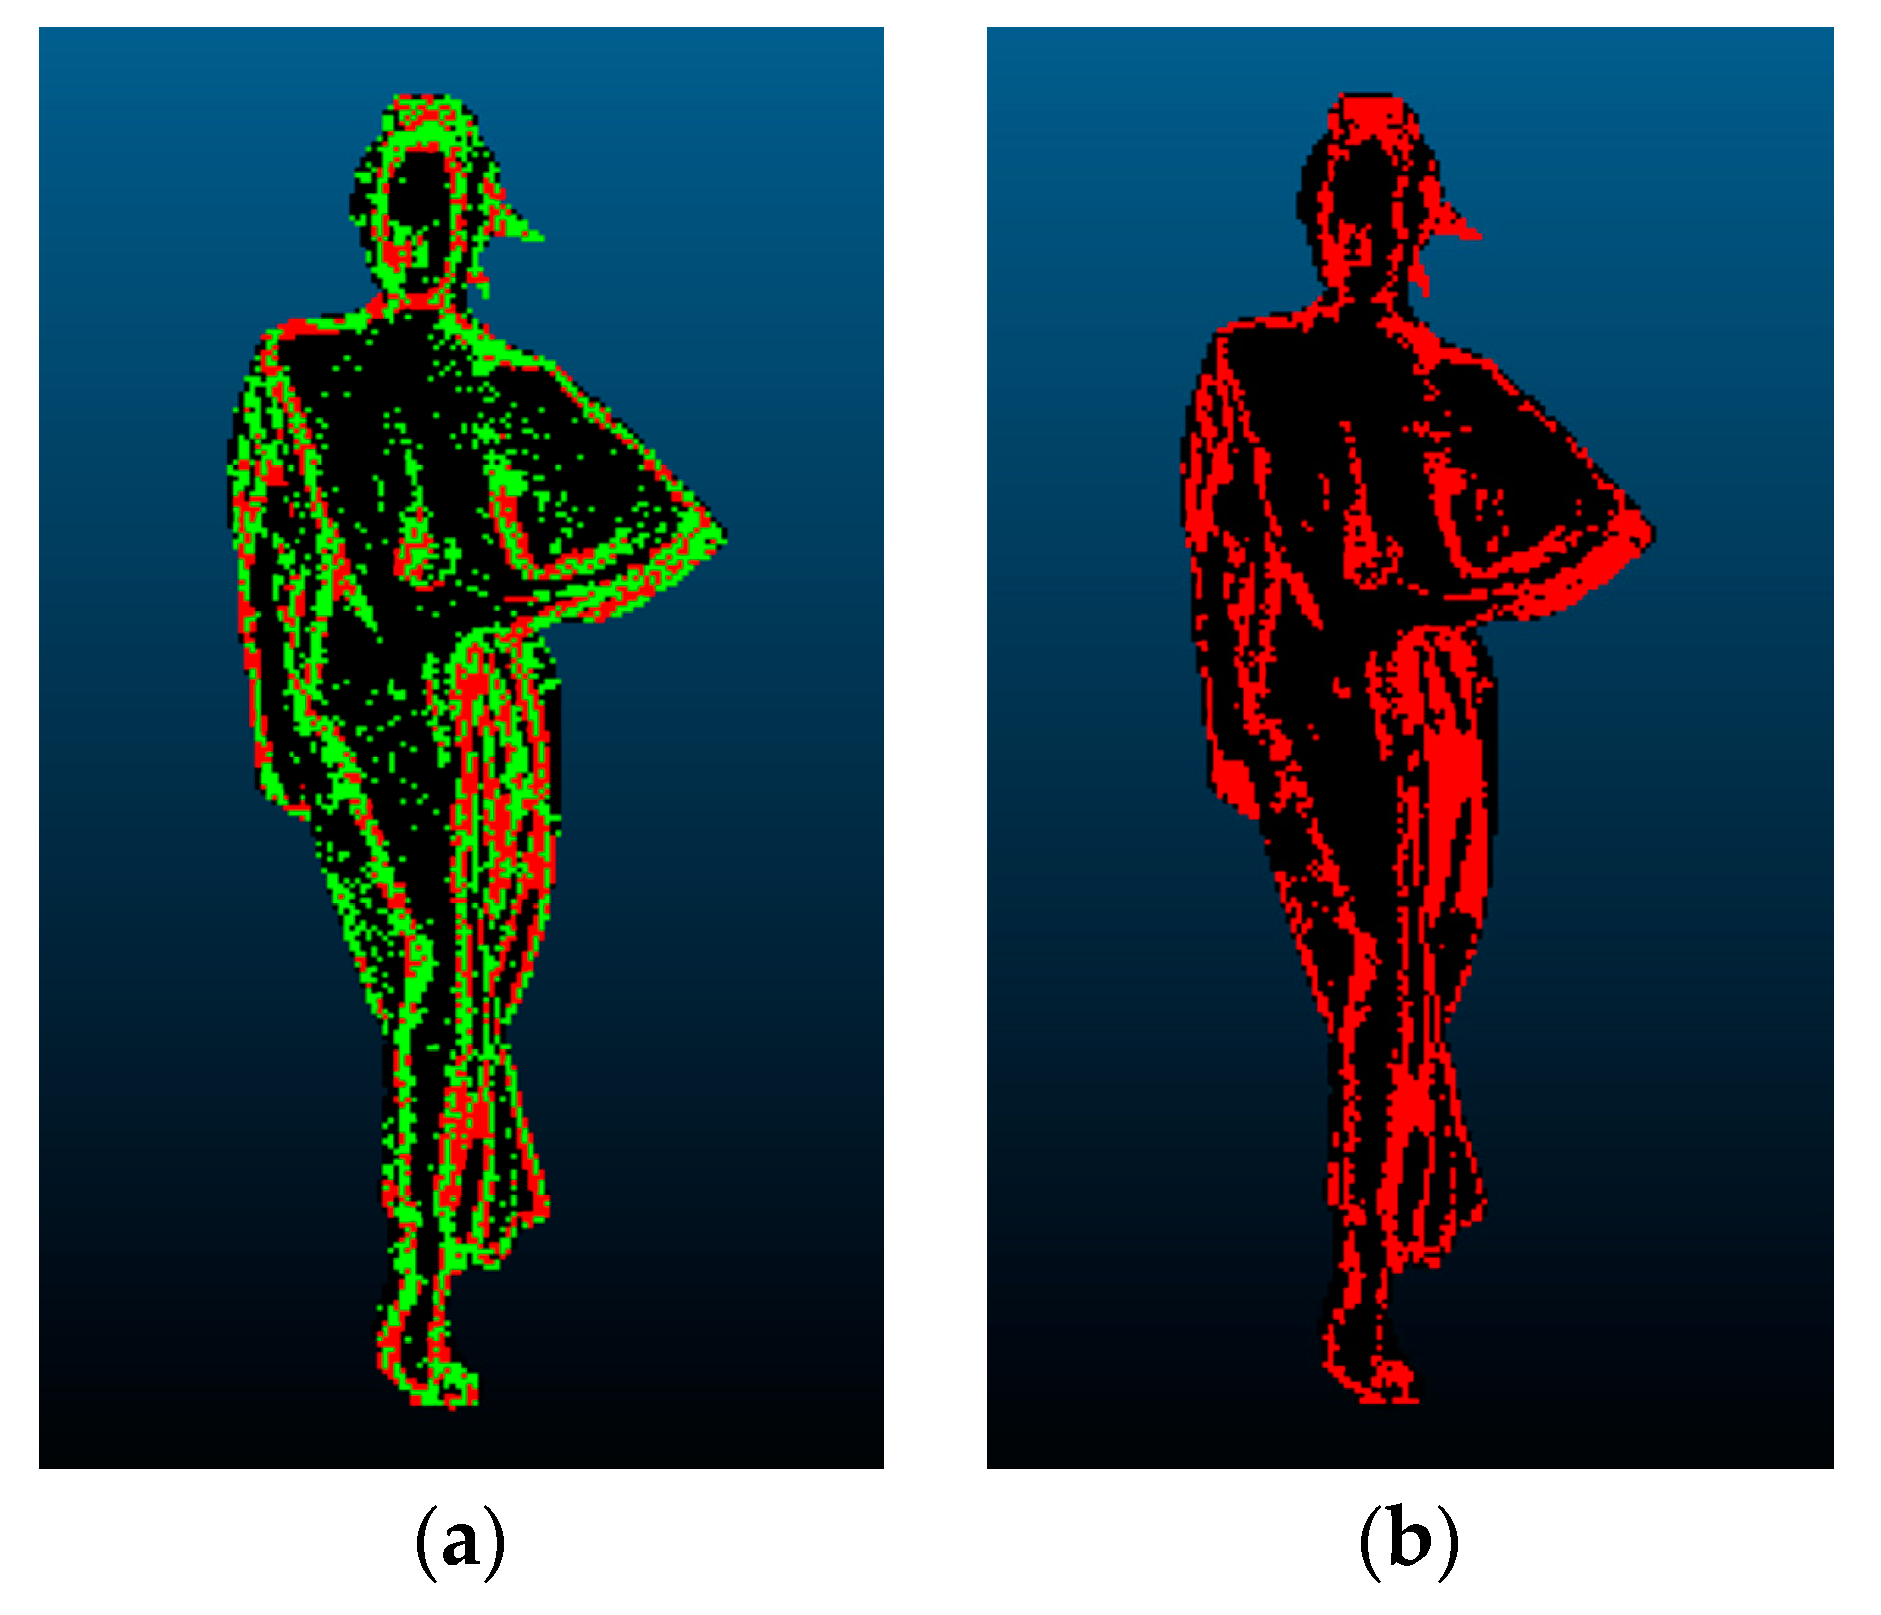
Table 5, the value of DR is 85.32~95.45%, and on average is 93.22%. This indicates that most of the voxels selected using the VS-RS algorithm are related to the voxels whose projection plane index changes during the refining segmentation process in TMC2. The accuracy of VS-RS is high in predicting voxels that are associated with the refined projection plane index. The average value of AR is 85.19%. Most of the voxels that should be refining segmentation are correctly selected. In addition, the distributions of
A and
P can be visually compared. The color region in
Figure 10a represents the distribution of
P. The green voxels are the initial selection voxels, while the red voxels are the final selection of voxels. The red region in
Figure 10b represents the distribution of
A. The two distributions are essentially identical. Therefore, it has been proven that the VS-RS is highly accurate.
The statistical results of the improved BD-rate performance and running time of the proposed algorithm, compared with TMC2, are shown in
Table 6. It can be seen that the proposed algorithm can reduce the encoding time consumption by up to 43.50%. On average, it achieves −0.22% D1 BD-rate gains and −0.28% D2 BD-rate gains on average. In terms of attributes, obtains −0.15% Luma BD-rate gains on average and −0.65% Cr BD-rate gains on average. Compared to most methods that can only trade off performance for efficiency, our proposed method can enhance coding performance while saving coding time.
4.3. Packing Performance Evaluation
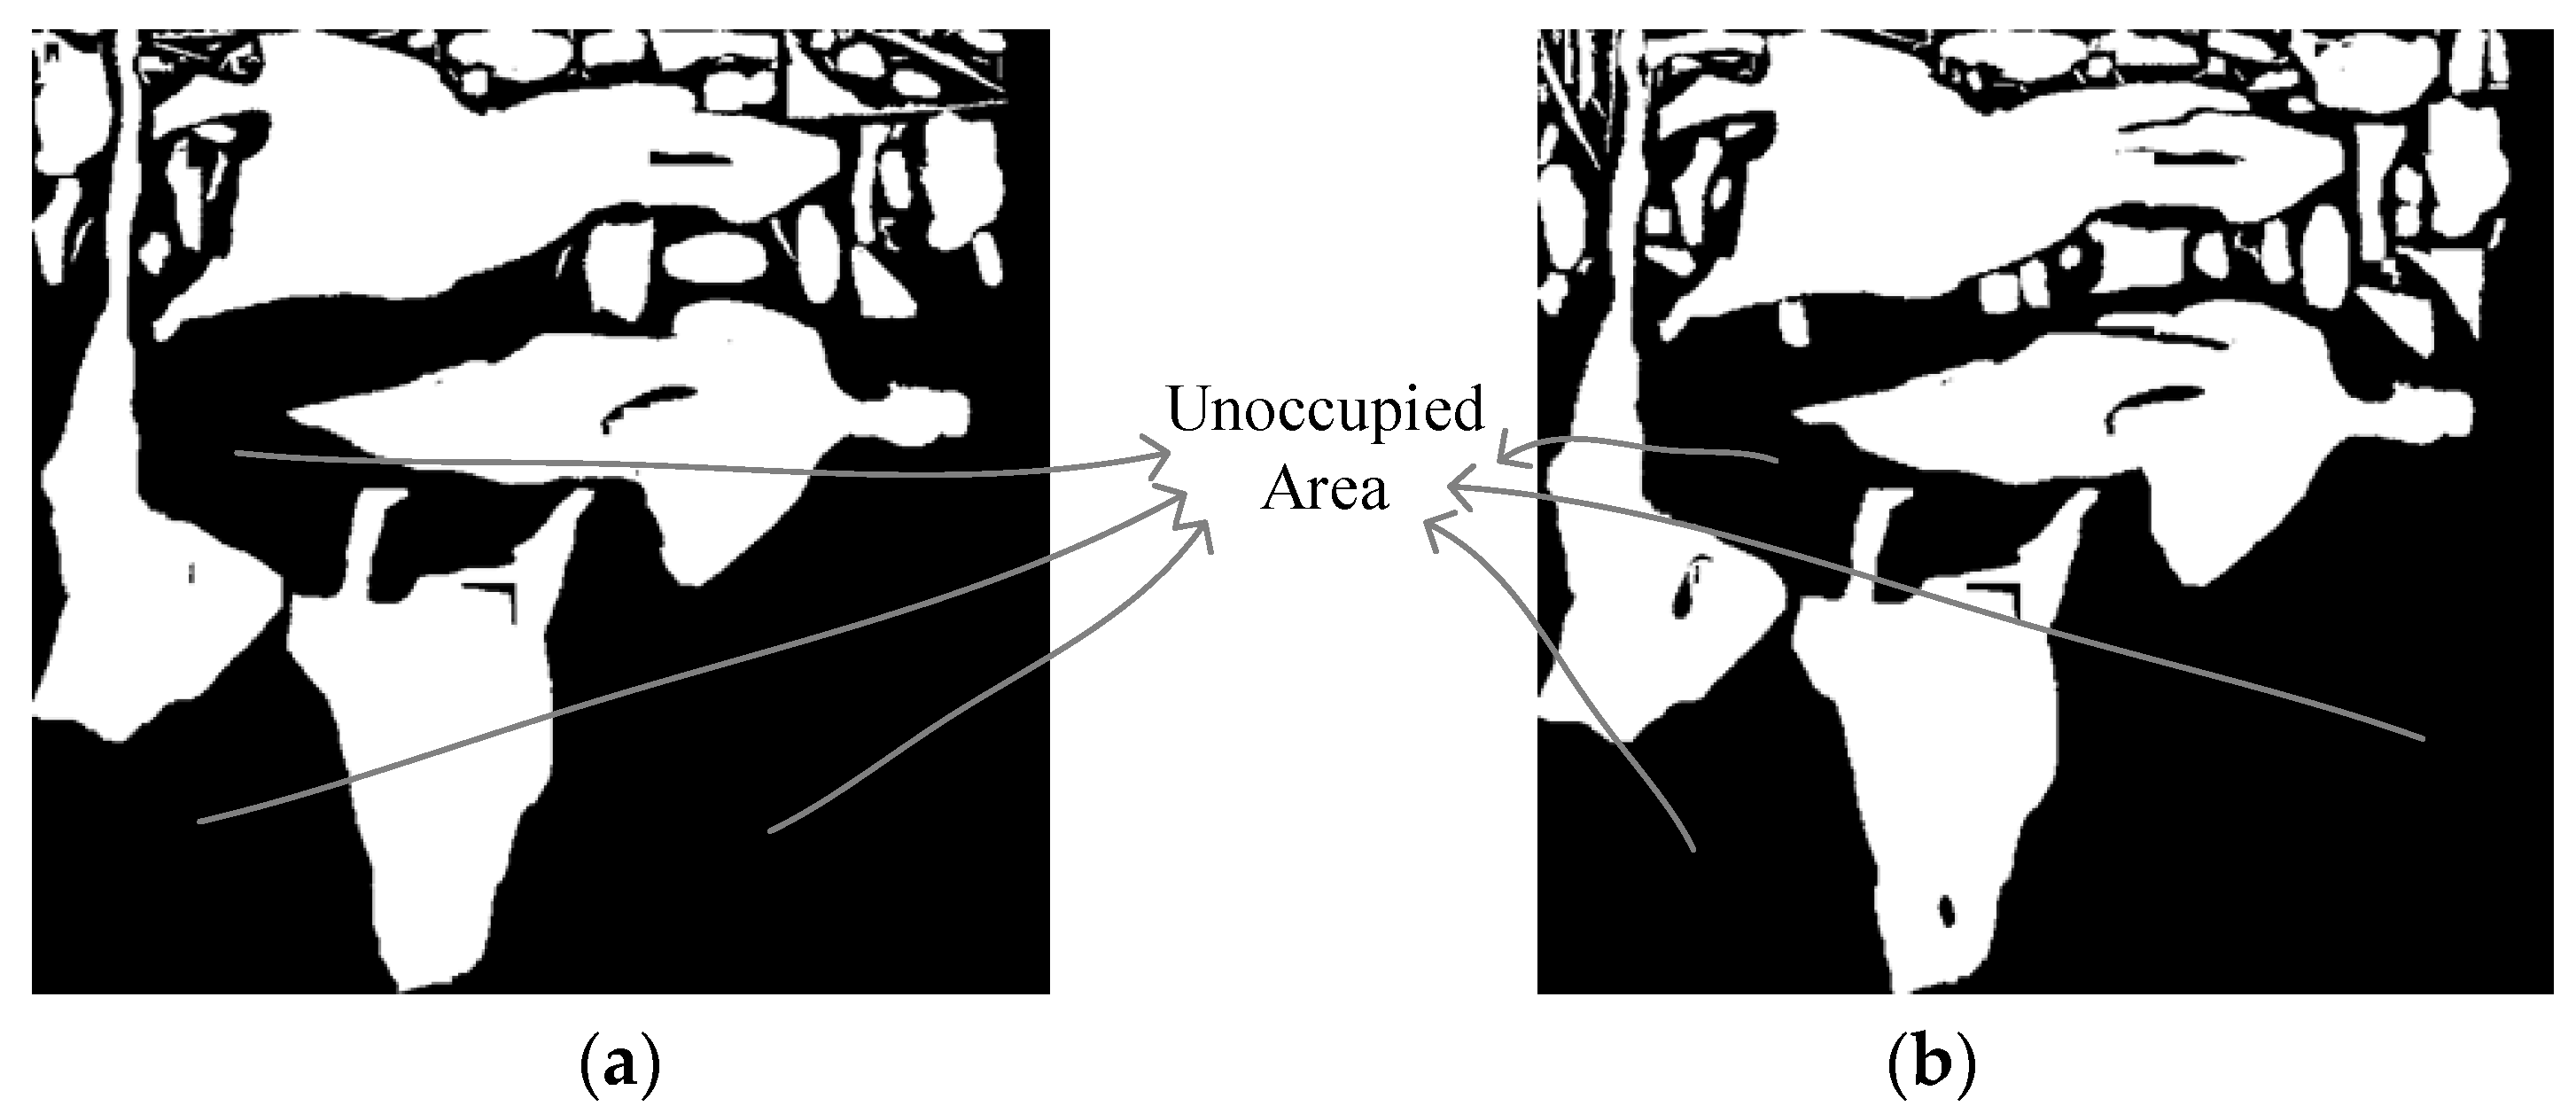
In addition to using BD-rate to evaluate the packing performance, we also calculated the reduction in occupancy map size as a measure of the packing performance.
Figure 11a shows the occupancy map generated by the original method, while
Figure 11b shows the occupancy map generated by our method. DAPP can generate smaller occupancy maps.
Table 7 shows that the DAPP results in a maximum reduction of 20.14% in the area of the occupancy map. An average reduction of 6.92%. The reduction of the occupancy map also leads to an improvement in the performance of point cloud compression. As shown in
Table 8, the BD-rate of D1 has an average gain of −0.91%. The average BD-rate gain of D2 is −1.16%. The BD-rate of Luma gain of −1.03%, the BD-rate of Cb gain of −0.45% on average, and the BD-rate of Cr gain of −0.81% on average.
4.4. Final Coding Performance Overall Performance
When the two methods proposed in this paper are used in combination,
Table 9 shows the comparison results with TMC2-18.0, indicating that the method has performed well. The algorithm proposed in this paper can reduce the time consumption of coding by up to 43.34%, with an average reduction of 31.86%. The average BD-rate coding gain of D1 is −1.39%, and the soldier test point cloud has the best effect, up to −2.86%. The average BD-rate coding gain of D2 is −1.58%, and the longdress test point cloud has the best effect, up to −3.07%. The BD-rate coding gain of Luma is −1.35% on average, and the redandblack test point cloud has the best effect, up to −2.62%. Therefore, the algorithm proposed in this paper can improve the performance of point cloud compression while reducing its complexity.
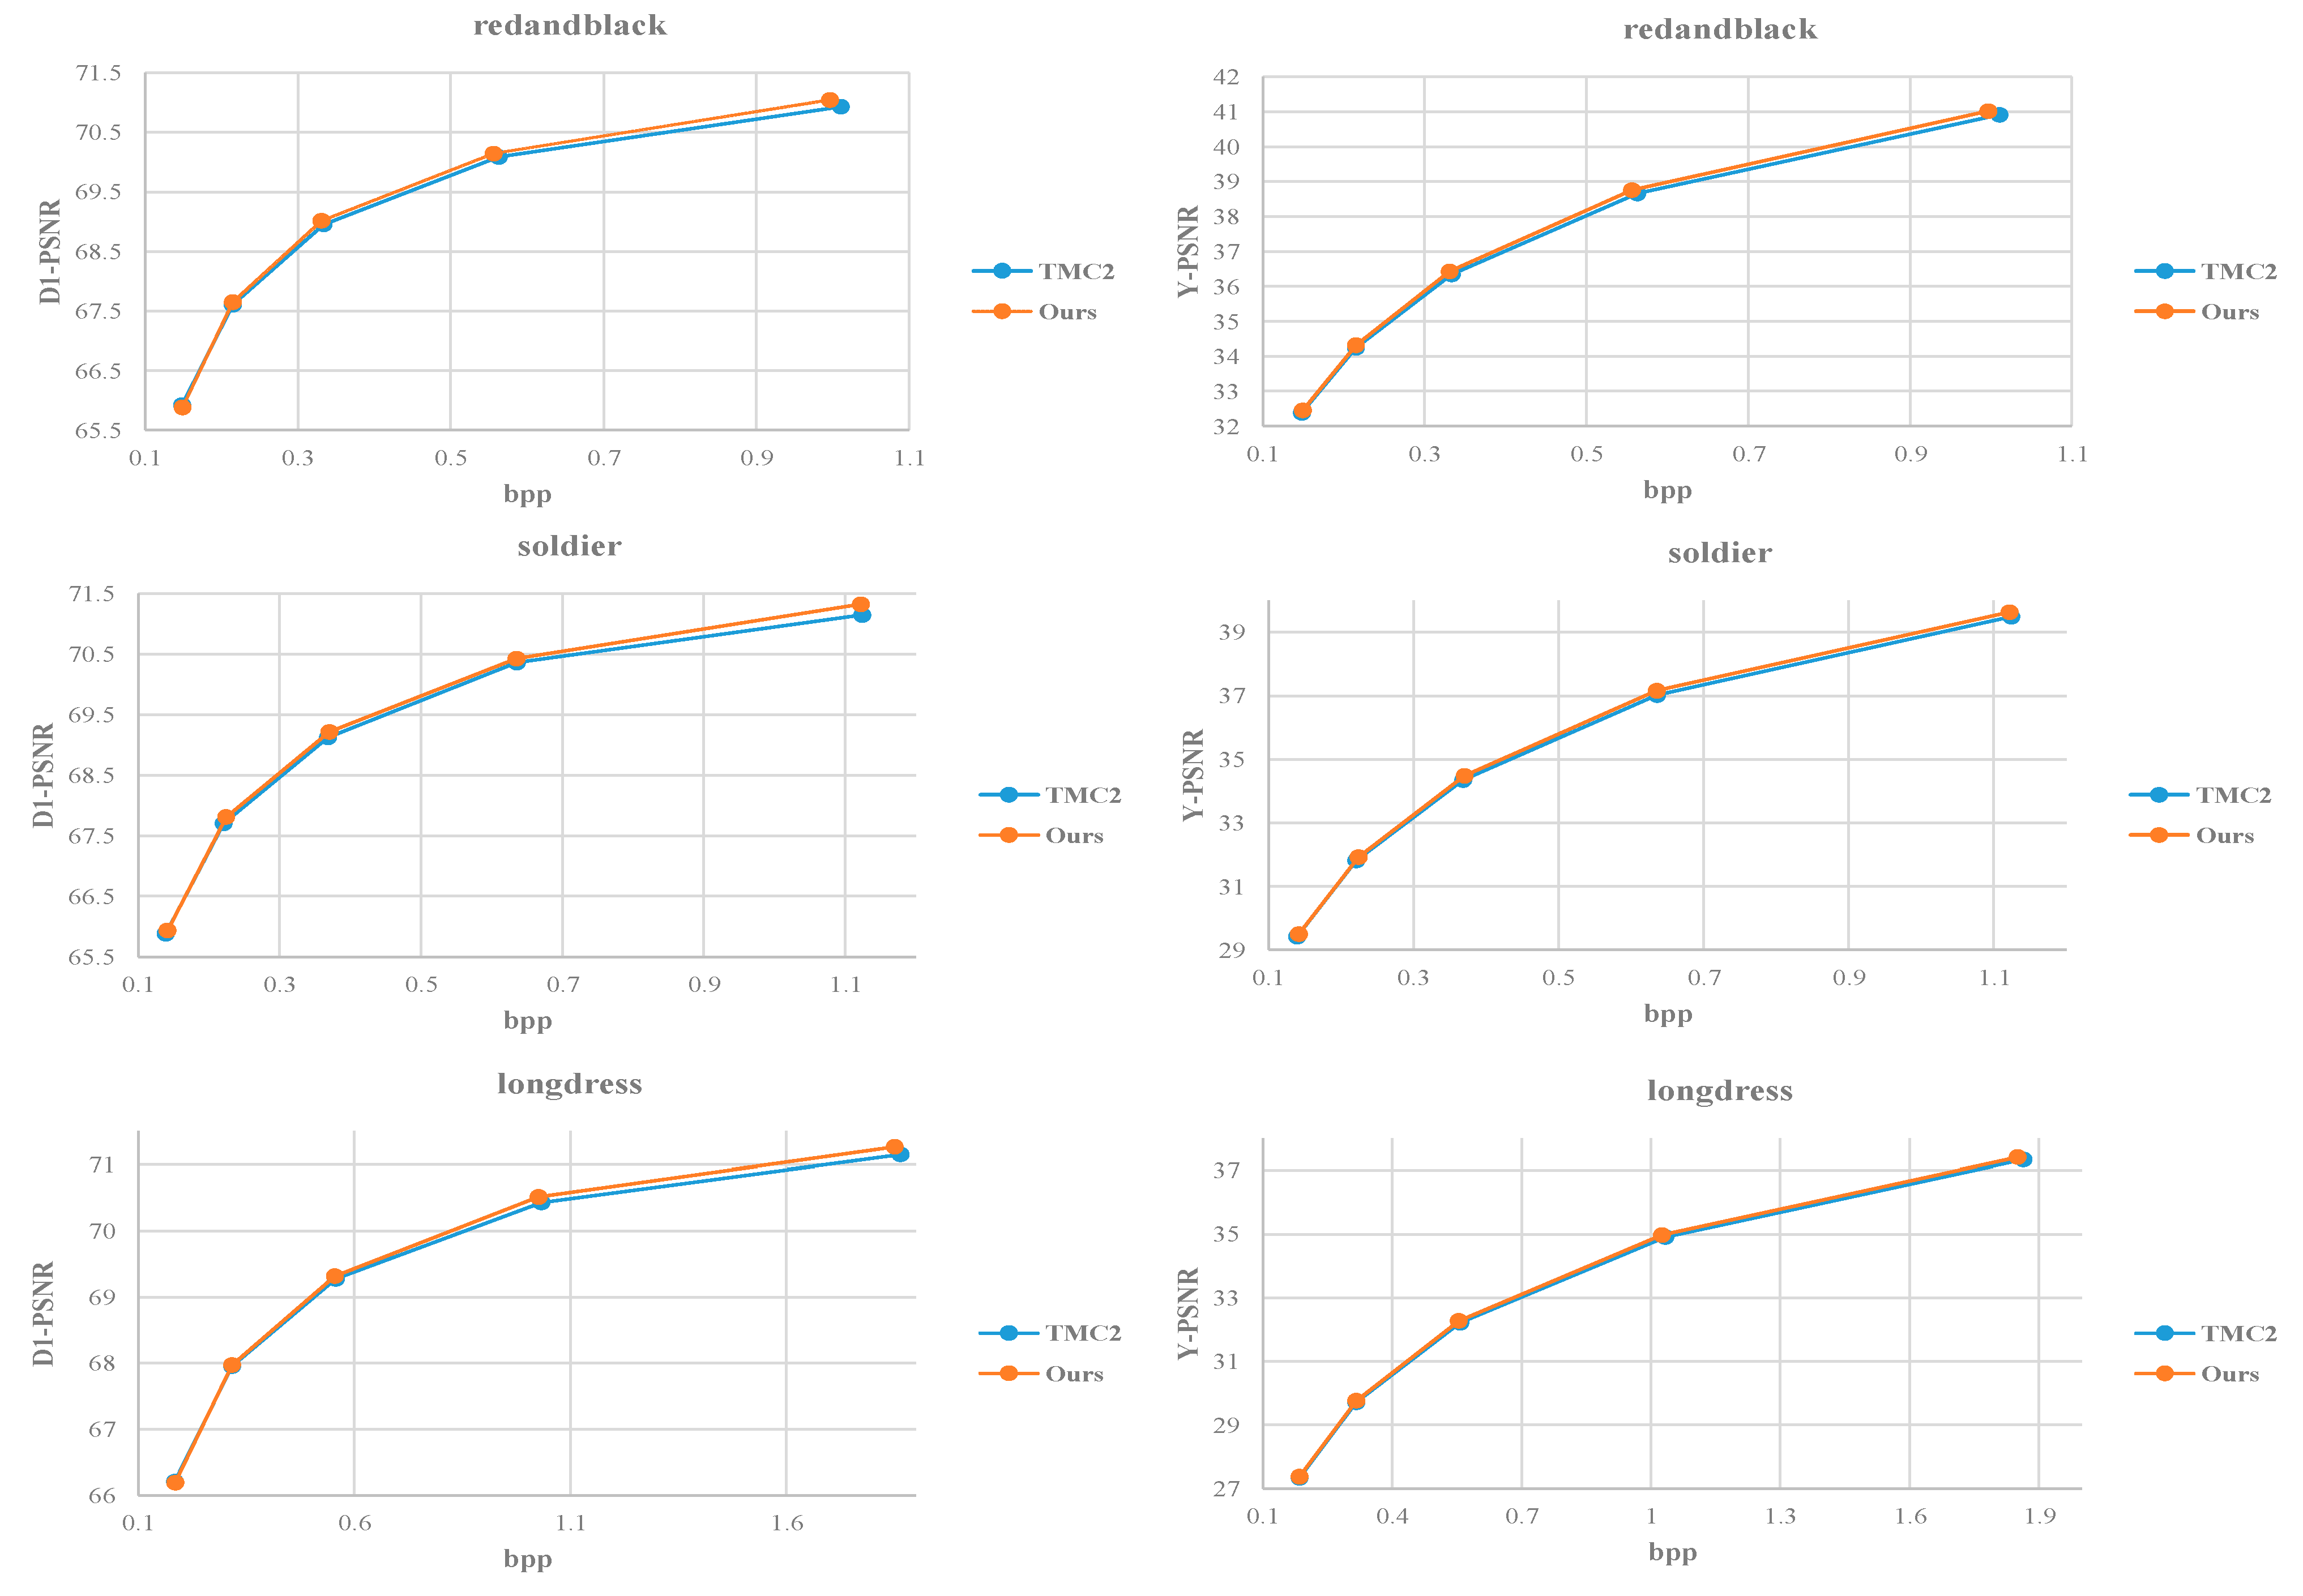
Additionally, we also drew the RD curve according to the new algorithm and TMC2. The bit rate is calculated by the number of bits per input point (bpp). Distortion metrics include D1 and Luma.
Figure 12 shows the RD curves of the three test sequences. The proposed method leads to performance improvements, particularly at high bit rates. The proposed method is significantly better than TMC2 in terms of subjective quality.
Figure 13 shows a subjective quality comparison between TMC2 and ours. From an overall perspective, our method better preserves the details of the point cloud. In addition, the subjective quality of the localized point cloud reconstructed by our method is also better than that of TMC2.
4.5. Comparison with Related Works
Although there have been numerous studies on improving point cloud coding algorithms in terms of time consumption, regrettably, there are few methods available to enhance the compression performance of the algorithm while also improving speed. This also reflects that our method can comprehensively consider the time and performance requirements. We compare the proposed method with [
25,
26,
35]. As shown in
Table 10 and
Table 11, the data from their respective papers were used for comparison. Among them, refs. [
25,
35] compared the overall performance of their algorithms with TMC2-12.0, and ref. [
26] compared the overall performance of their algorithms with TMC2-17.0. The method used in [
25,
26] improves the refining segmentation. The fast CU decision-making method in [
35] enhances the video compression process. The time improvement of [
26] in attribute sequence compression is 62.41%. Ref. [
25] improved the FGRS time by 47.05% and ref. [
35] improved the G-RS by 26.9%. The proposed method reduces the overall point cloud encoding time by 31.86%.
Refs. [
25,
35] have different levels of loss in D1 and D2 BD-rate metrics. The D1 BD-rate of [
26] improves by −0.03%, and the D2 BD-rate improves by −0.02%. The proposed method is improved by −1.39% and −1.58%, respectively. References [
25,
35] have different degrees of loss on the Luma BD-rate measure. The Luma BD-rate of [
26] only improves by −0.09%. The proposed method improves by −1.35%. At the same time, in terms of Cb, Cr BD-rate, the proposed method also has performance improvement.
5. Conclusions
This article aims to address some limitations in V-PCC, such as severe time consumption and excessive occupancy map size. In response to the significant issue of time consumption, we have analyzed and enhanced the refining segmentation process, which contributes significantly to the overall time consumption. We propose the VS-RS algorithm, which bypasses some voxels that do not require refining segmentation. Only voxels with non-uniform distribution of projection planes require refining segmentation. Regarding the issue of excessive size in the occupancy map generated by the original patch packing algorithm and the problem of the VS-RS potentially generating additional fine patches. This paper also proposes the DAPP to perform patch packing more reasonably. It contains a novel patch sorting method, placement area selection method, and patch positioning method. Patches can be placed in a compact manner. The novel solutions still generate compliant V-PCC streams and can be decoded correctly by any V-PCC decoder. The experimental results show that our method achieves an average BD Rate gain of −1.39% and −1.58%, respectively, compared to the V-PCC benchmark, according to the D1 and D2 distortion standards. Simultaneously, we achieved a 31.86% reduction in encoding time and a 20.14% decrease in the size of the occupancy map. This method also improves the quality of point cloud reconstruction and preserves more details. In addition, when compared with the data from recently published papers, our method has made significant improvements in various evaluation indicators. There are several intriguing exploration topics for the future, including (1) enhancing image-filling algorithms, (2) maximizing the utilization of occupied image data for video compression, and (3) integrating deep learning techniques into V-PCC.


