

Experimental Study on Seismic Behavior of Newly Assembled Concrete Beam–Column Joints with L-Shaped Steel Bars
Abstract
1. Introduction
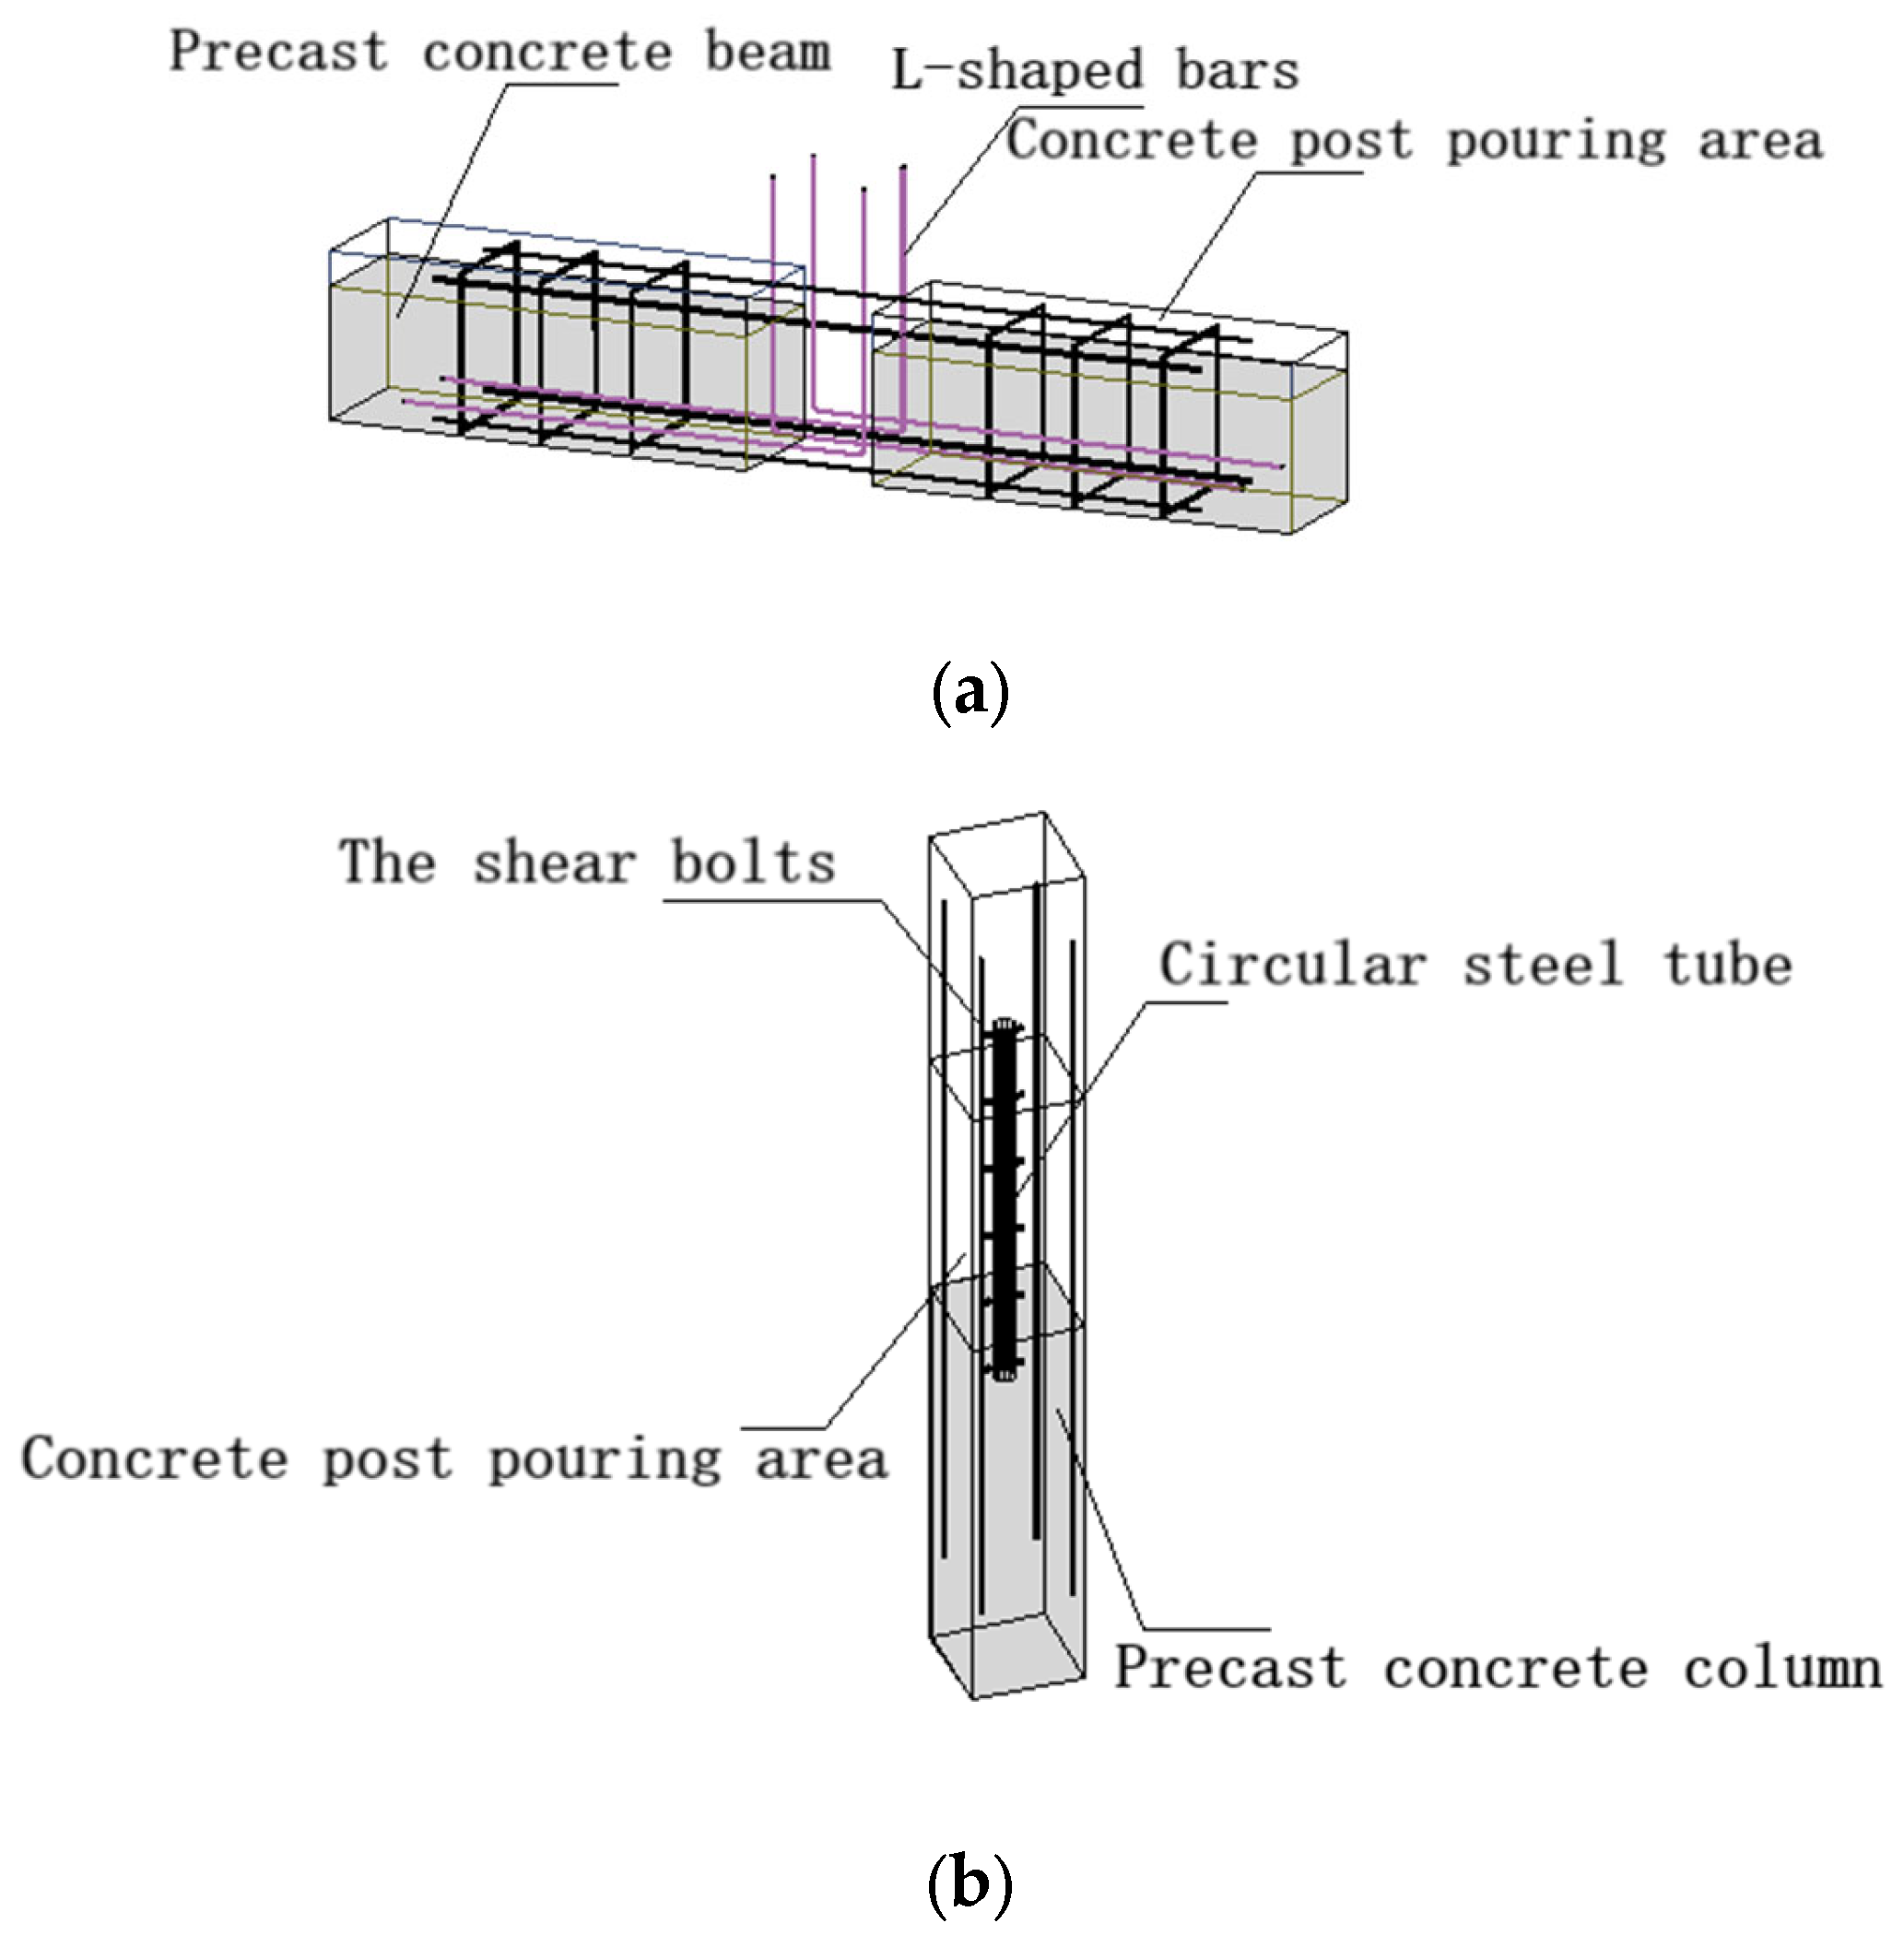
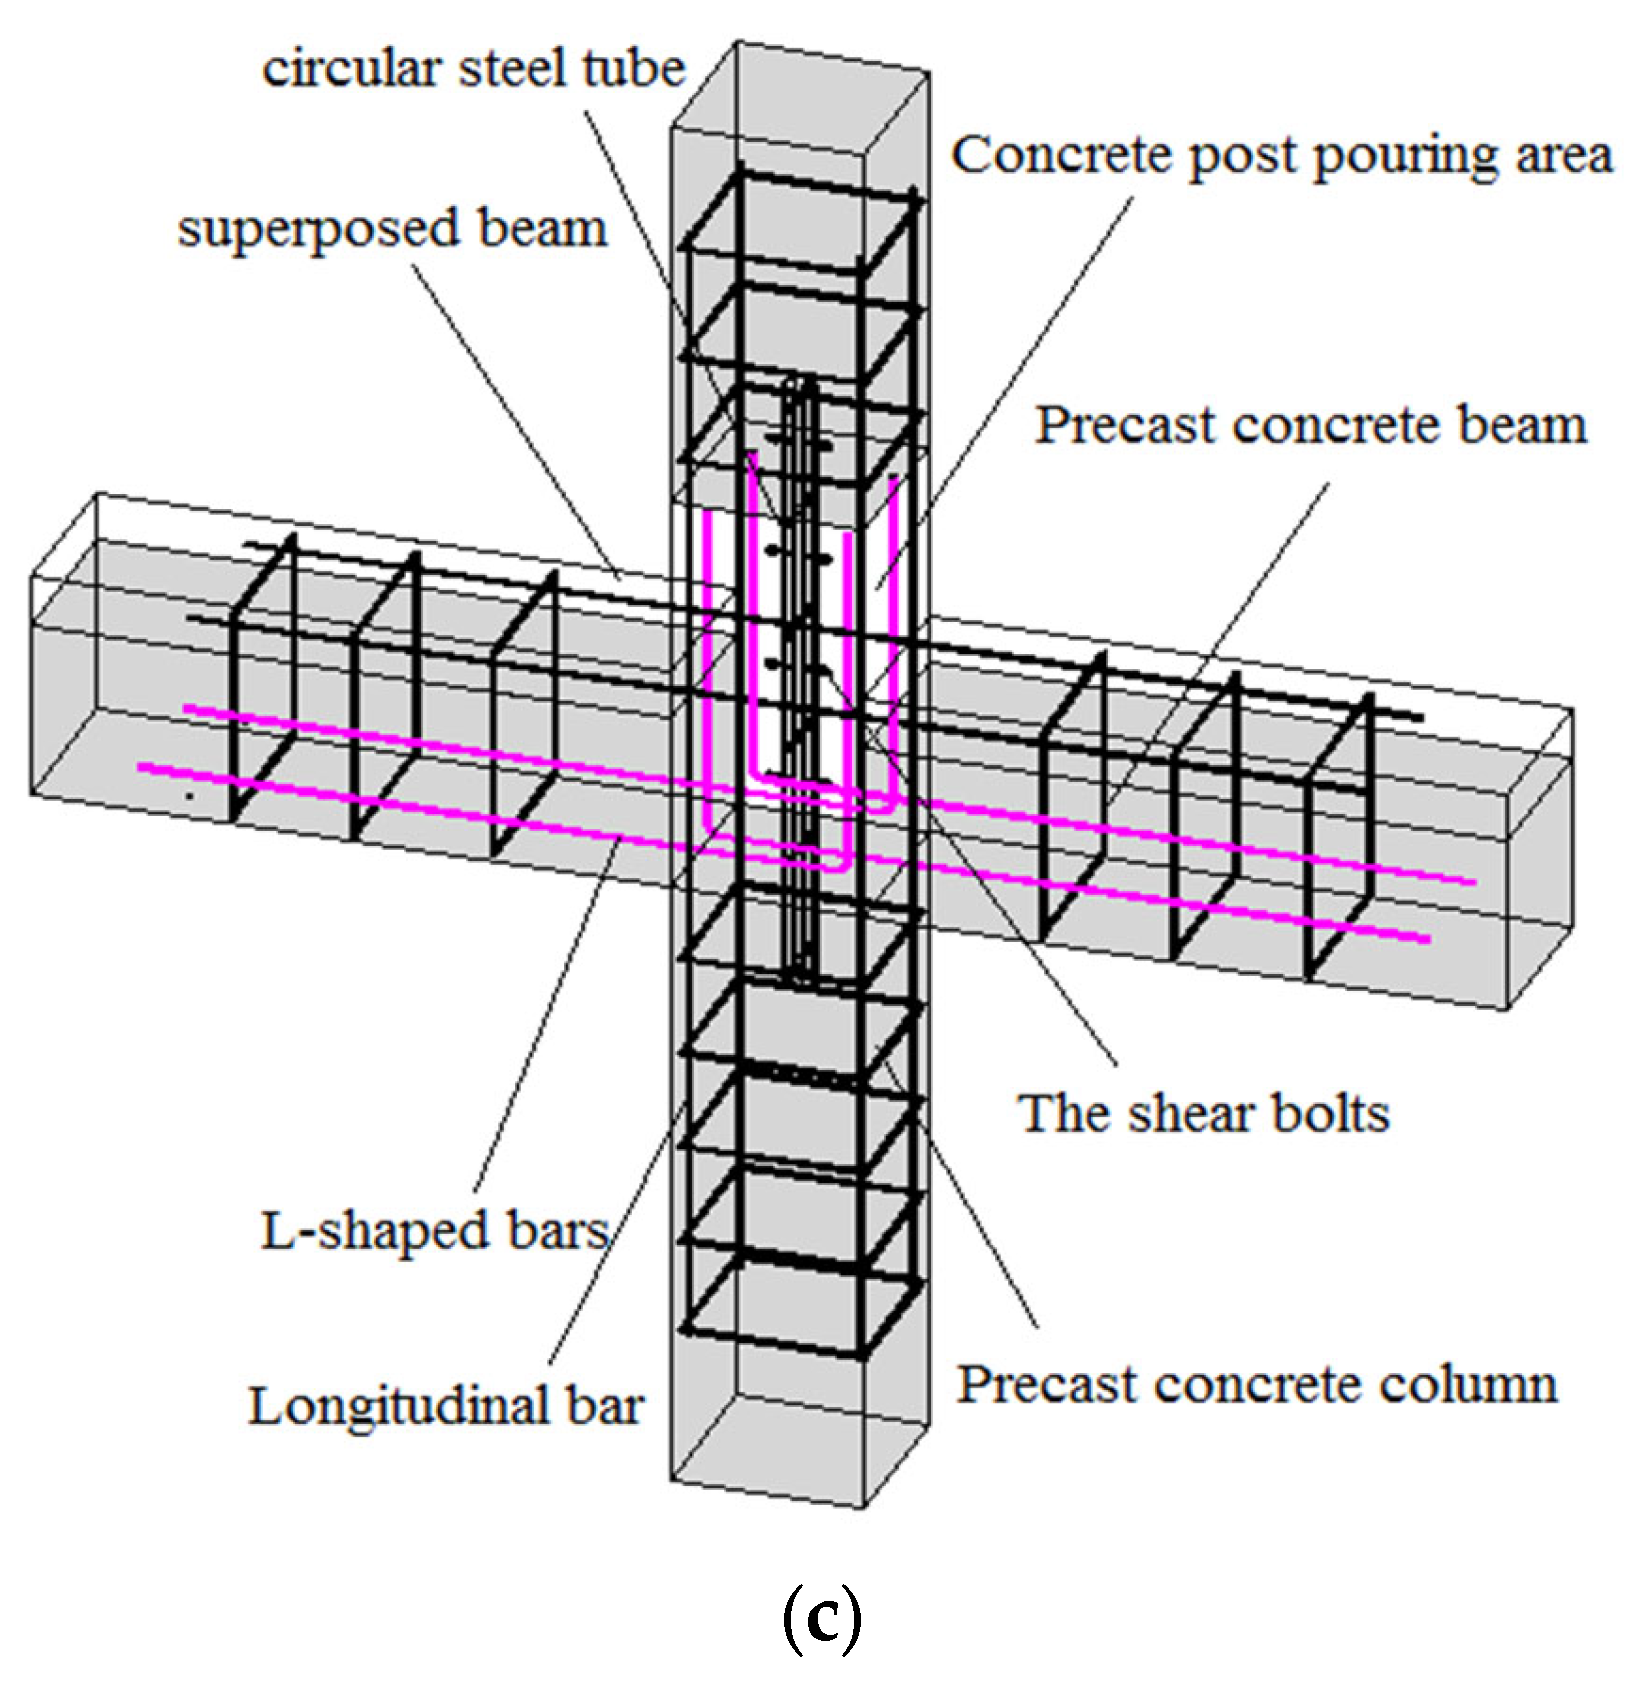
2. Joint Structure
3. Test
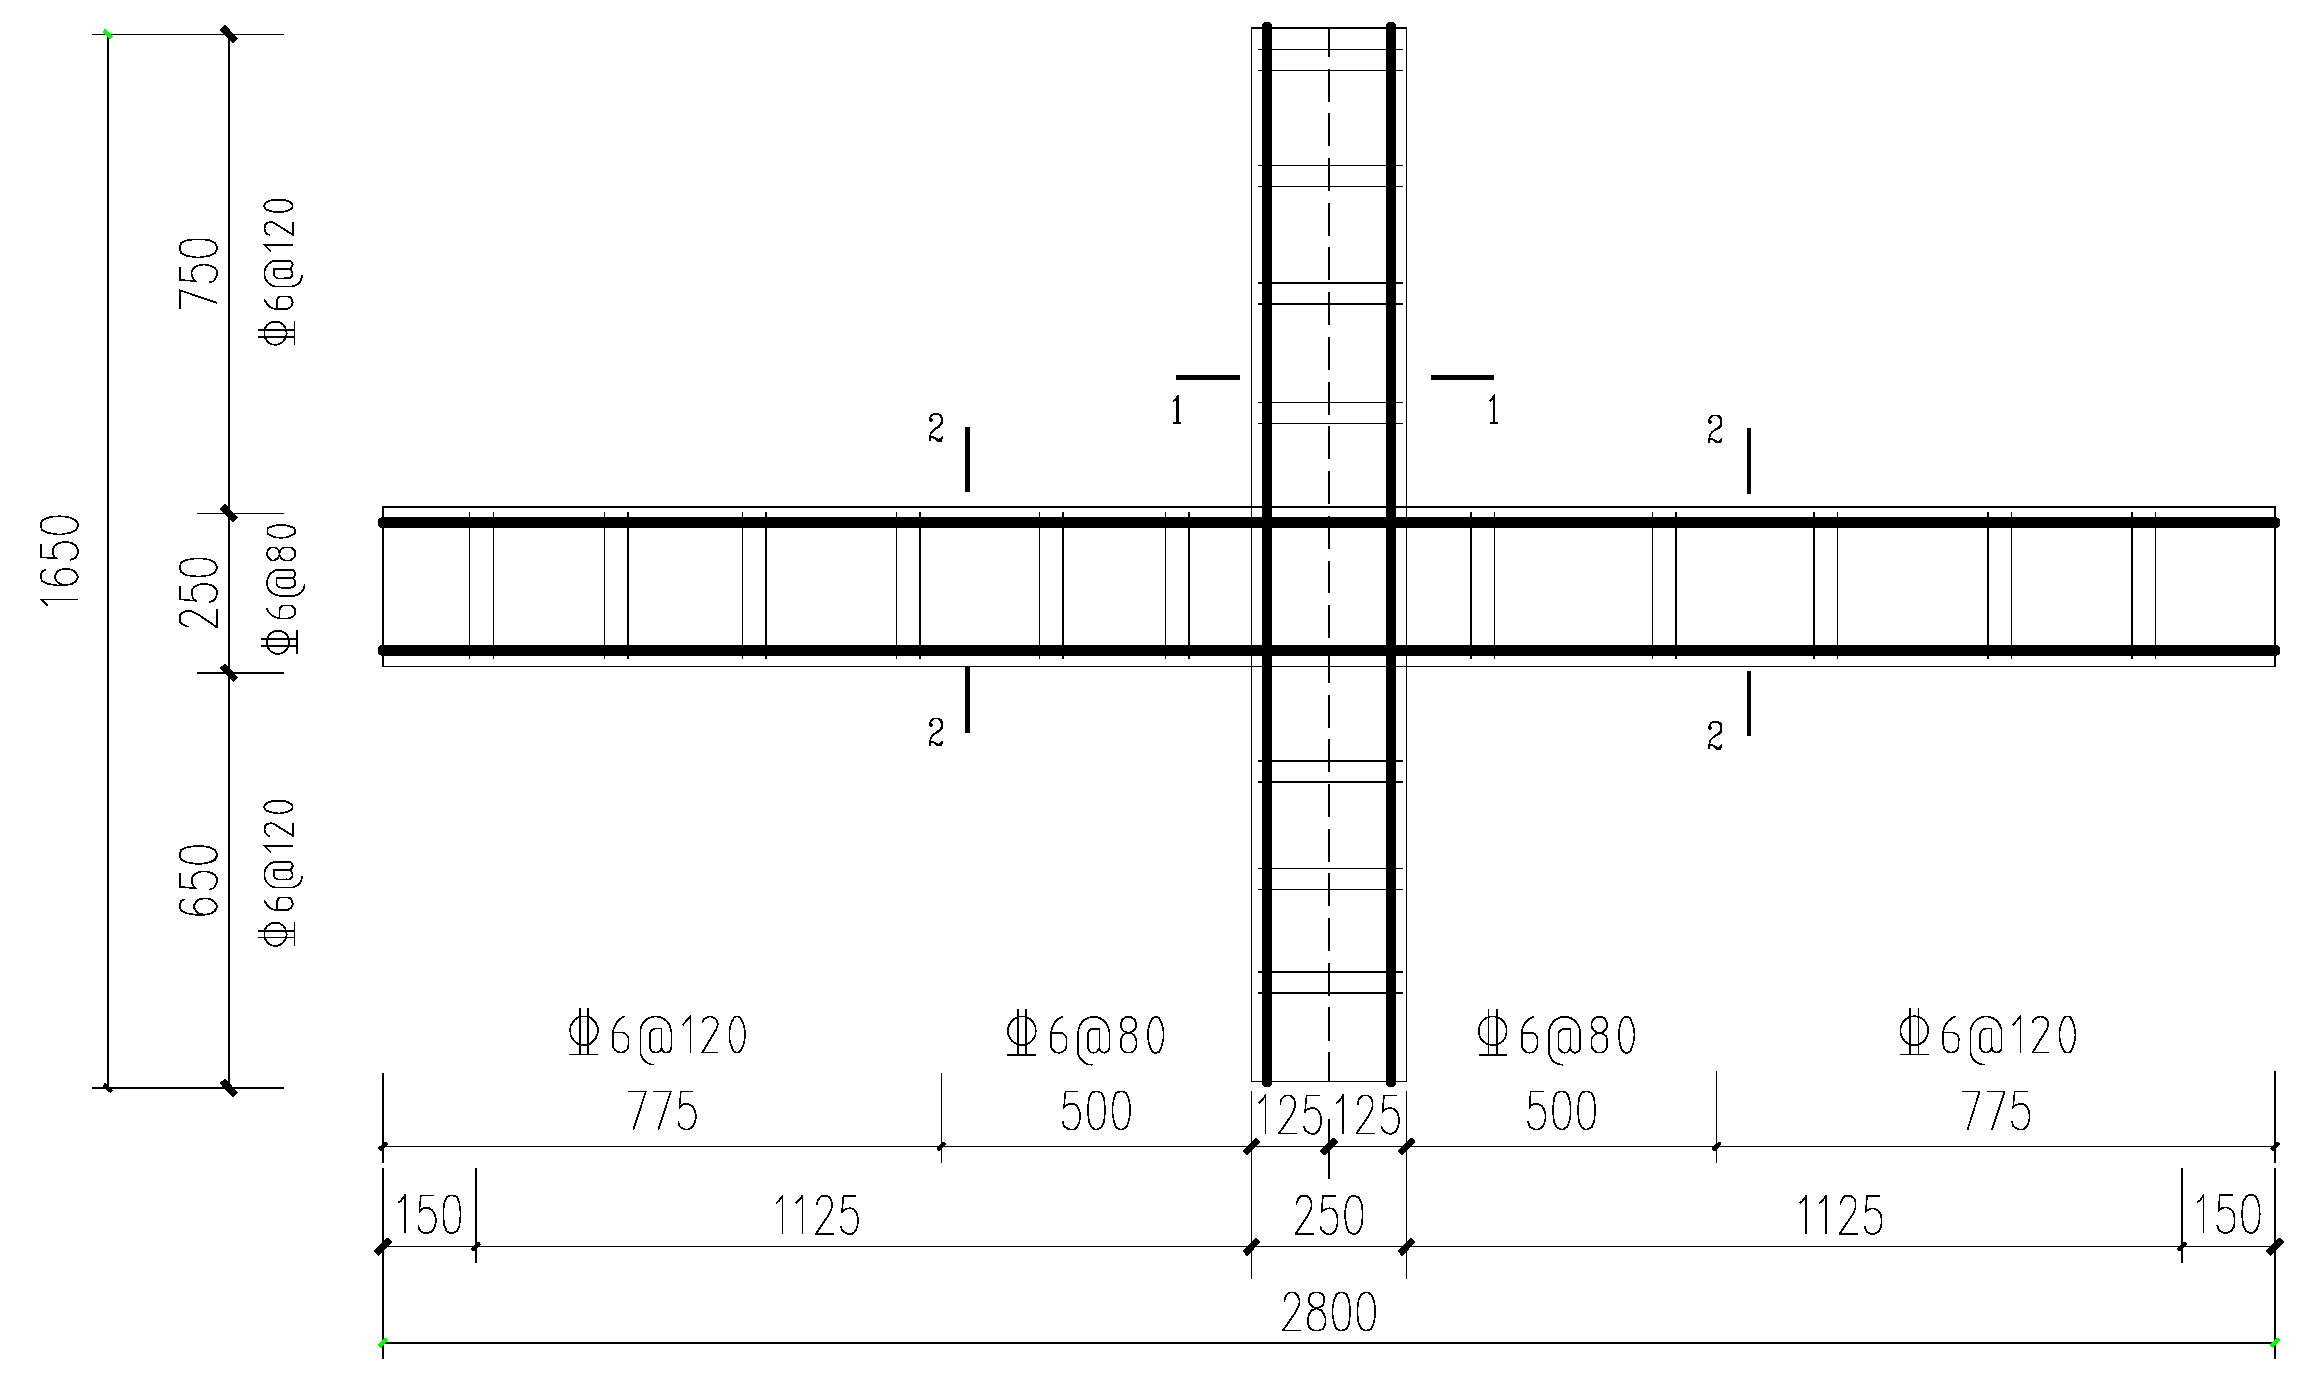
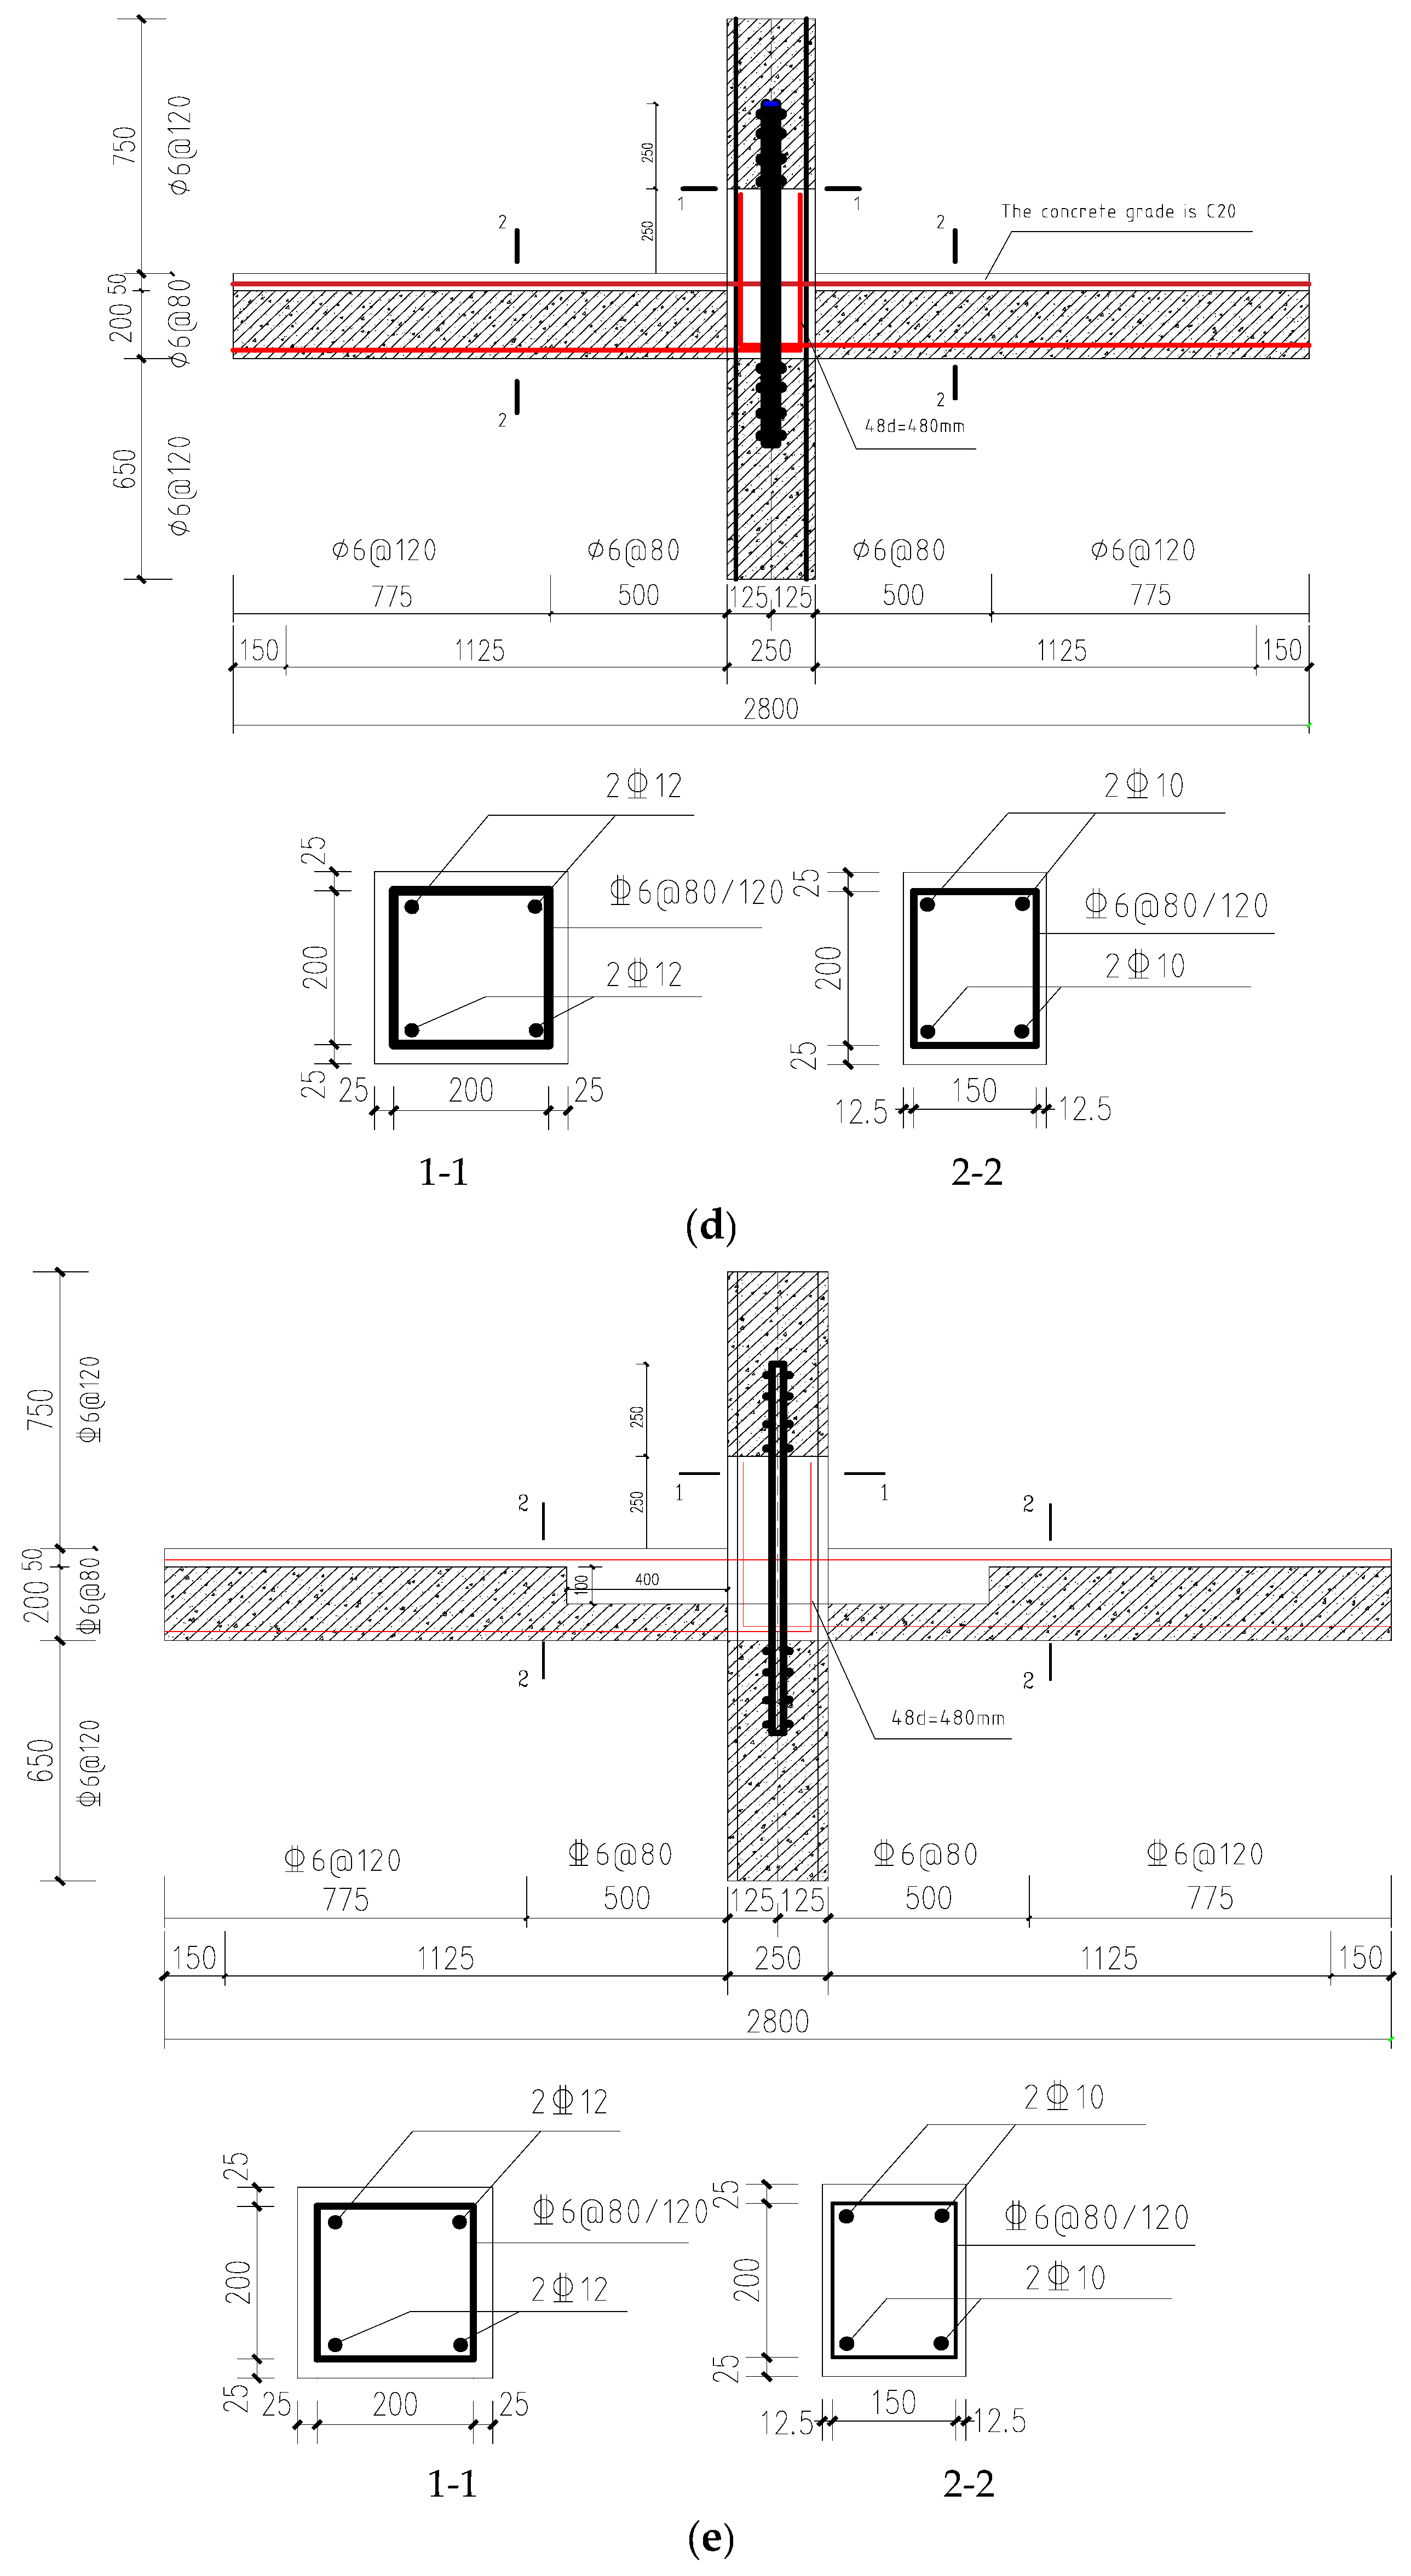
3.1. Specimen Design
3.2. Material
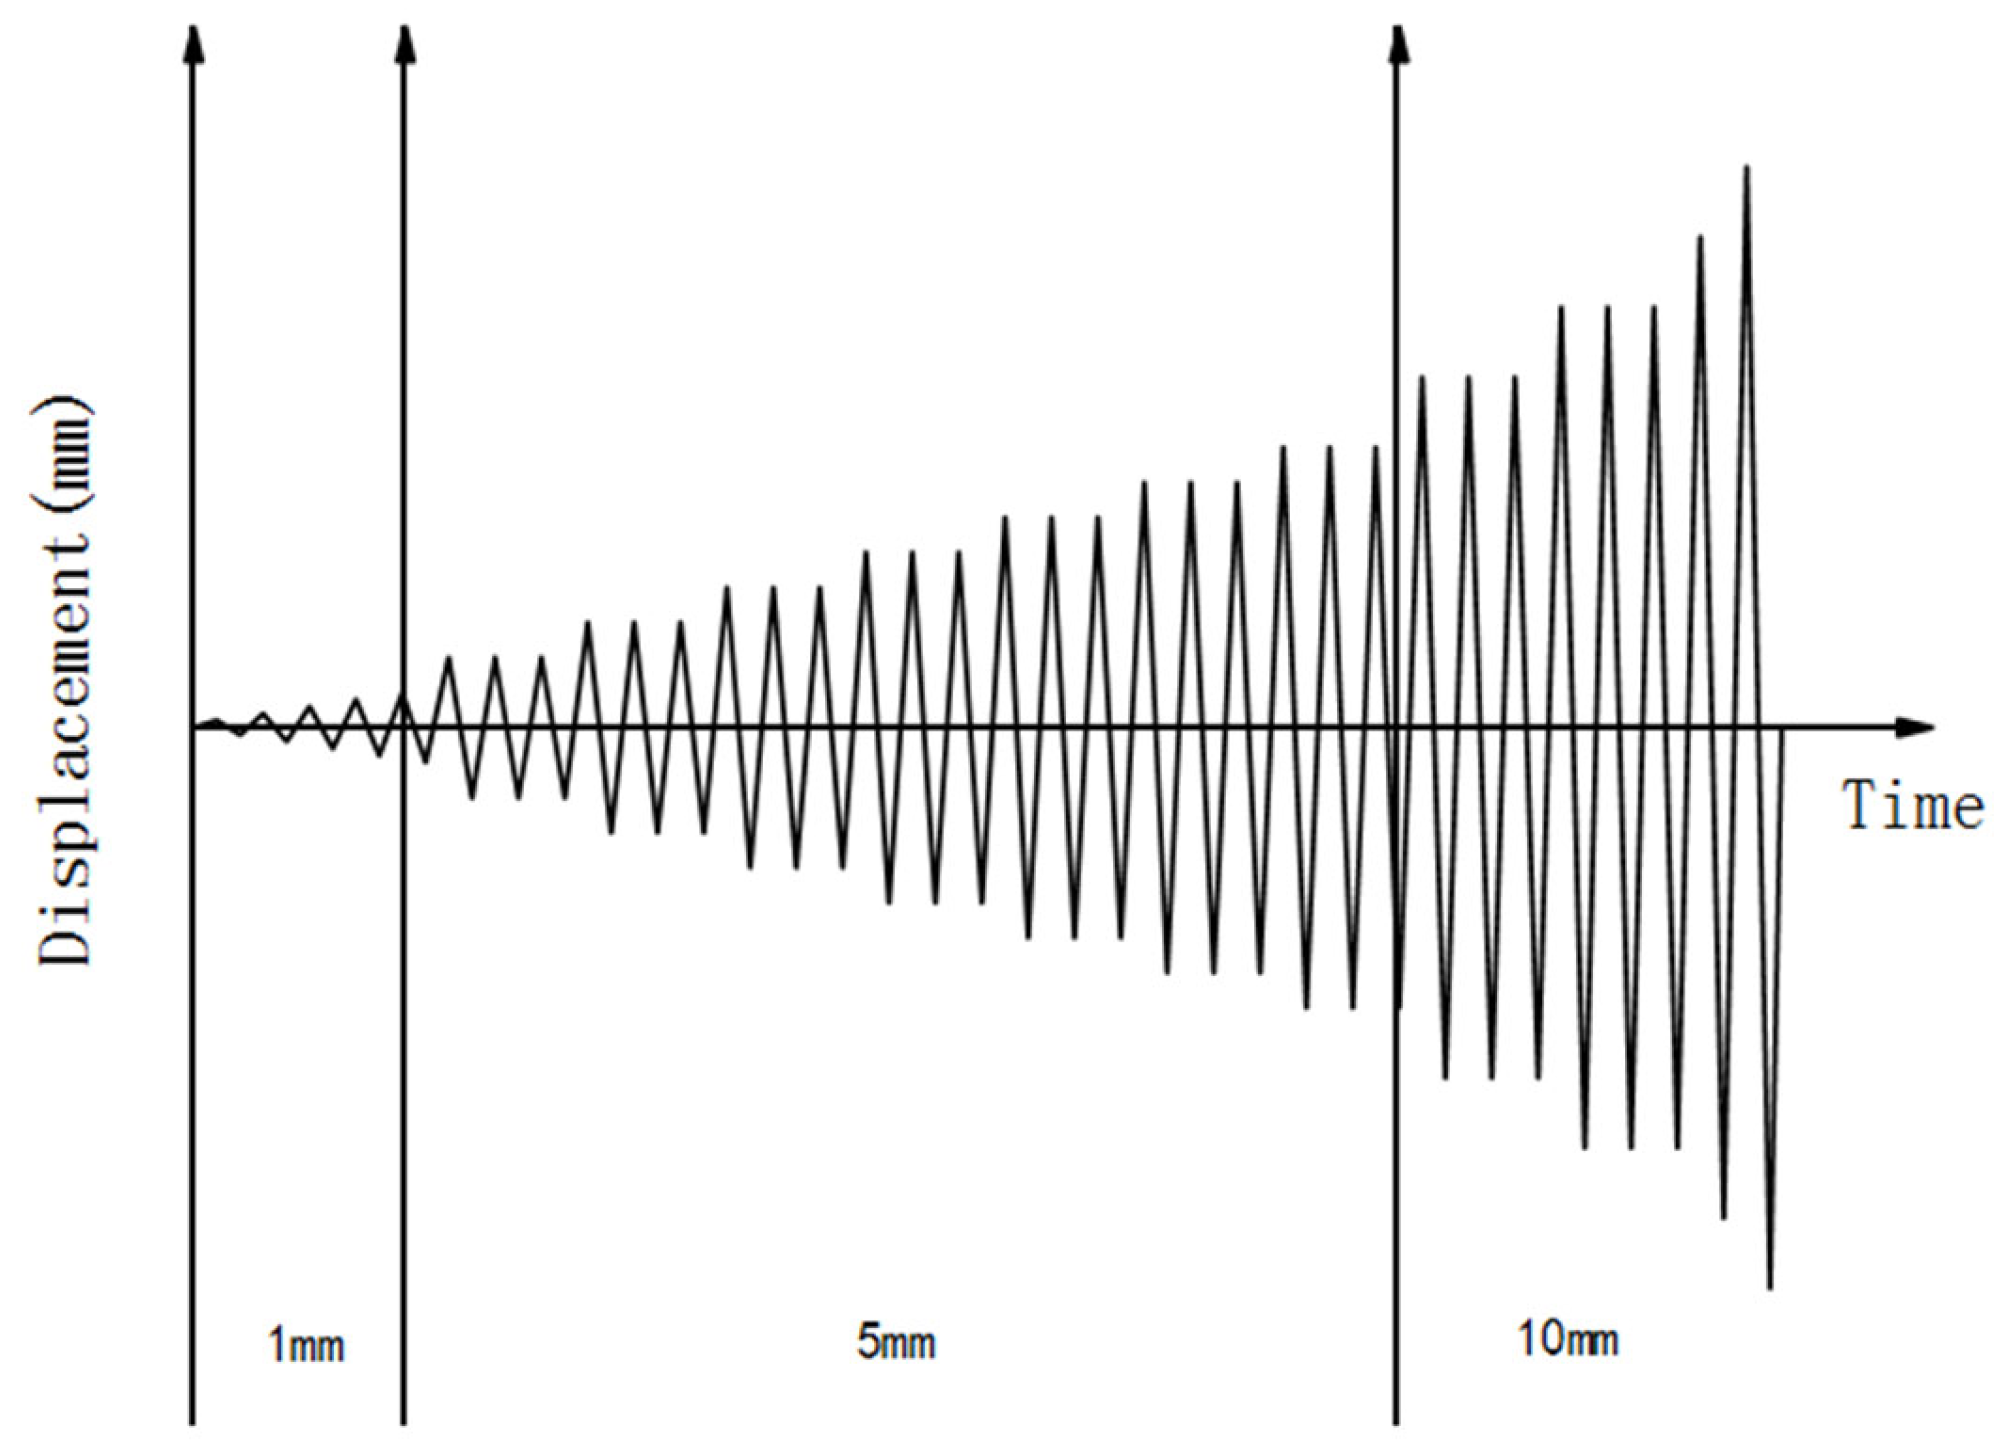
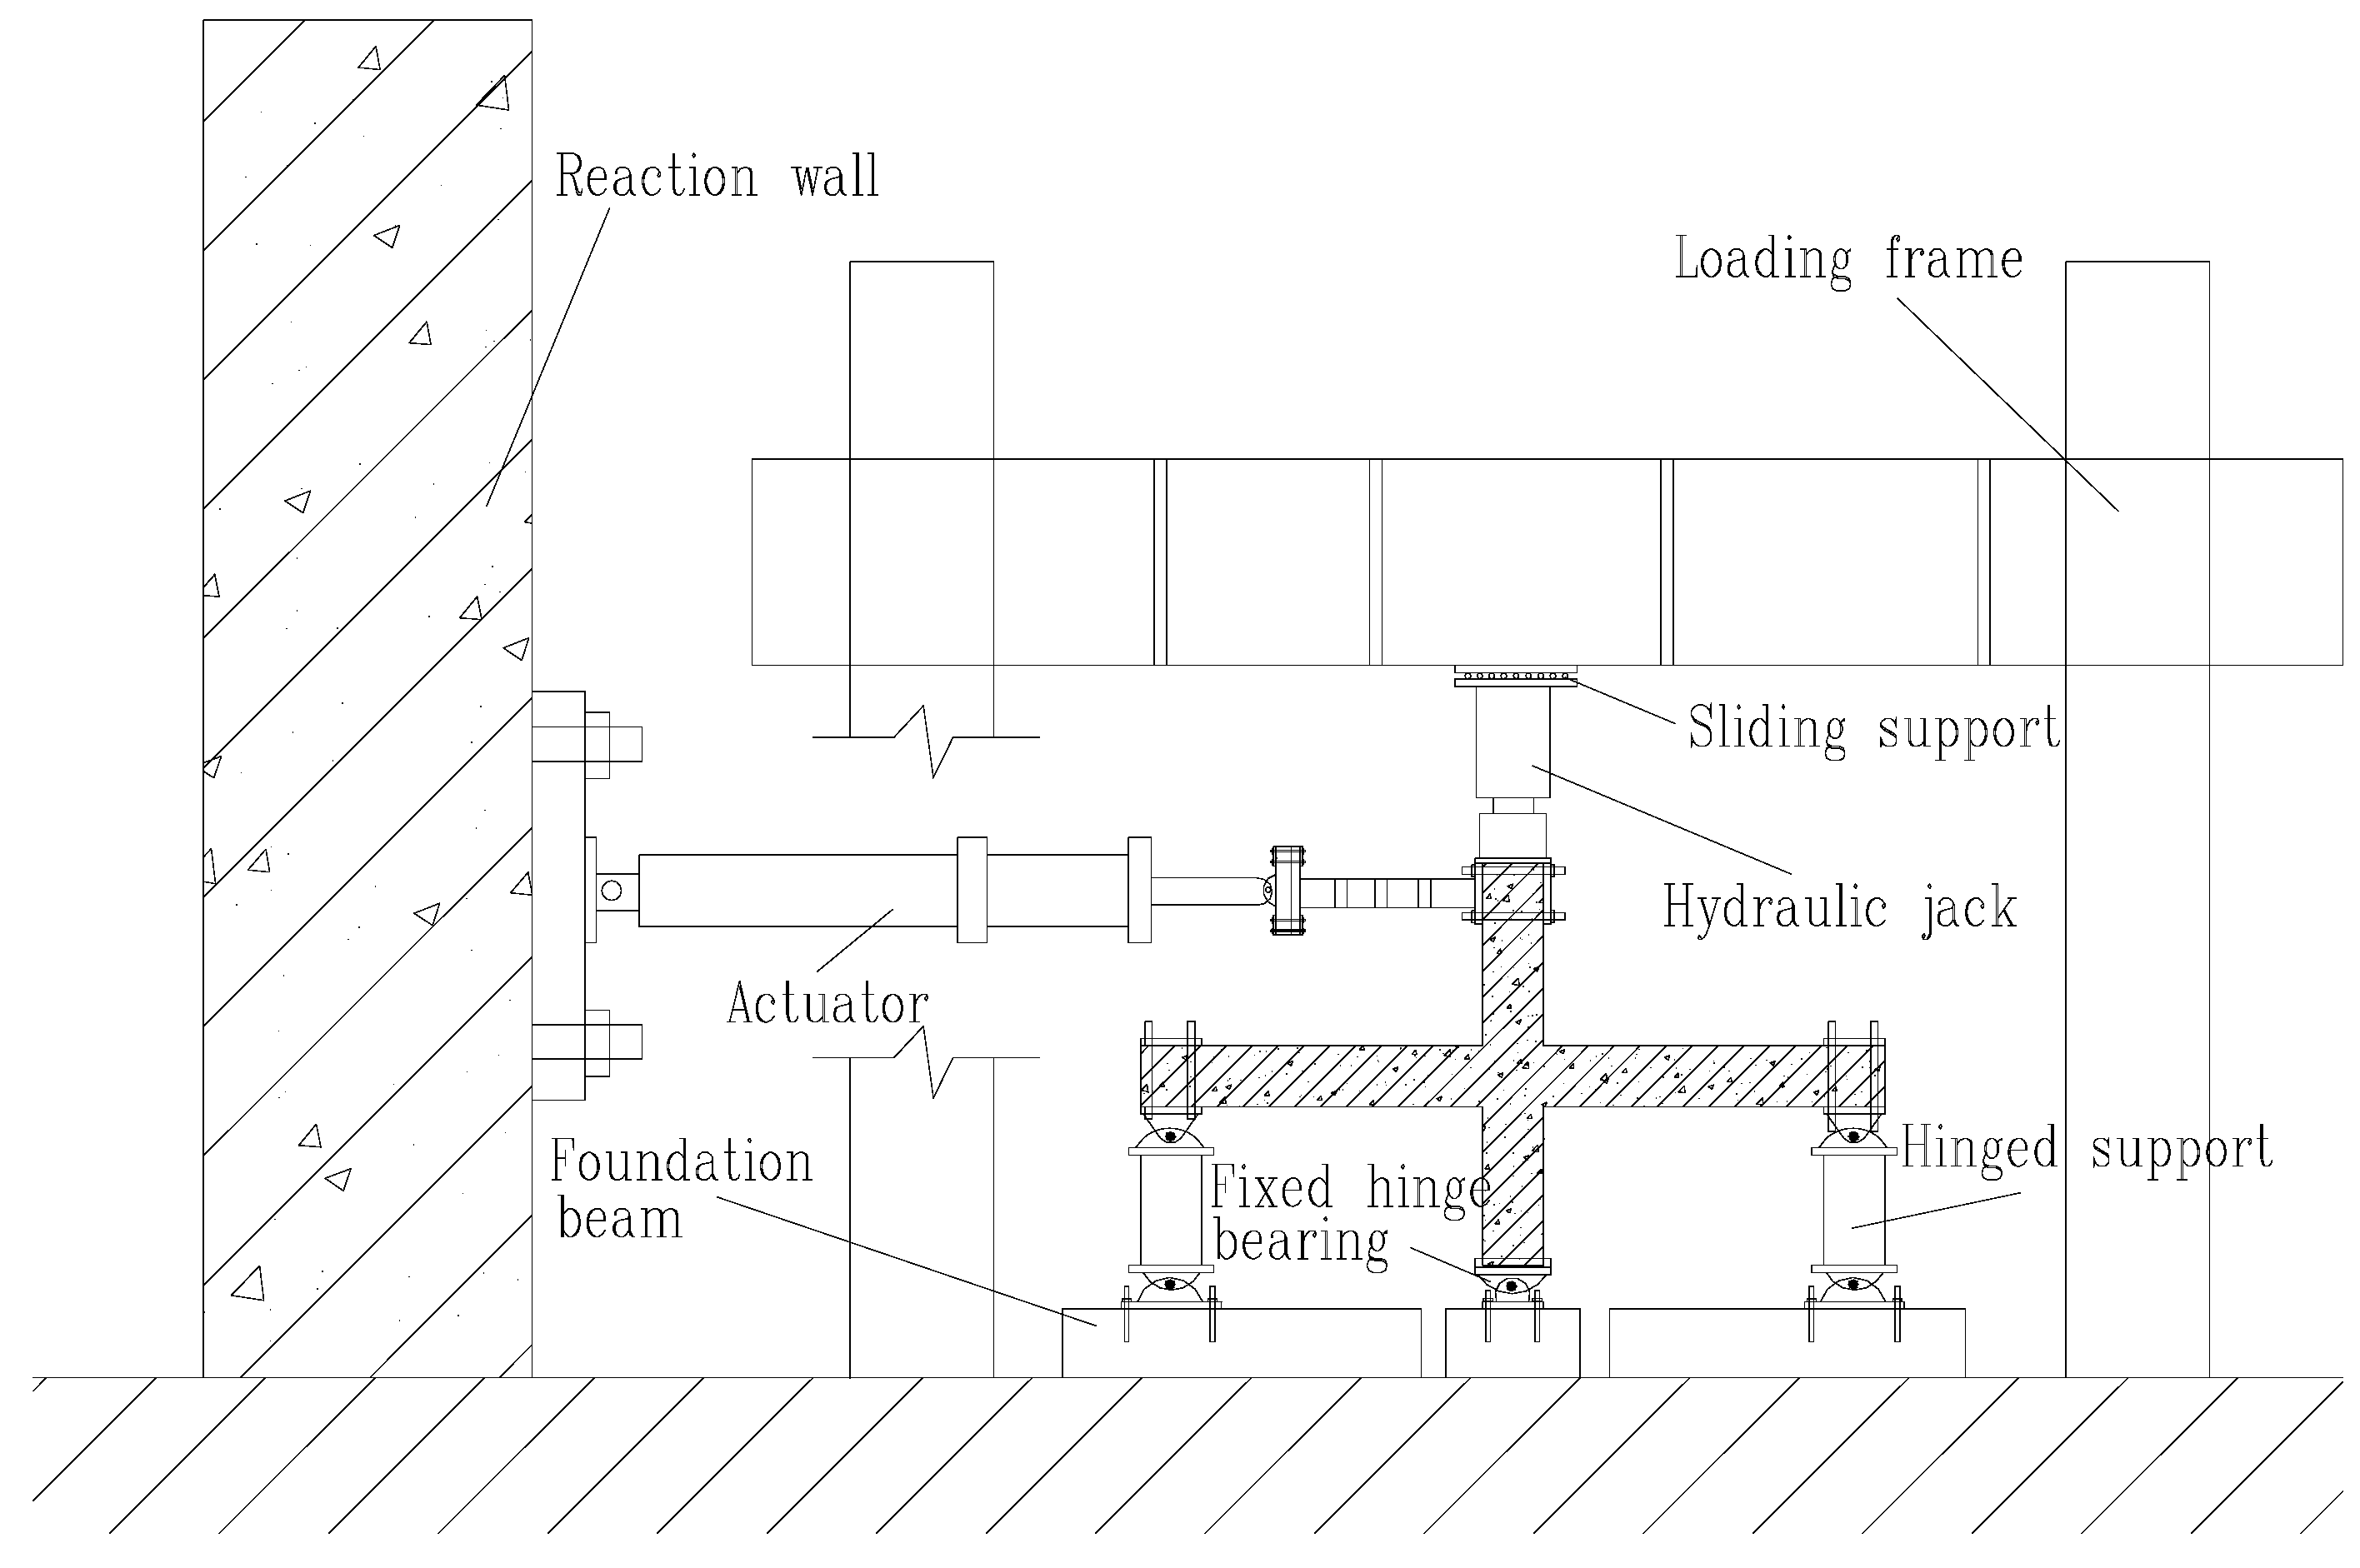
3.3. Loading Plan
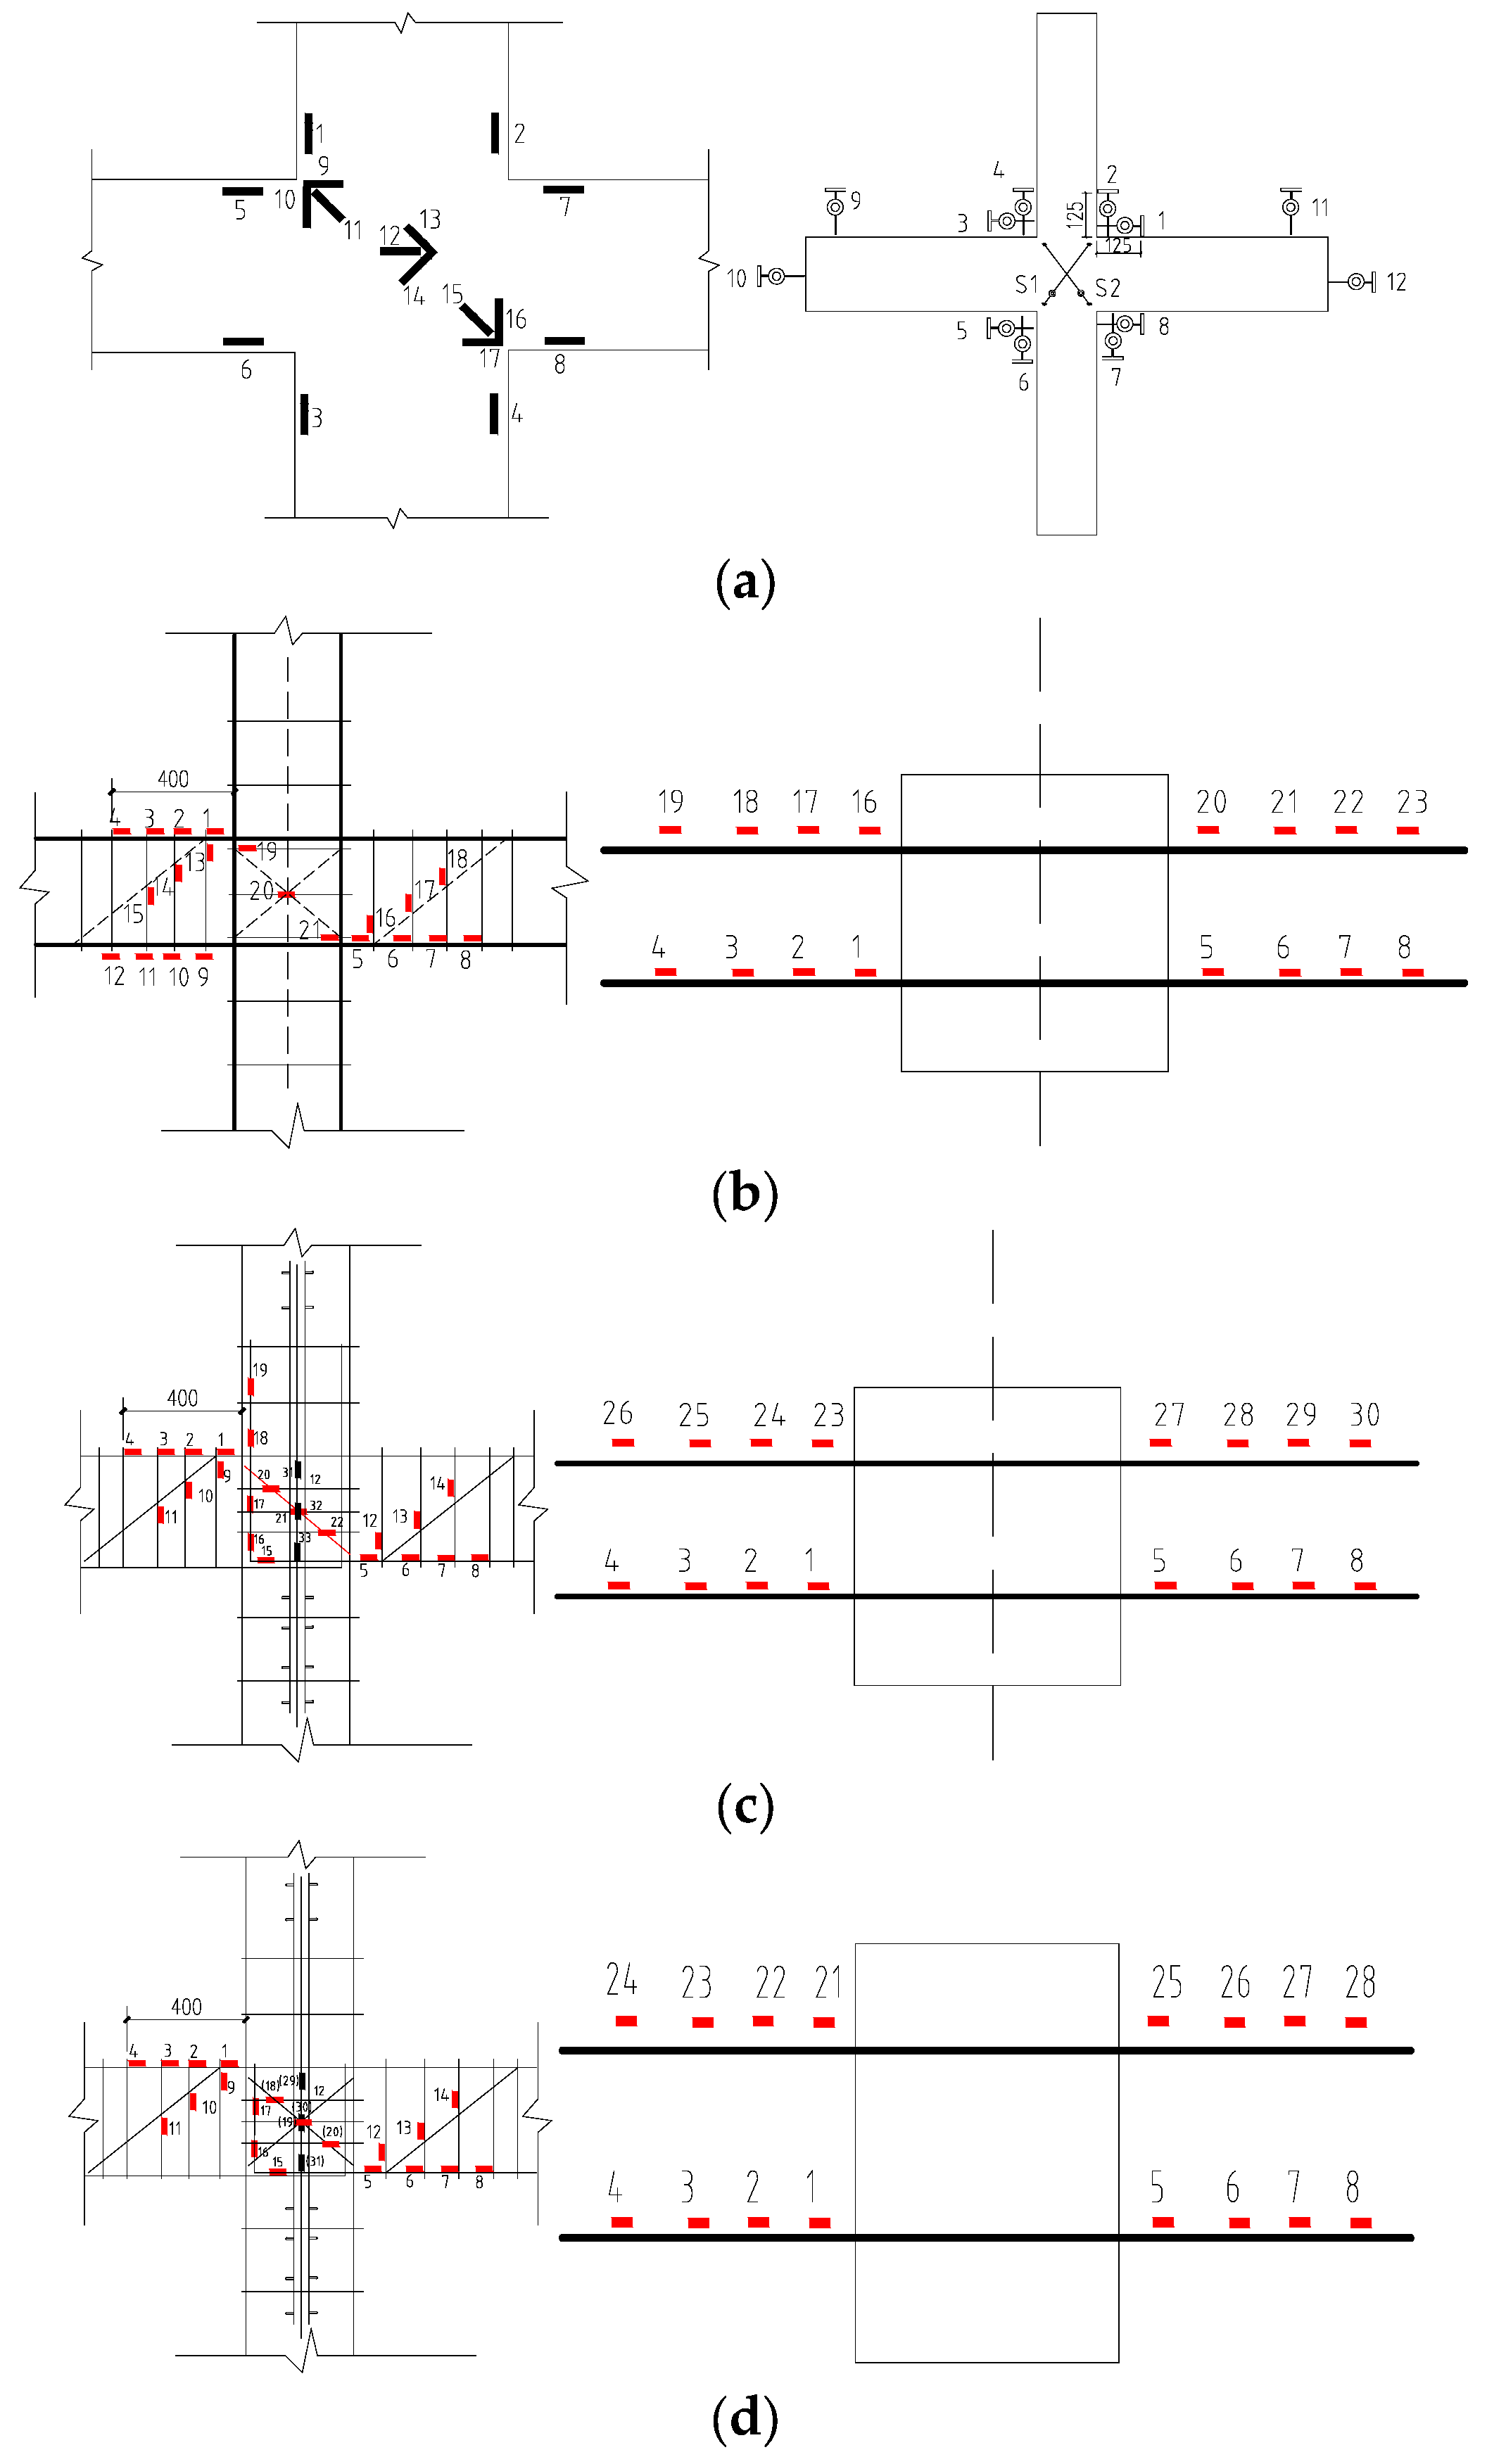
3.4. Measurement Plan
4. Phenomenological and Statistical Analysis of Results
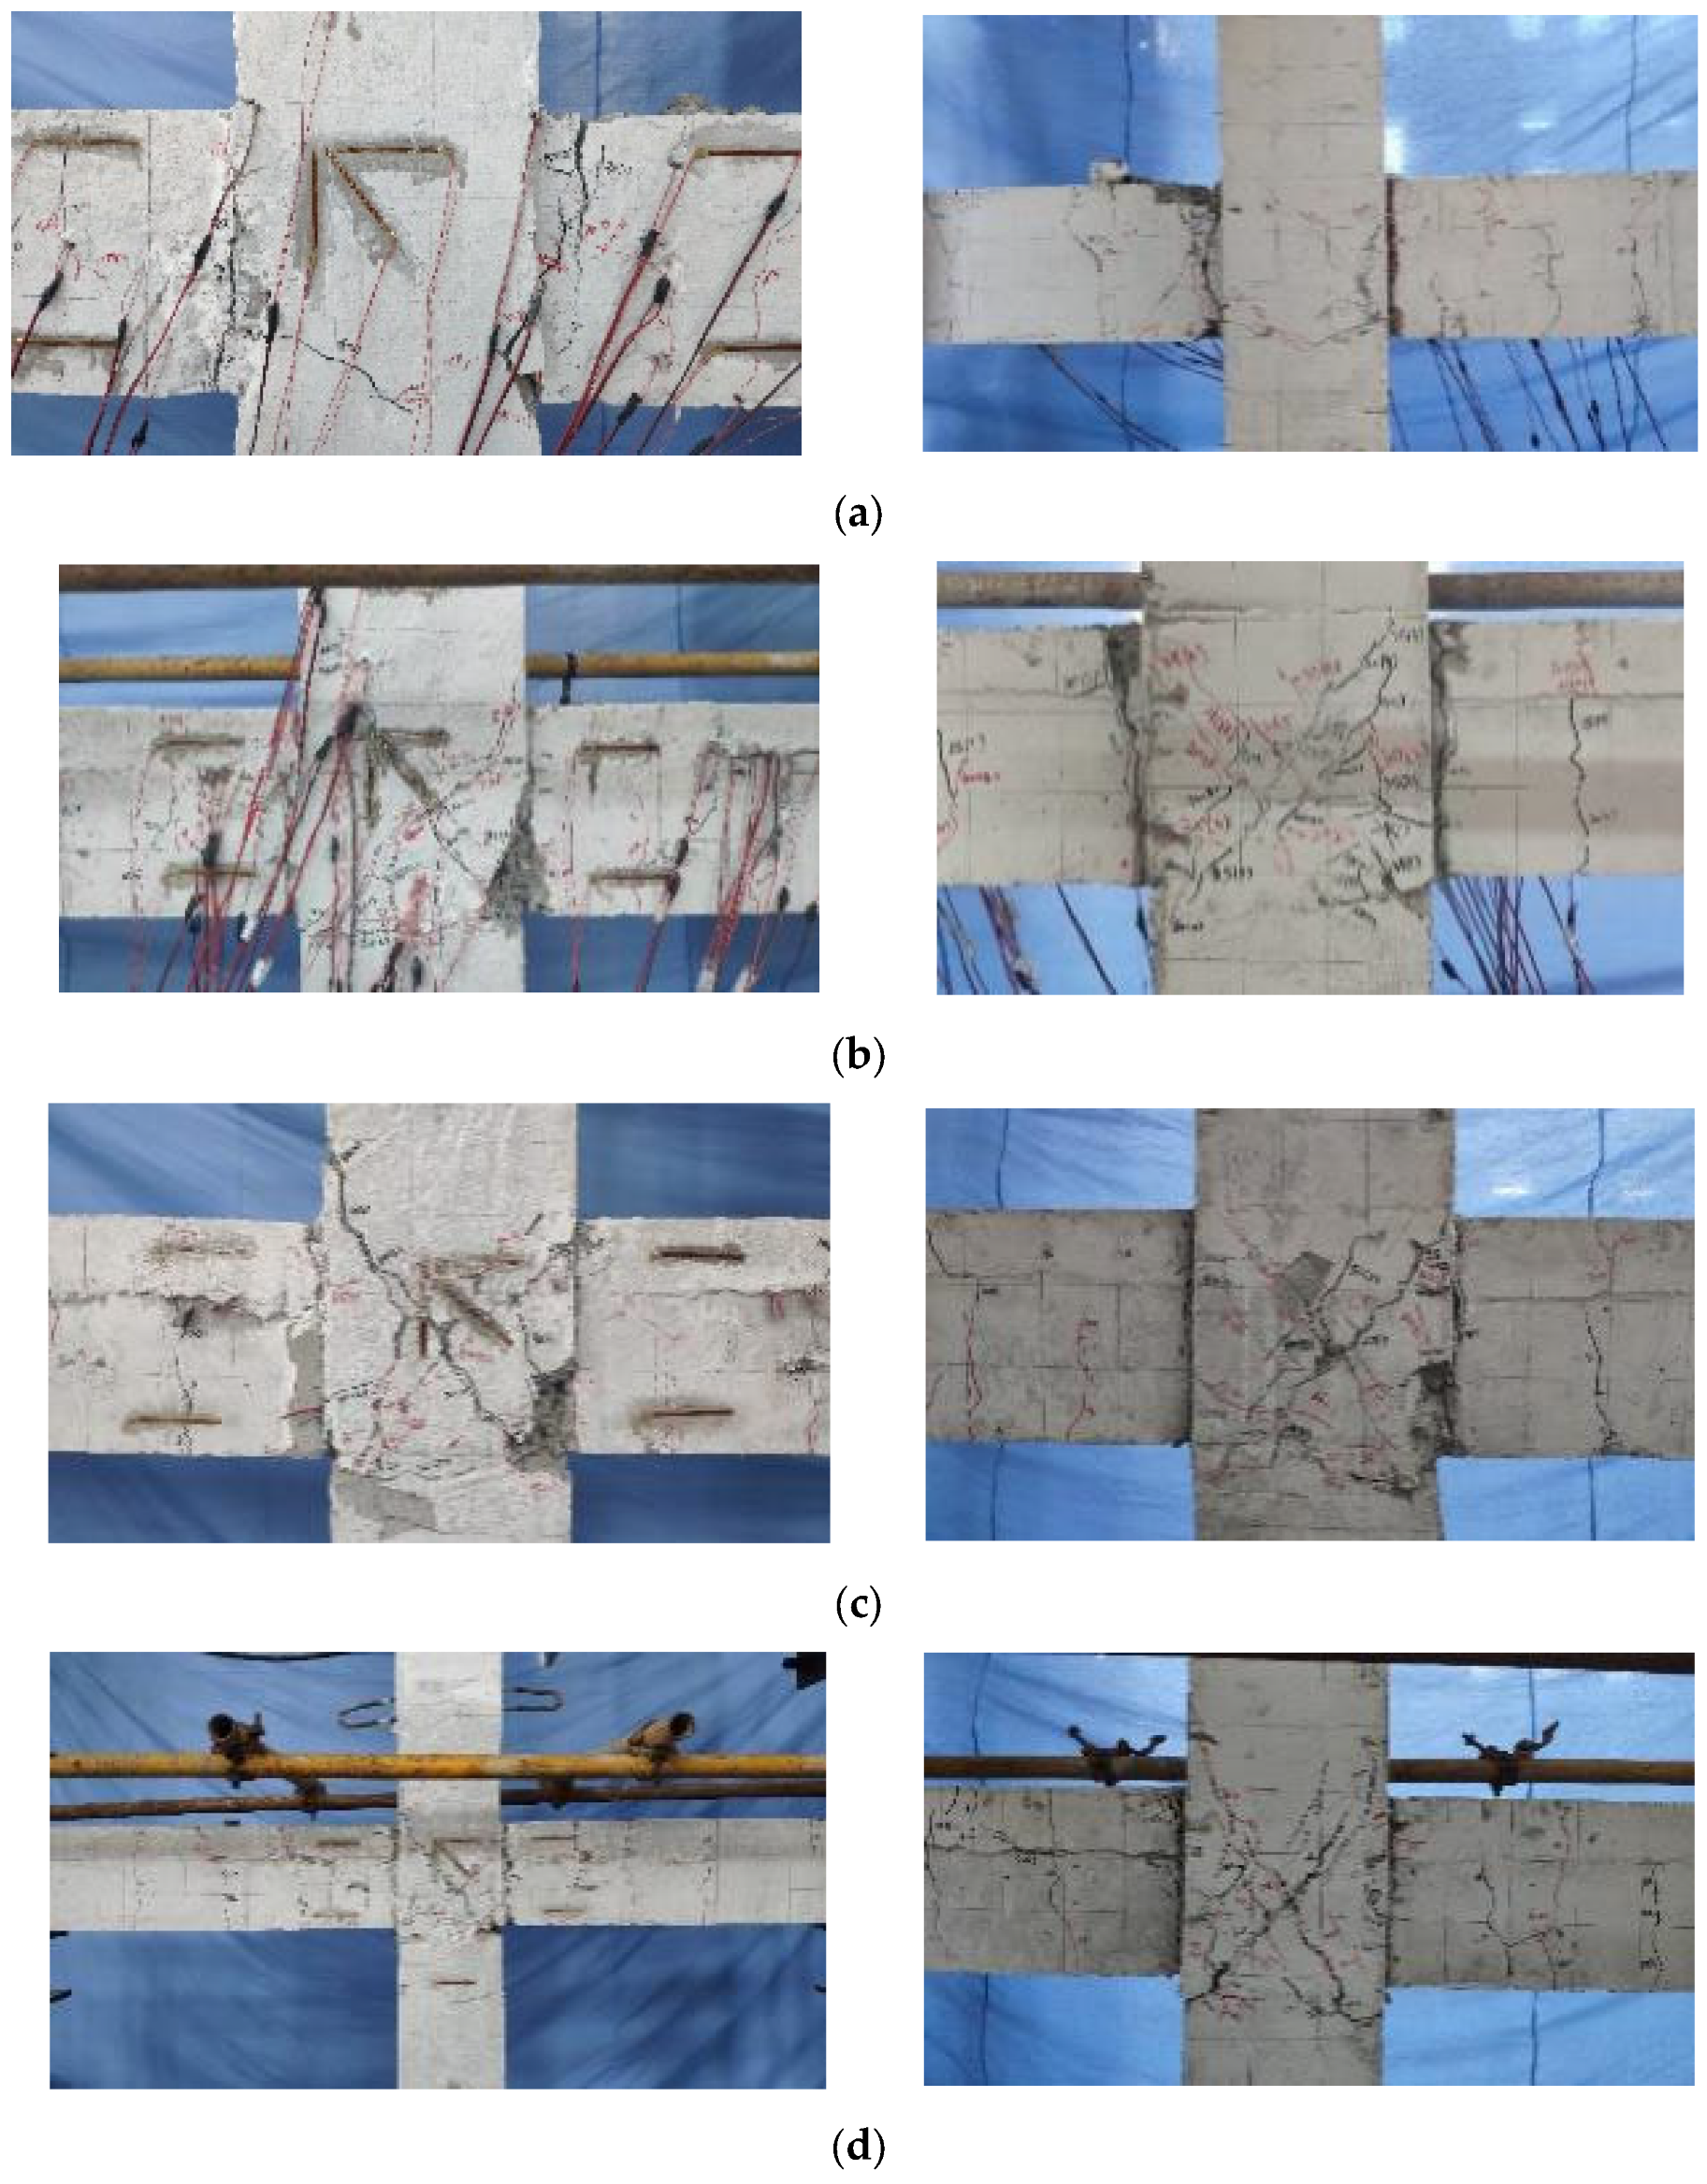
4.1. Analysis of Test Phenomena
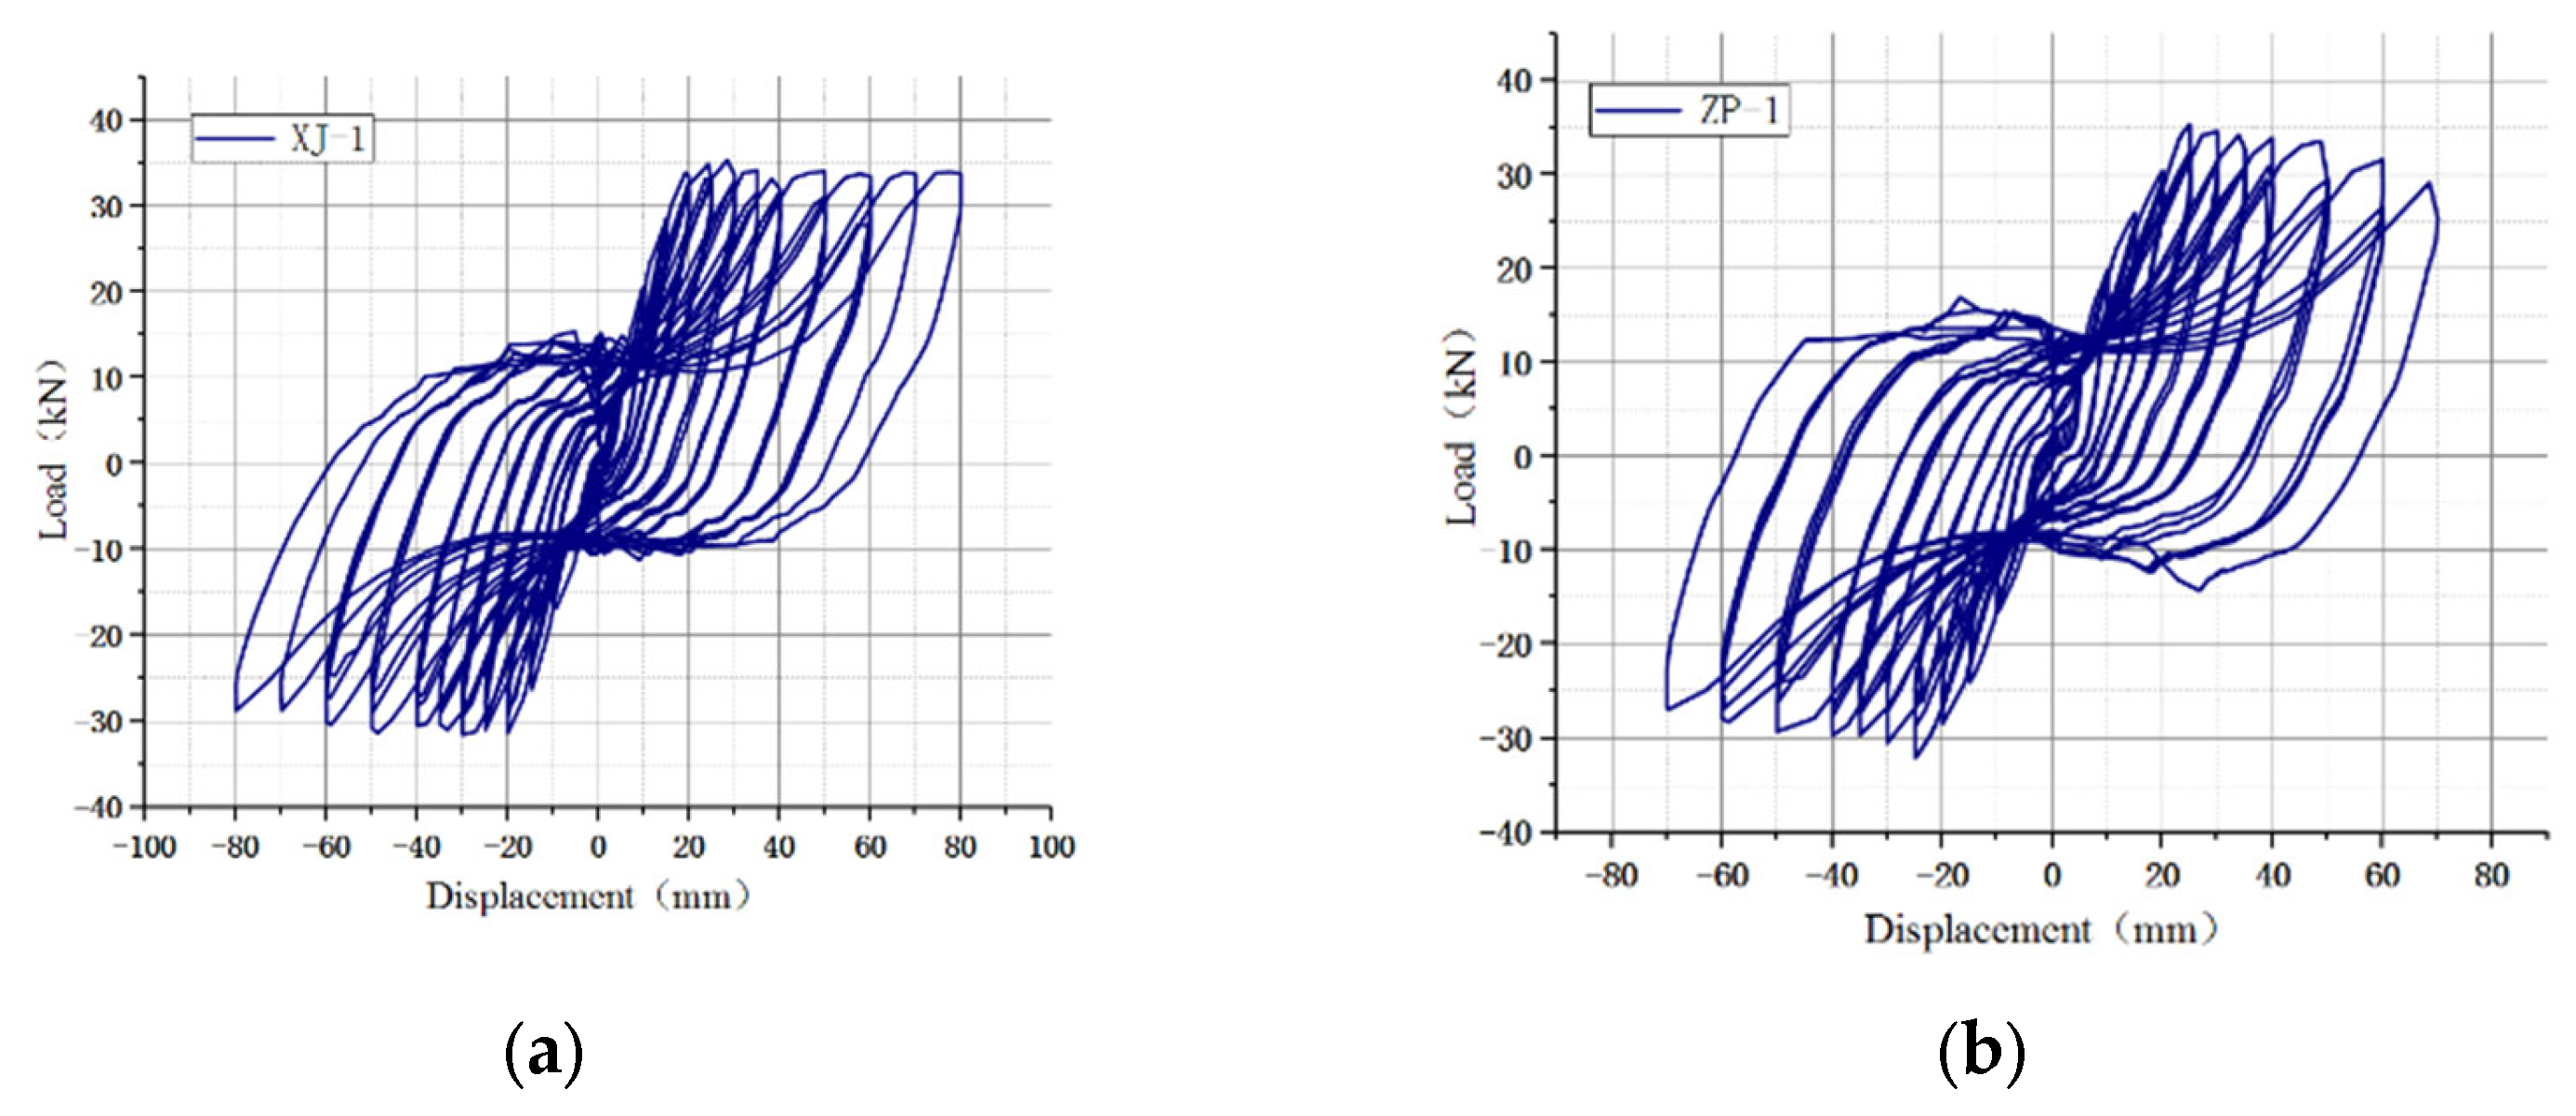
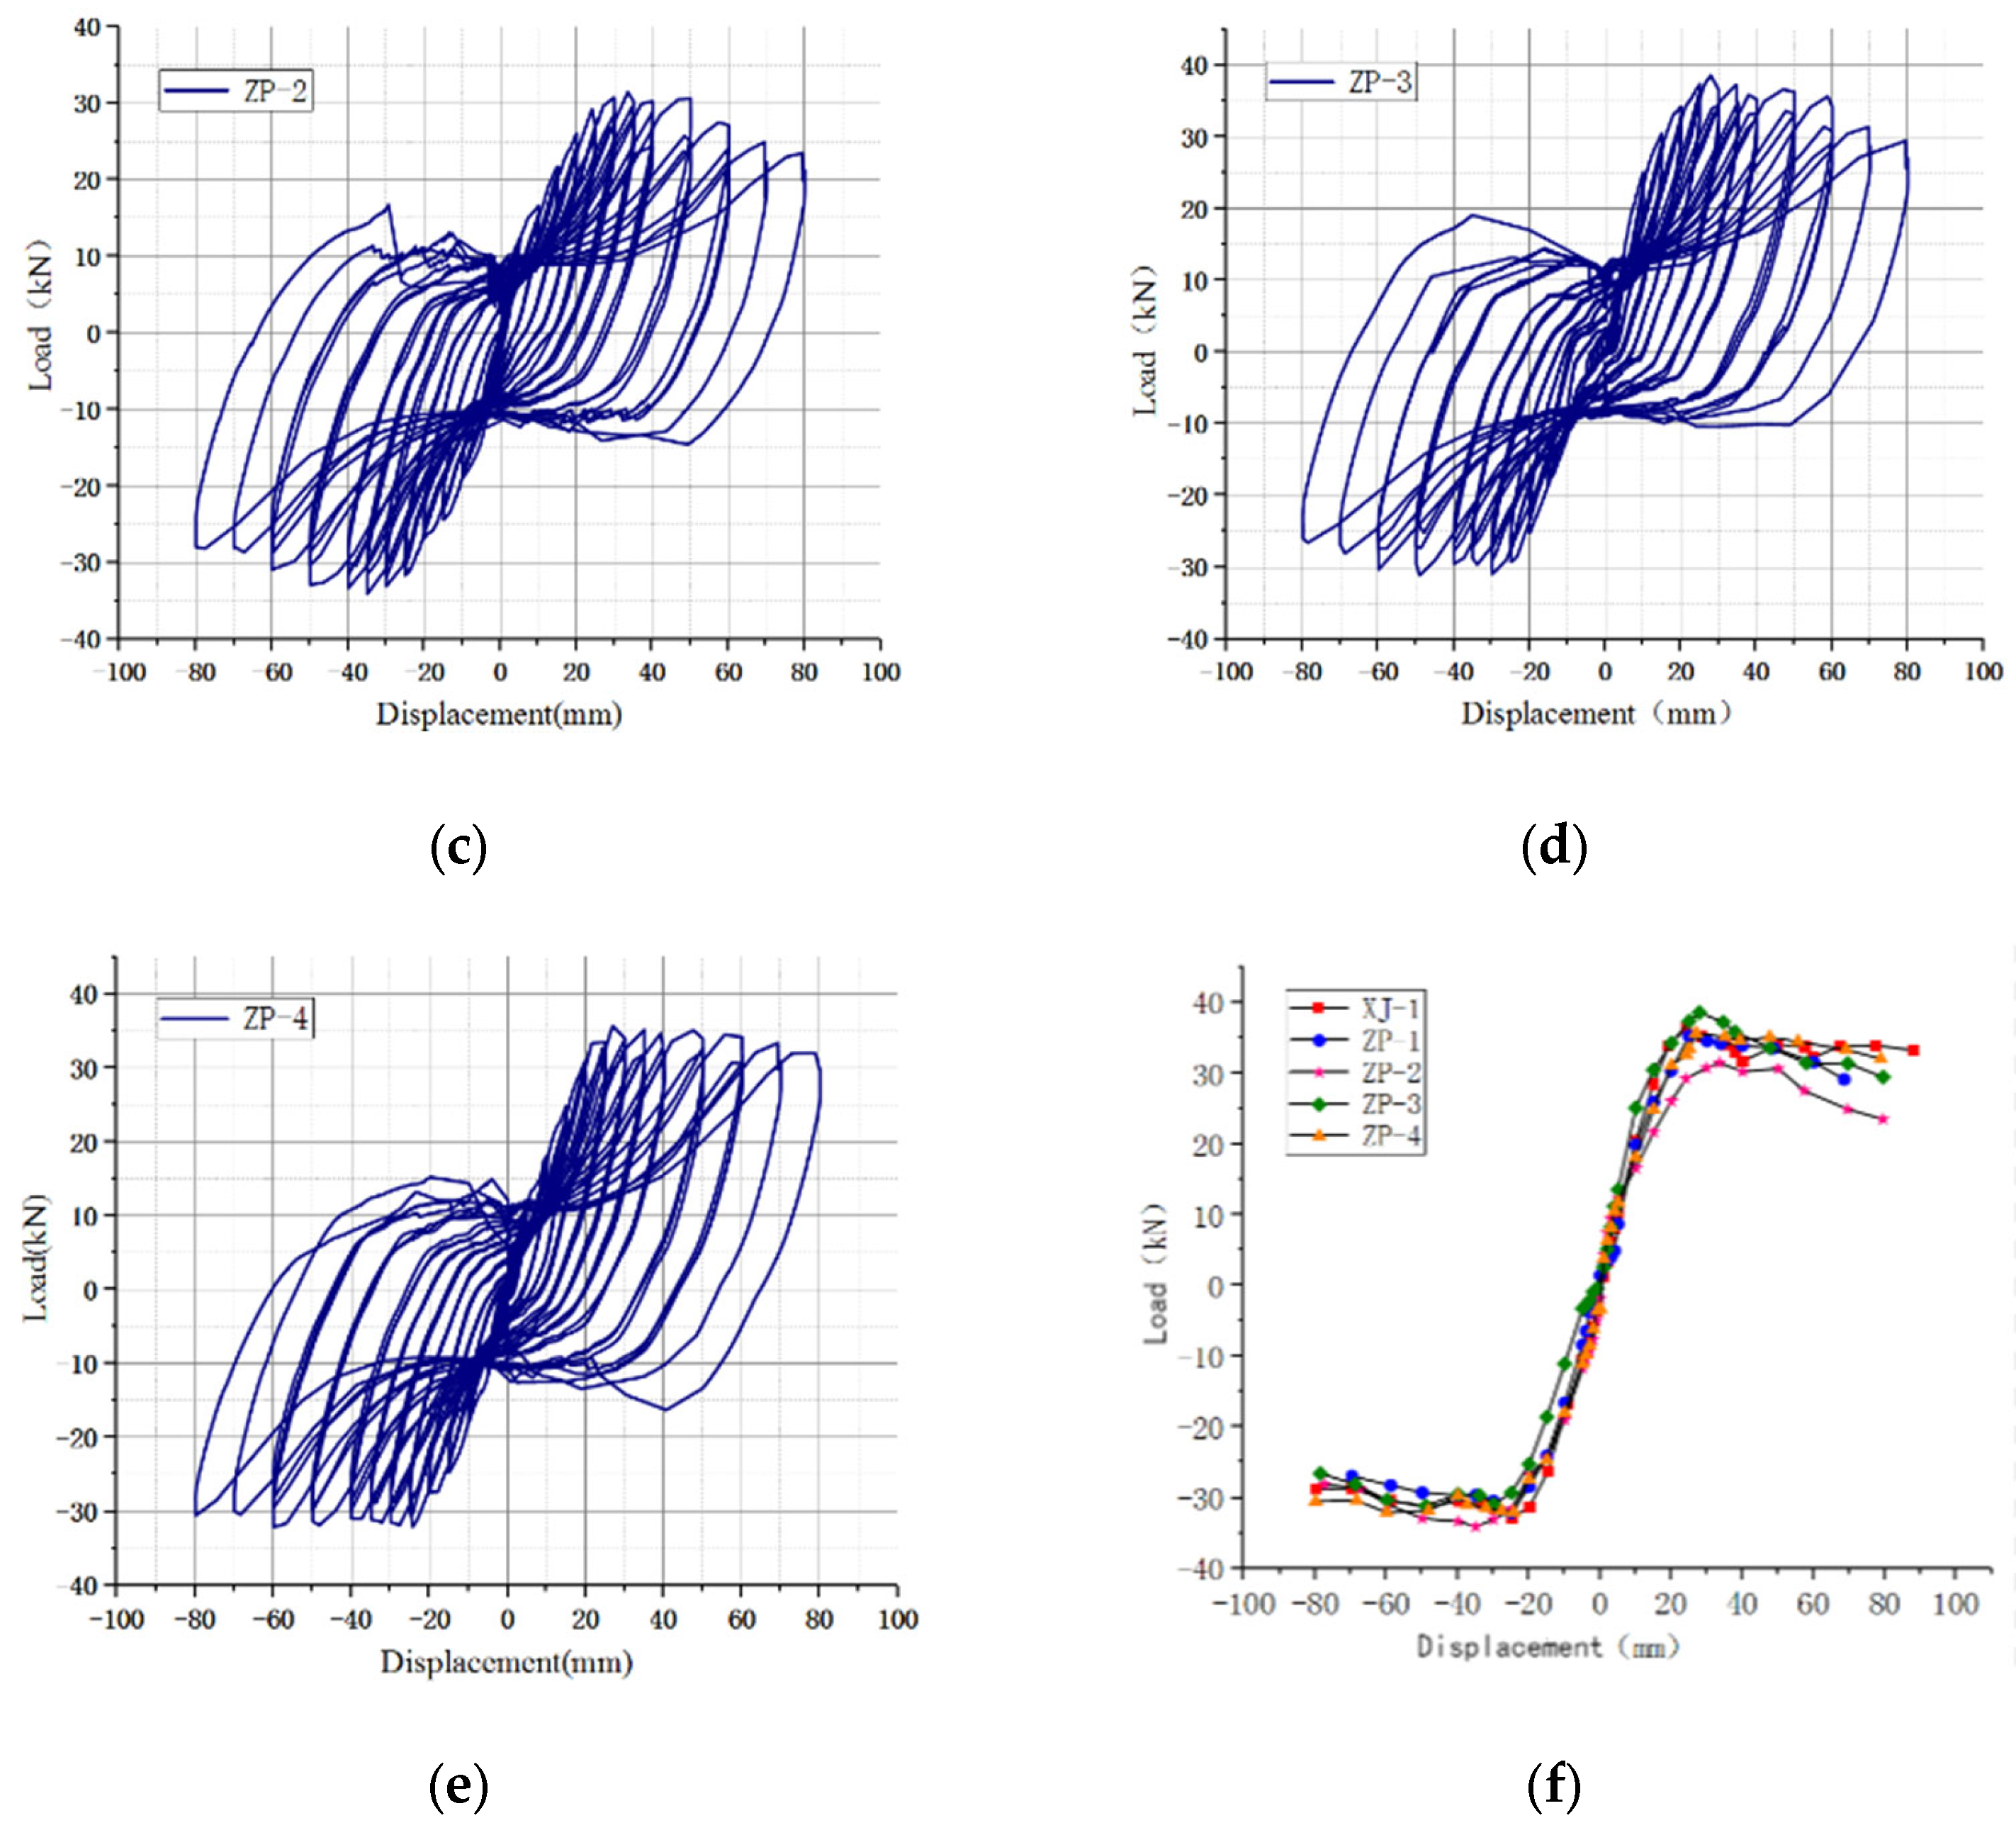
4.2. Interpretation of Hysteresis and Backbone Curves
4.3. Analysis of Ductility
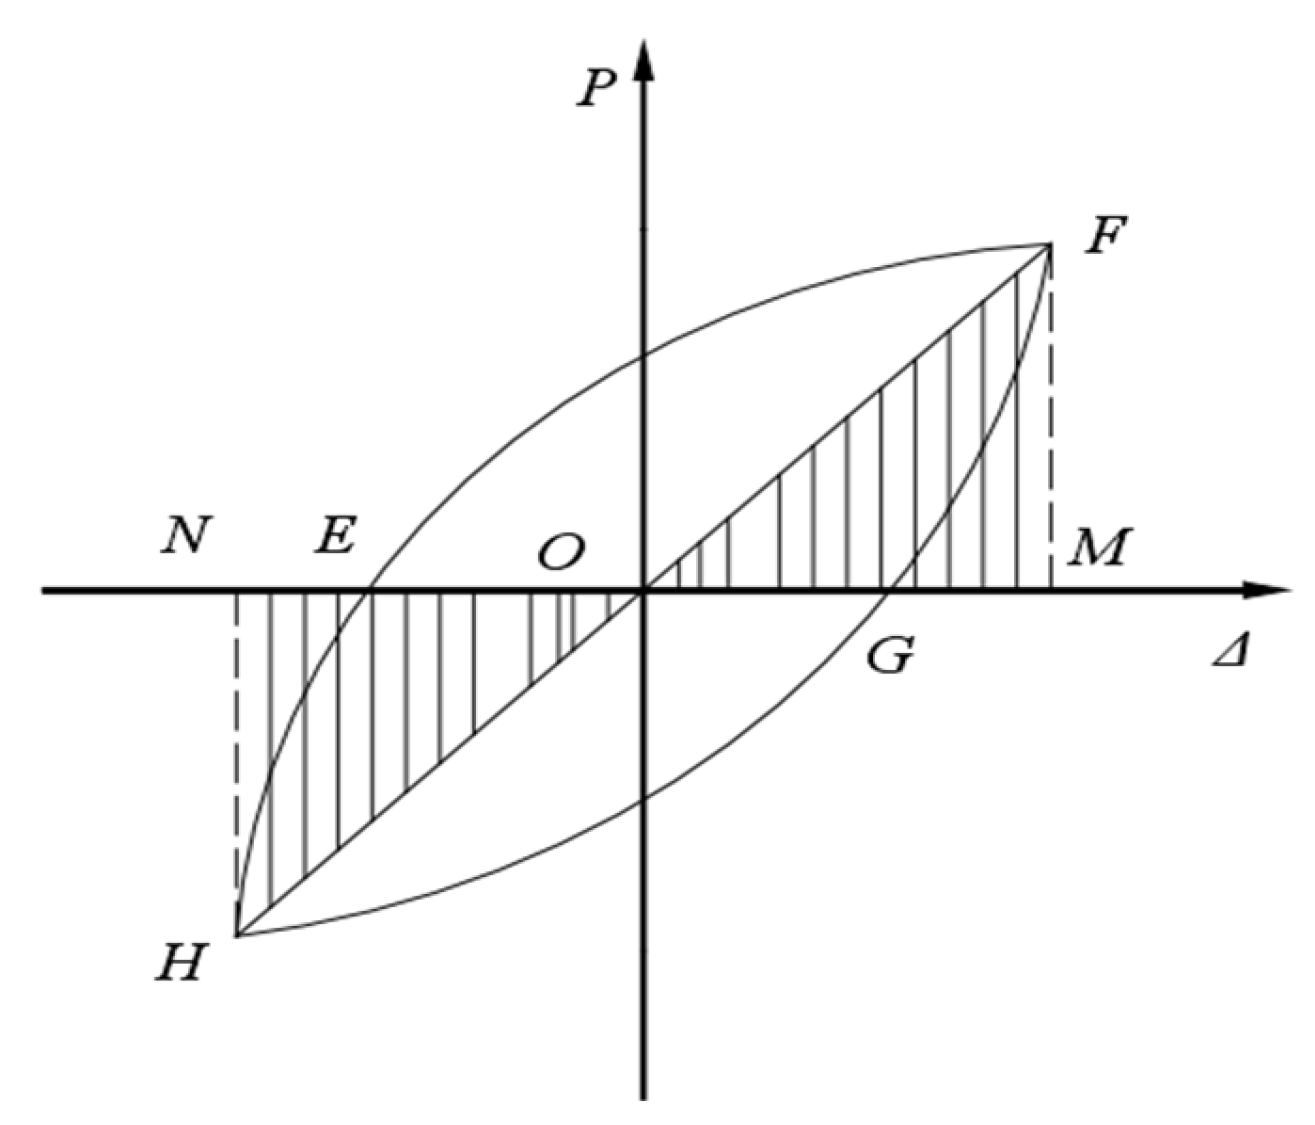
4.4. Analysis of Energy Dissipation
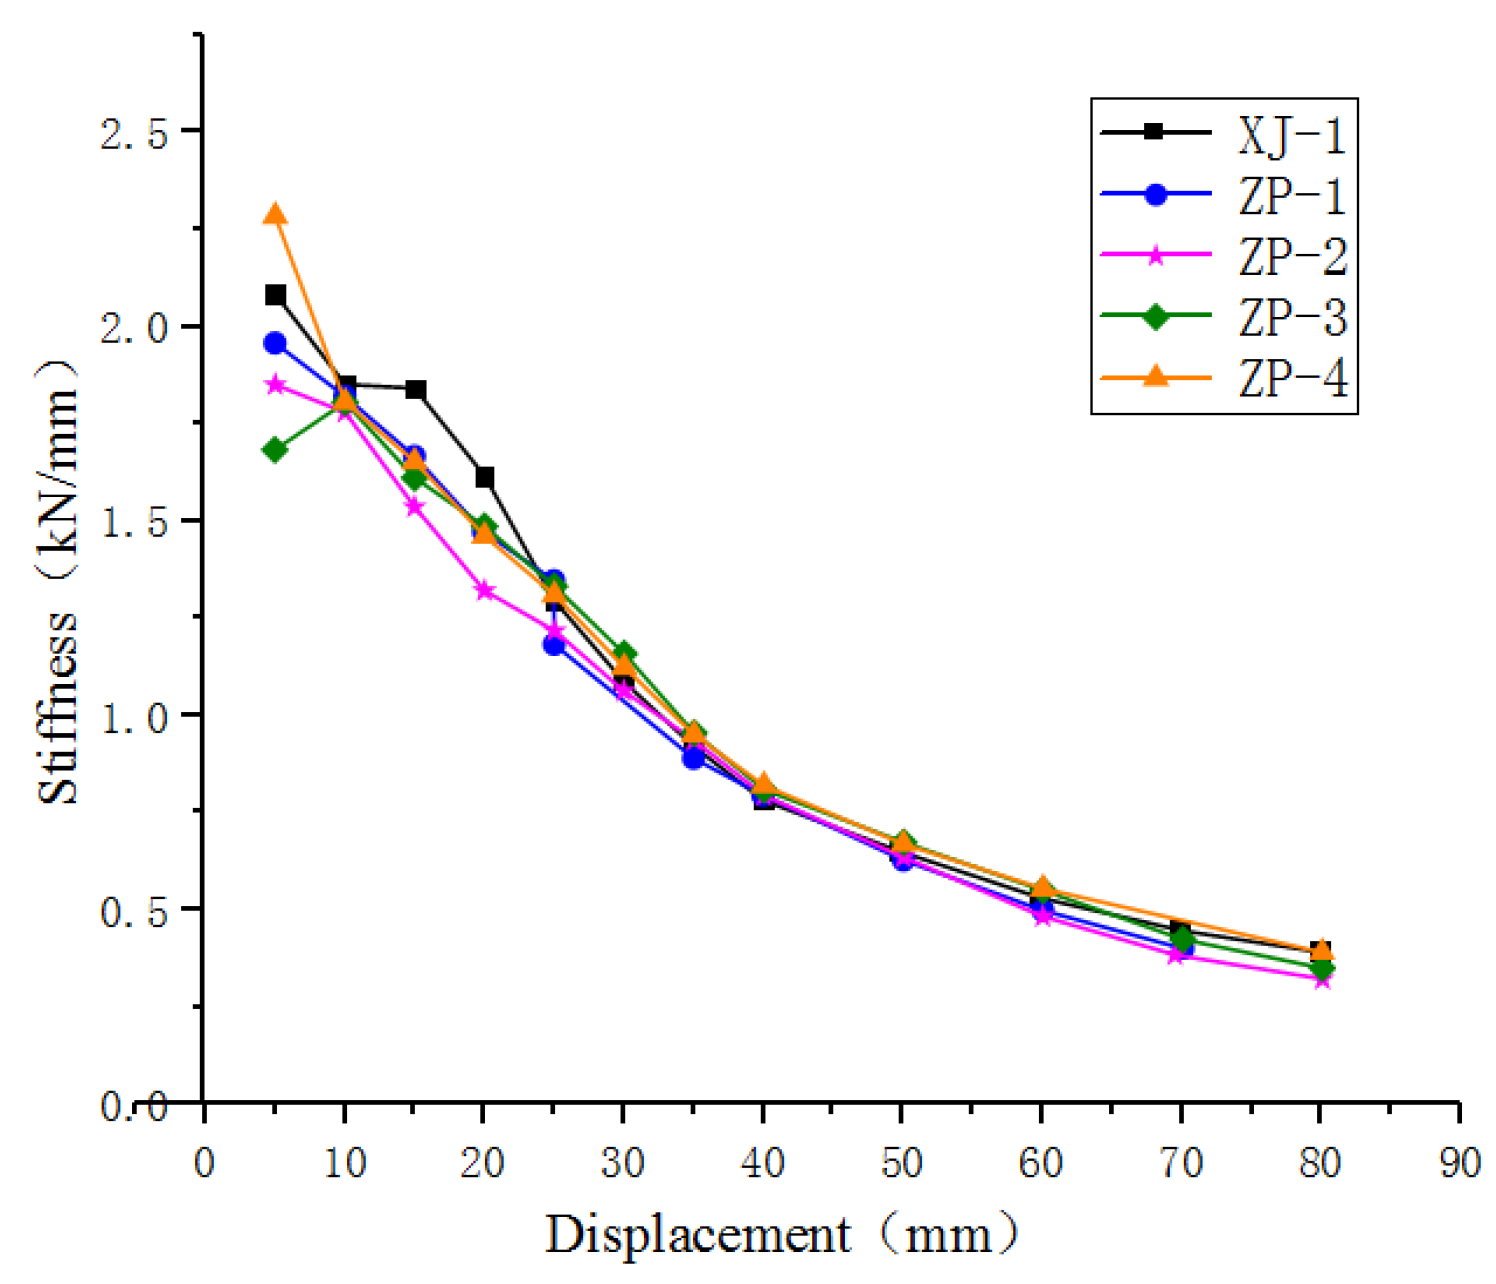
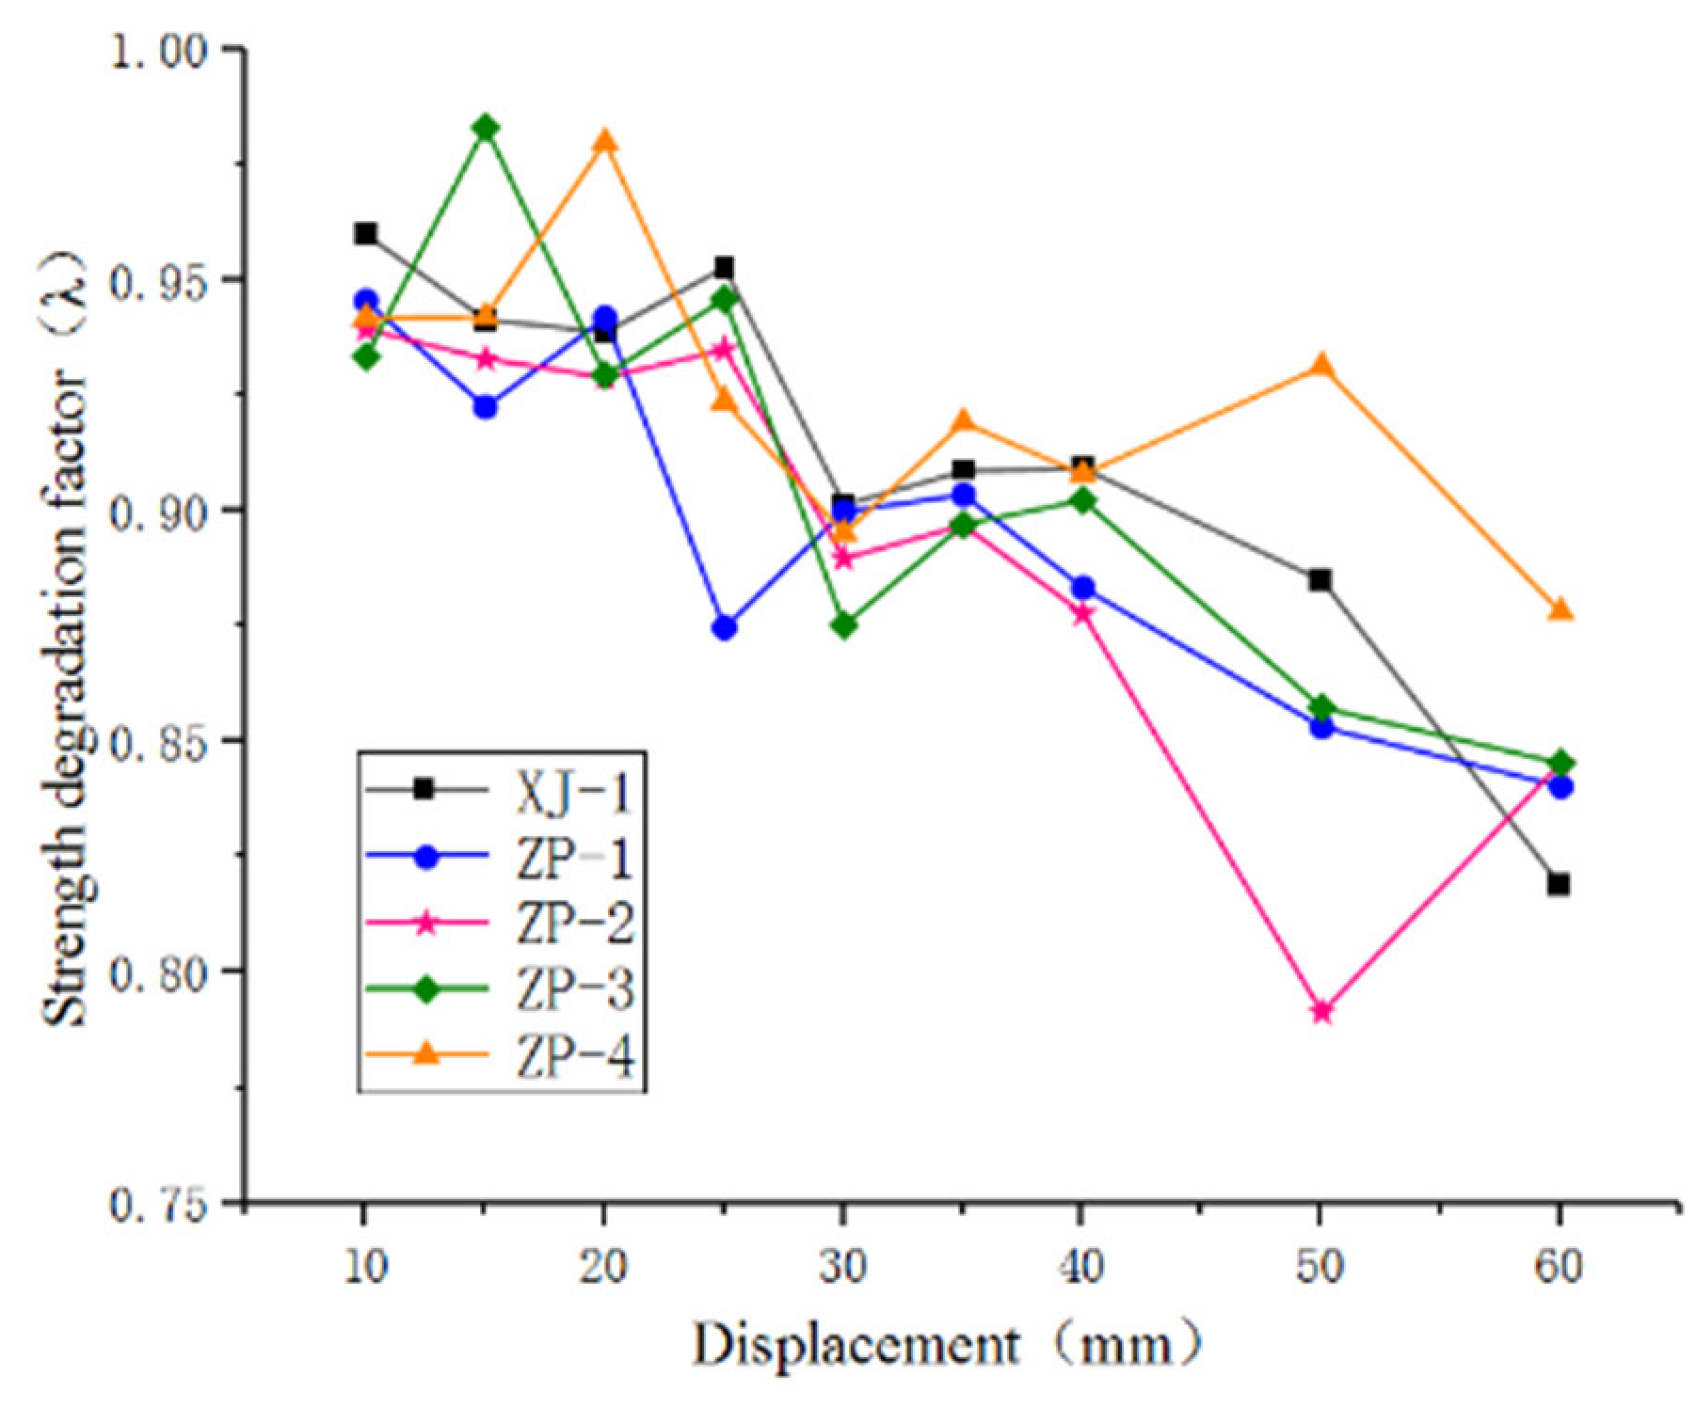
4.5. Analysis of Stiffness Degradation and Strength Degradation
5. Finite Element Analysis and Shear Capacity Checking Calculation
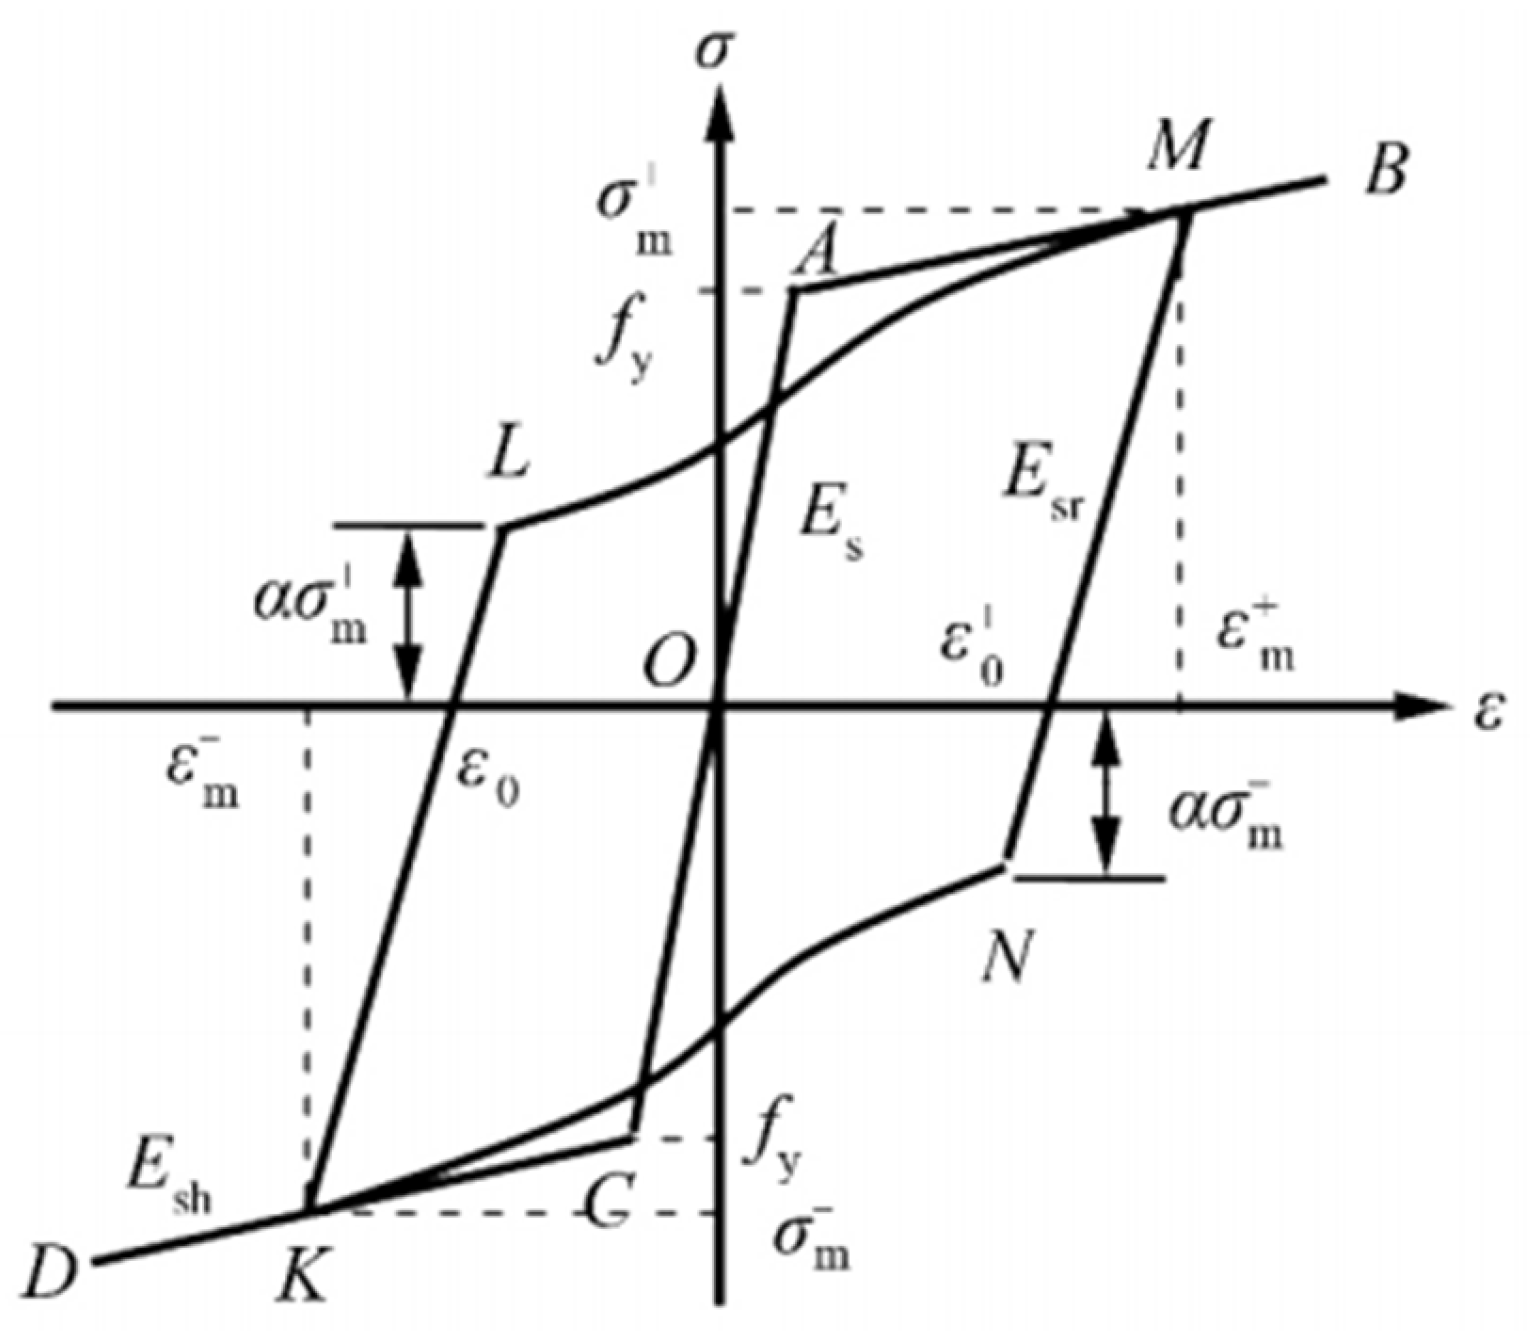
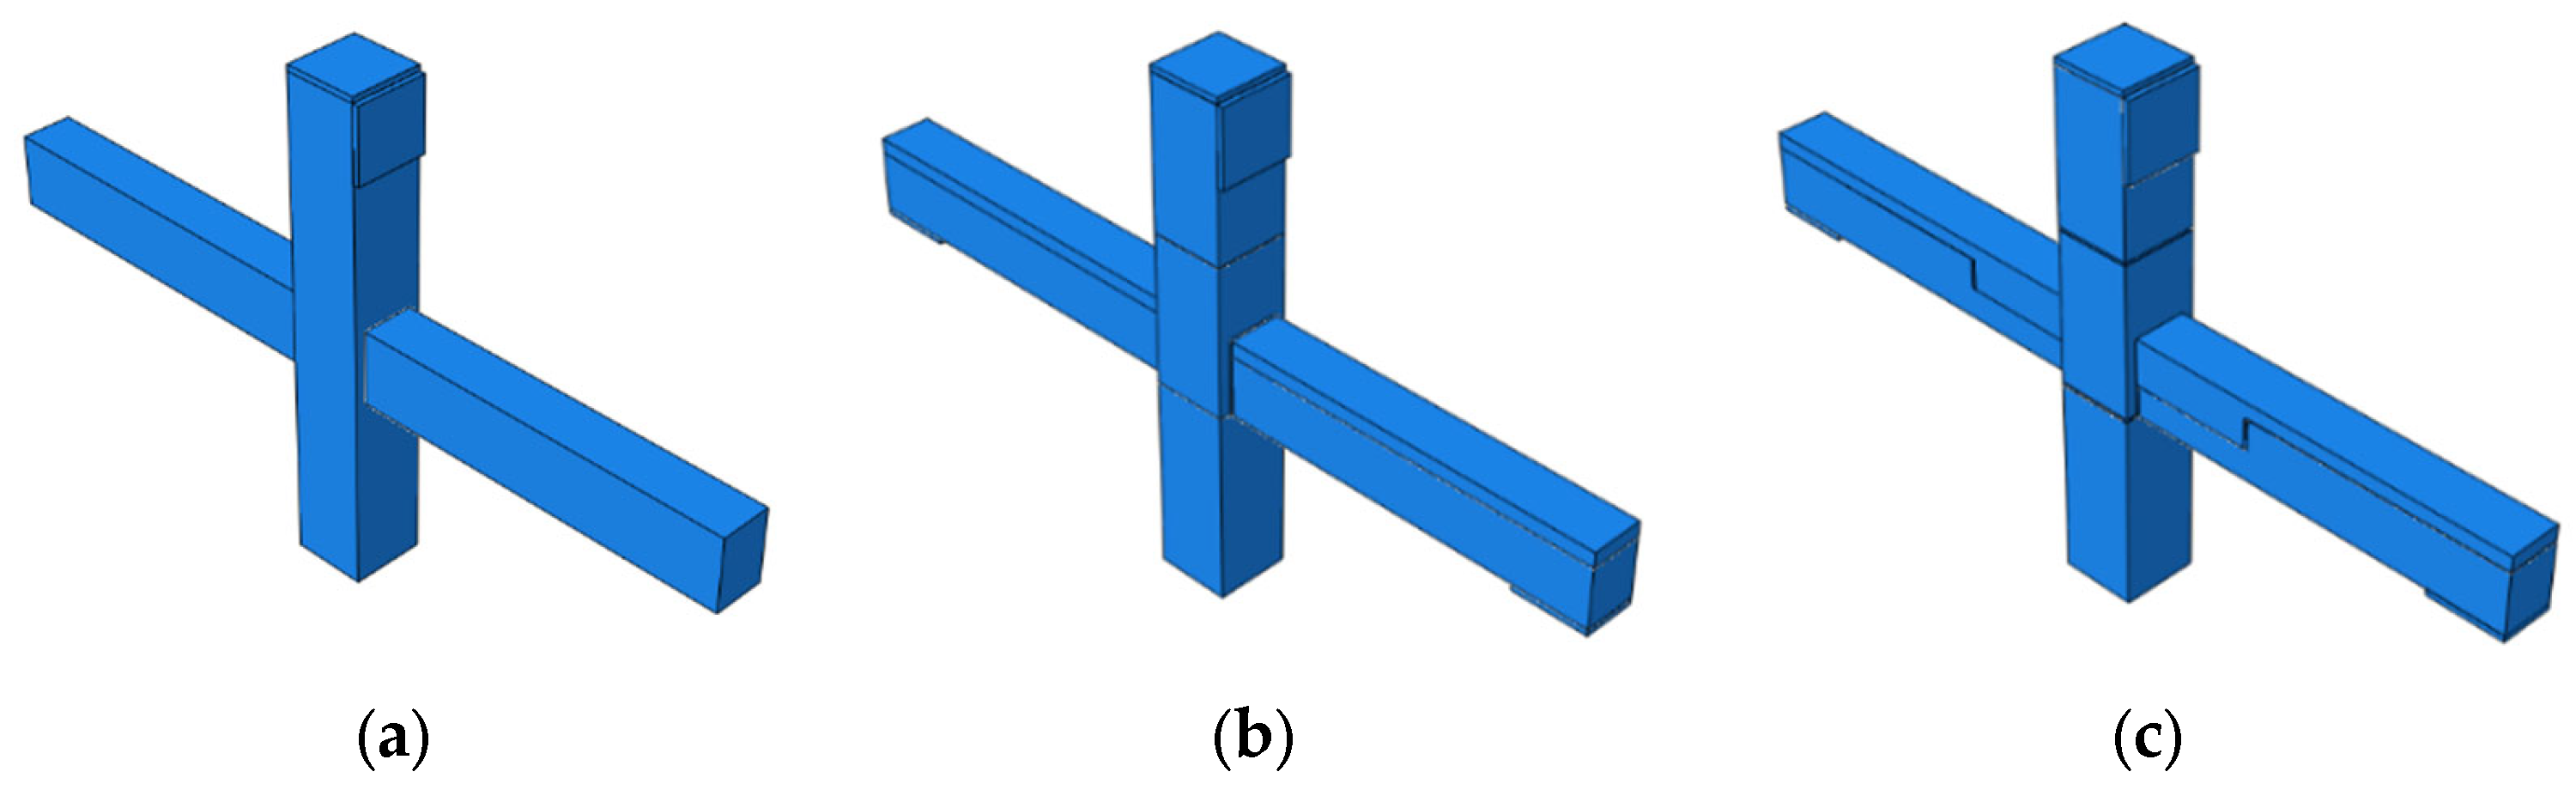
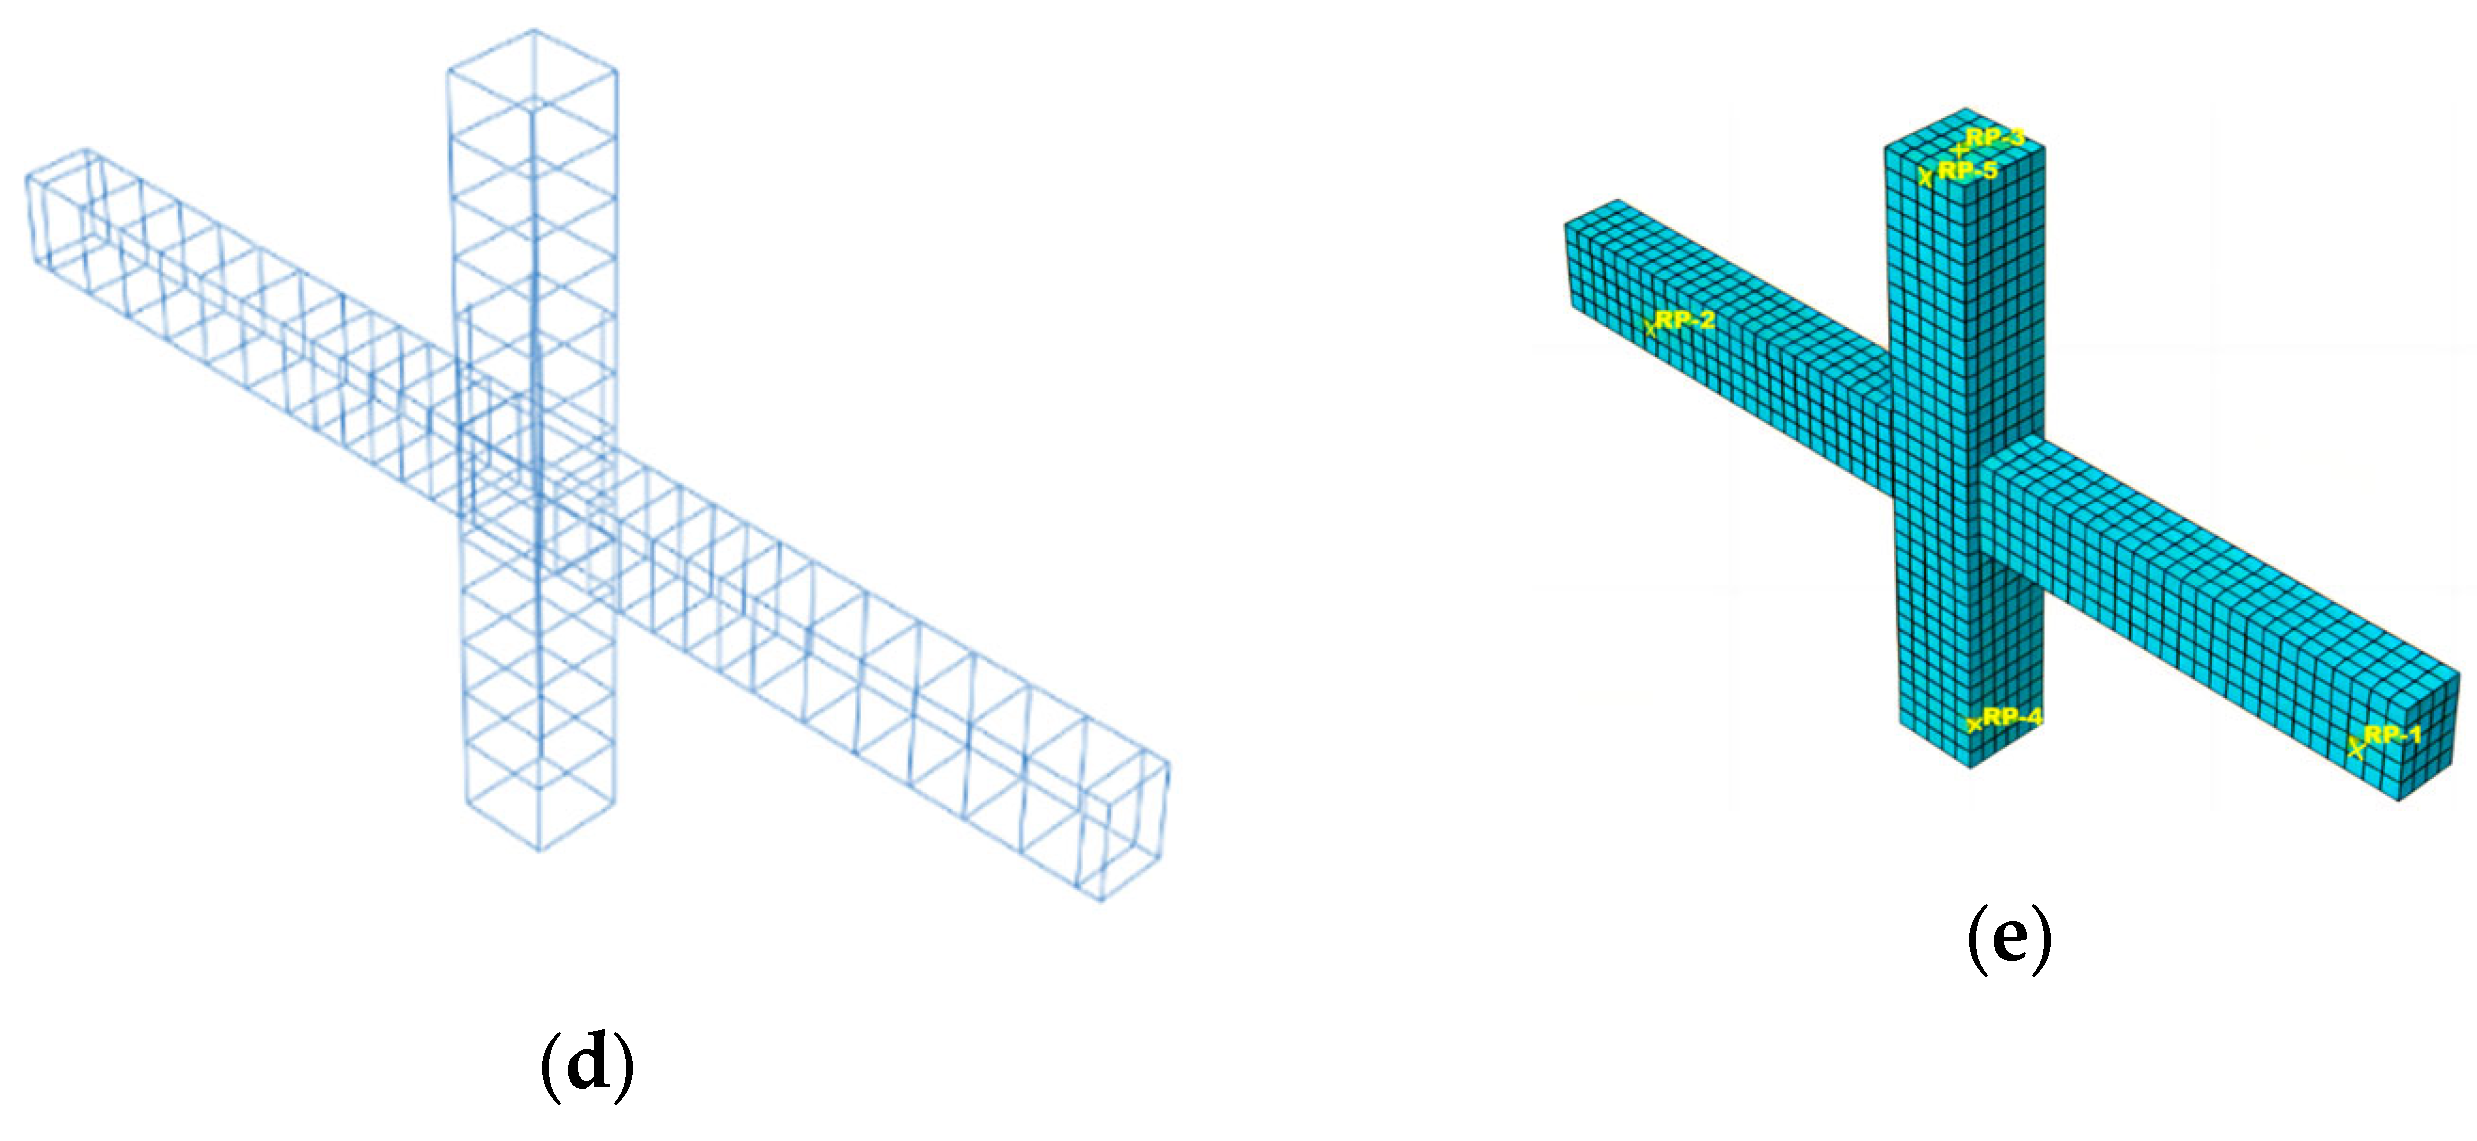
5.1. Finite Element Modelling
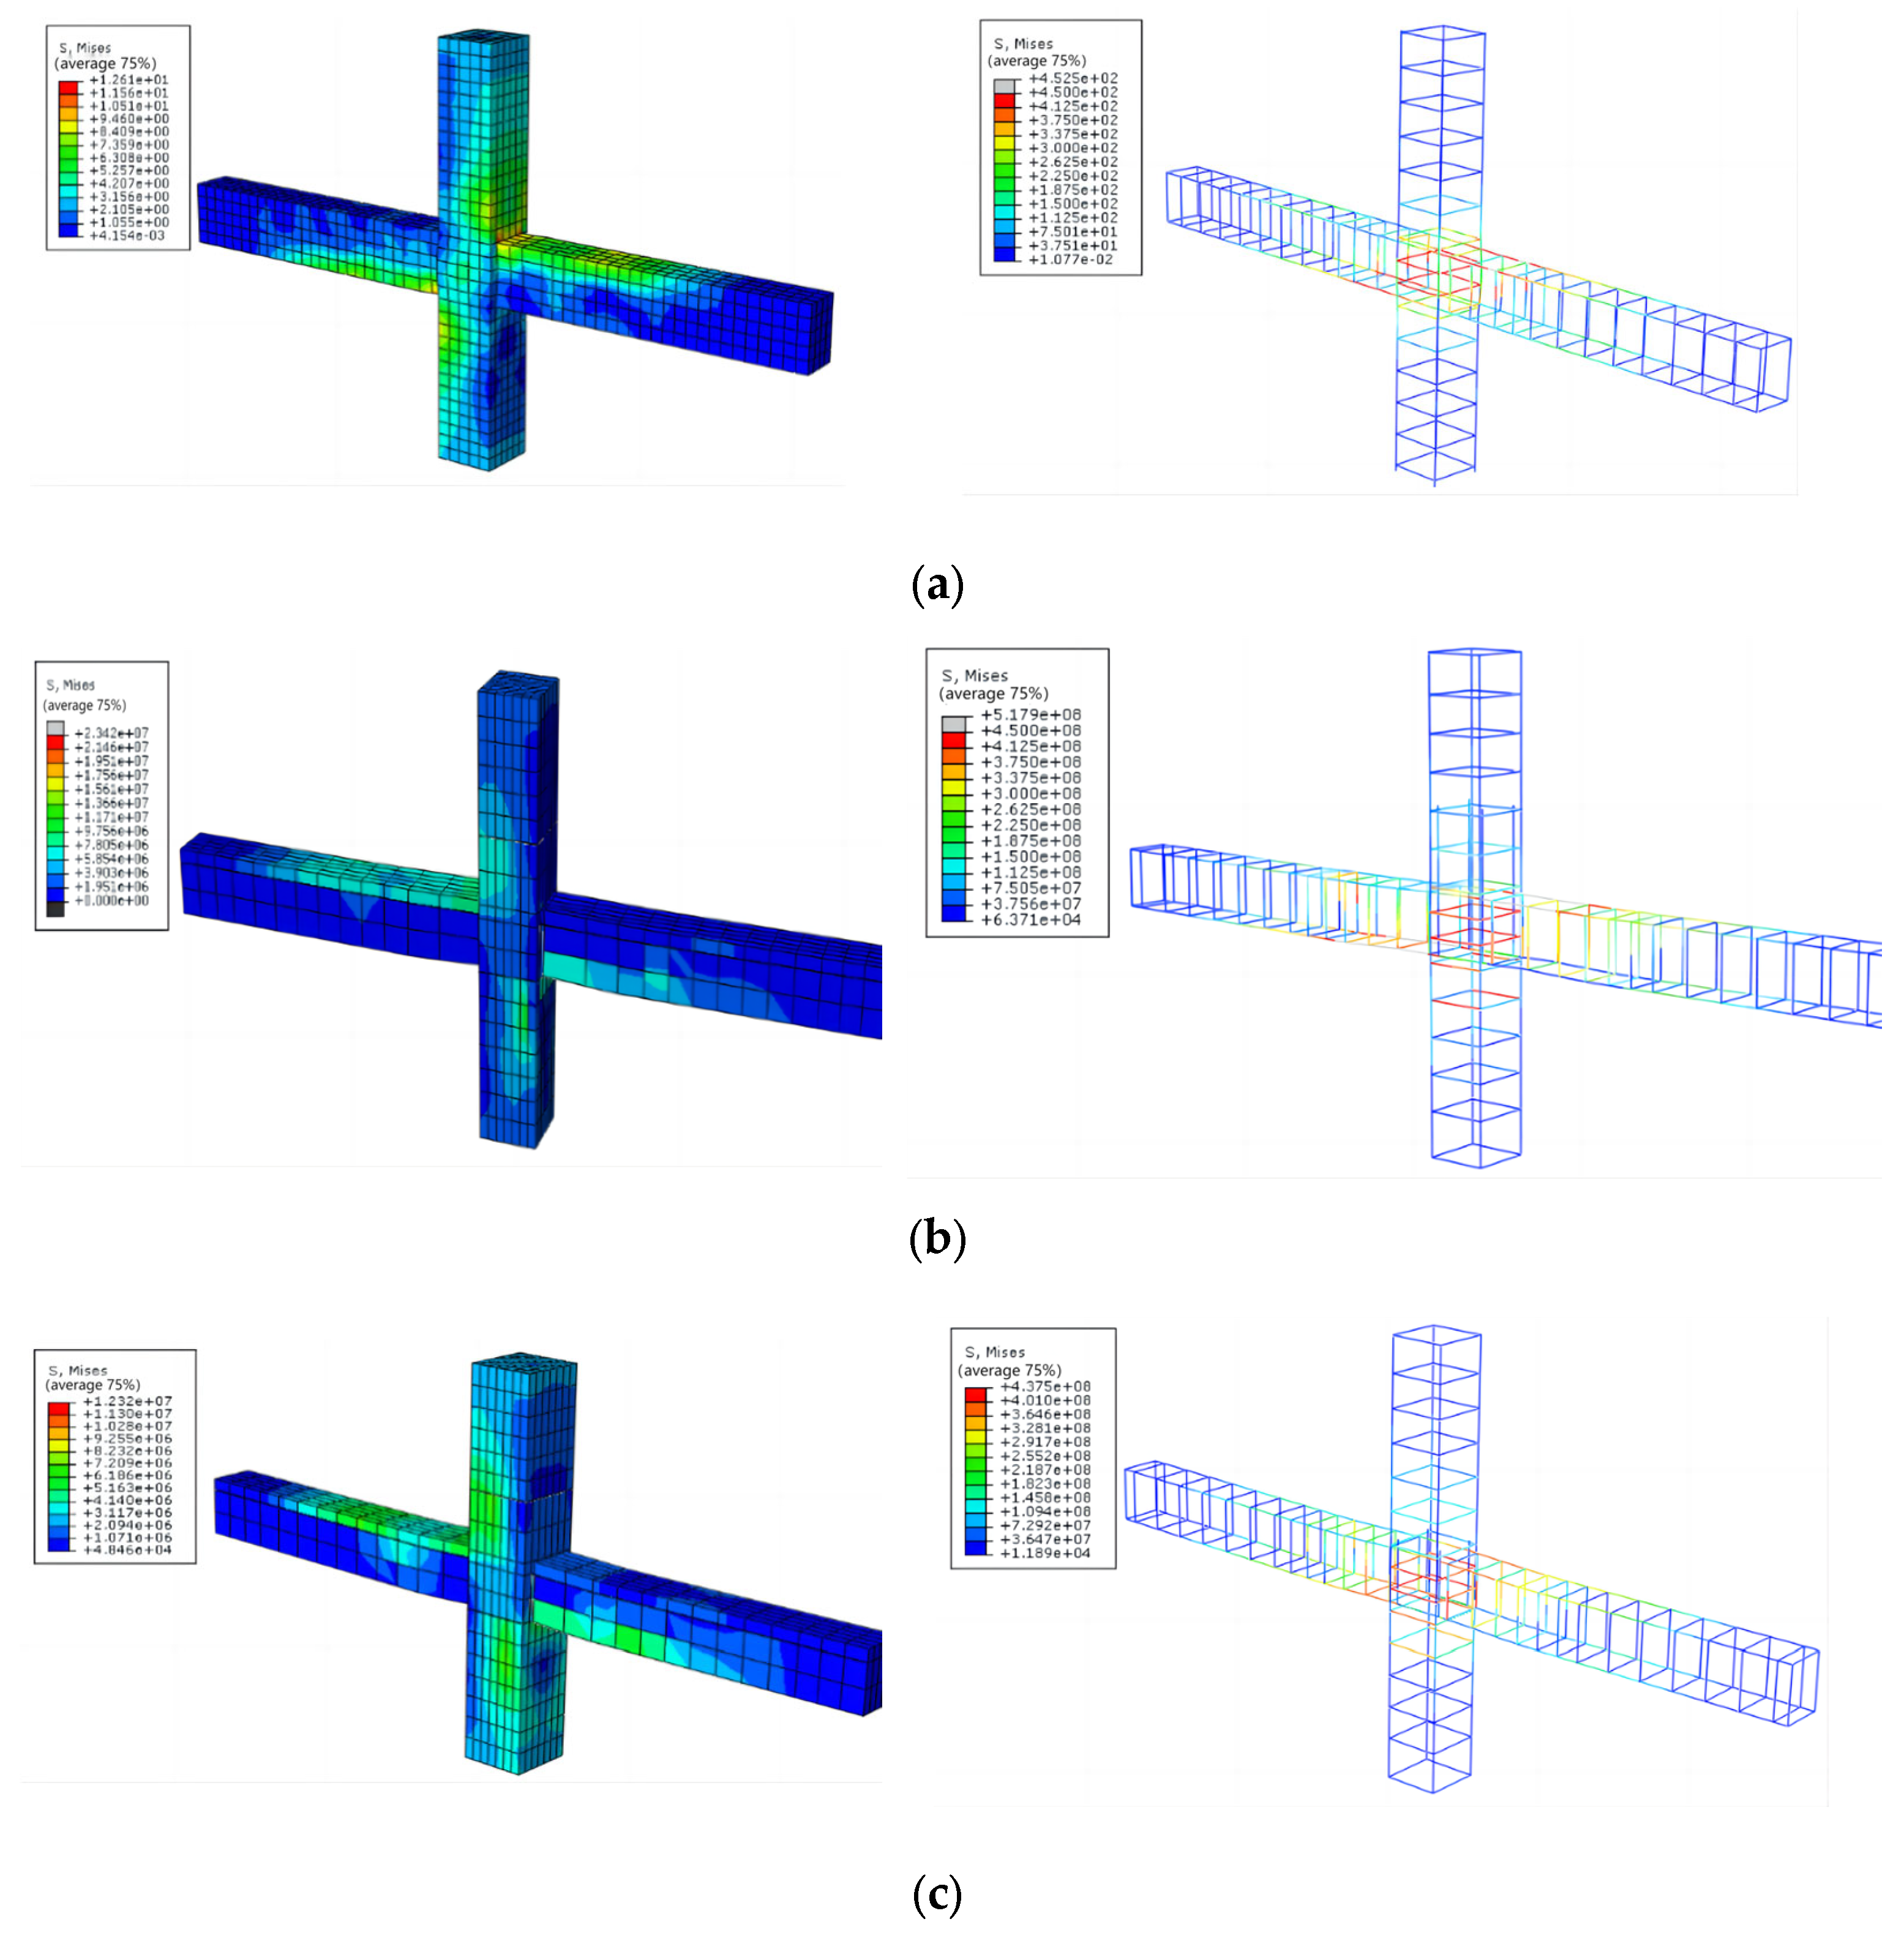
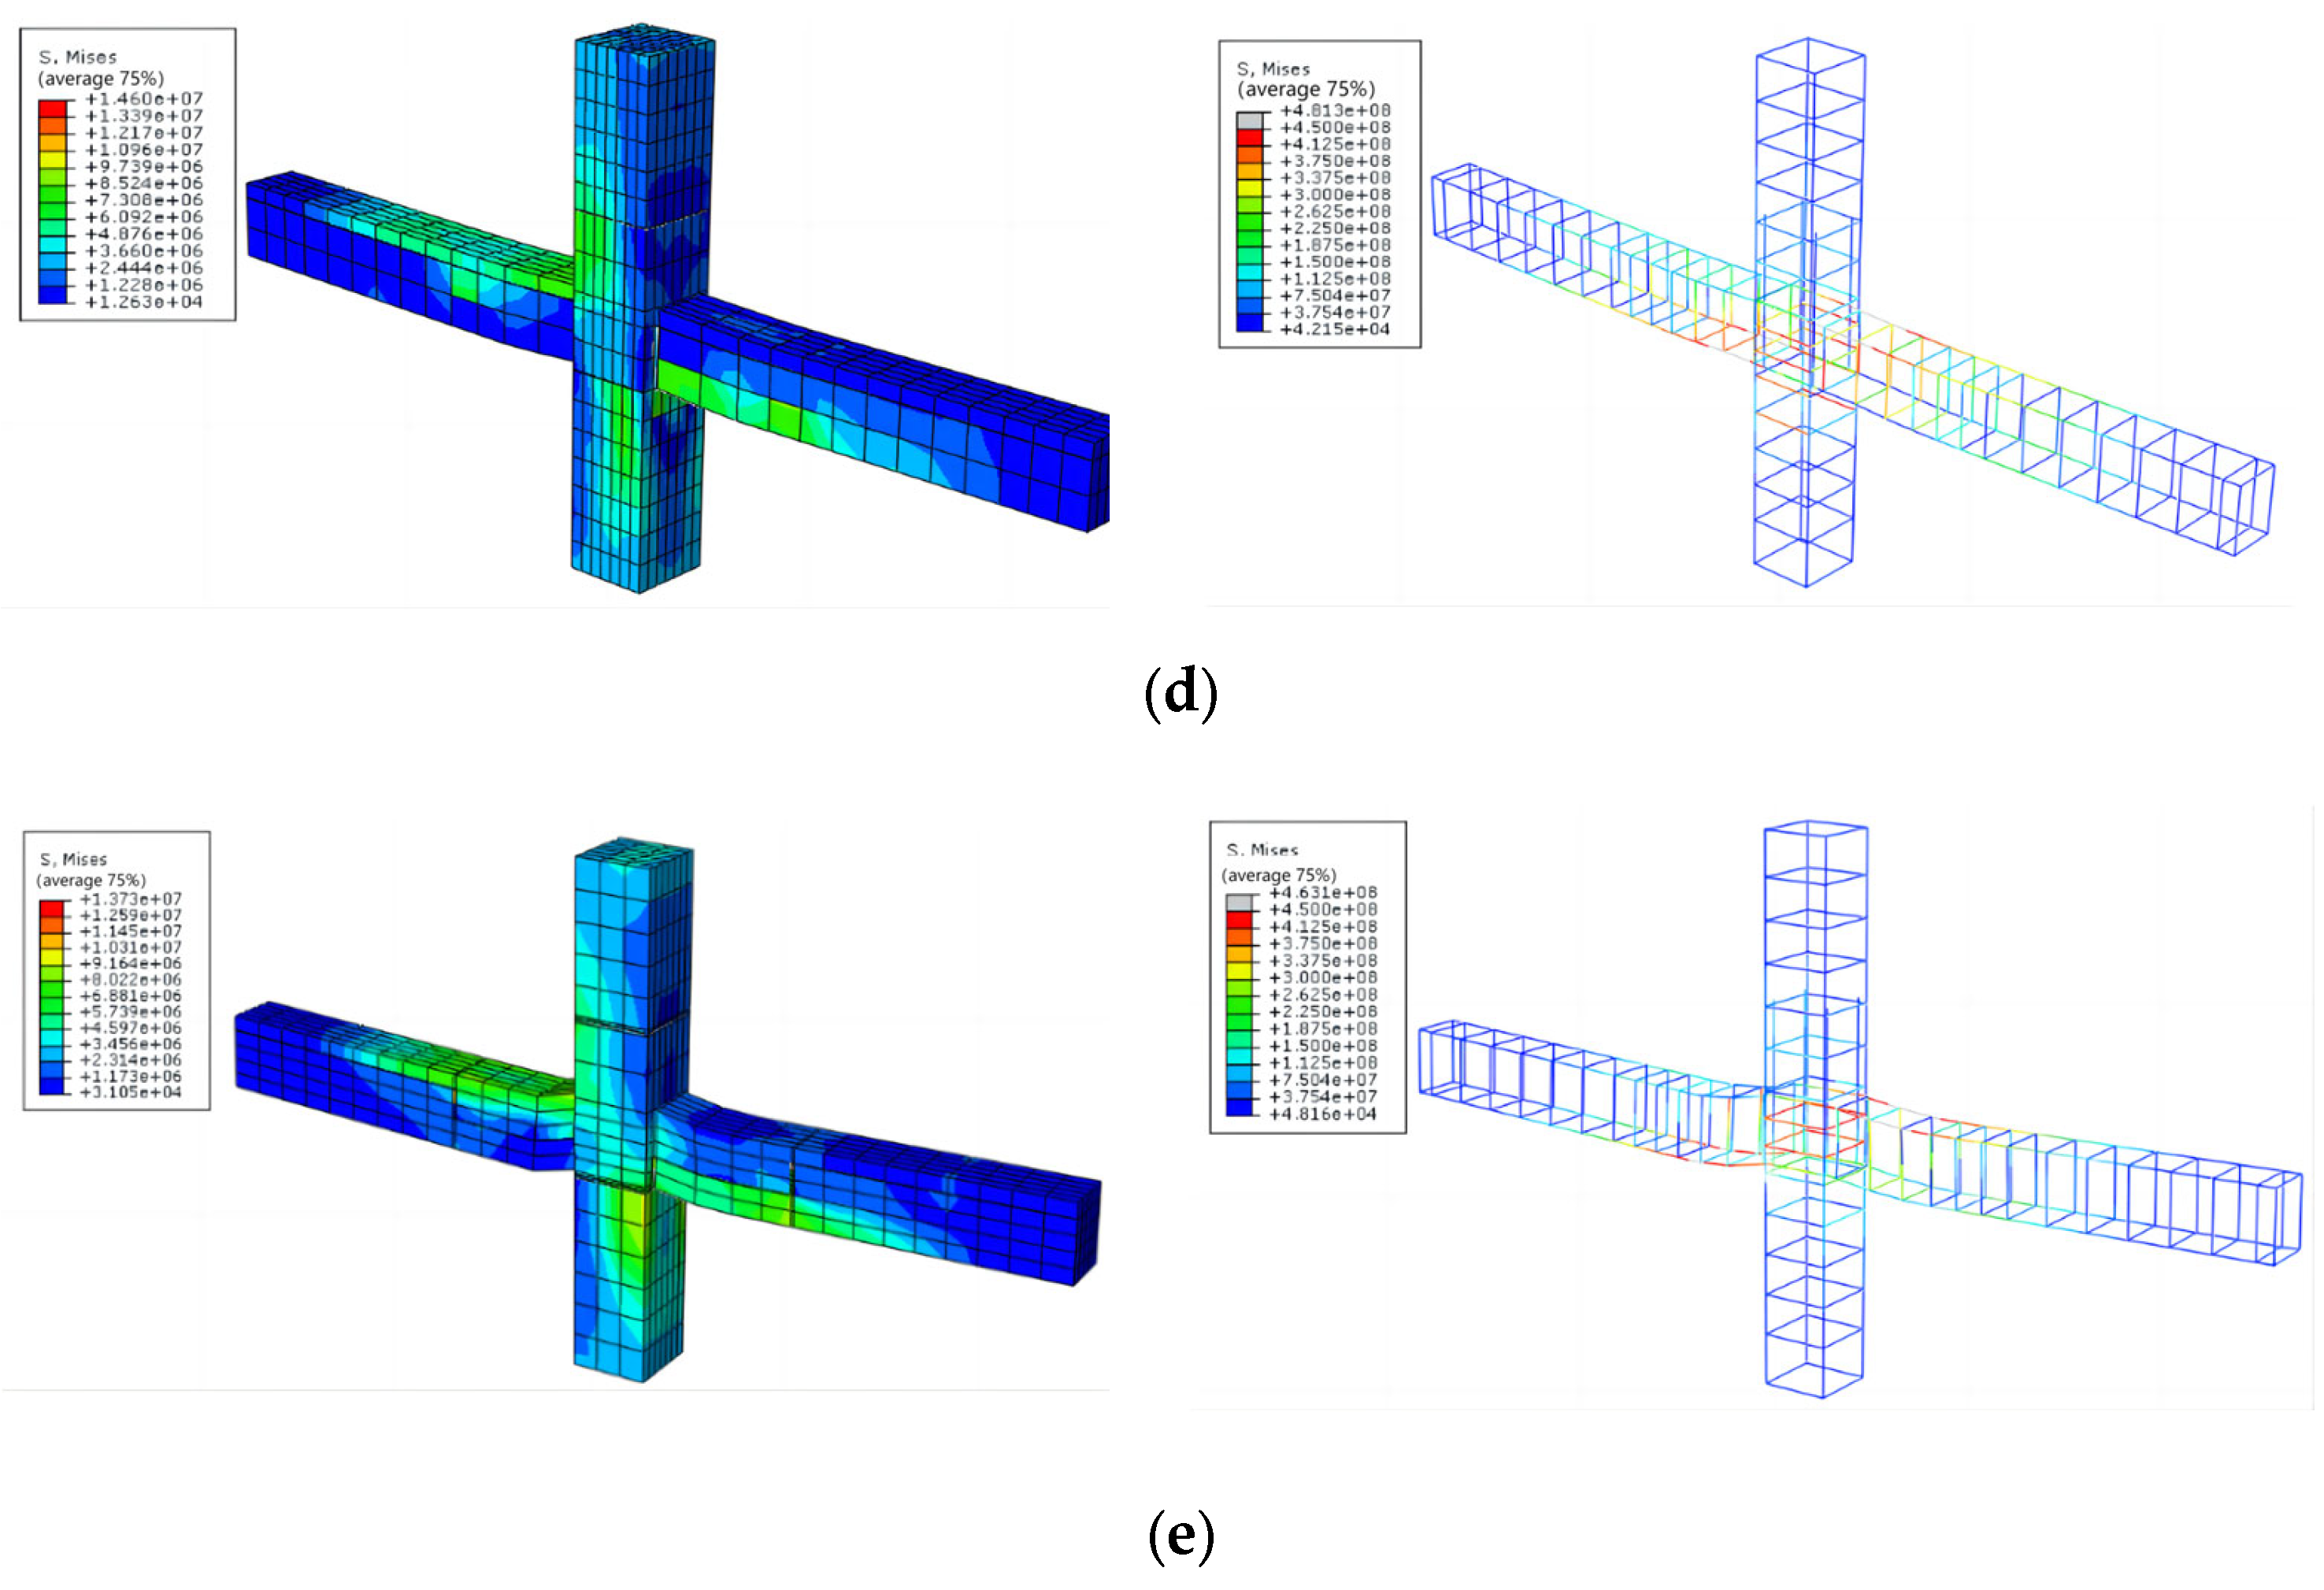
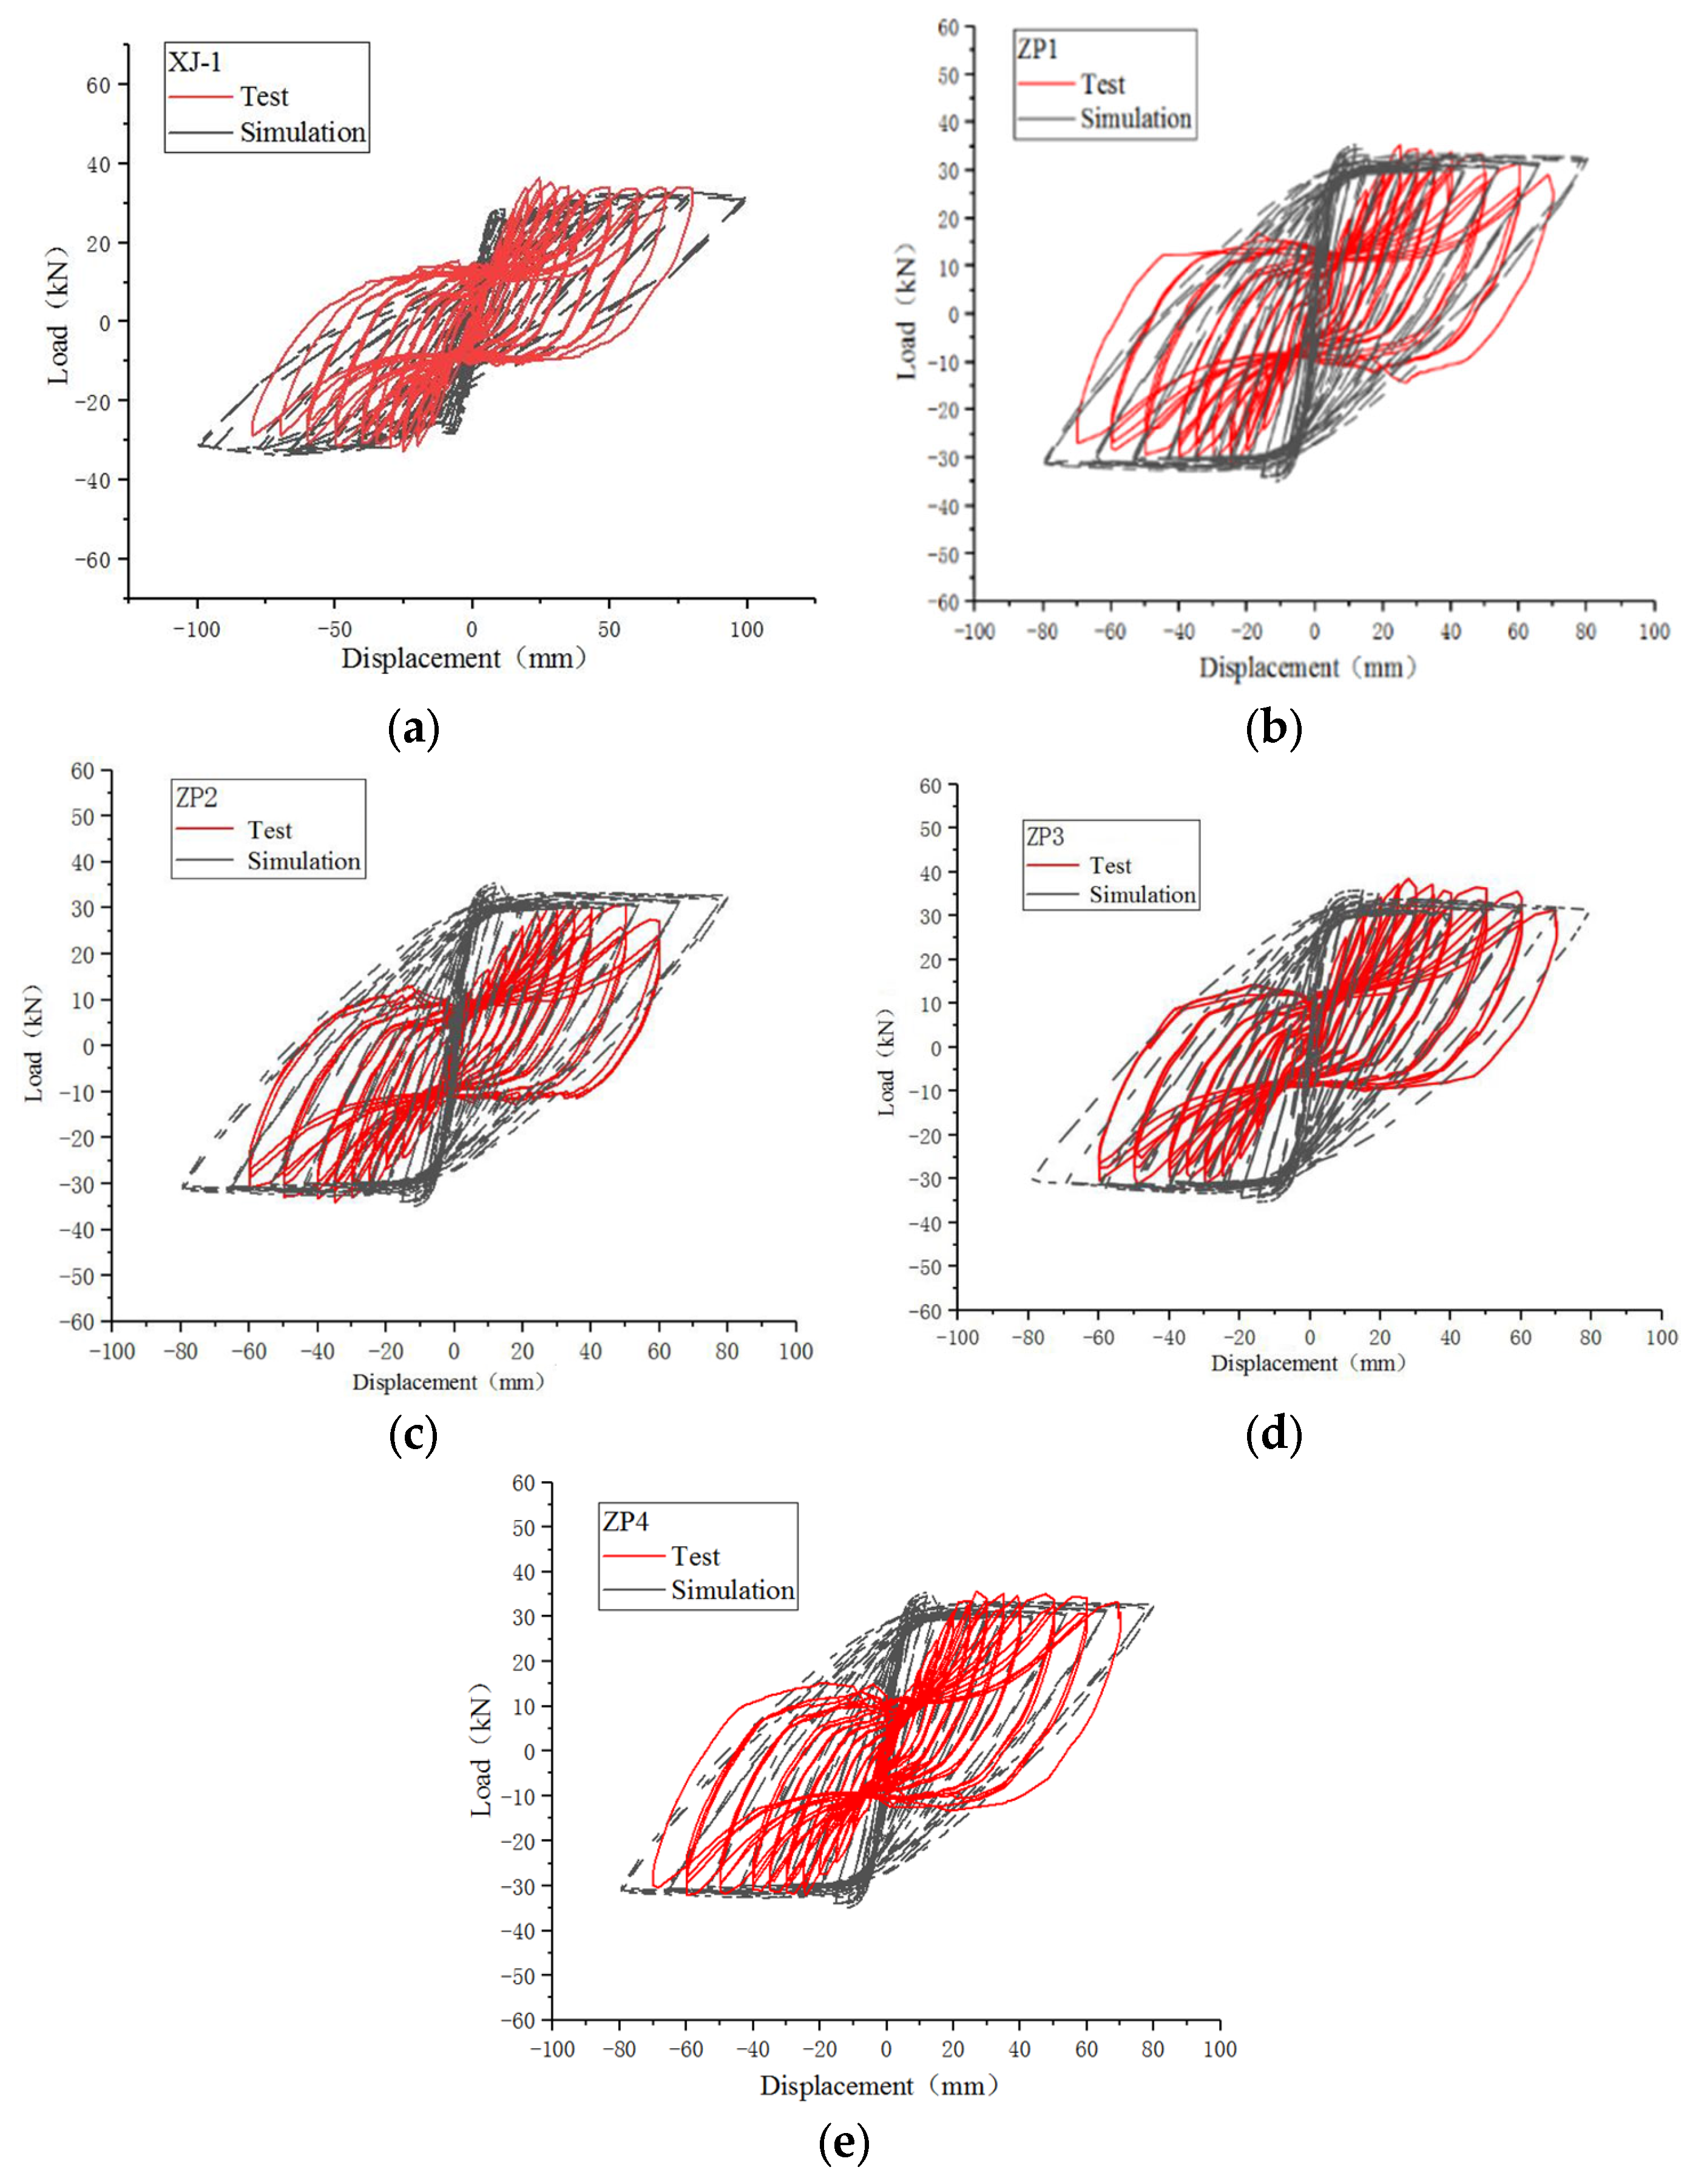
5.2. Stress Cloud Diagram and Hysteresis Curve Analysis
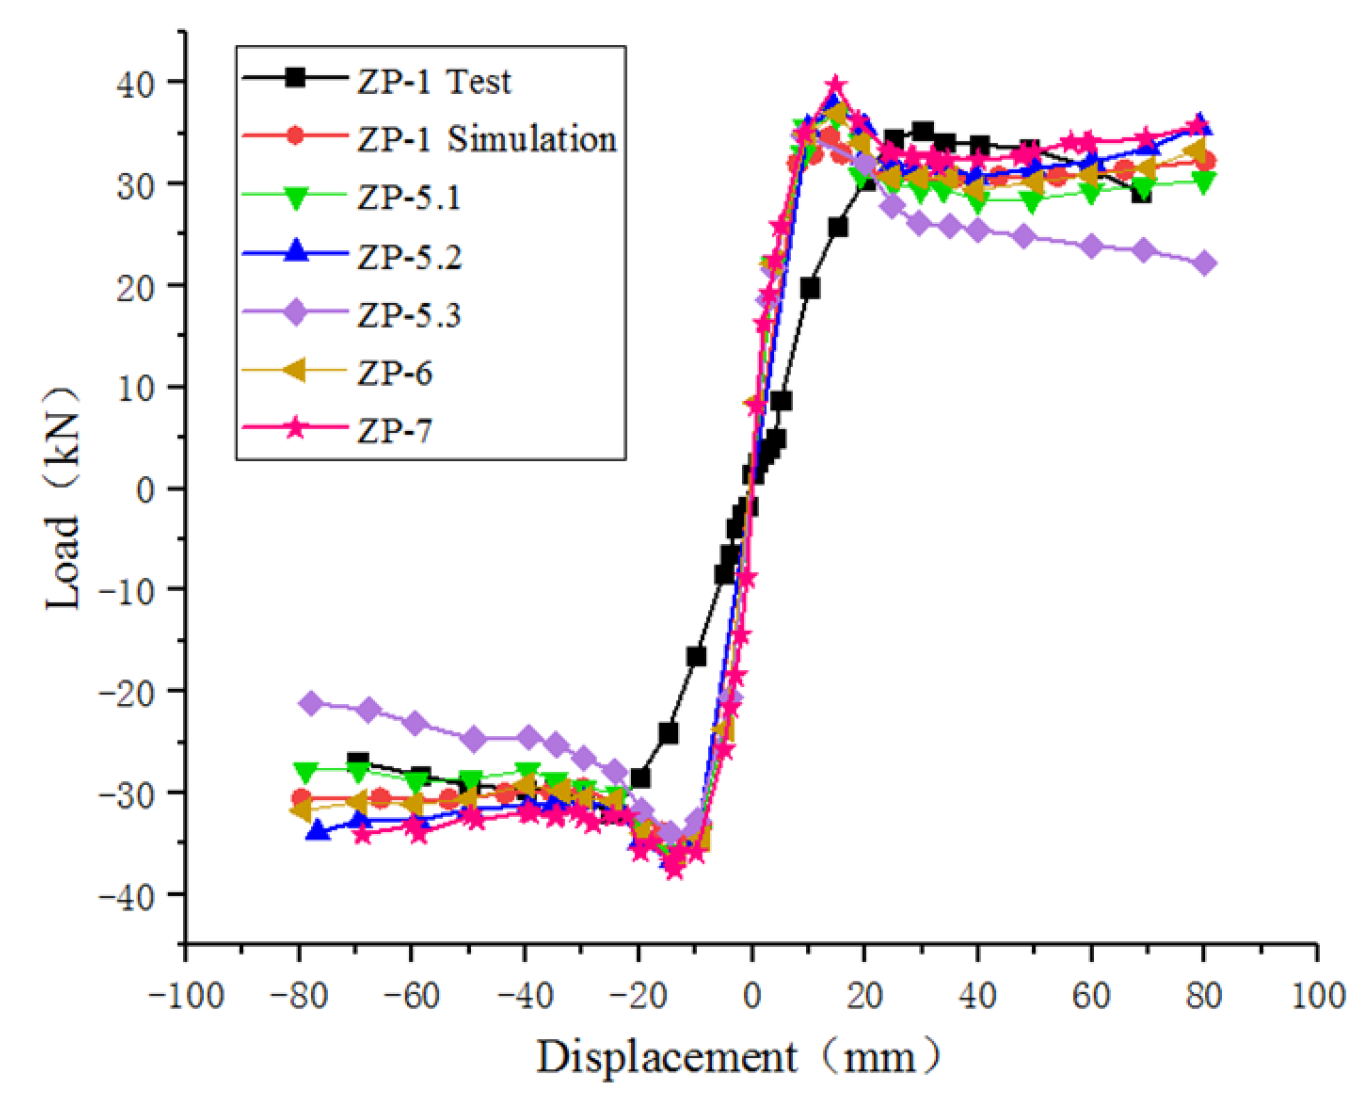
5.3. Parameter Analysis and Shear Capacity Checking Calculation
6. Conclusions
- The size reinforcement of the beam column itself is designed according to the specification, and the column steel bar is continuous when connected, and the beam steel bar is bent to the column. Therefore, the design and production of the beam column itself has met the requirements of the strong column and the weak beam. Cast-in-place joint XJ-1 and newly assembled joints ZP-1, ZP-3, and ZP-4 exhibit bending failures at beam ends, complying with the seismic design requirements of “strong joints and weak members.” Joint ZP-2 uses short L-shaped reinforcement, effectively reducing the vertical force component while increasing the concrete load, leading to shear failure in the joint area.
- The newly assembled joints demonstrate excellent energy dissipation, damage resistance, and ductility. The stiffness degradation coefficient is above 0.75, indicating impressive damage resistance within the cast-in-place joints.
- The force at the joint is more complex, and there are many factors affecting the seismic performance of the joint. In this paper, the influence of the main factors on the seismic performance of joint specimens has been studied. The study reveals that implementing measures such as increasing the area of post-cast concrete in the joint, extending the length of L-shaped reinforcement, and enhancing the concrete strength in the composite beam area can effectively improve the bonding force between the post-cast and precast members, subsequently boosting the joint’s ductility, energy dissipation, and load-bearing capacity. Pre-placing steel tubes in columns can significantly enhance the initial stiffness of joints. It provides an effective basis for the research of the seismic performance of the joint in the future, and promotes the popularization and application of the newly assembled joint.
- A comparative analysis confirms the strong alignment of the theoretical calculations with experimentally and numerically derived shear capacity values. The results show that the proposed formula meets the needs of design and application, and provides a reliable reference for the calculation and analysis of the shear capacity of the newly assembled joints.
- Although newly assembled joints show promising feasibility for the assembled building industry by satisfying requirements for a simple structure, ease of construction, and structural integrity, their performance is influenced by various factors, which warrant close attention during practical applications, such as L-shaped reinforcement length, post-cast concrete area in the joints, and composite beam area concrete strength. In this paper, the effects of various factors such as the length of the L-shaped steel bar, the area of concrete poured after the joint, and the strength of the concrete in the composite beam area are studied through experiments. However, changing the axial compression ratio and increasing the strength of concrete in the joint area are realized through finite element simulation, and the simulation results are still different from the actual stress characteristics. Subsequent researchers can add tests to verify these results. At the same time, the effect of reinforcement ratio of the horizontal stirrups, vertical reinforcement, and column longitudinal reinforcement on the seismic performance of the joint should be further considered.
- The test specimens included in this study utilized a 1/2 scaled-down model to abide by actual testing equipment and site constraints. Assessing the seismic performance of four assembled joint specimens provided preliminary insights. However, due to the complex forces at the joints, it is often difficult to simulate the actual structural effect of full-size specimens after reducing the size, so subsequent researchers can make a small number of full-size specimens based on this scaling experiment to supplement and verify the results.
- Owing to the minor discrepancies between the finite element simulation outcomes and test results, we have endeavored to rectify these deviations. The ultimate finite element simulation findings show excellent agreement with the test outcomes, effectively simulating the maximum displacement and maximum load-bearing capacity. This considerably advances the scope of the research. Nevertheless, the issue of concrete material closure in finite element simulations remains unresolved, representing a longstanding challenge in the field of finite element analysis. In-depth investigations are necessary for future development and progress.
- In this study, the existing design formula for preassembled joints outlined in the Chinese Code is referenced, and we put forth a novel design formula to determine joint shear capacities. Comparing the theoretical calculations and analyses outcomes against experimental and finite element simulation results reveals a strong correlation among them. Although the proposed load-bearing capacity formula offers significant reference value and practical applicability to some extent, its use in other joint configurations with varying parameters warrants further examination using alternative formulae.
Author Contributions
Funding
Data Availability Statement
Conflicts of Interest
References
- Jiang, Q.Q. Review on the development of prefabricated concrete architecture at home and abroad. Build. Techno. 2010, 41, 1074–1077. [Google Scholar]
- ACI Committee. 31895/318R95: Building Code Requirements for Structural Concrete & Commentary; ACI: Farmington Hills, MI, USA, 1995. [Google Scholar]
- AS-3600; Concrete Structures. Standards Australia International: Sydney, Australia, 2001.
- Precast/Prestressed Concrete Institute. Architectural Precast Concrete; Precast/Prestressed Concrete Institute: Chicago, IL, USA, 1989. [Google Scholar]
- Wu, C.L.; Liu, J.M.; Zhao, K.C. Research progress on seismic performance of assembled concrete frame joints. Concrete 2019, 3, 130–133. [Google Scholar]
- Ghosh, S.K.; Cleland, N.M. Performance of Precast Concrete Building Structures. Earthq. Spectra 2012, 28, 349–384. [Google Scholar] [CrossRef]
- Nakaki, S.D.; Englekirk, R.E.; Plaehn, J.L. Ductile connectors for a precast concrete frame. PCI J. 1994, 39, 46–59. [Google Scholar] [CrossRef]
- Ghayeb, H.H.; Razak, H.A.; Sulong, N.R. Development and testing of hybrid precast concrete beam-to-column connections under cyclic loading. Constr. Build. Mater. 2017, 151, 258–278. [Google Scholar] [CrossRef]
- Gao, P.N.; Deng, Y.; Li, A.Q.; Lu, F.Y. Research progress on seismic behavior of joints of assembled concrete frame structures. J. Indus. Constr. 2021, 51, 171–185. (In Chinese) [Google Scholar]
- An, H.C.; Shi, M.H. Development of assembled reinforced concrete structure and connection technology. Ju She 2022, 21, 87–89. (In Chinese) [Google Scholar]
- Liu, Y.; Guo, Z.; Ding, J.; Wang, X.; Liu, Y. Experimental study on seismic behaviour of plug-in assembly concrete beam-column connections. Eng. Struct. 2020, 221, 111049. [Google Scholar] [CrossRef]
- Ozturan, T.; Ozden, S.; Ertas, O. Ductile connections in precast concrete moment resisting frames. Concr. Constr. 2006, 9, 11. (In Chinese) [Google Scholar]
- Ketiyot, R.; Hansapinyo, C. Seismic performance of interior precast concrete beam-column connections with T-section steel inserts under cyclic loading. Earthq. Eng. Eng. Vib. 2018, 17, 355–369. [Google Scholar] [CrossRef]
- Yuksel, E.; Karadogan, H.F.; Bal, I.E.; Ilki, A.; Bal, A.; Inci, P. Seismic behavior of two exterior beam–column connections made of normal-strength concrete developed for precast construction. Eng. Struct. 2015, 99, 157–172. [Google Scholar] [CrossRef]
- Yang, H.; Guo, Z.X.; Xu, A.Y.; Guan, D.Z.; Feng, J.S. Experimental study on seismic behavior of local post-tensioned precast concrete beam-to-column connections. J. Southeast Univ. 2019, 49, 1101–1108. (In Chinese) [Google Scholar]
- Loo, Y.C.; Yao, B.Z. Static and repeated load tests on precast concrete beam-to-column connections. PCI J. 1995, 40, 106–115. [Google Scholar] [CrossRef]
- Englekirk, R.E. Development and testing of a ductile connector for assembling precast concrete beams and columns. PCI J. 1995, 40, 36–51. [Google Scholar] [CrossRef]
- Li, Z.X.; Zhang, X.S.; Ding, Y.; Yang, D. Research on seismic performance of steel concrete frame joints with integrated assembly. J. Archit. Struct. 2005, 4, 32–38. (In Chinese) [Google Scholar]
- Wu, C.X.; Lai, W.S.; Zhou, Y.; Zhang, C.; Deng, X.S. Experimental study on the seismic performance of newly assembled concrete frame joints with energy dissipation. China Civ. Eng. J. 2015, 48, 23–30. [Google Scholar]
- Gu, W.; Zhang, X.X.; Li, Z.P.; Zhang, Y.N.; Ruan, X.Q. Research on the seismic performance of prefabricated concrete frame hooked middle column Joints. Build. Struct. 2019, 49, 33–37. [Google Scholar]
- Ji, J.; Wu, A.M.; Wang, Y.J.; Han, X.L. Joint test and analysis of a new type of concrete filled steel tubular column with a dark heart. J. South China Univ. Technol. (Nat. Sci.) 2008, 3, 114–120. (In Chinese) [Google Scholar]
- Miao, X.Y. Research on New Type Beam-Column Steel Joint of Prefabricated Concrete Frame Structure; Beijing University of Civil Engineering and Aechitecture: Beijing, China, 2016. (In Chinese) [Google Scholar]
- GB/T228-2010; Tensile Test of Metallic Materials at Room Temperature. China Building Industry Press: Beijing, China, 2010. (In Chinese)
- GB/T 50081-2019; Standard for Test Methods for Mechanical Properties of Ordinary Concrete. China Building Industry Press: Beijing, China, 2019. (In Chinese)
- Tang, J.R. Seismic resistance of reinforced concrete frame joints. Earthq. Resist. Eng. Retrofit. 1989, 4, 39–43. (In Chinese) [Google Scholar]
- Mccrum, D.P.; Williams, M.S. An overview of seismic hybrid testing of engineering structures. Eng. Struct. 2016, 118, 240–261. [Google Scholar] [CrossRef]
- Yu, J.B.; Guo, Z.X. Seismic test and theoretical research of anchor-in-type assembly concrete frame joints with steel stranded wire. J. Southeast Univ. (Nat. Sci. Ed.) 2017, 47, 760–765. (In Chinese) [Google Scholar]
- Wang, H. Research on Seismic Performance of Assembly Joints of Square Concrete-Filled Steel Tubular Column-H-Type Steel Beam; Beijing University of Engineering and Architecture: Beijing, China, 2020. (In Chinese) [Google Scholar]
- GB 50010-2015; Code for Design of Concrete Structures. Building Technology: Beijing, China, 2015; pp. 28–30. (In Chinese)


| Specimen Number | XJ-1 | ZP-1 | ZP-2 | ZP-3 | ZP-4 |
|---|---|---|---|---|---|
| Section dimensions of beams and columns | Beam: 175 mm × 250 mm; column: 250 mm × 250 mm | ||||
| Thickness of cover | 25 mm | ||||
| Dimensions of steel pipe and shear bolts | Steel pipe: d = 42 mm, t = 3 mm, L = 1000 mm; The shear bolts: M12; L = 60 mm | ||||
| Column stirrups, longitudinal reinforcement | Stirrup: D6@80/120, Longitudinal reinforcement: D12 | ||||
| Beam stirrups, longitudinal bars | Stirrup: D6@80/120, Longitudinal reinforcement: D10 | ||||
| Lower longitudinal reinforcement of the beam | Beam longitudinal reinforcement | Lower beam longitudinal bars bend upward 480 mm | Lower beam longitudinal bars bent upward 240 mm | Lower beam longitudinal bars bend upward 480 mm | Lower beam longitudinal bars bend upward 480 mm |
| Length of longitudinal reinforcement at the lower part of the beam | 2750 mm | 1945 mm | 1705 mm | 1945 mm | 1945 mm |
| Concrete strength grade | C30 | C30 | C30 | C20 | C30 |
| Steel Type | The Diameter of Steel Pipe (mm) | fy (MPa) | fu (MPa) | Es (GPa) |
|---|---|---|---|---|
| HRB400 | D6 | 429.32 | 540.24 | 200 |
| HRB400 | D10 | 443.25 | 625.16 | 200 |
| HRB400 | D12 | 450.13 | 31.02 | 200 |
| Specimen | Strength Grade | fcu (MPa) | fc (MPa) | Ec (MPa) |
|---|---|---|---|---|
| Group A | C30 | 32.61 | 21.81 | 3.65 × 10⁴ |
| Group B | C30 | 32.72 | 21.88 | 3.66 × 10⁴ |
| Group C | C20 | 21.81 | 14.59 | 2.66 × 10⁴ |
| Specimen Number | Loading Direction | Yield Point | Ultimate Point | Breakdown Point | Ductility Coefficient | ||||
|---|---|---|---|---|---|---|---|---|---|
| (kN) | (mm) | (kN) | (mm) | (kN) | (mm) | ||||
| XJ-1 | positive | 33.25 | 18.68 | 35.29 | 28.42 | 33.92 | 77.58 | 4.15 | 4.38 |
| reverse | −28.8 | −17.37 | −32.8 | −25 | −28.75 | −80 | 4.61 | ||
| ZP-1 | positive | 31.39 | 20.96 | 35.25 | 24.88 | 29.96 | 65.58 | 3.12 | 3.22 |
| reverse | −29.19 | −21.04 | −32.03 | −24.97 | −26.92 | −69.8 | 3.32 | ||
| ZP-2 | positive | 26.60 | 20.67 | 31.45 | 29.86 | 26.73 | 60.96 | 2.95 | 3.05 |
| reverse | −28.13 | −21.38 | −34.06 | −34.99 | −28.1 | −67.37 | 3.15 | ||
| ZP-3 | positive | 33.05 | 18.40 | 38.57 | 27.85 | 32.78 | 51.55 | 2.8 | 2.87 |
| reverse | −29.88 | −26.78 | −30.94 | −29.97 | −26.55 | −78.63 | 2.93 | ||
| ZP-4 | positive | 31.53 | 21.18 | 35.66 | 26.89 | 30.31 | 78.75 | 3.72 | 3.96 |
| reverse | −26.88 | −19.07 | −32.01 | −24.29 | −30.5 | −79.93 | 4.2 | ||
| Joint Number | (kN·mm) | (kN·mm) | |
|---|---|---|---|
| XJ-1 | 995.61 | 911.47 | 0.17 |
| ZP-1 | 696.83 | 839.81 | 0.13 |
| ZP-2 | 820.81 | 1065.43 | 0.12 |
| ZP-3 | 632.49 | 945.18 | 0.11 |
| ZP-4 | 890.53 | 919.56 | 0.15 |
| Parameter | Poisson Ratio | Dilation Angle | Eccentricity Ratio | fb0/fc0 | K | Viscous Parameters | Compression Recovery Stiffness |
|---|---|---|---|---|---|---|---|
| Value | 0.2 | 38° | 0.1 | 1.16 | 2/3 | 0.01 | 0.6 |
| Steel Type | Diameter (mm) | Elasticity Modulus (N/m2) | Yield Strength Ultimate Strength (MPa) | Inelastic Strain |
|---|---|---|---|---|
| HRB400 | 6 | 2.0 × 10¹¹ | 429.32 | 0 |
| 540.24 | 0.002 | |||
| HRB400 | 10 | 2.0 × 10¹¹ | 443.25 | 0 |
| 625.16 | 0.002 | |||
| HRB400 | 12 | 2.0 × 10¹¹ | 450.13 | 0 |
| 631.02 | 0.0021 |
| Joint Number | Maximum Displacement (mm) | Maximum Load (kN) | ||
|---|---|---|---|---|
| Test | Simulation | Test | Simulation | |
| XJ-1 | 80.6903 | 101.2130 | 36.3741 | 31.8476 |
| ZP-1 | 29.2419 | 31.4079 | 35.7401 | 35.7401 |
| ZP-2 | 31.0588 | 32.4706 | 33.8583 | 35.5294 |
| ZP-3 | 31.7797 | 31.5254 | 38.8983 | 35.8475 |
| ZP-4 | 69.7161 | 80.1262 | 35.9528 | 35.9528 |
| Serial Number | Axial Compression Ratio | Strength of Concrete in the Joint Core Area | Steel Pipe Specification | |
|---|---|---|---|---|
| ZP-5.1 | 0.15 | C30 | D:42 mm | t:3 mm |
| ZP-5.2 | 0.25 | C30 | D:42 mm | t:3 mm |
| ZP-5.3 | 0.40 | C30 | D:42 mm | t:3 mm |
| ZP-6.0 | 0.20 | C40 | D:42 mm | t:3 mm |
| ZP-7.0 | 0.20 | C30 | D:60 mm | t:3.5 mm |
| The Joint Type | Shearing Capacity (kN) | ||||
|---|---|---|---|---|---|
| Test | Theory | Error Value | Simulation | Error Value | |
| Cast-in-site joint | 229.02 | 211.34 | 8% | 246.9 | 8% |
| ZP-1 | 220.29 | 239.41 | 7% | 250.66 | 14% |
| ZP-2 | 211.74 | 239.41 | 11% | 230.33 | 9% |
| ZP-3 | 226.21 | 239.41 | 5% | 249.88 | 10% |
| ZP-4 | 240.11 | 239.41 | 1% | 252.55 | 5% |
Disclaimer/Publisher’s Note: The statements, opinions and data contained in all publications are solely those of the individual author(s) and contributor(s) and not of MDPI and/or the editor(s). MDPI and/or the editor(s) disclaim responsibility for any injury to people or property resulting from any ideas, methods, instructions or products referred to in the content. |
© 2024 by the authors. Licensee MDPI, Basel, Switzerland. This article is an open access article distributed under the terms and conditions of the Creative Commons Attribution (CC BY) license (https://creativecommons.org/licenses/by/4.0/).
Share and Cite
Lv, M.; Yang, T.; Lin, M. Experimental Study on Seismic Behavior of Newly Assembled Concrete Beam–Column Joints with L-Shaped Steel Bars. Appl. Sci. 2024, 14, 1262. https://doi.org/10.3390/app14031262
Lv M, Yang T, Lin M. Experimental Study on Seismic Behavior of Newly Assembled Concrete Beam–Column Joints with L-Shaped Steel Bars. Applied Sciences. 2024; 14(3):1262. https://doi.org/10.3390/app14031262
Chicago/Turabian StyleLv, Mengjiao, Taochun Yang, and Mingqiang Lin. 2024. "Experimental Study on Seismic Behavior of Newly Assembled Concrete Beam–Column Joints with L-Shaped Steel Bars" Applied Sciences 14, no. 3: 1262. https://doi.org/10.3390/app14031262
APA StyleLv, M., Yang, T., & Lin, M. (2024). Experimental Study on Seismic Behavior of Newly Assembled Concrete Beam–Column Joints with L-Shaped Steel Bars. Applied Sciences, 14(3), 1262. https://doi.org/10.3390/app14031262