Abstract
In response to the issue of the size effect of helical anchors in deep-sea areas on their uplift bearing capacity, this study was proposed based on the ratio of the anchor shaft diameter to the anchor helix diameter and the ratio of the pitch to the anchor helix diameter. Eight sets of small-scale anchors were designed for laboratory model tests to study the impact of different anchor shaft diameters to anchor helix diameter ratios and the ratio of the pitch to the anchor helix diameter on uplift bearing capacity. The results indicate that smaller ratios of the anchor shaft diameter to the anchor helix diameter and the pitch to the anchor helix diameter can improve the uplift bearing capacity of helical anchors. In addition, this study found that the uplift bearing capacity of helical anchors decreased with the increase in the ratio of the anchor diameter to the anchor helix diameter and the ratio of the pitch to the anchor helix diameter. Based on this, a prediction equation for the uplift bearing capacity of helical anchors was proposed.
1. Introduction
In recent years, as offshore construction has developed from shallow to deep sea construction, floating offshore structures in deep waters require simple and efficient anchorage foundations. Floating offshore structure anchoring foundations include drag anchors, suction anchors, torpedo anchors, and screw anchors, among others. Drag anchors are suitable only for shallow waters, as their lightweight design and limited friction make long-term stabilization in deep waters challenging and pose significant risks if dislodged. Suction anchors installed in soft soil provide limited lateral friction resistance. Increasing the weight and surface area of suction anchors can enhance stability, but this complicates installation, thereby limiting their practicality. Torpedo anchors, commonly used in deep-sea applications, are prone to positioning inaccuracies. Soft soil provides limited lateral friction resistance, which can reduce their pull-out bearing capacity. The helical anchor has been widely adopted due to its simple structure, convenient installation, low cost, and high pullout resistance [1]. The size effect of helical anchors significantly influences their uplift bearing capacity. To enhance this capacity, both domestic and international researchers have extensively studied the size effect of helical anchors [2,3,4]. However, most research has focused on the ratio of the embedment depth to the anchor helix diameter (depth-to-diameter ratio) regarding the uplift bearing capacity of helical anchors. In contrast, the effects of the pitch-to-plate diameter ratio and shaft-to-plate diameter ratio on the uplift bearing capacity are less explored.
To better understand the uplift bearing capacity of the helical anchor [5], the main design parameters are illustrated in Figure 1a. These parameters include the anchor helix diameter (DH), the anchor shaft diameter (DS), the anchor helix embedment depth (H), and the anchor helix pitch (dm). The main uplift force (QT) is depicted in Figure 1b and includes the anchor helix uplift bearing capacity (QA), the resistance provided by the anchor shaft (QS), the weight of the helical anchor (W), and the suction force generated beneath the anchor helix during the pullout process (US).
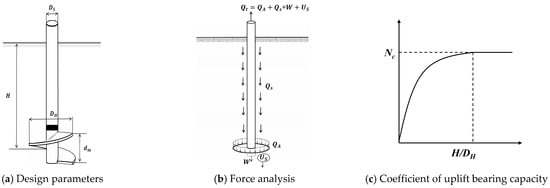
Figure 1.
Definition of helical anchor.
Currently, both domestic and international researchers have extensively researched the uplift bearing capacity of helical anchors. Early research by Das (1980) [6] focused on experiments related to the depth-to-diameter ratio of helical anchors and proposed a formula for calculating uplift bearing capacity. The uplift bearing capacity of helical anchors can be represented by the uplift bearing capacity, Nc, as illustrated in Figure 1c. The coefficient of the uplift bearing capacity, Nc, increases with the depth-to-diameter ratio; however, the rate of the increase diminishes and eventually stabilizes. Vesić [7] proposed a formula for calculating the pullout resistance coefficient of shallow circular plate anchors and estimated the ultimate pressure between the circular plate anchor and the soil surface using this formula. Saeedy (1987) [8] concluded from pullout resistance tests of helical anchors that the pullout resistance of the anchor helix increases with anchor depth. Rao and Prasad (1993) [9] conducted tests on model piles and concluded that the optimal uplift bearing capacity is achieved when the ratio of the helical plate spacing to the plate diameter is maintained between 1.0 and 1.5. Dickin and Leung [10] conducted centrifuge tests on anchor helixes to investigate factors affecting uplift bearing capacity. It was concluded that the bearing capacity of the anchor helix significantly depends on its embedment depth and shape. Guo Fangsheng [11] conducted pullout tests on helical anchors of varying diameters and investigated the relationship between ultimate uplift bearing capacity and the diameter of single-plate helical anchors. The results indicated that larger diameters result in greater pullout resistance.
In summary, the uplift bearing capacity, Nc, effectively represents the uplift bearing capacity of helical anchors. Most research, both domestic and international, has focused on the impact of the depth-to-diameter ratio on Nc. However, while the single-disk spiral anchor is often simplified to a thinner disk, there is relatively limited research on the impact of the screw diameter ratio and the diameter ratio on Nc. Therefore, this study primarily conducts laboratory modeling tests to investigate the effects of various shaft-to-plate diameter ratios and diameter ratios on the pullout load-carrying capacity coefficient Nc.
2. Overview of the Test
2.1. Theory Background
Many researchers, both domestically and internationally, primarily calculate the uplift bearing capacity coefficient Nc with a focus on the depth-to-diameter ratio [12]. However, they often neglect the effects of the helical-to-diameter ratio and the diameter ratio. The main formula for calculating Nc is shown in Equation (1):
where Nc represents the coefficient of uplift bearing capacity of the anchor helix; Nc0 represents the weightless uplift bearing capacity; and represents the effective weight of the dimensionless soil body.
In contrast to previous equations for calculating the uplift bearing capacity, Nc, this study examines the effects of the shaft-to-plate diameter ratio and diameter ratio on Nc, incorporating the impact of changes in helical pitch. The calculation is provided in Equation (2):
where QA represents the ultimate pullout force; A represents the projected plane area of the anchor helix; and su represents the undrained shear strength of the soft soil.
2.2. Helical Anchor Preparation
The uplift bearing capacity, Nc, effectively represents the uplift bearing capacity of helical anchors. Consequently, this study focused on investigating Nc. Previous research primarily examined the effect of Nc on various depth-to-diameter ratios (H/DH) [13,14]. This paper, however, explored the impact of the helical diameter ratio and diameter ratio on Nc through laboratory modeling tests.
Diameter ratio (DS/DH): As the diameter of the anchor increases, it decreases the effective support area of the anchor helix, thereby reducing the pullout resistance of the helical anchor.
Shaft-to-plate diameter ratio (dm/DH): When the pitch was reduced, the available support area and contact friction were increased, enhancing the interaction between the helical anchor and the soil, and thereby improving the pullout resistance of the helical anchor.
This study’s tests were structured around four different diameter ratios, with each ratio tested across five separate sets. In total, four diameter ratios were examined, with each ratio subjected to embedment depths ranging from 7 to 12. The design details are presented in Table 1.

Table 1.
Test plan for the shaft-to-plate diameter ratio and anchor helix diameter ratio.
The test helical anchor, as shown in Figure 2, utilizes an assembled structure. A tension load cell was installed between the anchor helix and the anchor shaft, with the lower part of the load cell connected to the anchor helix and the upper part to the anchor shaft. Compared to previous tests, this study introduced the following innovations: (1) Assembled helical anchors, unlike traditional integral helical anchors, consist of multiple components, allowing for more flexible installation and use. (2) Traditional tests often utilized external loading to assess the pullout resistance of the anchor helix, but this method may not accurately simulate real-world conditions. In this study, a tension load cell was placed between the anchor helix and the anchor shaft to more accurately simulate actual usage conditions, thereby obtaining more reliable data on uplift bearing capacity. The tensile force sensor utilizes a miniature tensile pressure sensor, model DYMH-103 (Dayang Sensor System Engineering Co, Bengbu, Hefei, China), with a range of 500 kg and an accuracy of 0.01 kg.
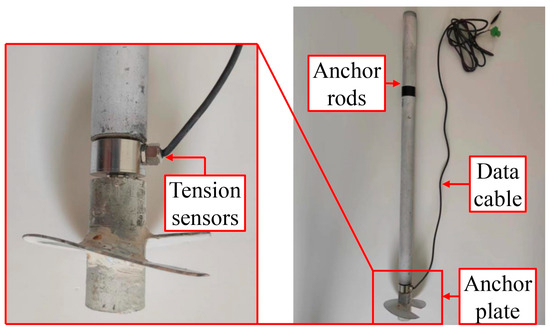
Figure 2.
Schematic diagram of helical anchor assembly.
2.3. Soil Preparation
The test soil samples consisted of soft kaolin, which had a relatively small and uniform particle size similar to marine soft soils. Additionally, soft kaolin typically contains high moisture content, closely matching that of marine soft soils [15,16]. This similarity enhanced the reliability of the test results, providing more accurate data for analysis and design. The prepared soil samples were placed in the model box, and the soil parameters were measured, as presented in Table 2.
Table 2.
Parameters of test soil.
The undrained shear strength of the soil was measured using a T-bar test, as illustrated in Figure 3. First, the soil resistance of the T-bar, which consisted of an acrylic shaft and a light bar, was measured. Subsequently, the soil resistance of the light bar alone was measured, and the soil resistance of the T-bar was derived from the difference between the resistance of the acrylic shaft and the light bar. The undrained shear strength is calculated using Equation (3):
where su represents the undrained shear strength of the soft soil; FT is the soil resistance of the T-bar; Fr is the soil resistance of the light bar; is the bearing capacity coefficient; and Ap is the projected area of the acrylic shaft.
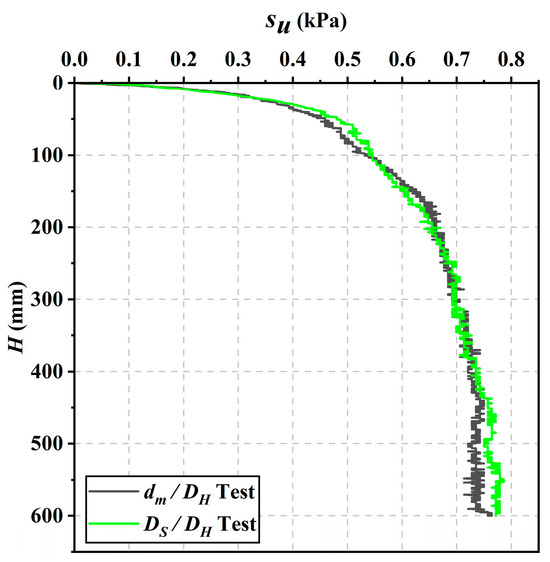
Figure 3.
Undrained shear strength of soil.
2.4. Test Equipment
The model test box, shown in Figure 4a, was a rectangular structure measuring 1500 mm in length, 910 mm in width, and 870 mm in height. The main model test box was constructed from welded angle steel.
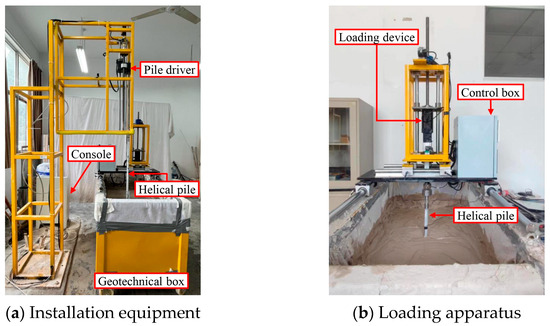
Figure 4.
Test device.
The installation equipment, shown in Figure 4a, primarily consists of a pile driver and a console. The console was configured with the appropriate rotation speed and descent speed based on the pitch and embedment depth of the helical anchor. This setup ensures that the helical anchor was vertically and stably installed, preventing significant soil depression or bulging.
The loading apparatus, depicted in Figure 4b, primarily comprises a loading mechanism and a maneuvering box. According to experimental needs, the loading forms can be divided into unidirectional loading and cyclic loading. In the unidirectional loading mode, one can control the loading direction, loading rate, and loading distance, whereas, in the cyclic loading mode, one can control the cyclic mode, cyclic frequency, and the number of cycles. This ensures that the actual existence of the spiral anchor can be replicated under various conditions.
2.5. Load Test
The loading device is illustrated in Figure 5. The loading test involved the following steps: (1) First, the T-bar test was conducted to measure the undrained shear strength of the soil. (2) Next, the lift shaft is lowered to align with the helical anchor, connected via a conversion joint, and adjusted to ensure the helical anchor is in its initial state of force. (3) The lift lever was then operated through the control box to raise the helical anchor vertically and uniformly. The upward pulling speed was set at 6 mm/min, with a pulling distance of 200 mm, while the displacement collector and tensile force transducer recorded data synchronously.
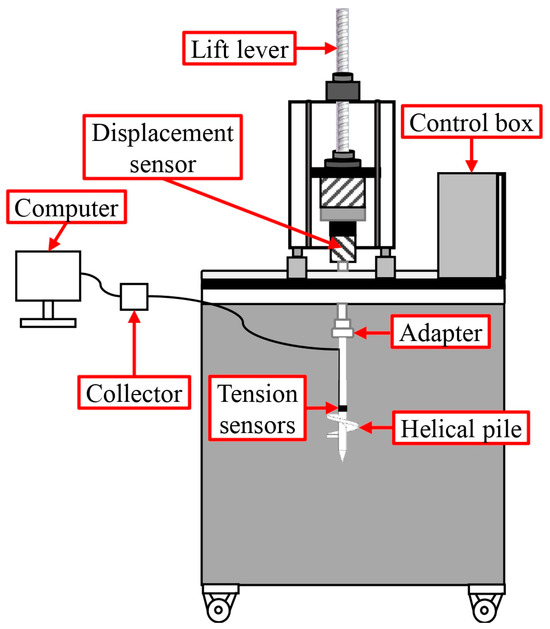
Figure 5.
MODEL loading device.
3. Test Results and Analyses
3.1. Shaft Diameter Sensitivity Test Results
The load–displacement curves for the shaft-to-plate diameter ratio are shown in Figure 6. The load–displacement curve can be divided into the following three stages: (1) The initial elasticity stage, where the load–displacement curve is linear; (2) the nonlinear slow-change stage, where the curve is nonlinear, and the slope gradually increases (the ultimate bearing capacity of the helical anchor is achieved during this stage); and (3) the smooth stage, where the load no longer increases with displacement, and the slope of the curve stabilizes at a fixed value.
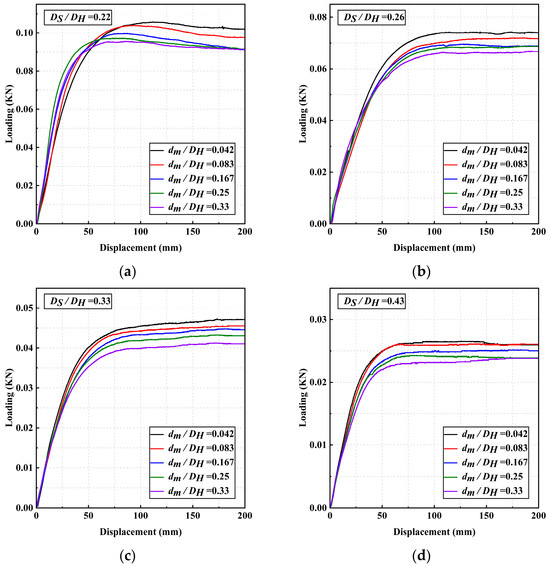
Figure 6.
Load–displacement curve of different shaft-to-plate diameter ratios. (a) DS/DH = 0.22 (b) DS/DH = 0.26 (c) DS/DH = 0.33 (d) DS/DH = 0.43.
As shown in Figure 6, the four different shaft-to-plate diameter ratios exhibit a consistent pattern: as the shaft-to-plate diameter ratio increases, the uplift bearing capacity of the helical anchor gradually decreases. This indicates that the shaft-to-plate diameter ratio has a significant impact on the uplift bearing capacity of the helical anchor. A larger helix pitch reduces the support area and contact friction between the helical anchor and the soil, thereby decreasing their interaction and the uplift bearing capacity. Conversely, a smaller anchor helix pitch increases the support area and contact friction, leading to a higher uplift bearing capacity.
3.2. Embedment Depth Sensitivity Analysis
The load–displacement curves for different depth-to-diameter ratios are shown in Figure 7. (1) In the early stage of loading, the load is relatively small, and the soil around the anchor helix begins to compress. The displacement of the anchor helix gradually increases with the applied tension, showing a linear relationship between load and displacement, indicating elastic deformation. (2) As the tension force on the anchor helix further increases, its displacement also increases, and the rupture of the surface of the soil in front of the plate begins to develop. The relationship between load and displacement becomes approximately nonlinear. (3) When the load on the anchor helix reaches the ultimate uplift bearing capacity, the displacement continues to increase, but the load remains constant. At this point, the slope of the curve stabilizes, indicating that the anchor helix is in an unstable state.
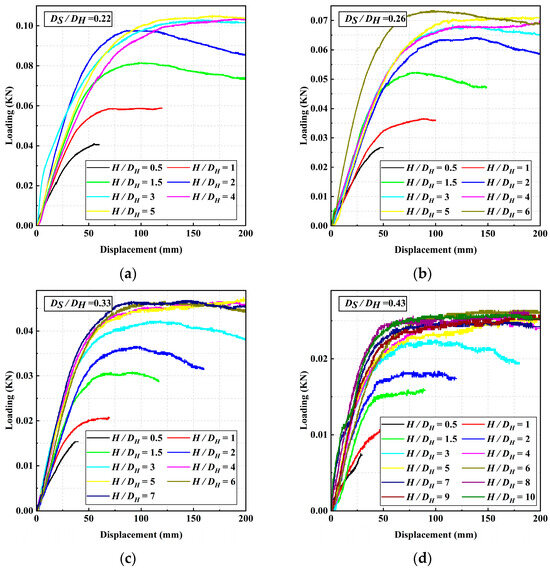
Figure 7.
Load–displacement curve of different depth-to-diameter ratios. (a) DS/DH = 0.22 (b) DS/DH = 0.26 (c) DS/DH = 0.33 (d) DS/DH = 0.43.
The four graphs in Figure 7 display a consistent pattern, showing that the uplift bearing capacity of the helical anchors gradually increases with the depth-to-diameter ratio. This occurs because deeper embedment depth increases the contact area between the anchor and the soil, thereby enhancing lateral resistance and friction, which in turn increases the uplift bearing capacity. However, for the four different diameter ratios in Figure 7, the uplift bearing capacity of the helical anchors decreases from 0.1 kN to 0.025 kN as the diameter ratio increases. Therefore, it can be concluded that the diameter ratio significantly impacts the uplift bearing capacity of the helical anchors. This is because, as the diameter of the anchor increases while the diameter of the anchor helix remains unchanged, the support area of the anchor helix decreases. This reduction in support area diminishes the end bearing force of the anchor helix, thereby reducing the uplift bearing capacity of the helical anchor.
3.3. dm/DH and DS/DH Analyses of Test Results for Nc
As shown in Figure 8, the curves representing the uplift bearing capacity coefficient Nc versus the shaft-to-plate diameter ratio for the four different diameter ratios indicate that Nc decreases as the shaft-to-plate diameter ratio increases. This occurs because, when the diameter of the anchor helix remains constant, increasing the pitch (i.e., increasing the shaft-to-plate diameter ratio) leads to greater spacing between the helical threads of the anchor. This increase in spacing reduces the bearing area of the helical anchor and decreases the friction between the anchor and the soil. Therefore, as the shaft-to-plate diameter ratio increases, Nc decreases.
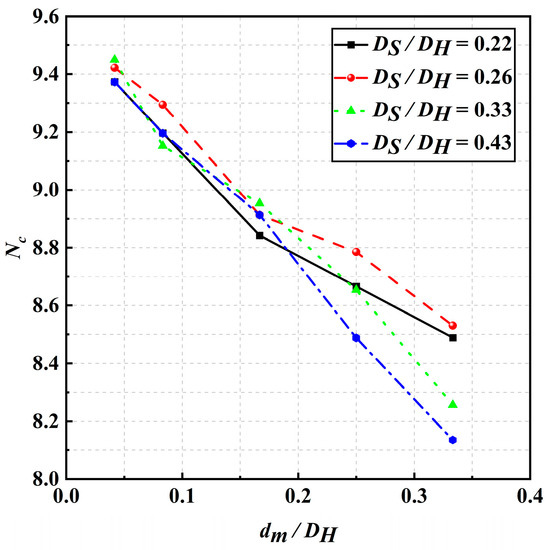
Figure 8.
Curve of the relationship between the coefficient of uplift bearing capacity and the ratio of the helical diameter.
In Figure 8, the variation in Nc with a decreasing diameter ratio is shown as follows: (1) For a diameter ratio of 0.43, as the shaft-to-plate diameter ratio increases from 0.0375 to 0.3375, Nc decreases by 13.9%. (2) For a diameter ratio of 0.33, as the shaft-to-plate diameter ratio increases from 0.0375 to 0.3375, Nc decreases by 12.6%. (3) For a diameter ratio of 0.26, as the shaft-to-plate diameter ratio increases from 0.0375 to 0.3375, Nc decreases by 9.5%. (4) For a diameter ratio of 0.22, Nc decreases by 9.5% as the shaft-to-plate diameter ratio increases from 0.0375 to 0.3375. These results indicate that Nc decreases as the shaft-to-plate diameter ratio increases. Furthermore, as the diameter ratio decreases, the rate of the decrease in Nc gradually slows and tends to stabilize.
In Figure 9, the relationship between the pullout load-bearing capacity coefficient Nc and the depth ratio for four different diameter ratios can be observed. Initially, as the depth ratio increases, Nc typically shows a gradual upward trend. However, as the depth ratio continues to increase, this growth trend gradually slows until a critical depth ratio is reached, at which point Nc stabilizes and does not increase further with additional increases in the depth ratio. This behavior occurs because increasing the embedment depth increases the effective length of the anchor within the soil, enhancing the friction and bond between the anchor and the soil, leading to a gradual increase in Nc. However, as the embedment depth increases further, the lateral constraint of the soil also increases, making the stress field around the helical anchor more compact. This compaction reduces the relative displacement and deformation of the helical anchor, resulting in a gradual decrease in the growth rate of Nc.
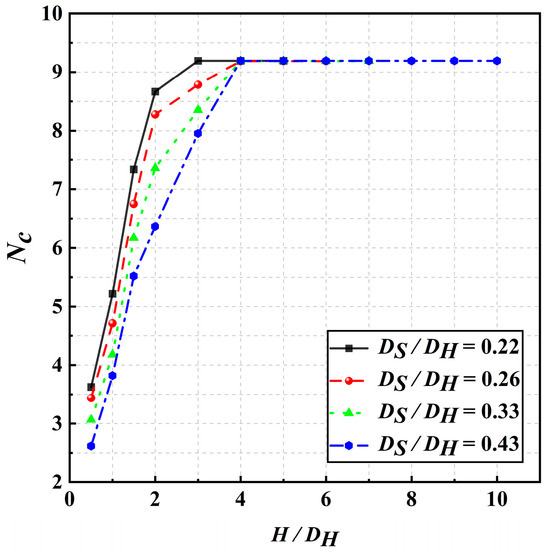
Figure 9.
Curve of the relationship between the uplift bearing capacity coefficient and the depth to diameter ratio.
In Figure 9, it is assumed that the Nc values for the four diameter ratios increase with the depth-to-diameter ratio (H/DH) in the interval 0.5 ≤ H/DH ≤ 4; this is referred to as the change interval. The Nc values that stabilize in the interval H/DH ≥ 4 are referred to as the stable interval. As seen in Figure 9, within the change interval, Nc gradually decreases hierarchically as the diameter ratio increases. Thus, the behavior of the four diameter ratios in the change interval can be approximated by a linear equation with the same slope. In the stable interval, all diameter ratios converge to the same fixed Nc value. However, in the change interval, the initial Nc value decreases as the diameter ratio increases.
Based on the data presented in Figure 8, we calculated the bearing capacity coefficients, Nc, of the pullout-resistant system for four different diameter ratios and presented their average values in Figure 10, where Nc,max = 9.4. As the shaft-to-plate diameter ratio (dm/DH) increases, the ratio of the average value of each point to the maximum value of Nc is 1, 0.98, 0.95, 0.91, and 0.89. The discount equation is shown below in Equation (4):
where Nc,max represents the maximum mean value of Nc; and y represents the reduction factor of Nc,max.
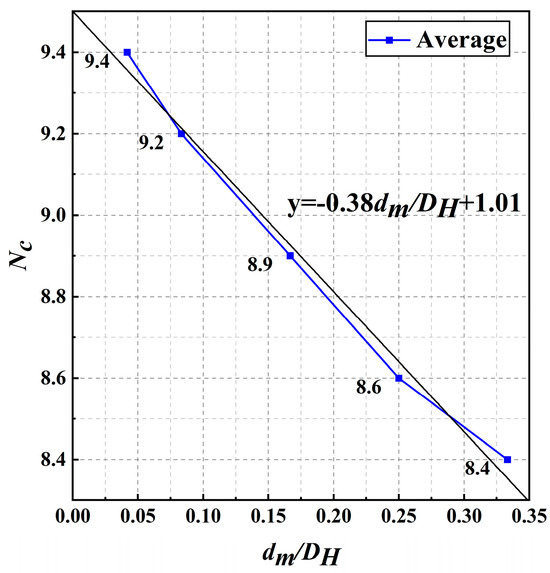
Figure 10.
Average Nc of the shaft-to-plate diameter ratio test.
Therefore, Nc is calculated as a function of the helical diameter ratio (dm/DH), as shown in Equation (5):
where Nc,x is the formula for calculating the Nc to the helical diameter ratio.
As shown in Figure 9, the interval in which Nc increases with the depth-to-diameter ratio (H/DH) between 0.5 ≤ H/DH ≤ 4 is termed the change interval. The convergence of Nc values to a constant in the interval H/DH ≥ 4 is referred to as the stabilization interval. The average slope of the four diameter ratios in the change interval is 1.7. Equation (6) represents the hypothetical variation of Nc in the change interval.
where Y represents the formula for Nc in the change interval, and d represents the intercept of this interval.
As shown in Figure 9, the value of intercept d varies with different diameter ratios, and the relationship between d and the diameter ratio is provided in Equation (7) below:
Therefore, Nc is calculated as a function of the diameter ratio (DS/DH), as illustrated in Equation (8) below:
where Nc,m represents the formula for calculating Nc as a function of the diameter ratios, and Nc,max represents the maximum value of Nc for the four diameter ratios at the critical depth-to-diameter ratio.
In summary, the calculation formula for the combined shaft-to-plate diameter ratio and diameter is presented in Equation (9) below:
where Nc accounts for the comprehensive consideration of both the shaft-to-plate diameter ratio and the diameter ratio in the calculation formula.
4. Conclusions
In this paper, the impact of side effects on the pull-out bearing performance of deep-sea floating foundation helical anchors is examined through laboratory model tests. The main conclusions are as follows:
- (1)
- The uplift bearing capacity of helical anchors decreases as the shaft-to-plate diameter ratio (dm/DH) increases.
- (2)
- The uplift bearing capacity of a helical anchor increases with the depth-to-diameter ratio (H/DH) but decreases with increasing diameter ratio across different diameter ratios.
- (3)
- The pullout load factor, Nc, decreases as the shaft-to-plate diameter ratio (dm/DH) increases. However, for different diameter ratios, Nc decreases with decreasing diameter ratio, but the rate of the decrease gradually slows and stabilizes.
- (4)
- The pull-out bearing capacity, Nc, increases with the depth-to-diameter ratio (H/DH), but upon reaching the critical depth-to-diameter ratio (H/DH ≥ 4), Nc stabilizes and no longer increases with further increases in depth-to-diameter ratio or diameter ratio. However, within the variation interval 0.5 ≤ H/DH ≤ 4, the initial value of Nc gradually decreases as the diameter ratio increases.
This paper derives its conclusions primarily from field tests and outlines the following directions for future research:
- (1)
- This study focuses solely on the static-loaded vertical pullout resistance of spiral anchors. However, in complex and dynamic marine environments, anchorage foundations may be influenced by wave-induced cyclic loading under lateral forces. Therefore, further research is necessary to understand the impact of cyclic loading on the lateral behavior of spiral anchors.
- (2)
- This study examines the vertical pullout bearing performance of spiral anchors in controlled indoor soft soil conditions. Given the unique characteristics of oceanic soft soil, a suction force is likely to develop beneath the anchor plate of spiral anchors during pullout. Advancing the understanding of vertical pullout bearing performance through finite element analysis is crucial to optimizing suction force effects.
Author Contributions
Methodology, P.J.; validation, P.J.; formal analysis, Z.Z. and B.C.; resources, Y.H.; data curation, P.J., Z.Z., and B.C.; writing—original draft, B.C.; writing—review and editing, Y.H.; visualization, Y.H.; supervision, Y.H.; funding acquisition, Y.H. All authors have read and agreed to the published version of the manuscript.
Funding
This research is funded by Jiangsu Coastal Power Infrastructure Intelligence Engineering Research Center through grant No. JC2024081.
Institutional Review Board Statement
Not applicable.
Informed Consent Statement
Not applicable.
Data Availability Statement
All data, models, or codes that support the findings of this study are available from the corresponding author upon reasonable request.
Conflicts of Interest
Authors Bingsan Chen and Zhenqing Zhang were employed by the company Lianyungang Zhiyuan Electric Power Design Co., Ltd. The remaining authors declare that the research was conducted in the absence of any commercial or financial relationships that could be construed as a potential conflict of interest.
References
- Niroumand, H.; Kassim, K.A.; Nazir, R.; Faizi, K. Experimental behavior of circular anchor helixs under uplift test in cohesive soils. Electron. J. Geotech. Eng. 2012, 17 HR, 1–8. [Google Scholar]
- Chen, Z.; Tho, K.K.; Leung, C.F.; Chow, Y.K. Influence of overburden pressure and soil rigidity on uplift behavior of square plate anchor in uniform clay. Comput. Geotech. 2013, 52, 71–81. [Google Scholar] [CrossRef]
- Singh, S.; Ramaswamy, S. Effect of shape on holding capacity of plate anchors buried in soft soil. Geomech. Geoengin. Int. J. 2008, 3, 145–154. [Google Scholar] [CrossRef]
- Song, Z.; Hu, Y.; Randolph, M.F. Numerical simulation of vertical pullout of plate anchors in clay. J. Geotech. Geoenviron. Eng. 2008, 134, 866–875. [Google Scholar] [CrossRef]
- Aghazadeh Ardebili, Z.; Gabr, M.; Rahman, M. Uplift capacity of plate anchors in saturated clays: Analyses with different constitutive models. Int. J. Geomech. 2016, 16, 04015053. [Google Scholar] [CrossRef]
- Das, B.M. A procedure for estimation of ultimate uplift capacity of foundations in clay. Soils Found. 1980, 20, 77–82. [Google Scholar] [CrossRef]
- Vesić, A.S. Breakout resistance of objects embedded in ocean bottom. J. Soil Mech. Found. Div. 1971, 97, 1183–1205. [Google Scholar] [CrossRef]
- Saeedy, H.S. Stability of circular vertical earth anchors. Can. Geotech. J. 1987, 24, 452–456. [Google Scholar] [CrossRef]
- Rao, S.N.; Prasad, Y. Estimation of uplift capacity of helical anchors in clays. J. Geotech. Eng. 1993, 119, 352–357. [Google Scholar] [CrossRef]
- Dickin, E.A.; Leung, C.F. Centrifugal model tests on vertical anchor helixs. J. Geotech. Eng. 1983, 109, 1503–1525. [Google Scholar] [CrossRef]
- Guo, F. Indoor experimental study on vertical pullout capacity of helical anchors. J. Wuhan Univ. Metall. Technol. 1997, 20, 223–229. [Google Scholar]
- Zong, Z.; Zhuang, X.; Huang, Y.; Cao, B.; Zhu, J. Experimental study on uplift capacity of pressure grouted helical piles. Ocean. Eng. 2022, 40, 160–166. [Google Scholar]
- Khatri, V.N.; Kumar, J. Vertical uplift resistance of circular plate anchors in clays under undrained condition. Comput. Geotech. 2009, 36, 1352–1359. [Google Scholar] [CrossRef]
- Merifield, R.; Lyamin, A.; Sloan, S.; Yu, H. Three-dimensional lower bound solutions for stability of plate anchors in clay. J. Geotech. Geoenviron. Eng. 2003, 129, 243–253. [Google Scholar] [CrossRef]
- Xiaoxuan, Z.; Zhongling, Z.; Yunhan, H.; Bo, C.; Jianguo, Z. Experimental study on the uplift performance of pressire grouted helical pile with GFRP casing in marine soft clay. J. Jiangsu Ocean. Univ. (Nat. Sci.Ed.) 2021, 30, 55–59. [Google Scholar]
- Zong, Z.L.; Zhuang, X.; Huang, Y.H.; Zheng, J.C.; Jin, W.; Zhao, X.Q.; Zhang, Y. Experiment on the compressive bearing performance of helix stiffened cement mixing piles embedded in soft clay influenced by the installed technique. Ocean. Eng. 2023, 41, 168–176. [Google Scholar]
Disclaimer/Publisher’s Note: The statements, opinions and data contained in all publications are solely those of the individual author(s) and contributor(s) and not of MDPI and/or the editor(s). MDPI and/or the editor(s) disclaim responsibility for any injury to people or property resulting from any ideas, methods, instructions or products referred to in the content. |
© 2024 by the authors. Licensee MDPI, Basel, Switzerland. This article is an open access article distributed under the terms and conditions of the Creative Commons Attribution (CC BY) license (https://creativecommons.org/licenses/by/4.0/).