
RS-DETR: An Improved Remote Sensing Object Detection Model Based on RT-DETR


Abstract
1. Introduction
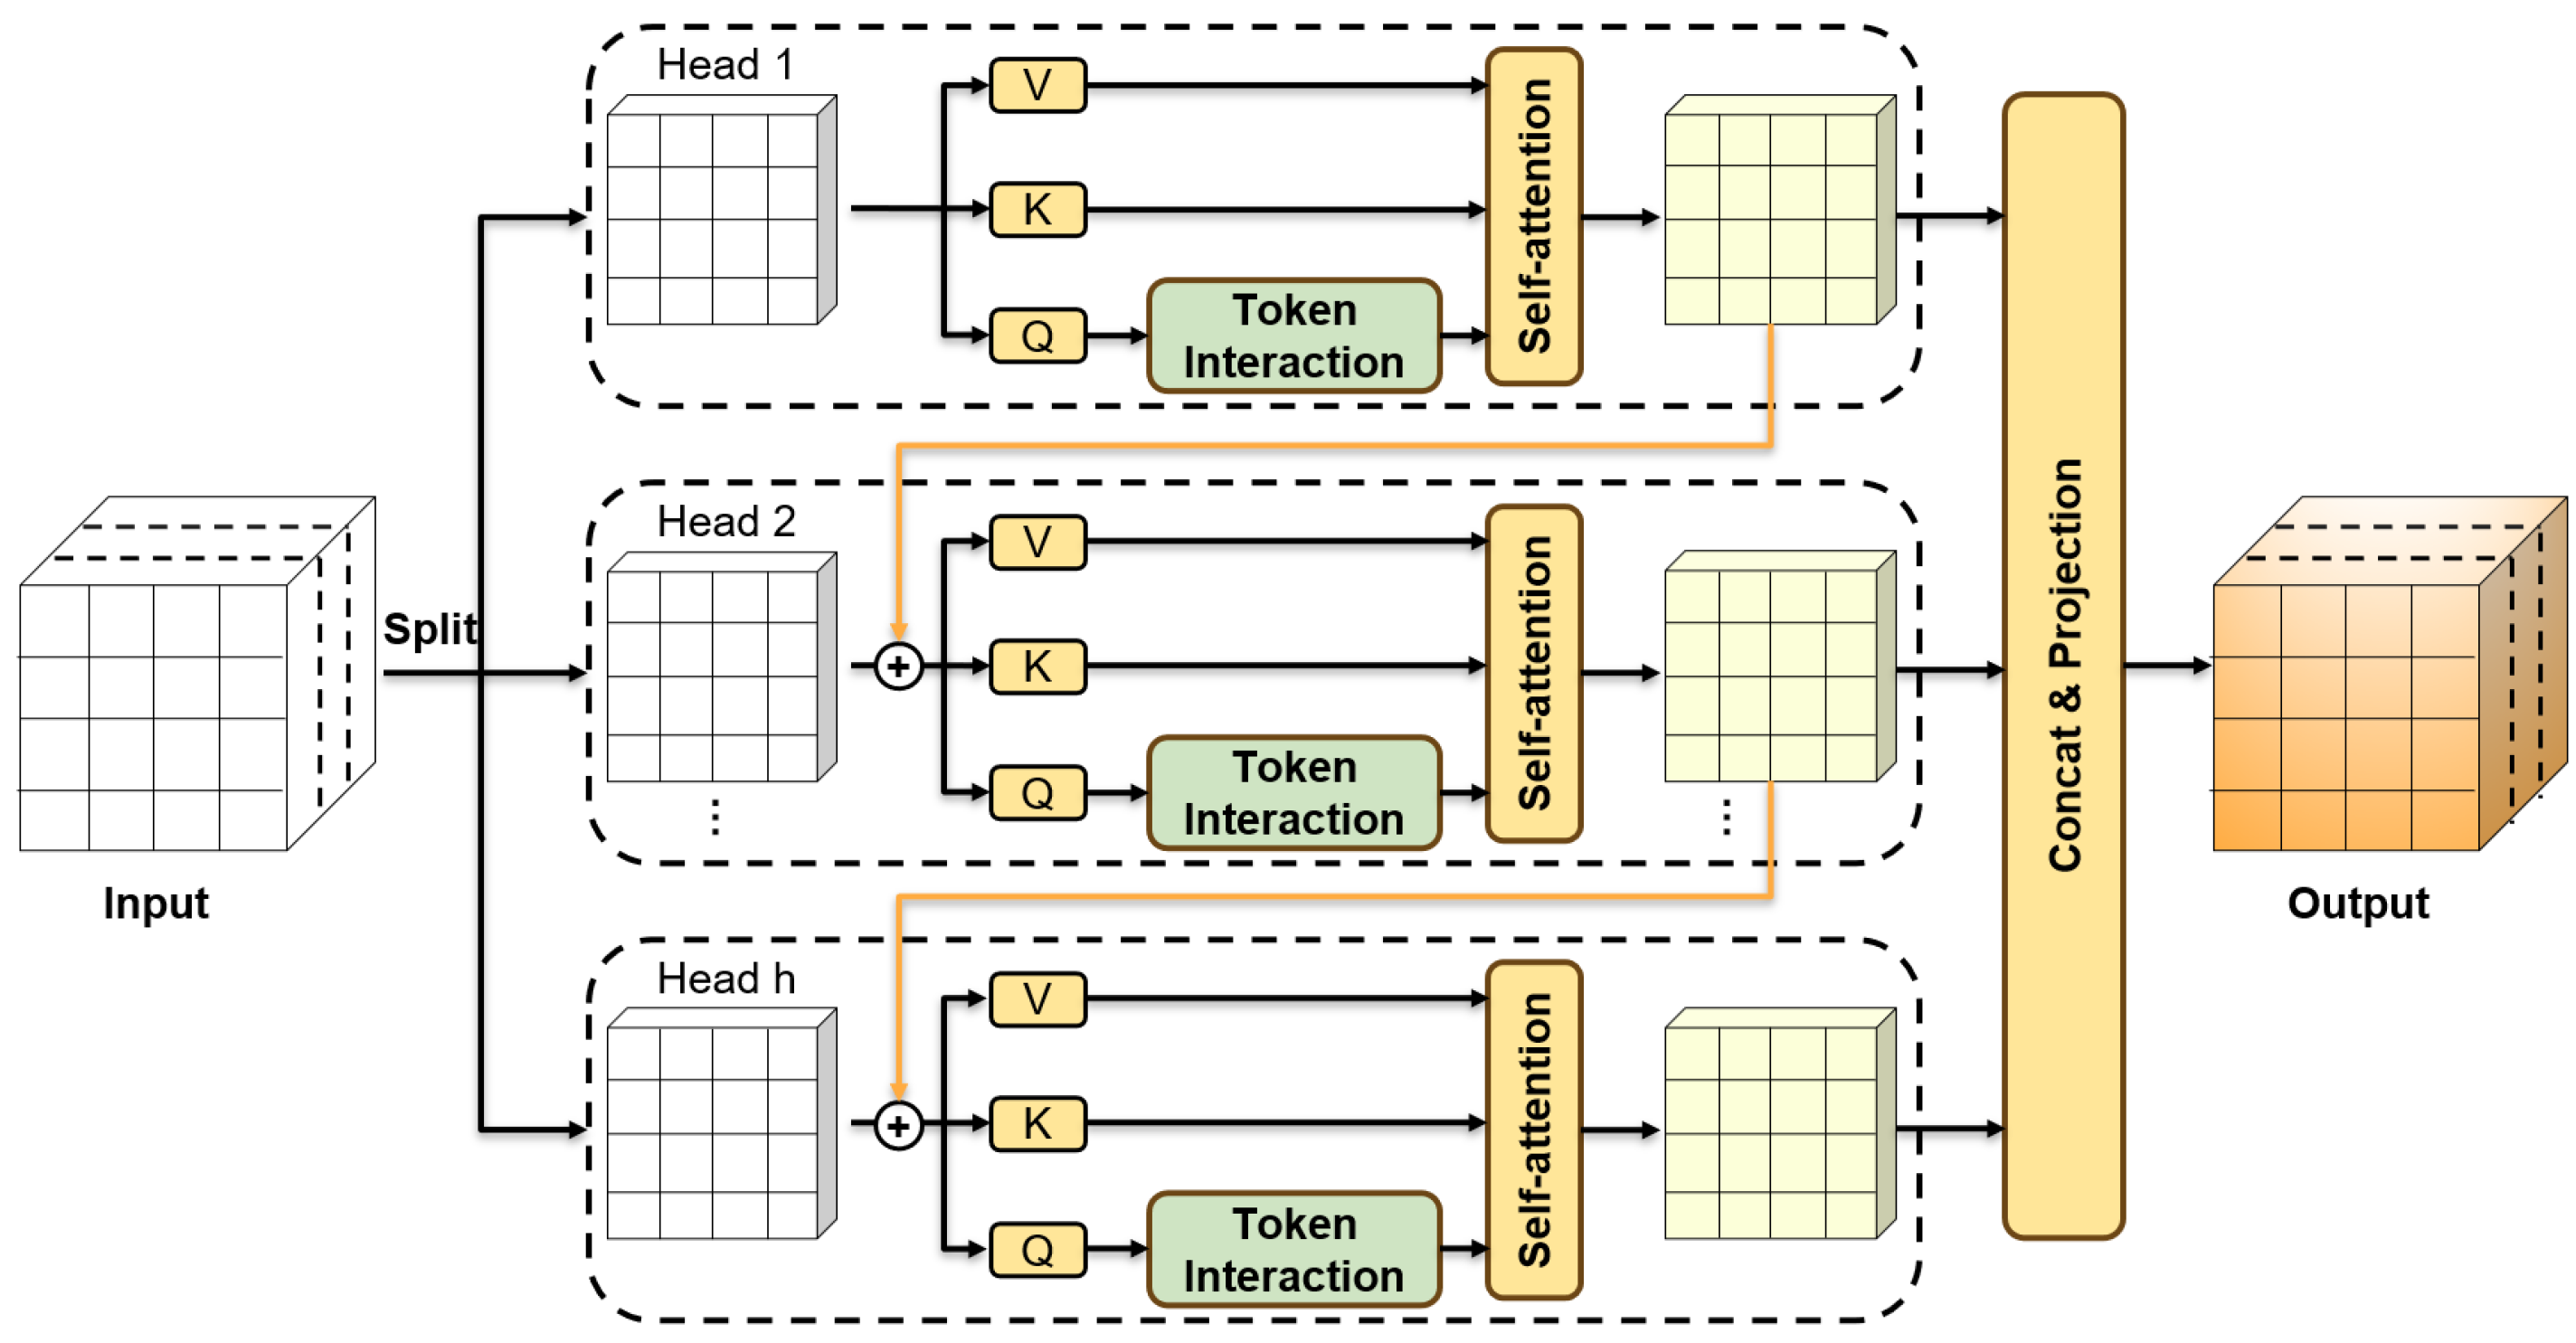
- To enhance the interaction between features at different levels and improve computational efficiency, we incorporate cascaded group attention into the attention-driven feature interaction module.
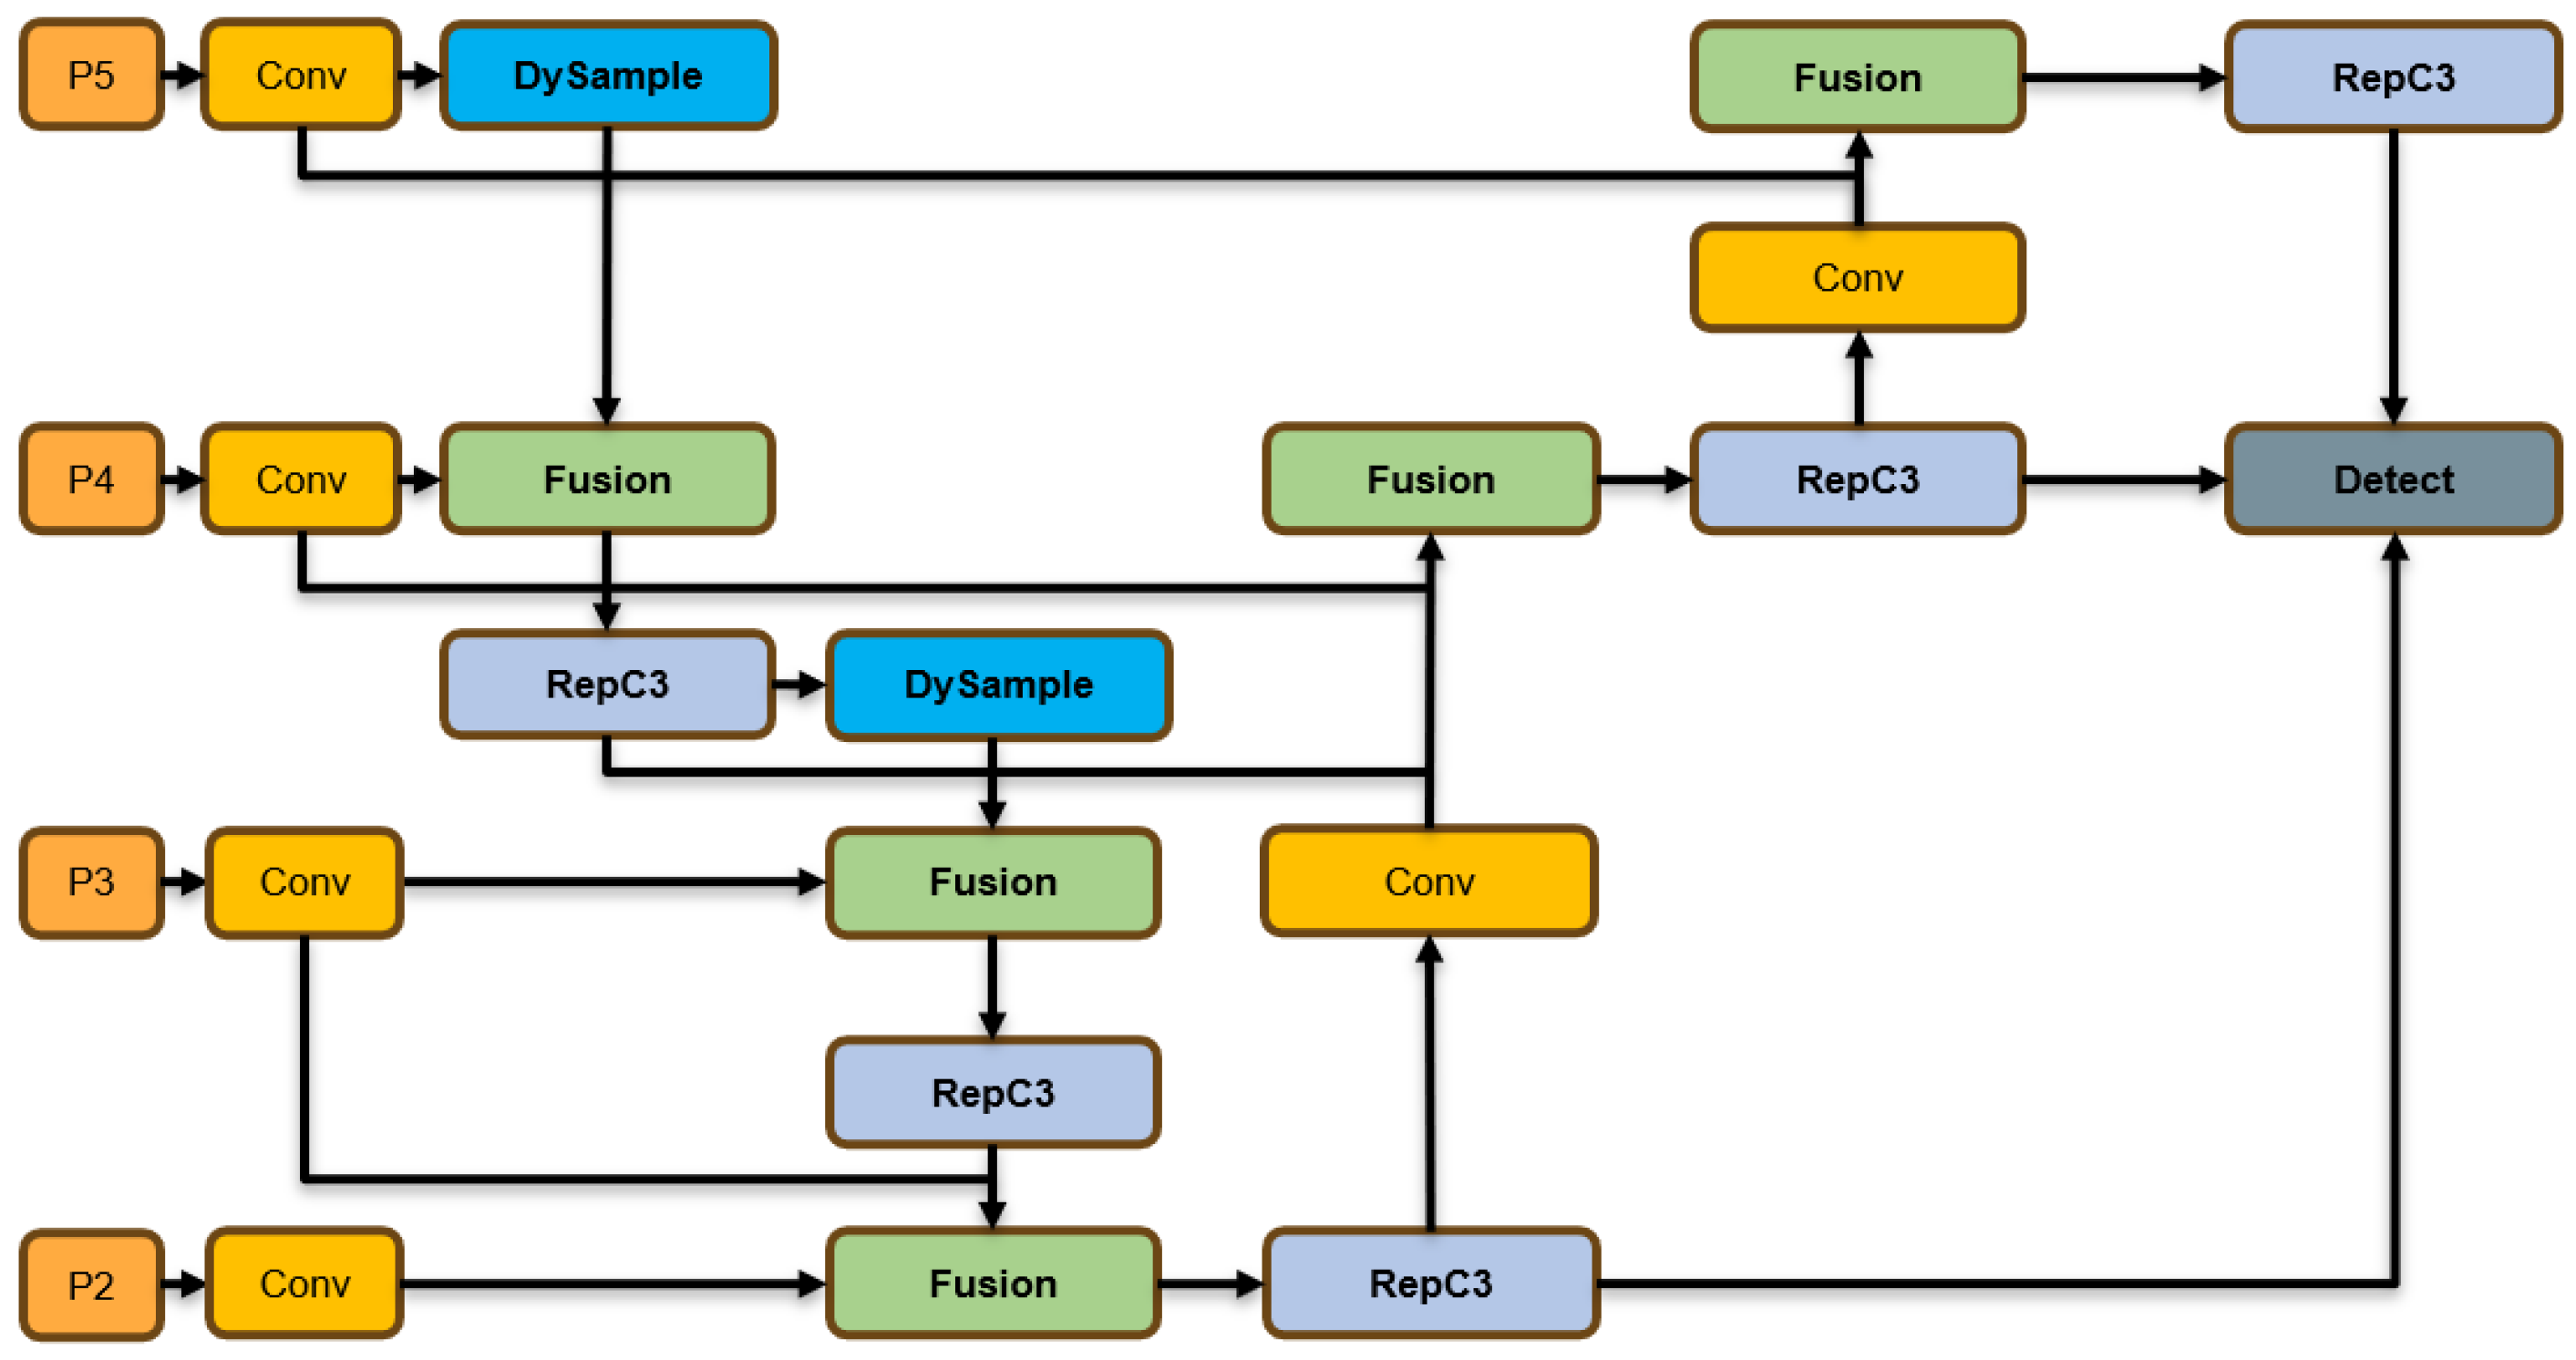
- To improve multi-scale feature fusion and object detection accuracy, we propose an enhanced bidirectional feature pyramid network.
- To improve detection performance for small and overlapping targets, we propose a novel bounding box regression loss function, Focaler-GIoU.
2. Related Work
2.1. CNN-Based Object Detection
2.2. Transformer-Based Object Detection
3. Methodology
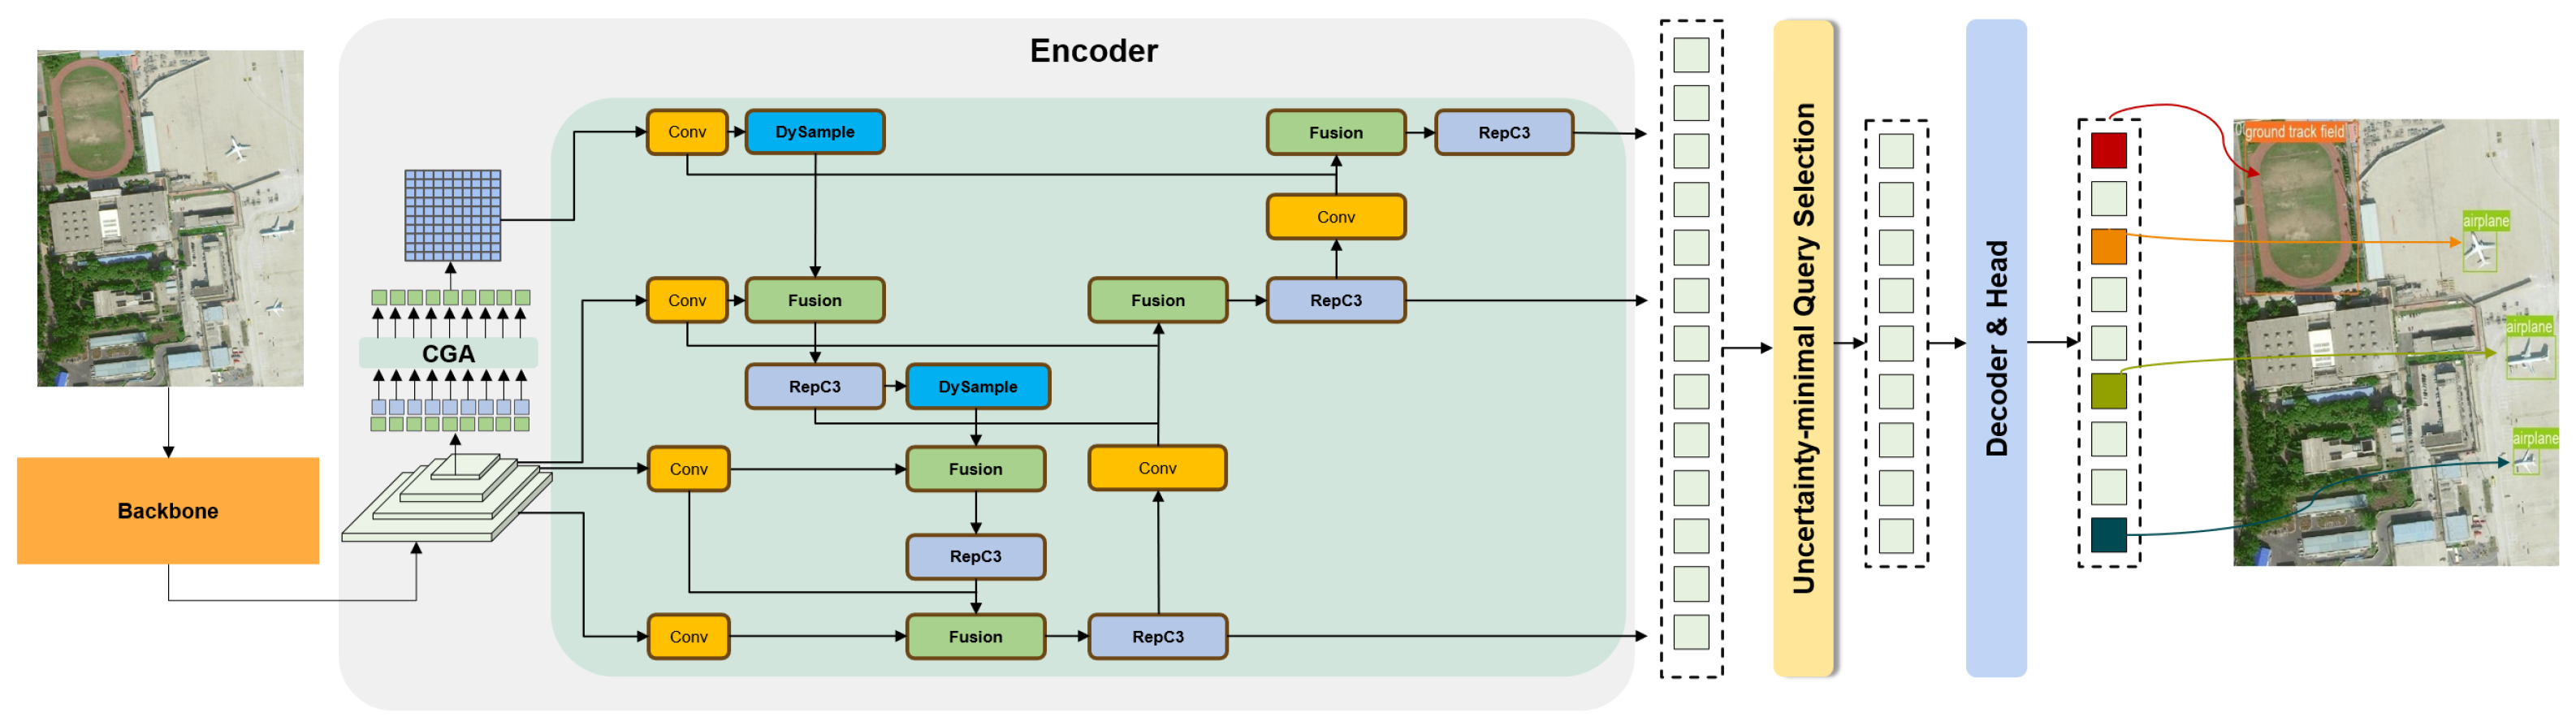
3.1. Overview of the Proposed RS-DETR Algorithm
3.2. The Cascaded Group Attention Mechanism
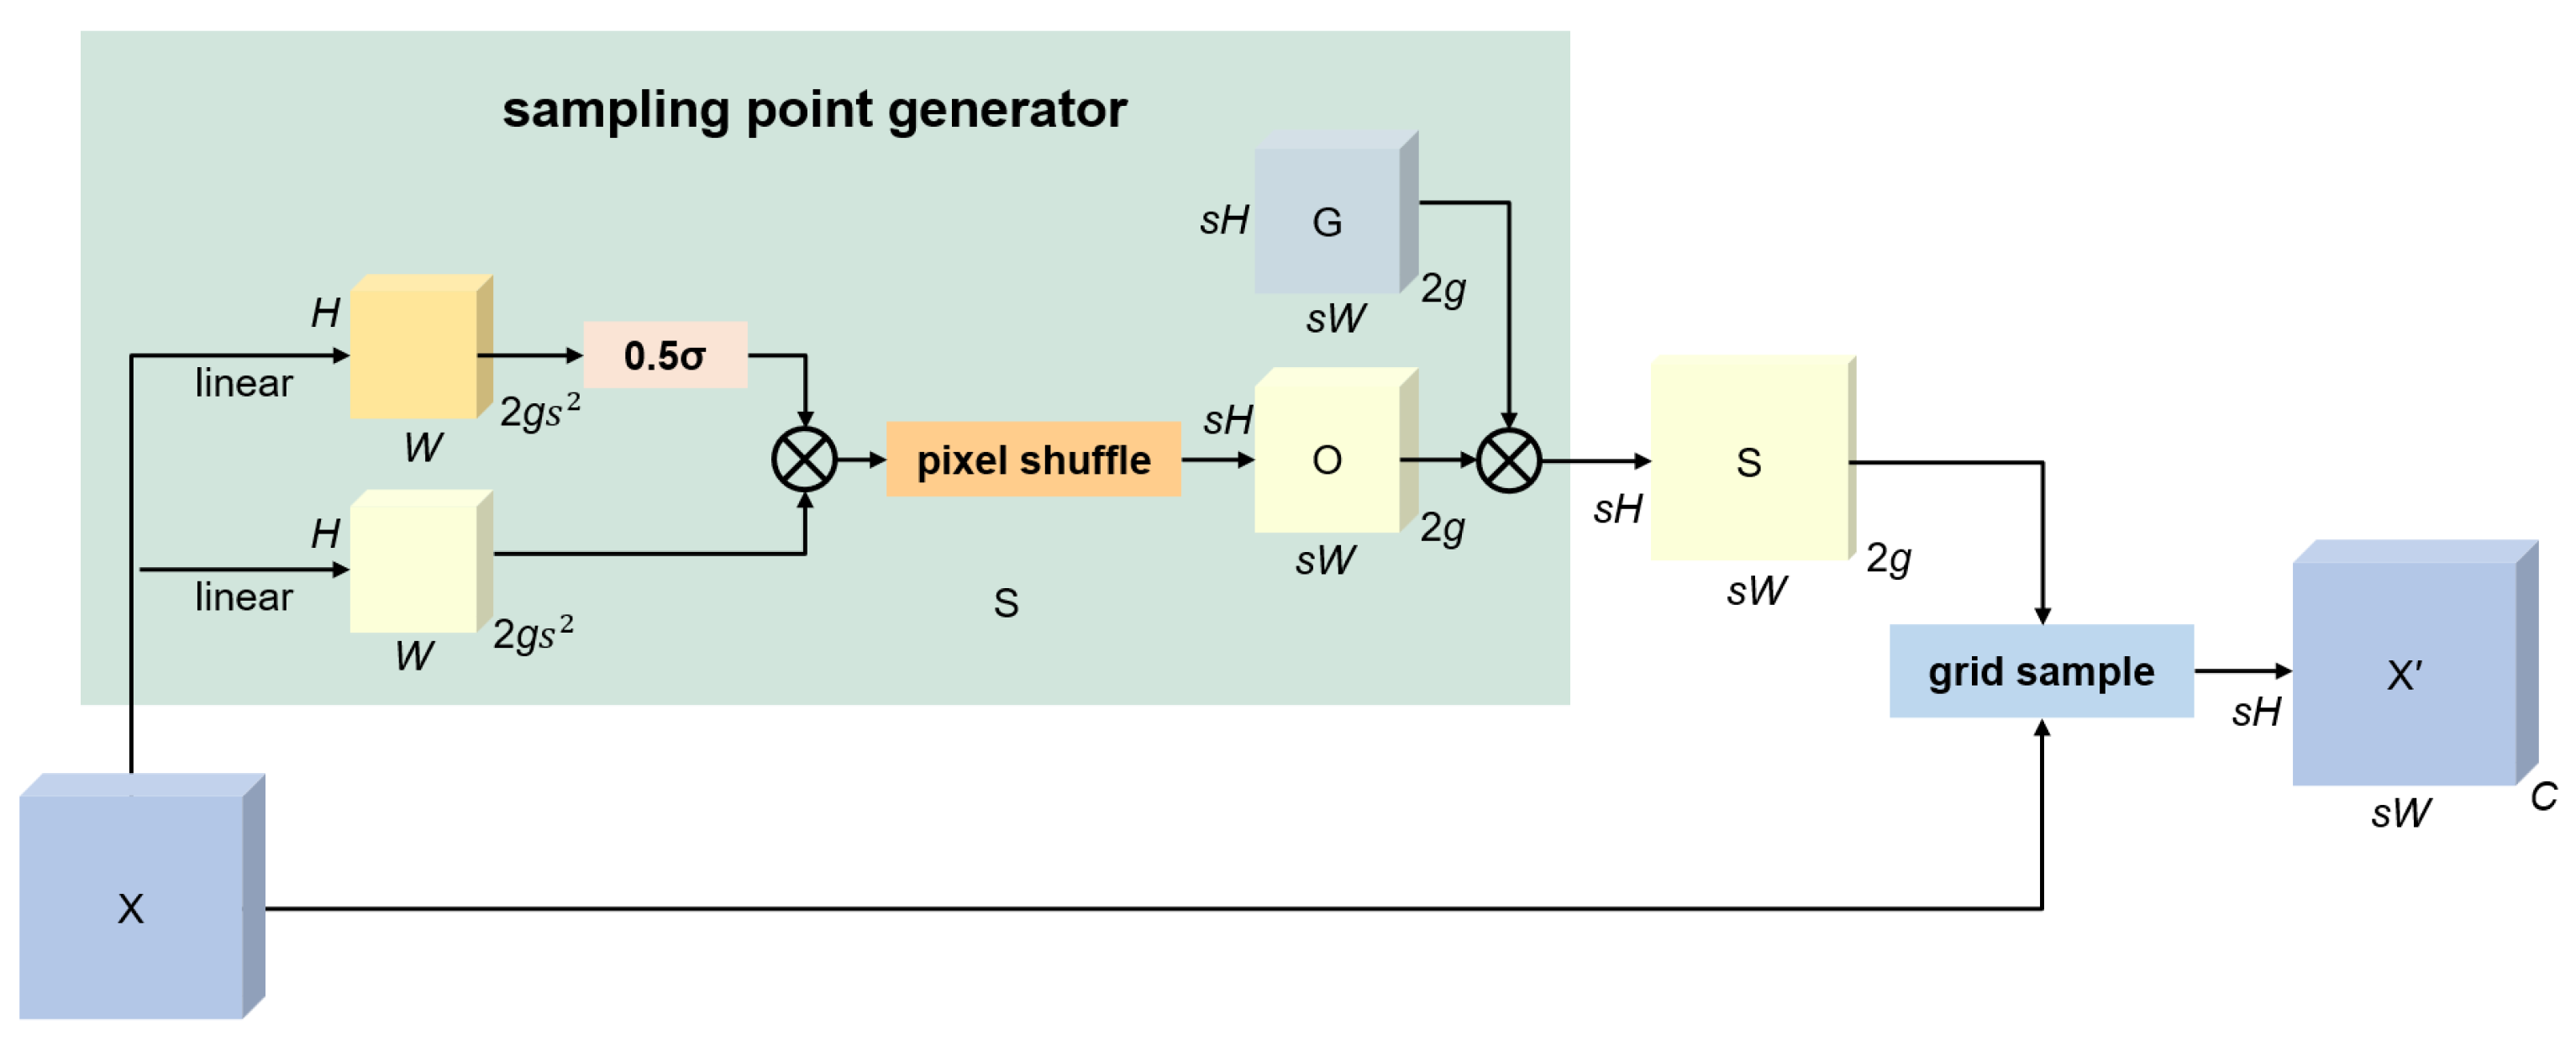
3.3. The EBiFPN Module
3.4. The Focaler-GIoU
4. Results and Discussion
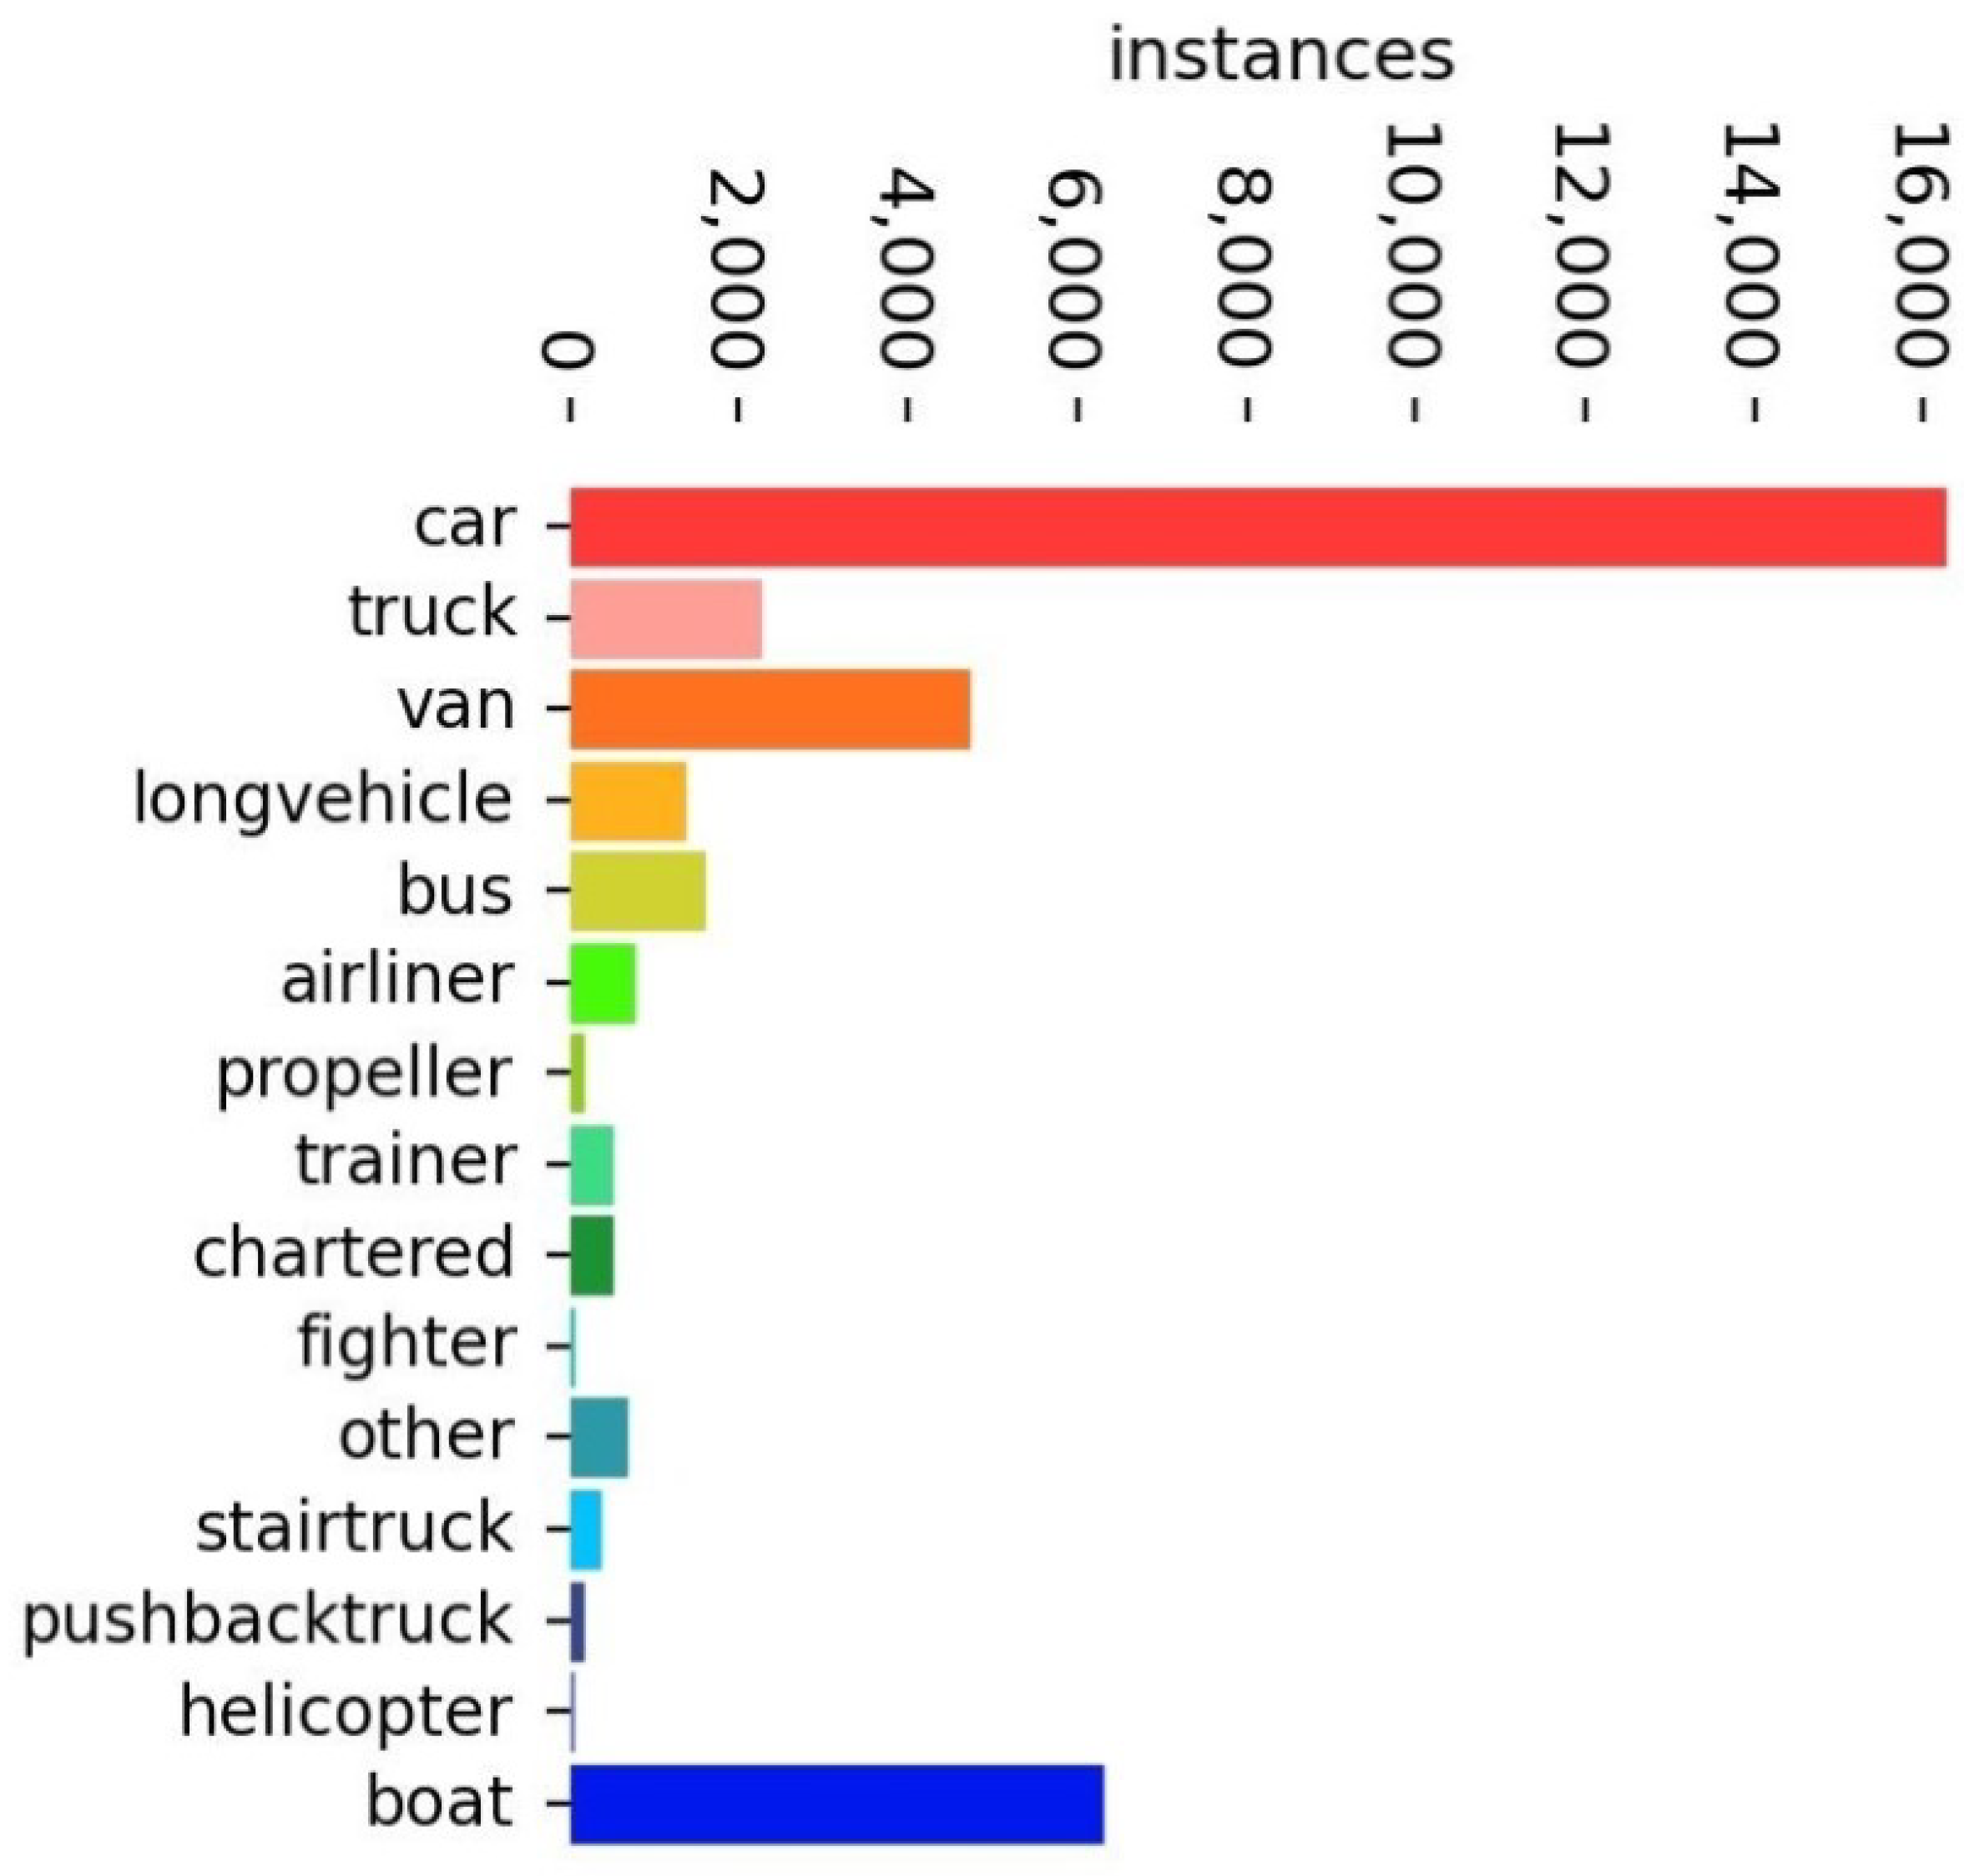
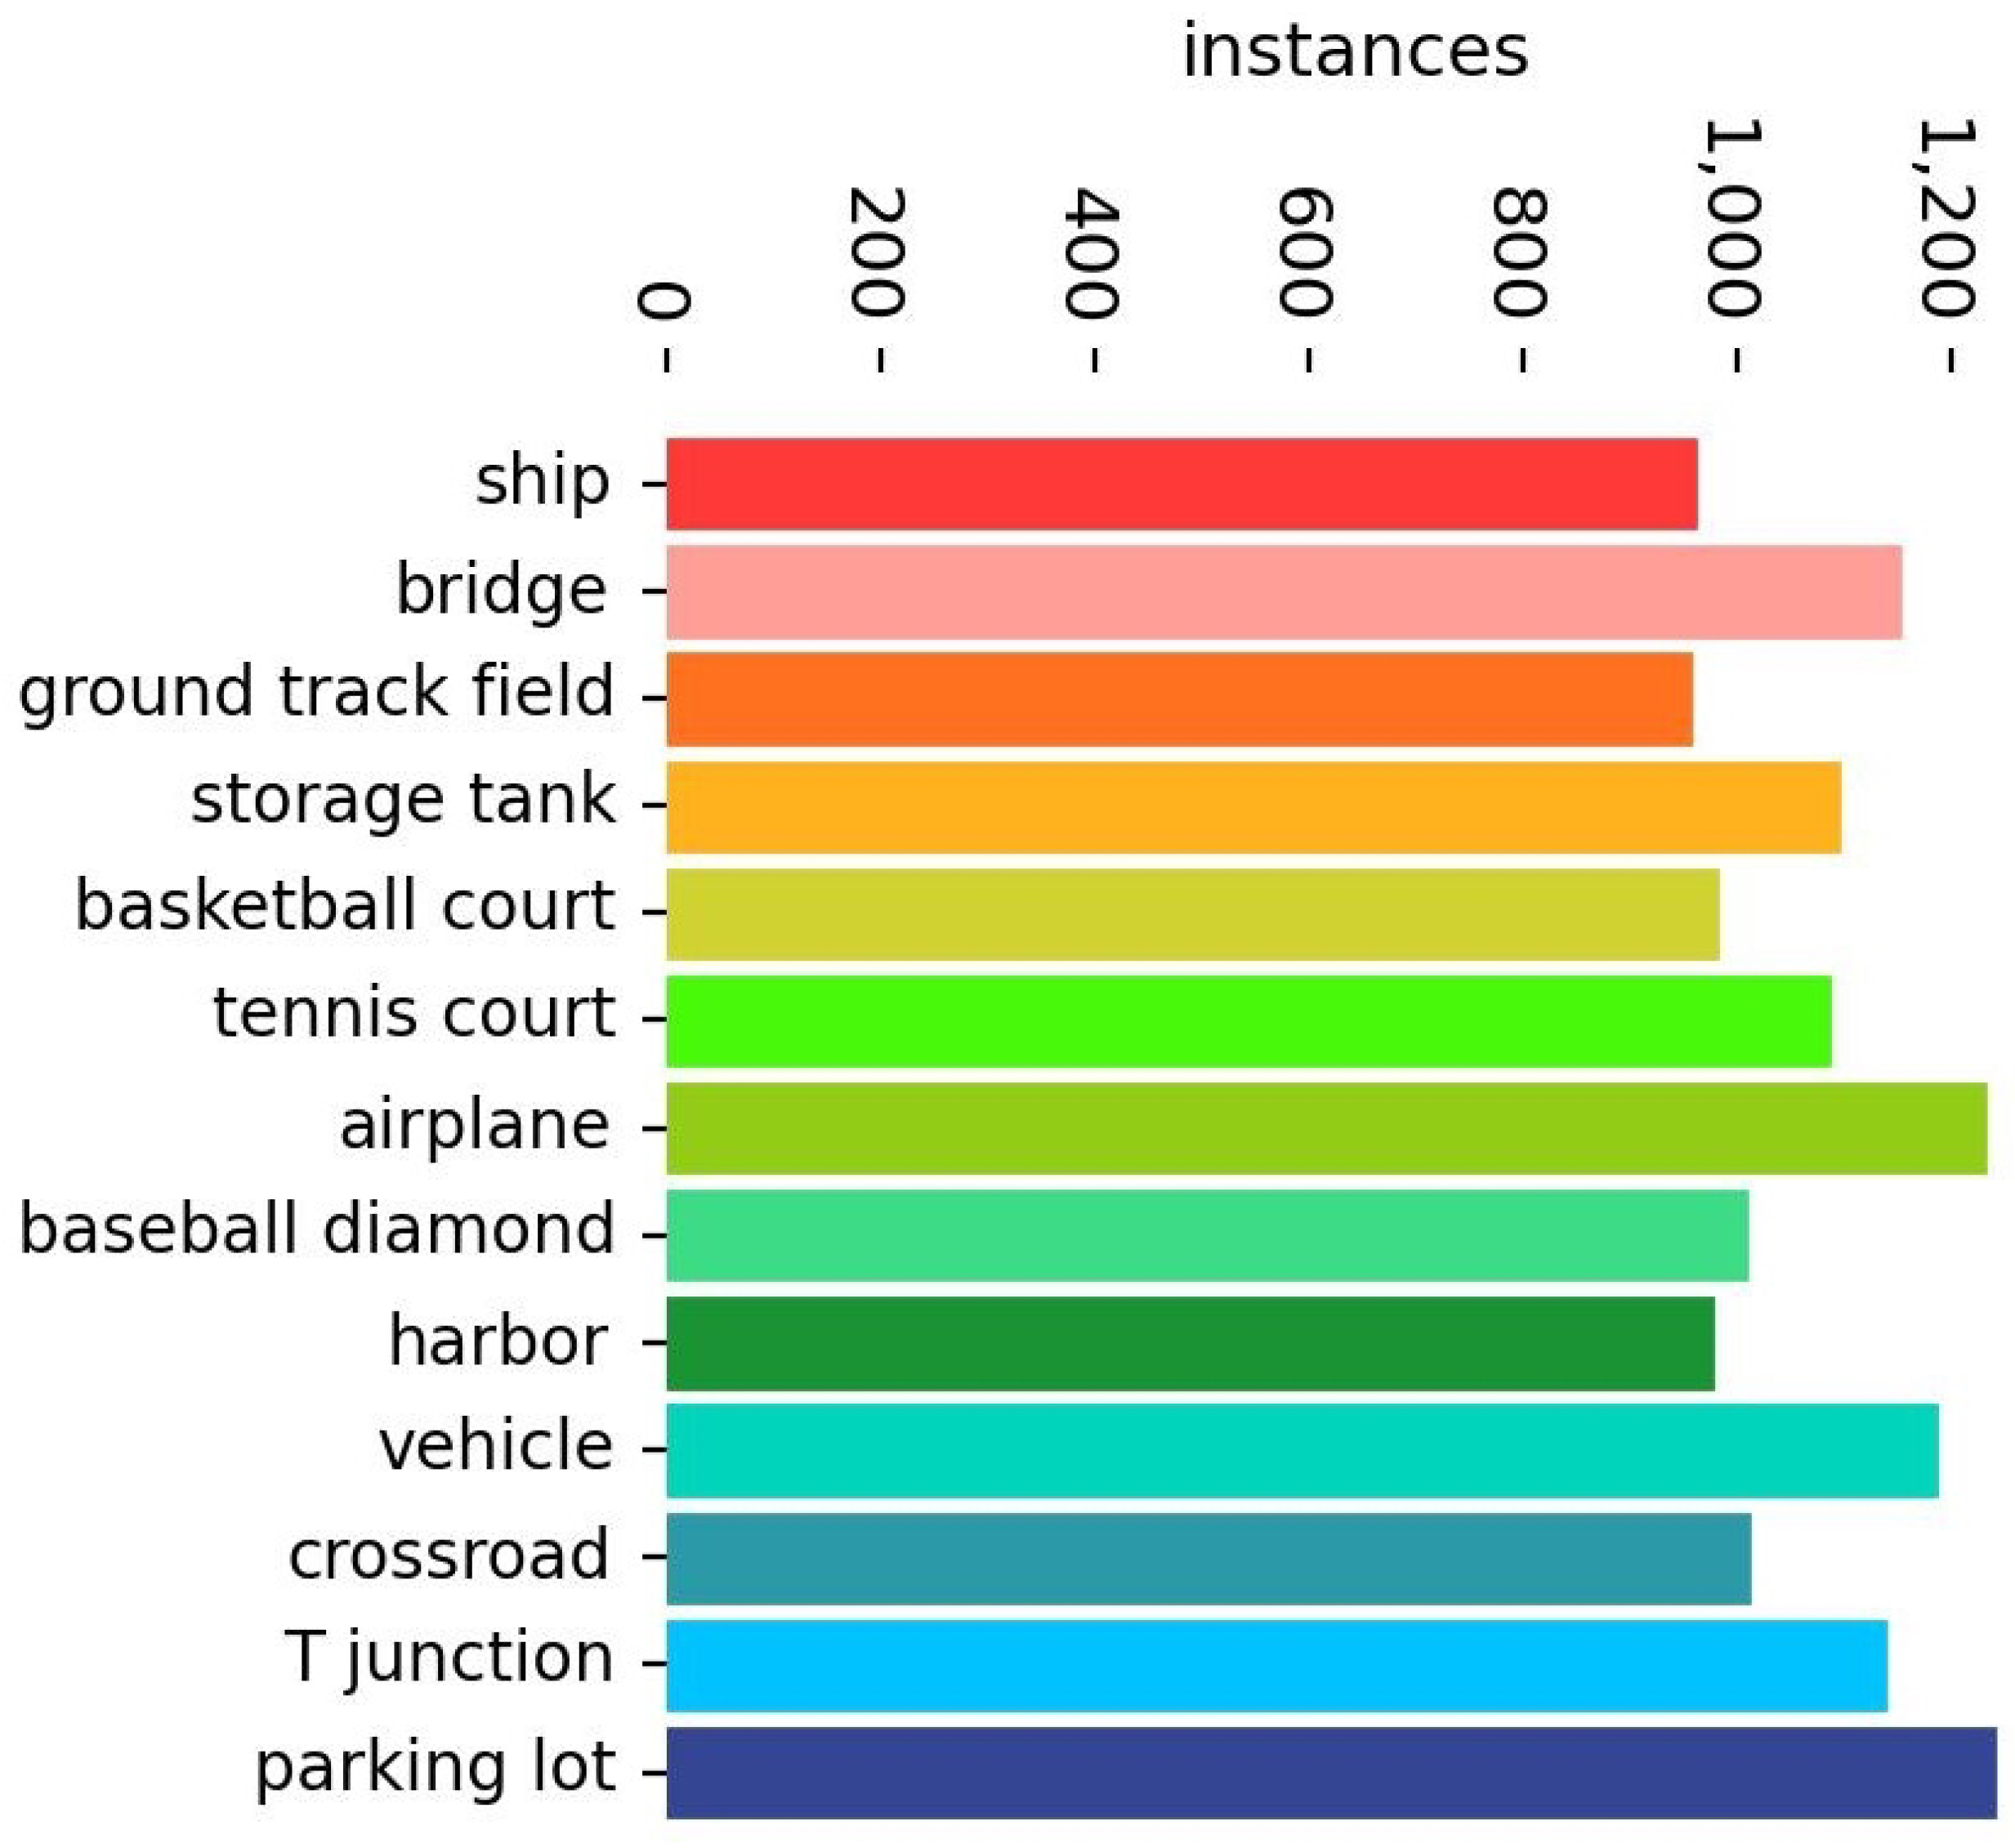
4.1. Datasets
4.2. Evaluation Metrics
4.3. Implementation Details
4.4. Experiments on the SIMD Dataset
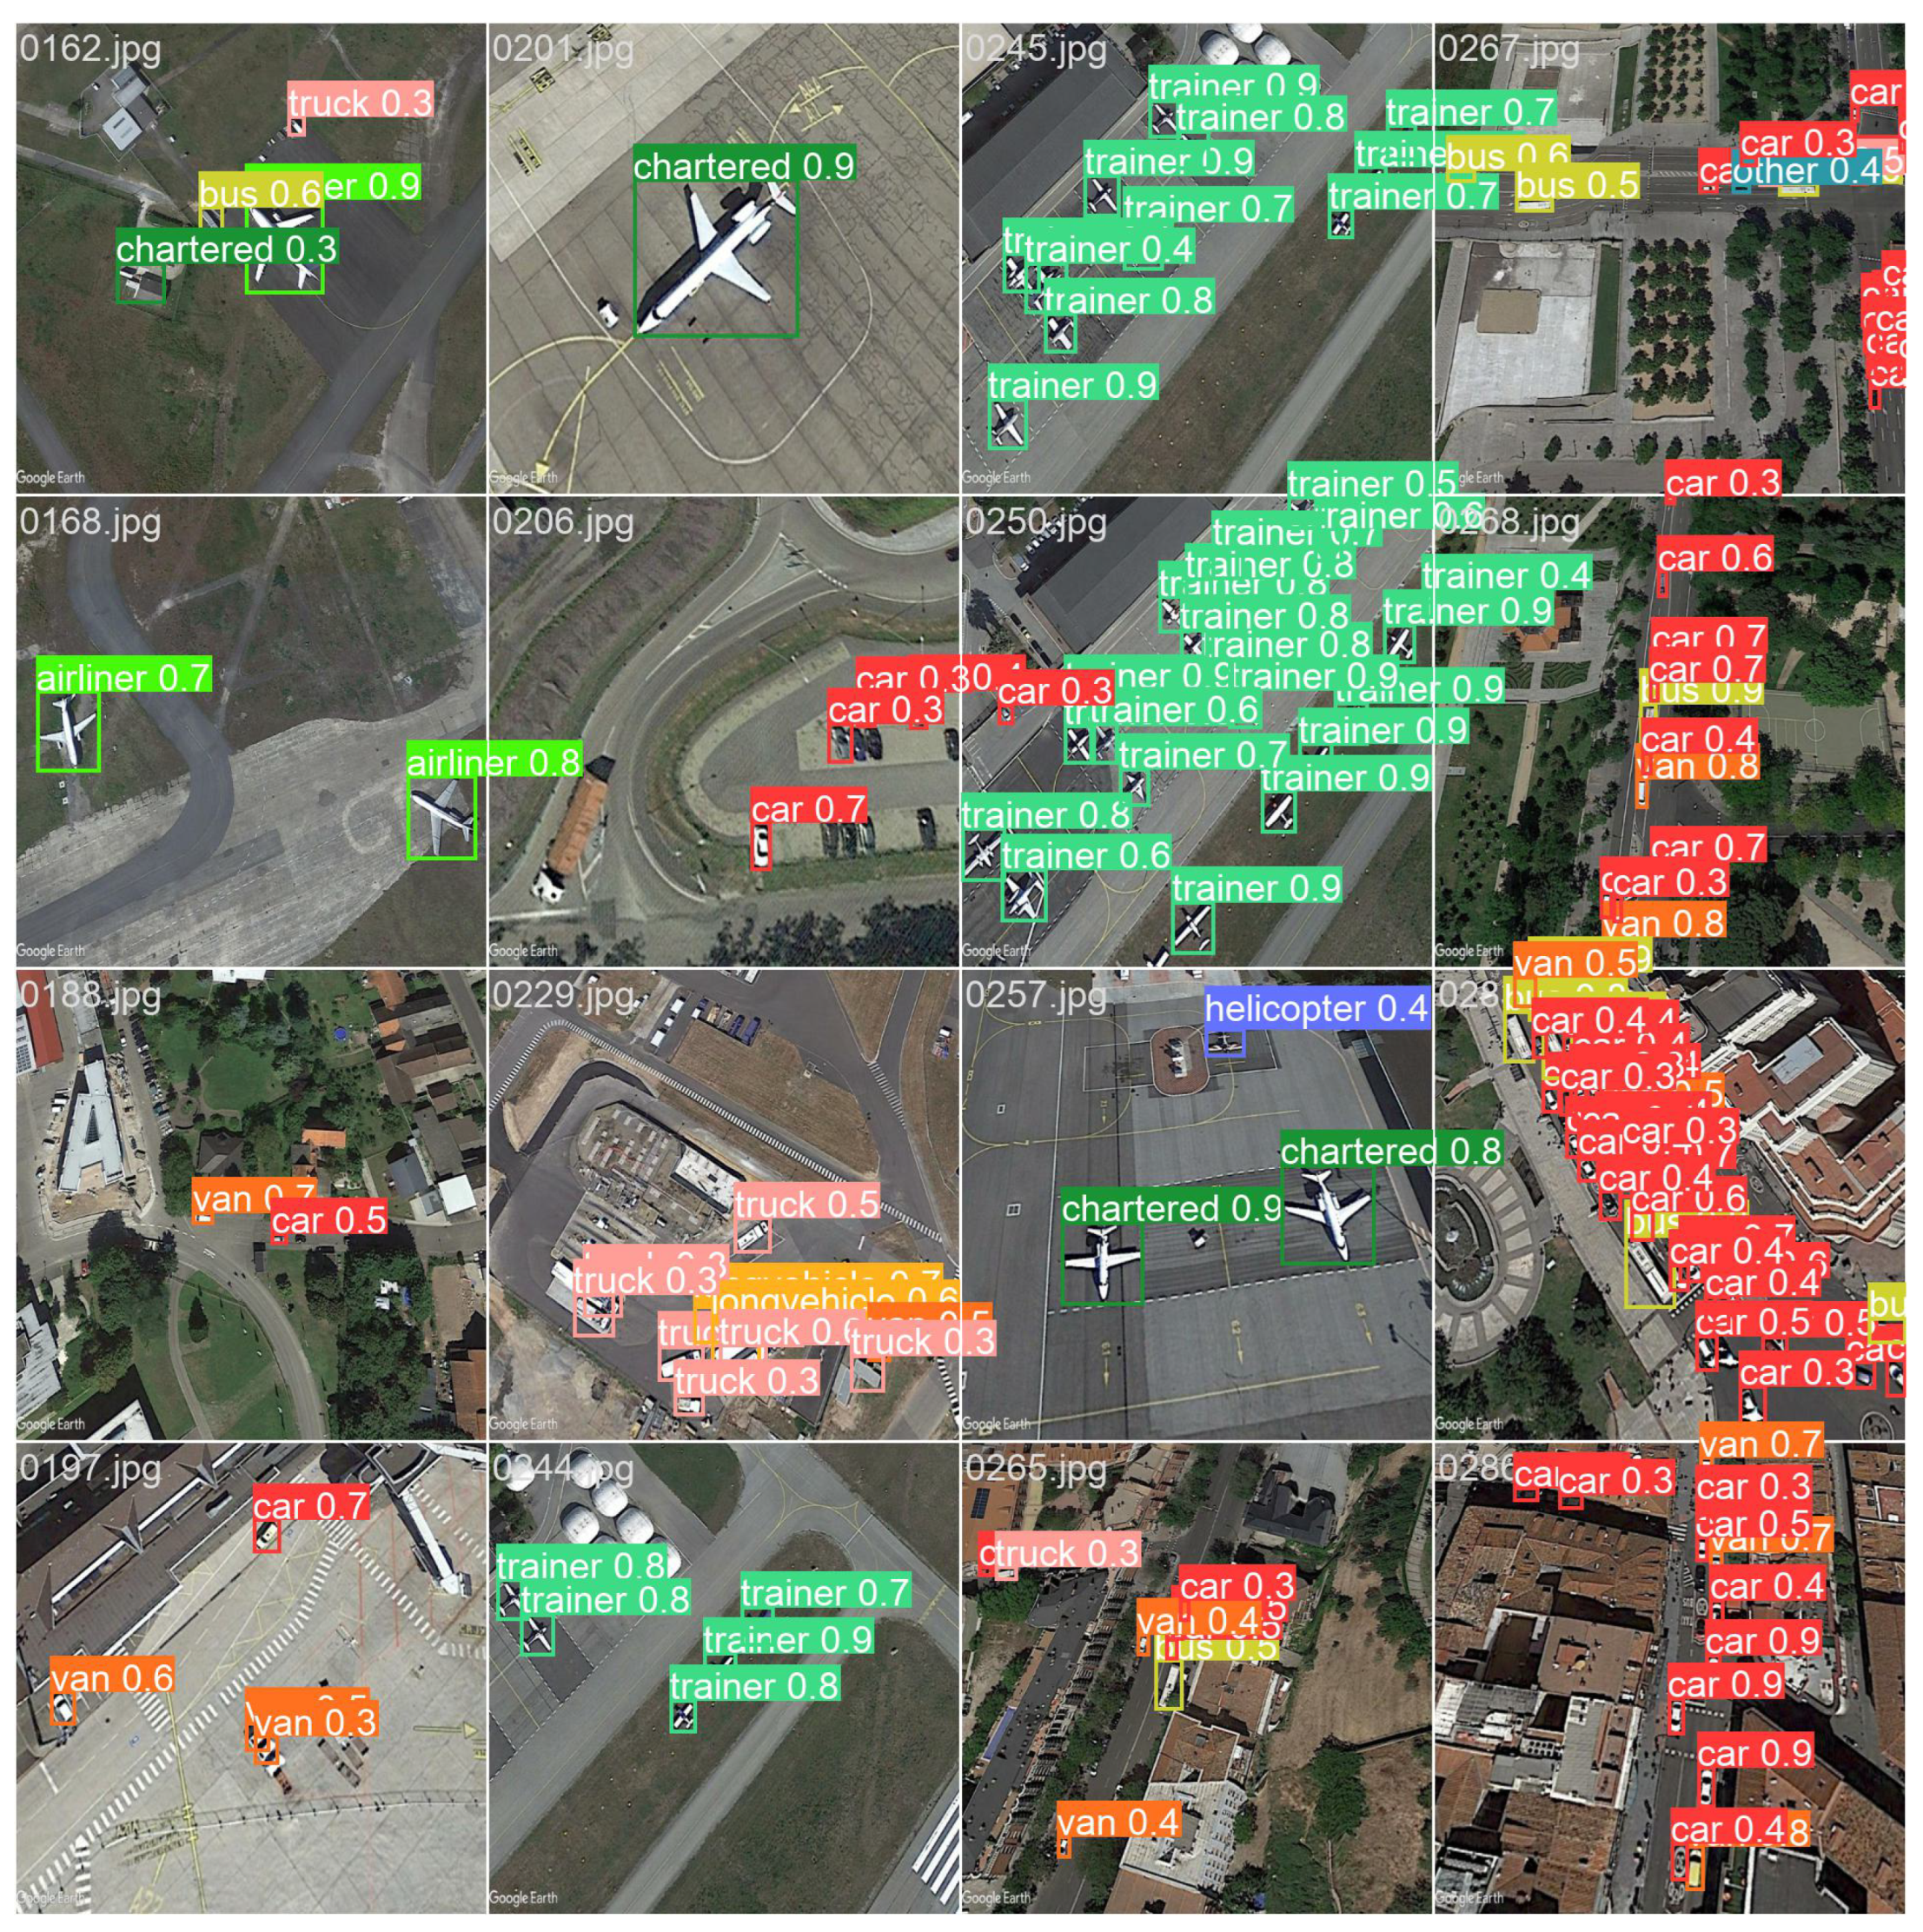
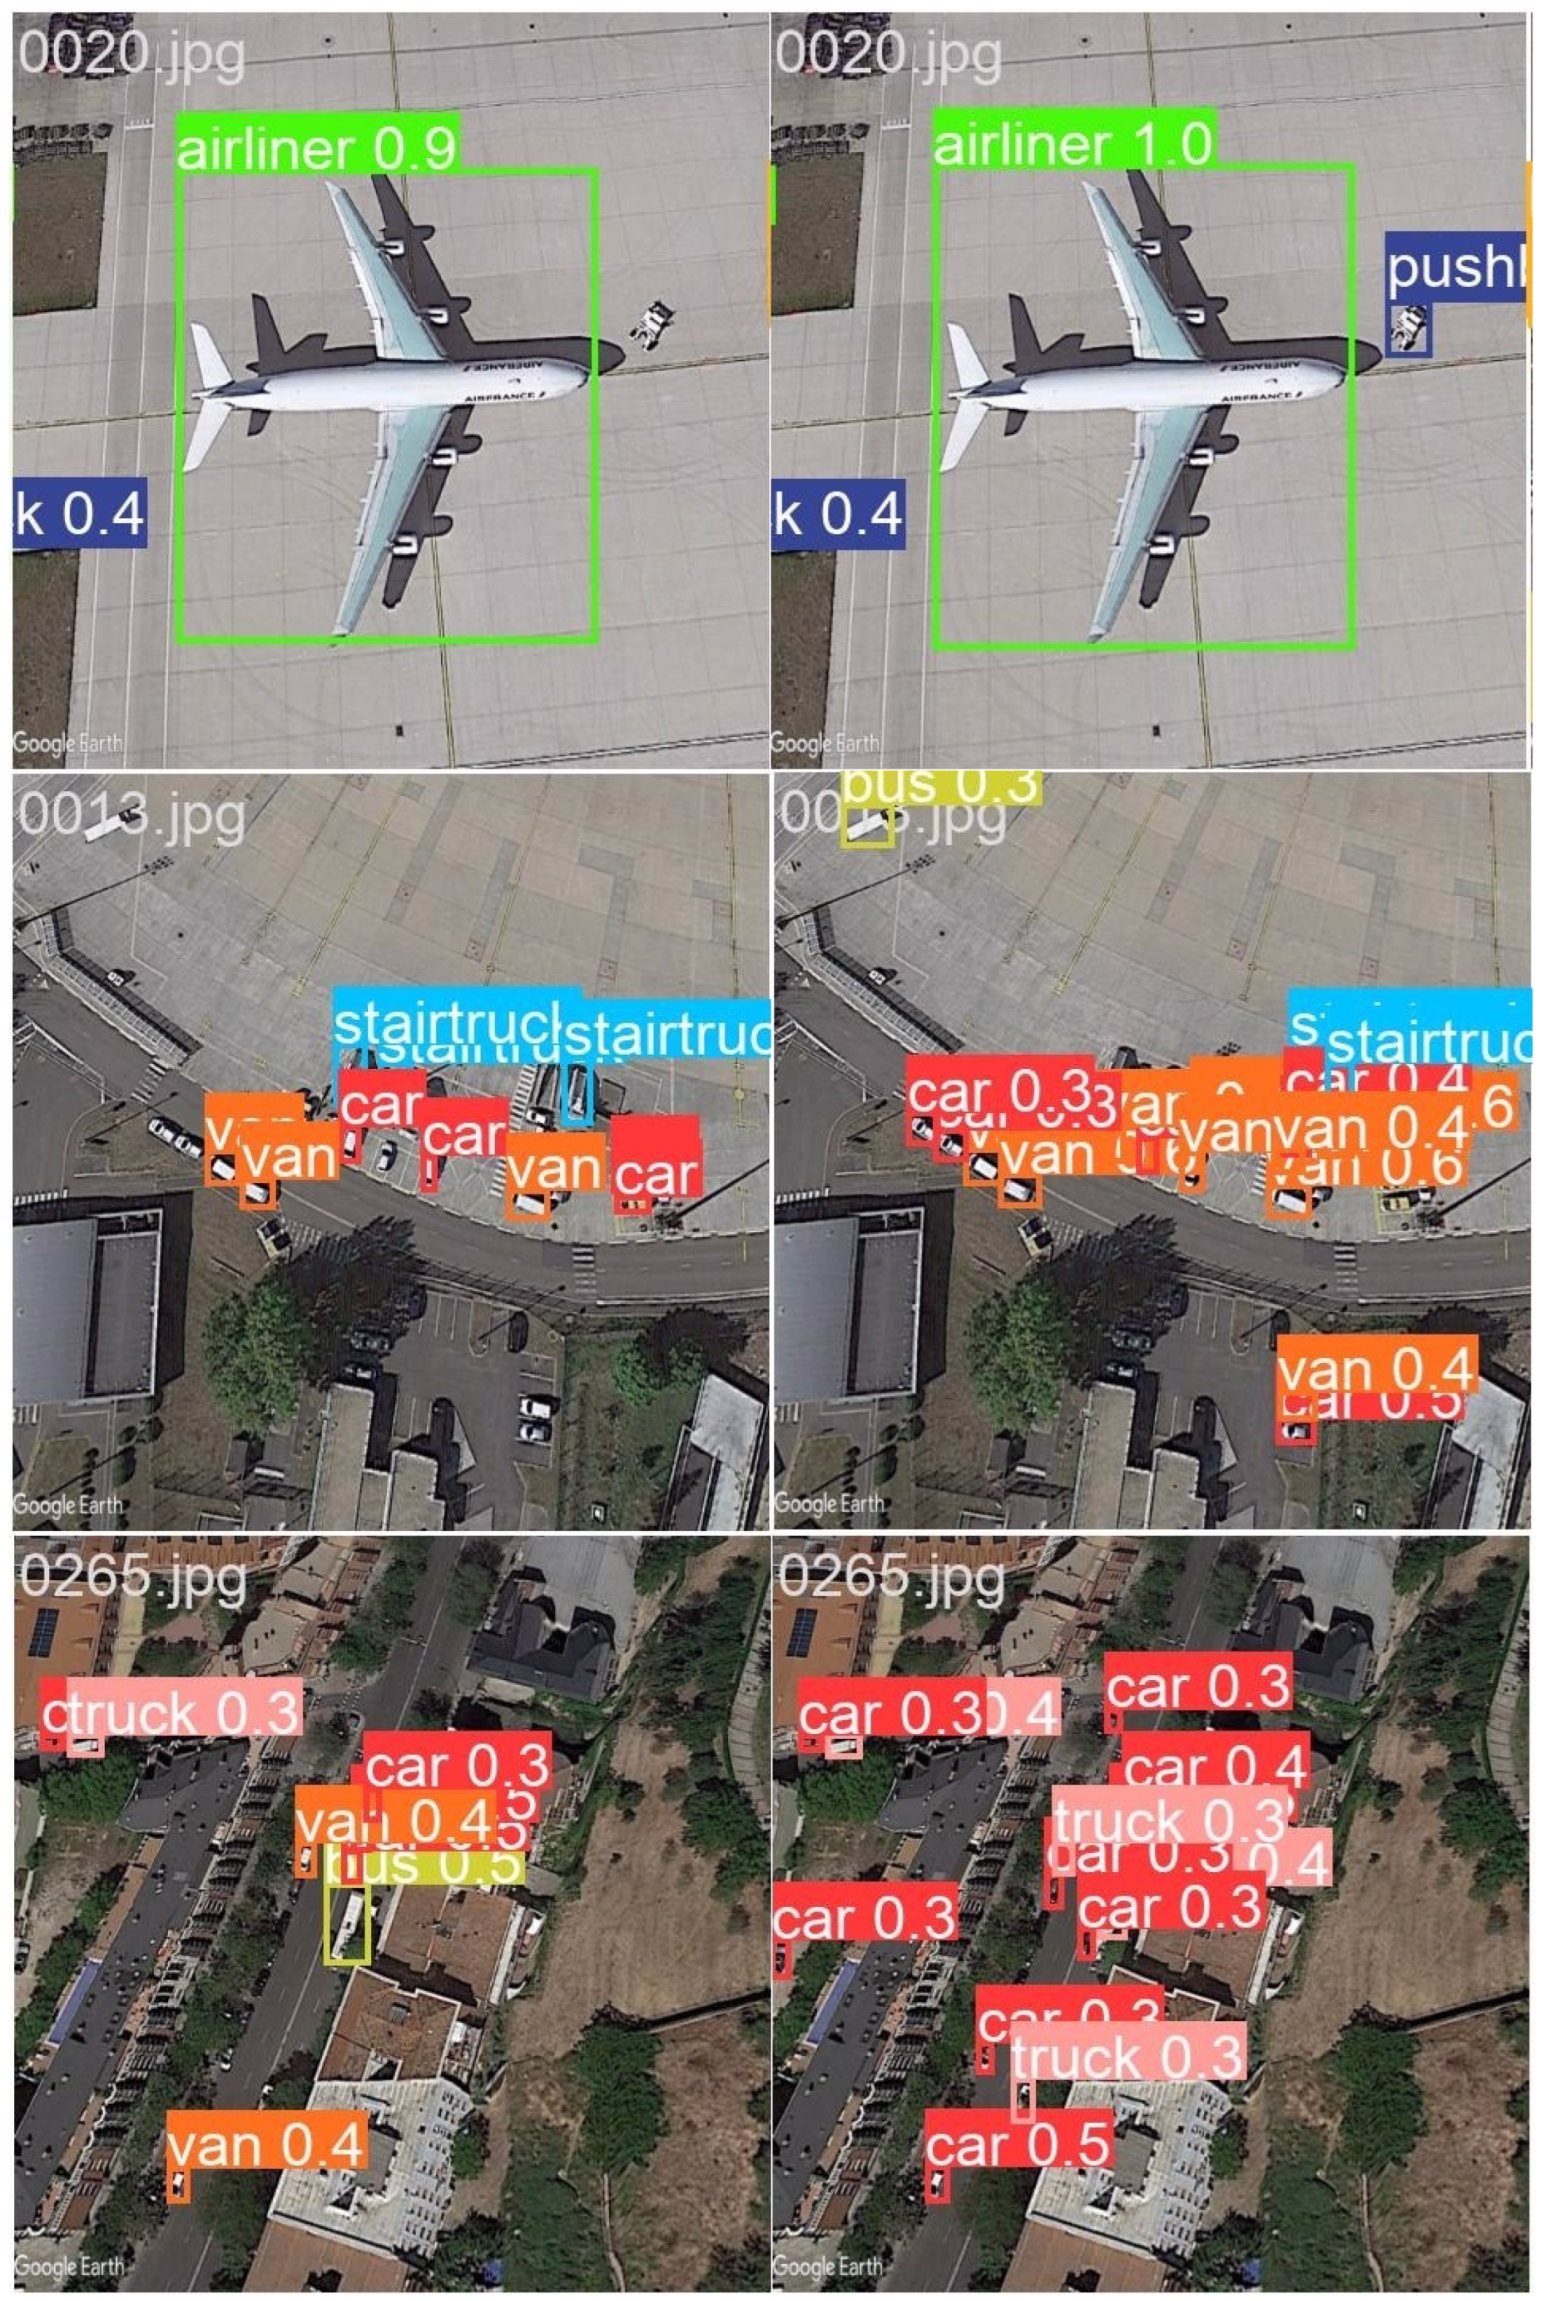
4.4.1. Experimental Results
4.4.2. Comparison Experiments with Other Models
4.5. Experiments on the TGRS-HRRSD Dataset
4.5.1. Experimental Results
4.5.2. Comparison Experiments with Other Models
4.6. Ablation Study
5. Conclusions
Author Contributions
Funding
Institutional Review Board Statement
Informed Consent Statement
Data Availability Statement
Acknowledgments
Conflicts of Interest
References
- Lv, J.; Zhu, D.; Geng, Z.; Han, S.; Wang, Y.; Yang, W.; Ye, Z.; Zhou, T. Recognition of deformation military targets in the complex scenes via MiniSAR submeter images with FASAR-Net. IEEE Trans. Geosci. Remote Sens. 2023, 61, 1–19. [Google Scholar] [CrossRef]
- Moniruzzaman, M.; Islam, S.M.S.; Bennamoun, M.; Lavery, P. Deep learning on underwater marine object detection: A survey. In Proceedings of the Advanced Concepts for Intelligent Vision Systems: 18th International Conference, ACIVS 2017, Antwerp, Belgium, 18–21 September 2017; Proceedings 18. Springer: Berlin/Heidelberg, Germany, 2017; pp. 150–160. [Google Scholar]
- Zhang, K.; Ming, D.; Du, S.; Xu, L.; Ling, X.; Zeng, B.; Lv, X. Distance Weight-Graph Attention Model-Based High-Resolution Remote Sensing Urban Functional Zone Identification. IEEE Trans. Geosci. Remote. Sens. 2022, 60, 1–18. [Google Scholar] [CrossRef]
- Li, K.; Wan, G.; Cheng, G.; Meng, L.; Han, J. Object detection in optical remote sensing images: A survey and a new benchmark. ISPRS J. Photogramm. Remote Sens. 2020, 159, 296–307. [Google Scholar] [CrossRef]
- Wang, Z.; Bovik, A.C.; Sheikh, H.R.; Simoncelli, E.P. Image quality assessment: From error visibility to structural similarity. IEEE Trans. Image Process. 2004, 13, 600–612. [Google Scholar] [CrossRef]
- Wu, W. Quantized gromov–hausdorff distance. J. Funct. Anal. 2006, 238, 58–98. [Google Scholar] [CrossRef]
- Sedaghat, A.; Ebadi, H. Remote sensing image matching based on adaptive binning SIFT descriptor. IEEE Trans. Geosci. Remote Sens. 2015, 53, 5283–5293. [Google Scholar] [CrossRef]
- Gao, C.; Li, W.; Tao, R.; Du, Q. MS-HLMO: Multiscale histogram of local main orientation for remote sensing image registration. IEEE Trans. Geosci. Remote Sens. 2022, 60, 1–14. [Google Scholar] [CrossRef]
- Krizhevsky, A.; Sutskever, I.; Hinton, G.E. Imagenet classification with deep convolutional neural networks. Adv. Neural Inf. Process. Syst. 2012, 25, 1097–1105. [Google Scholar] [CrossRef]
- Redmon, J.; Divvala, S.; Girshick, R.; Farhadi, A. You only look once: Unified, real-time object detection. In Proceedings of the IEEE Conference on Computer Vision and Pattern Recognition, Las Vegas, NV, USA, 27–30 June 2016; pp. 779–788. [Google Scholar]
- Liu, W.; Anguelov, D.; Erhan, D.; Szegedy, C.; Reed, S.; Fu, C.Y.; Berg, A.C. Ssd: Single shot multibox detector. In Proceedings of the Computer Vision–ECCV 2016: 14th European Conference, Amsterdam, The Netherlands, 11–14 October 2016; Proceedings, Part I 14. Springer: Berlin/Heidelberg, Germany, 2016; pp. 21–37. [Google Scholar]
- Lin, T.Y.; Goyal, P.; Girshick, R.; He, K.; Dollár, P. Focal loss for dense object detection. In Proceedings of the IEEE International Conference on Computer Vision, Venice, Italy, 22–29 October 2017; pp. 2980–2988. [Google Scholar]
- Law, H.; Deng, J. Cornernet: Detecting objects as paired keypoints. In Proceedings of the European Conference on Computer Vision (ECCV), Munich, Germany, 8–14 September 2018; pp. 734–750. [Google Scholar]
- Zhou, X.; Wang, D.; Krähenbühl, P. Objects as points. arXiv 2019, arXiv:1904.07850. [Google Scholar]
- Ge, Z. Yolox: Exceeding yolo series in 2021. arXiv 2021, arXiv:2107.08430. [Google Scholar]
- Tian, Z.; Chu, X.; Wang, X.; Wei, X.; Shen, C. Fully convolutional one-stage 3d object detection on lidar range images. Adv. Neural Inf. Process. Syst. 2022, 35, 34899–34911. [Google Scholar]
- Girshick, R.; Donahue, J.; Darrell, T.; Malik, J. Rich feature hierarchies for accurate object detection and semantic segmentation. In Proceedings of the IEEE Conference on Computer Vision and Pattern Recognition, Columbus, OH, USA, 23–28 June 2014; pp. 580–587. [Google Scholar]
- Girshick, R. Fast r-cnn. arXiv 2015, arXiv:1504.08083. [Google Scholar]
- Ren, S.; He, K.; Girshick, R.; Sun, J. Faster R-CNN: Towards real-time object detection with region proposal networks. IEEE Trans. Pattern Anal. Mach. Intell. 2016, 39, 1137–1149. [Google Scholar] [CrossRef] [PubMed]
- Carion, N.; Massa, F.; Synnaeve, G.; Usunier, N.; Kirillov, A.; Zagoruyko, S. End-to-end object detection with transformers. In Proceedings of the European Conference on Computer Vision, Glasgow, UK, 23–28 August 2020; Springer: Berlin/Heidelberg, Germany, 2020; pp. 213–229. [Google Scholar]
- Zhu, X.; Su, W.; Lu, L.; Li, B.; Wang, X.; Dai, J. Deformable detr: Deformable transformers for end-to-end object detection. arXiv 2020, arXiv:2010.04159. [Google Scholar]
- Meng, D.; Chen, X.; Fan, Z.; Zeng, G.; Li, H.; Yuan, Y.; Sun, L.; Wang, J. Conditional detr for fast training convergence. In Proceedings of the IEEE/CVF International Conference on Computer Vision, Montreal, BC, Canada, 11–17 October 2021; pp. 3651–3660. [Google Scholar]
- Zhang, H.; Li, F.; Liu, S.; Zhang, L.; Su, H.; Zhu, J.; Ni, L.M.; Shum, H.Y. Dino: Detr with improved denoising anchor boxes for end-to-end object detection. arXiv 2022, arXiv:2203.03605. [Google Scholar]
- Zhao, Y.; Lv, W.; Xu, S.; Wei, J.; Wang, G.; Dang, Q.; Liu, Y.; Chen, J. Detrs beat yolos on real-time object detection. In Proceedings of the IEEE/CVF Conference on Computer Vision and Pattern Recognition, Seattle, WA, USA, 16–22 June 2024; pp. 16965–16974. [Google Scholar]
- Shivappriya, S.; Priyadarsini, M.J.P.; Stateczny, A.; Puttamadappa, C.; Parameshachari, B. Cascade object detection and remote sensing object detection method based on trainable activation function. Remote Sens. 2021, 13, 200. [Google Scholar] [CrossRef]
- Ma, W.; Li, N.; Zhu, H.; Jiao, L.; Tang, X.; Guo, Y.; Hou, B. Feature split–merge–enhancement network for remote sensing object detection. IEEE Trans. Geosci. Remote Sens. 2022, 60, 1–17. [Google Scholar] [CrossRef]
- Li, Y.; Hou, Q.; Zheng, Z.; Cheng, M.M.; Yang, J.; Li, X. Large selective kernel network for remote sensing object detection. In Proceedings of the IEEE/CVF International Conference on Computer Vision, Paris, France, 1–6 October 2023; pp. 16794–16805. [Google Scholar]
- Lu, X.; Ji, J.; Xing, Z.; Miao, Q. Attention and feature fusion SSD for remote sensing object detection. IEEE Trans. Instrum. Meas. 2021, 70, 1–9. [Google Scholar] [CrossRef]
- Liu, E.; Zheng, Y.; Pan, B.; Xu, X.; Shi, Z. DCL-Net: Augmenting the capability of classification and localization for remote sensing object detection. IEEE Trans. Geosci. Remote Sens. 2021, 59, 7933–7944. [Google Scholar] [CrossRef]
- Li, Y.; Kong, C.; Dai, L.; Chen, X. Single-stage detector with dual feature alignment for remote sensing object detection. IEEE Geosci. Remote Sens. Lett. 2021, 19, 1–5. [Google Scholar] [CrossRef]
- Xu, X.; Feng, Z.; Cao, C.; Li, M.; Wu, J.; Wu, Z.; Shang, Y.; Ye, S. An improved swin transformer-based model for remote sensing object detection and instance segmentation. Remote Sens. 2021, 13, 4779. [Google Scholar] [CrossRef]
- Liu, Z.; Lin, Y.; Cao, Y.; Hu, H.; Wei, Y.; Zhang, Z.; Lin, S.; Guo, B. Swin transformer: Hierarchical vision transformer using shifted windows. In Proceedings of the IEEE/CVF International Conference on Computer Vision, Montreal, BC, Canada, 11–17 October 2021; pp. 10012–10022. [Google Scholar]
- Li, Q.; Chen, Y.; Zeng, Y. Transformer with transfer CNN for remote-sensing-image object detection. Remote Sens. 2022, 14, 984. [Google Scholar] [CrossRef]
- Dai, L.; Liu, H.; Tang, H.; Wu, Z.; Song, P. Ao2-detr: Arbitrary-oriented object detection transformer. IEEE Trans. Circuits Syst. Video Technol. 2022, 33, 2342–2356. [Google Scholar] [CrossRef]
- Cheng, G.; Li, Q.; Wang, G.; Xie, X.; Min, L.; Han, J. SFRNet: Fine-grained oriented object recognition via separate feature refinement. IEEE Trans. Geosci. Remote Sens. 2023, 61, 1–10. [Google Scholar] [CrossRef]
- Liu, X.; Peng, H.; Zheng, N.; Yang, Y.; Hu, H.; Yuan, Y. Efficientvit: Memory efficient vision transformer with cascaded group attention. In Proceedings of the IEEE/CVF Conference on Computer Vision and Pattern Recognition, Vancouver, BC, Canada, 17–24 June 2023; pp. 14420–14430. [Google Scholar]
- Tan, M.; Pang, R.; Le, Q.V. Efficientdet: Scalable and efficient object detection. In Proceedings of the IEEE/CVF Conference on Computer Vision and Pattern Recognition, Seattle, WA, USA, 13–19 June 2020; pp. 10781–10790. [Google Scholar]
- Liu, W.; Lu, H.; Fu, H.; Cao, Z. Learning to upsample by learning to sample. In Proceedings of the IEEE/CVF International Conference on Computer Vision, Paris, France, 1–6 October 2023; pp. 6027–6037. [Google Scholar]
- Rezatofighi, H.; Tsoi, N.; Gwak, J.; Sadeghian, A.; Reid, I.; Savarese, S. Generalized intersection over union: A metric and a loss for bounding box regression. In Proceedings of the IEEE/CVF Conference on Computer Vision and Pattern Recognition, Long Beach, CA, USA, 15–20 June 2019; pp. 658–666. [Google Scholar]
- Zhang, H.; Zhang, S. Focaler-IoU: More Focused Intersection over Union Loss. arXiv 2024, arXiv:2401.10525. [Google Scholar]
- Zhang, Y.; Yuan, Y.; Feng, Y.; Lu, X. Hierarchical and robust convolutional neural network for very high-resolution remote sensing object detection. IEEE Trans. Geosci. Remote Sens. 2019, 57, 5535–5548. [Google Scholar] [CrossRef]
- Haroon, M.; Shahzad, M.; Fraz, M.M. Multisized object detection using spaceborne optical imagery. IEEE J. Sel. Top. Appl. Earth Obs. Remote Sens. 2020, 13, 3032–3046. [Google Scholar] [CrossRef]
- Liu, S.; Li, F.; Zhang, H.; Yang, X.; Qi, X.; Su, H.; Zhu, J.; Zhang, L. Dab-detr: Dynamic anchor boxes are better queries for detr. arXiv 2022, arXiv:2201.12329. [Google Scholar]
- Li, F.; Zhang, H.; Liu, S.; Guo, J.; Ni, L.M.; Zhang, L. Dn-detr: Accelerate detr training by introducing query denoising. In Proceedings of the IEEE/CVF Conference on Computer Vision and Pattern Recognition, New Orleans, LA, USA, 18–24 June 2022; pp. 13619–13627. [Google Scholar]


| Class | P (%) | R (%) | mAP50 (%) | mAP (%) |
|---|---|---|---|---|
| all | 77.8 | 78.4 | 78.2 | 63.1 |
| car | 78 | 93.4 | 92.3 | 72.5 |
| truck | 78.5 | 77.4 | 77.2 | 63.1 |
| van | 77.3 | 80.4 | 78.1 | 63.2 |
| longvehicle | 68.6 | 83.3 | 79.4 | 65.6 |
| bus | 79.5 | 87.9 | 88.1 | 72.3 |
| airliner | 90.9 | 95.2 | 96.6 | 87.1 |
| propeller aircraft | 90.8 | 93.9 | 92.4 | 80.2 |
| trainer aircraft | 87.9 | 98.2 | 96.2 | 80.2 |
| chartered aircraft | 81.9 | 96.2 | 93.8 | 81.5 |
| fighter aircraft | 69 | 100 | 96.7 | 86 |
| other | 54 | 29.5 | 30.7 | 24.2 |
| stair truck | 59 | 50.8 | 49.2 | 33.6 |
| pushback truck | 69.5 | 38.6 | 50.1 | 36 |
| helicopter | 95.4 | 53.8 | 54.9 | 23.3 |
| boat | 87.3 | 97.4 | 97.3 | 78.3 |
| Model | Backbone | FLOPs (G) | Params (M) | mAP50 (%) | mAP (%) |
|---|---|---|---|---|---|
| Faster R-CNN | ResNet50 | 180 | 42 | 74.4 | 60.4 |
| DETR | ResNet50 | 86 | 41 | 73.4 | 58.6 |
| Deformable DETR | ResNet50 | 173 | 40 | 75.2 | 60.4 |
| Conditional DETR | ResNet50 | 90 | 44 | 74.0 | 60.1 |
| DAB-DETR | ResNet50 | 202 | 44 | 75.0 | 55.9 |
| DN-DETR | ResNet50 | 94 | 44 | 74.7 | 60.3 |
| DINO-4scale | ResNet50 | 279 | 47 | 74.8 | 60.3 |
| RT-DETR | ResNet18 | 60 | 20 | 76.2 | 62.0 |
| RS-DETR (ours) | ResNet18 | 53.3 | 17.5 | 78.2 | 63.1 |
| Class | P (%) | R (%) | mAP50 (%) | mAP (%) |
|---|---|---|---|---|
| all | 90.4 | 86.3 | 91.6 | 65.4 |
| ship | 93.2 | 89.6 | 94.5 | 76.5 |
| bridge | 94.2 | 88.2 | 92.3 | 50.9 |
| ground track field | 92.8 | 97.1 | 98.4 | 83.2 |
| storage tank | 93.1 | 92.4 | 96.7 | 76.7 |
| basketball court | 90 | 67.1 | 79.9 | 54.4 |
| tennis court | 94.4 | 92.5 | 96.6 | 83.1 |
| airplane | 98.7 | 96.3 | 98.4 | 72.9 |
| baseball diamond | 89 | 87.6 | 91.8 | 66.8 |
| harbor | 91 | 88.9 | 93.2 | 70.9 |
| vehicle | 94.5 | 82.3 | 94.2 | 67.1 |
| crossroad | 88.3 | 93.5 | 92.4 | 53.6 |
| T junction | 82.6 | 80.3 | 84.9 | 44.4 |
| parking lot | 73.5 | 66.5 | 71.7 | 46.1 |
| Model | Backbone | FLOPs (G) | Params (M) | mAP50 (%) | mAP (%) |
|---|---|---|---|---|---|
| Faster R-CNN | ResNet50 | 180 | 42 | 88.4 | 59.1 |
| DETR | ResNet50 | 86 | 41 | 89.5 | 61.2 |
| Deformable DETR | ResNet50 | 173 | 40 | 89.9 | 60.4 |
| Conditional DETR | ResNet50 | 90 | 44 | 90.6 | 64.2 |
| DAB-DETR | ResNet50 | 202 | 44 | 91.5 | 62.5 |
| DN-DETR | ResNet50 | 94 | 44 | 91.1 | 61.3 |
| DINO | ResNet50 | 279 | 47 | 91.8 | 64.2 |
| RT-DETR | ResNet18 | 60 | 20 | 90.1 | 64.6 |
| RS-DETR (ours) | ResNet18 | 53.3 | 17.5 | 91.6 | 65.4 |
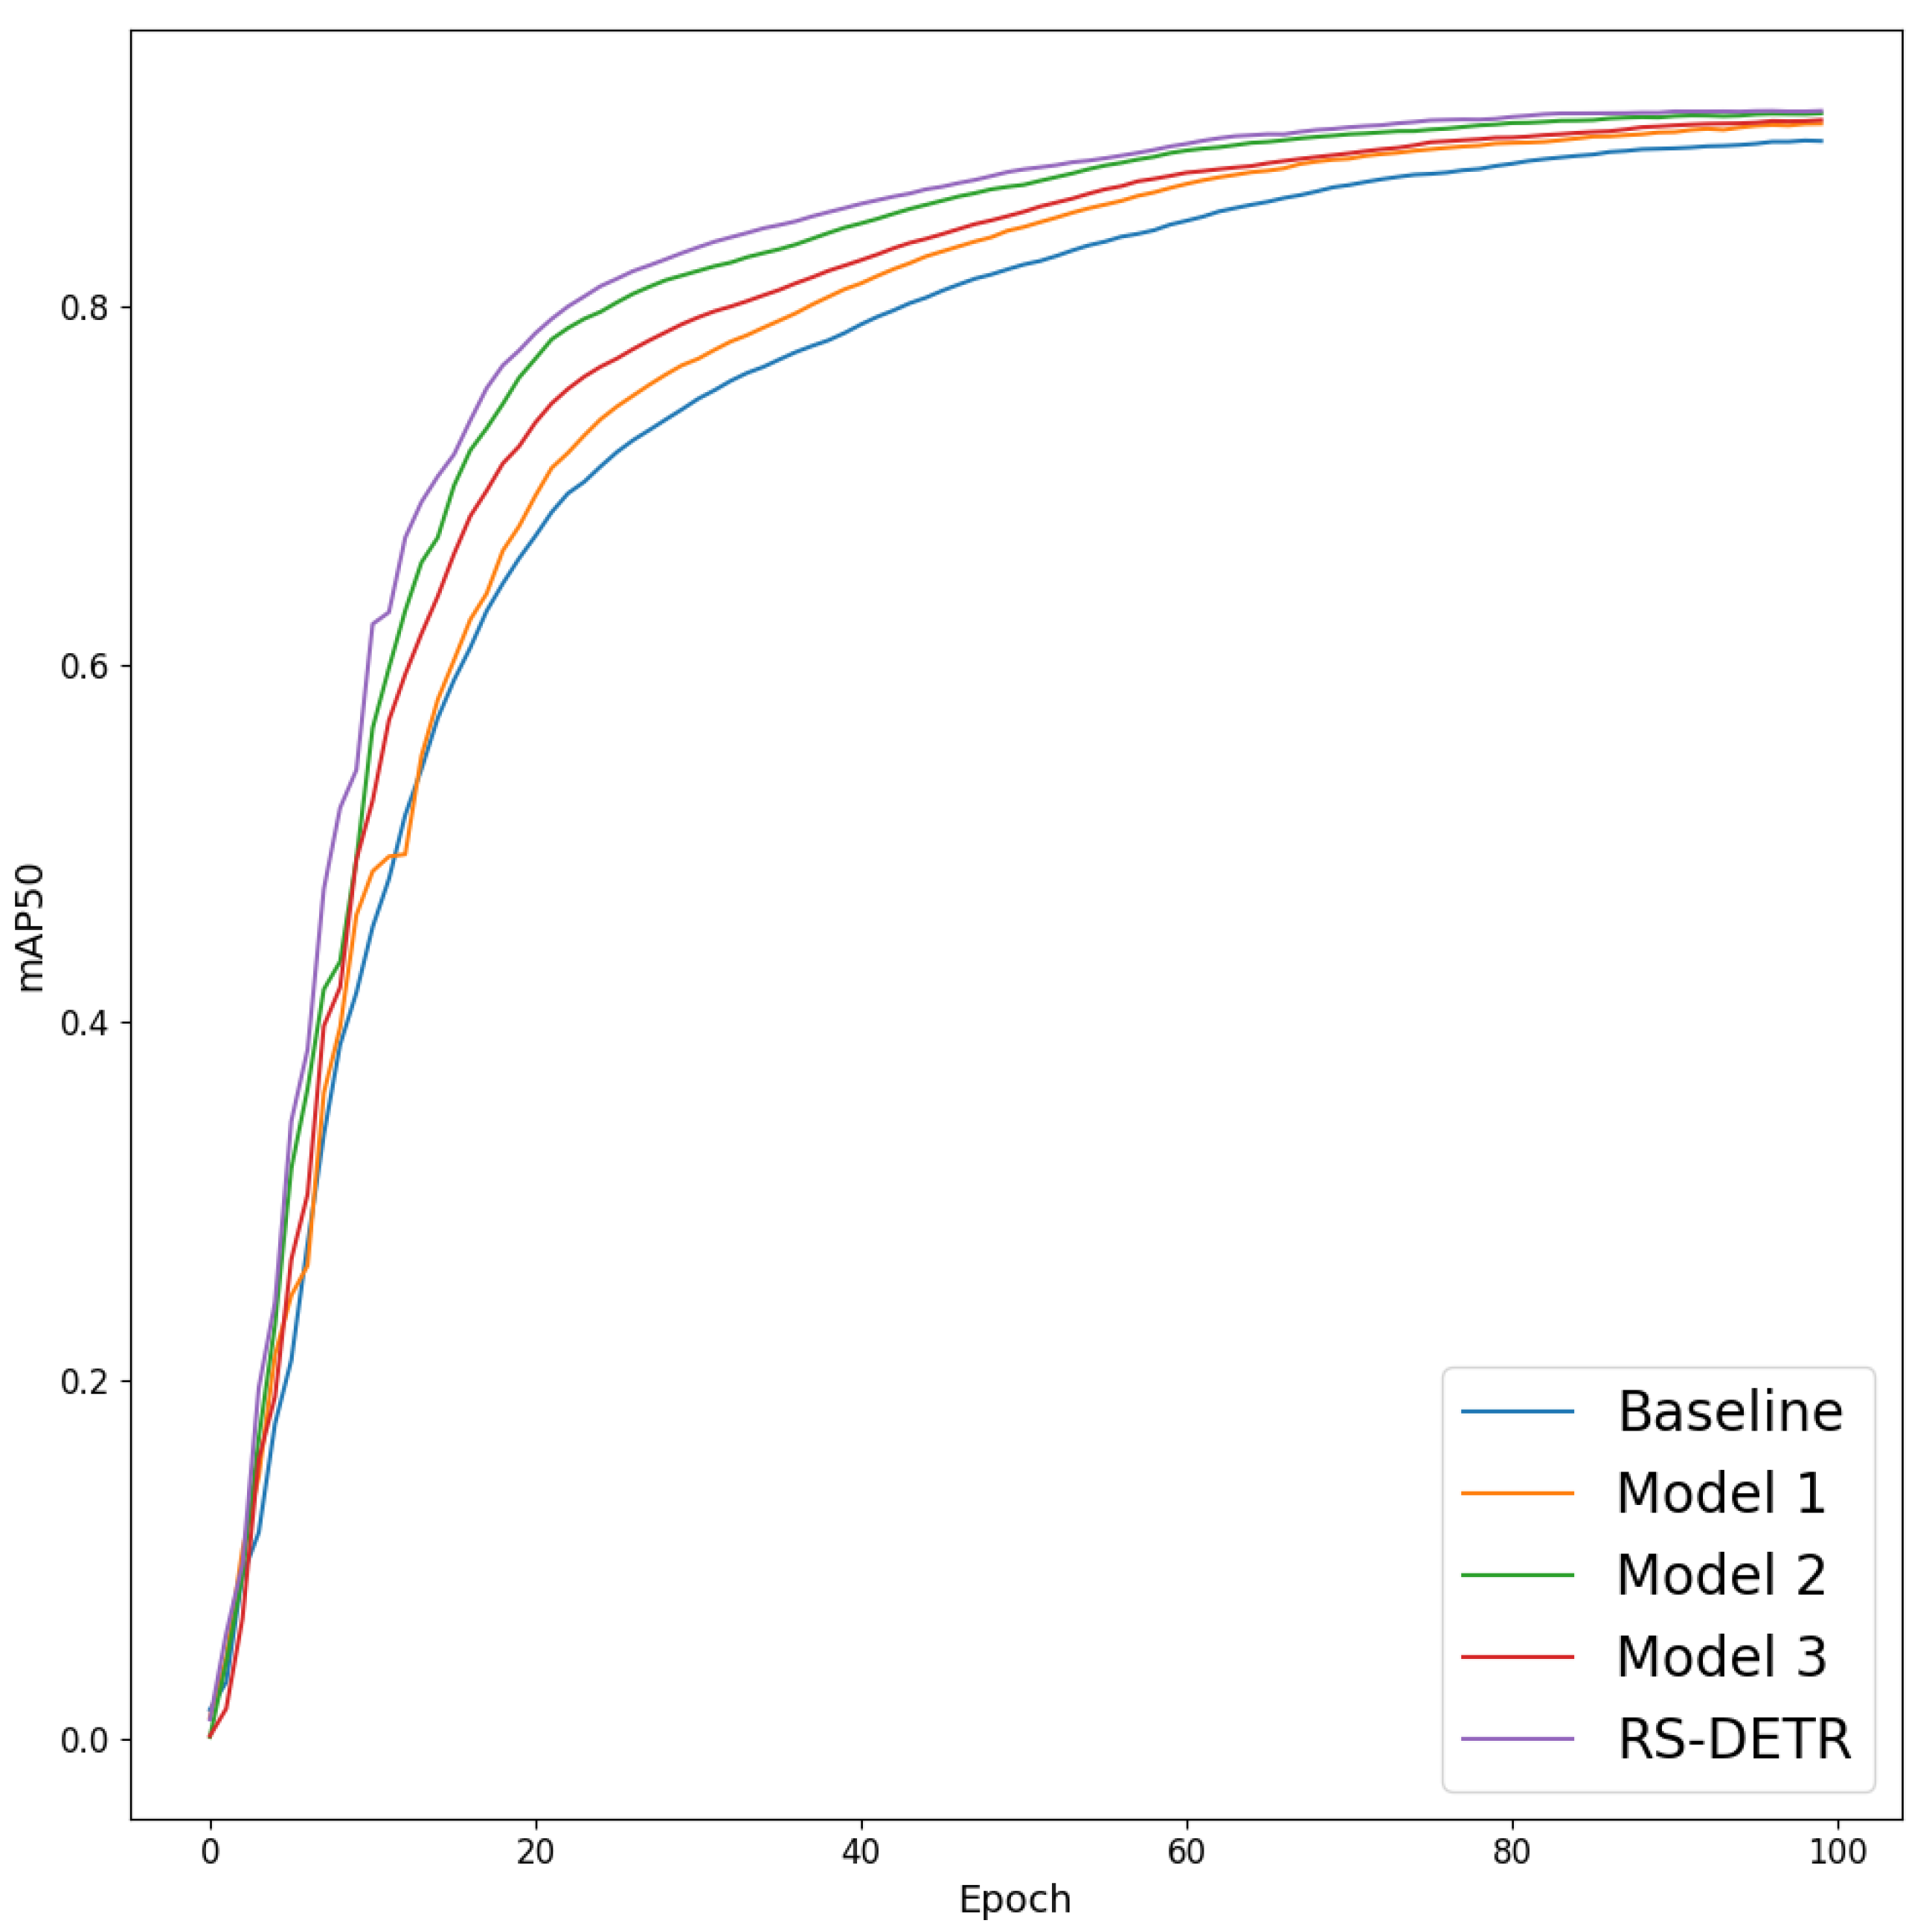
| Model | CGA | EBiFPN | Focaler-GIoU | P (%) | R (%) | mAP50 (%) | mAP (%) |
|---|---|---|---|---|---|---|---|
| Baseline | 89.2 | 85.6 | 90.1 | 64.6 | |||
| Model 1 | ✓ | 90.1 | 85.5 | 90.6 | 64.2 | ||
| Model 2 | ✓ | 90.0 | 87.3 | 90.7 | 64.9 | ||
| Model 3 | ✓ | ✓ | 89.5 | 86.1 | 90.9 | 64.5 | |
| RS-DETR (ours) | ✓ | ✓ | ✓ | 90.4 | 86.3 | 91.6 | 65.4 |
Disclaimer/Publisher’s Note: The statements, opinions and data contained in all publications are solely those of the individual author(s) and contributor(s) and not of MDPI and/or the editor(s). MDPI and/or the editor(s) disclaim responsibility for any injury to people or property resulting from any ideas, methods, instructions or products referred to in the content. |
© 2024 by the authors. Licensee MDPI, Basel, Switzerland. This article is an open access article distributed under the terms and conditions of the Creative Commons Attribution (CC BY) license (https://creativecommons.org/licenses/by/4.0/).
Share and Cite
Zhang, H.; Ma, Z.; Li, X. RS-DETR: An Improved Remote Sensing Object Detection Model Based on RT-DETR. Appl. Sci. 2024, 14, 10331. https://doi.org/10.3390/app142210331
Zhang H, Ma Z, Li X. RS-DETR: An Improved Remote Sensing Object Detection Model Based on RT-DETR. Applied Sciences. 2024; 14(22):10331. https://doi.org/10.3390/app142210331
Chicago/Turabian StyleZhang, Hao, Zheng Ma, and Xiang Li. 2024. "RS-DETR: An Improved Remote Sensing Object Detection Model Based on RT-DETR" Applied Sciences 14, no. 22: 10331. https://doi.org/10.3390/app142210331
APA StyleZhang, H., Ma, Z., & Li, X. (2024). RS-DETR: An Improved Remote Sensing Object Detection Model Based on RT-DETR. Applied Sciences, 14(22), 10331. https://doi.org/10.3390/app142210331