Abstract
As urbanization accelerates, the management of urban solid waste poses increasingly intricate challenges. Traditional urban metrics, such as GDP and per capita consumption rates, have become inadequate for accurately reflecting the realities of waste generation; moreover, the linear correlation between these metrics and waste production is progressively diminishing. Consequently, this study introduces a novel methodology leveraging nighttime light remote sensing data to enhance the precision of urban solid waste production forecasts. By processing remote sensing data to mitigate noise and integrating it with conventional urban datasets, an innovative index system and predictive model were developed. Using Beijing as a case study, the gradient boosting regression algorithm yielded a prediction accuracy of 92%. Furthermore, in light of the substantial costs associated with waste recovery route planning and site selection for treatment facilities, this research further devised a location and distribution framework for waste treatment centers based on high-precision predictions of waste production while employing multi-objective evolutionary algorithms (MOEAs) alongside the non-dominated sorting genetic algorithm II (NSGA-II) for optimization. Distinct from prior studies, this study suggests that service point waste quantities are not fixed values but rather adhere to a normal distribution within specified ranges and thus provides a more realistic simulation of fluctuations in waste production while enhancing both the robustness and predictive accuracy of the model. In conclusion, by incorporating nighttime light remote sensing data along with advanced machine learning techniques, this study markedly improves forecasting accuracy for waste production while offering effective optimization strategies for site selection and recovery route planning—thereby establishing a robust data foundation aimed at refining urban solid waste management systems.
1. Introduction
As the global economy undergoes rapid development and urbanization accelerates, urban population density has significantly increased, resulting in complex challenges associated with managing municipal solid waste (MSW) [1]. A central issue in this context is the uncertainty surrounding waste generation, which complicates effective vehicle routing and site selection for treatment facilities [2]. Accurately predicting waste generation is essential for achieving environmental protection and promoting sustainable social development [3].
This study specifically addresses inaccuracies in predictions of waste generation as well as limitations within existing optimization frameworks related to urban solid waste management. We introduce nighttime light remote sensing data as an innovative tool to enhance the accuracy of predictions regarding urban solid waste generation. By denoising this remote sensing data and integrating it with traditional urban datasets, we have developed a novel indicator system along with predictive models. Our application of gradient boosting regression algorithms has achieved a prediction accuracy rate of 92% within the context of Beijing.
Moreover, to address the high costs associated with recycling route planning and facility siting, we propose an optimization framework grounded in precise predictions of waste generation. The algorithms for solving multi-objective problems can be broadly categorized into two types: traditional optimization methods and heuristic evolutionary algorithms. Traditional optimization methods are mathematical programming techniques based on operations research theory, primarily including constraint programming and dynamic programming algorithms. These approaches address multi-objective problems by averaging multiple objectives and transforming them into lower-dimensional issues. However, this method often struggles to effectively balance the various objectives, making it challenging to achieve optimal solutions for multi-objective optimization problems. In contrast, heuristic evolutionary algorithms leverage evolutionary mechanisms to simulate the chromosomal crossover processes of biological organisms in order to search for optimal solutions. These algorithms are particularly effective in addressing high-complexity models, as they can simultaneously handle multiple objectives and identify a set of optimal solutions known as the Pareto front. In this study, we have selected classical multi-objective evolutionary algorithms (MOEAs) and the non-dominated sorting genetic algorithm II (NSGA-II) for optimization purposes. These evolutionary algorithms are well-suited for complex multi-objective problems and provide robust performance in seeking balance and optimal solutions.
A distinctive feature of our research is the assumption that waste generation at service points is not a fixed value but rather follows a normal distribution within specified ranges. This perspective facilitates a more realistic representation of fluctuations in waste production, thereby enhancing both the robustness and predictive accuracy of our model. A case study conducted in Chaoyang District illustrates that, despite a declining population, total household waste continues to rise, highlighting the complexity and variability inherent in effective waste management practices.
In summary, this research not only contributes to optimizing Beijing’s municipal solid waste (MSW) management system but also provides valuable insights for other developed cities by offering innovative strategies for site selection and route optimization. The structure of this paper is organized as follows: the second section reviews the relevant literature; the third section details the methodologies employed along with data sources; the fourth section presents research findings.
2. Related Work
Current waste management practices often prioritize minimizing economic costs while overlooking social and environmental considerations. However, with the growing public awareness of environmental issues and the implementation of policy initiatives, green objectives—particularly the reduction in vehicle carbon emissions—have become critical in planning waste management systems [4,5,6,7,8,9].
The demand for municipal waste management can be summarized as the prediction of municipal domestic waste production needs to consider a variety of factors, which is due to the more complex and heterogeneous process of municipal domestic waste disposal. Nowadays, the main research factors focus on three aspects: social indicators, economic indicators and demographic indicators, among which social indicators mainly include household education level [10] and urban greening coverage [11]; economic indicators include GDP, per capita GDP, per capita consumption expenditure, per capita disposable income, household income, residential consumption level, and total retail sales of social consumer goods [11,12]; and demographic indicators mainly include population size [13], population distribution [13], and overall education level [14]. In this paper, we collected a large number of relevant indicators in terms of traditional urban data indicators, and finally selected four indicators, namely, the number of people registered in the population, per capita disposable income, per capita consumption expenditure, and the number people of resident in the population, as influencing factors.
In recent years, significant progress has been made in the prediction of municipal solid waste (MSW) generation and the optimization of waste management systems. However, some shortcomings remain, particularly in addressing data complexity, prediction accuracy, and model robustness.
Firstly, earlier studies have relied mainly on traditional statistical methods, such as linear regression [14] and time series analysis [15]. For example, Singh et al. [16] used time series analysis to predict waste production in a major city in China, despite the simple and straightforward approach, whose model performed poorly in capturing nonlinear relationships of the data. When the urban structure is complicated, the traditional methods show obvious limitations in handling the heterogeneity of the data, which limits the prediction accuracy of the model [17,18]. Traditional statistical methods usually consider only a single data source (such as population density, economic activities, etc.), but ignore the timeliness of the urban dynamic changes.
Accurately predicting the generation of municipal solid waste (MSW) is essential for effective planning and management of waste disposal facilities, such as landfills. Previous studies have utilized various models to estimate MSW generation and optimize landfill areas. Hoque and Rahman [3] estimated landfill areas based on solid waste collection predictions using an artificial neural network (ANN) model and final waste disposal options. Their study highlighted the effectiveness of ANN models in forecasting waste generation and optimizing landfill space, providing a more accurate and dynamic approach compared to traditional methods. Moreover, the integration of remote sensing data has shown potential in enhancing the accuracy of MSW generation predictions. For example, Xi and William [19] tested the new VIIRS lights data set for estimating population and economic output in Africa. This work demonstrated that satellite-derived night light data could be a valuable proxy for understanding urbanization levels and economic activities, which are closely related to the generation of MSW. By incorporating such data into predictive models, researchers can better account for spatial and temporal variations in waste production, leading to improved planning and management strategies. With the continuous advancement of machine learning, recent studies have applied machine learning algorithms to waste yield prediction, thereby overcoming the limitations of traditional methods in handling data heterogeneity. Johnson et al. [20] discussed the generation patterns and prediction methods of domestic waste in New York City. The authors used a gradient boosting model to predict short-term waste generation in New York City, demonstrating the effectiveness of the GBM model for short-term waste prediction. Nguyen et al. [21] used six machine learning models to predict municipal household waste generation by selecting residential areas in Vietnam and found that the random forest and KNN algorithms had better predictive power for the training data, and the test data had R2 value exceeded 0.96. Kannangara et al. [22] conducted an empirical study of solid waste data from five Canadian provinces using a multi-layer perceptron (MLP) and support vector regression (SVR) machine learning approach to develop a predictive model for municipal solid waste management in Canada. Zhang et al. [23] used multiple indicators and three different models to predict China’s total future municipal waste, including population, urbanization rate, waste utilization rate, etc. The machine learning-based prediction model can effectively predict total future municipal waste in China with high prediction accuracy. Alidoust et al. [24] used algorithms including linear regression, decision trees, support vector machines, and artificial neural networks, as well as some feature selection techniques to improve the prediction accuracy. The above findings suggest that machine learning models can predict domestic waste production more accurately and can provide a better reference for waste treatment and management. Based on the aforementioned research, we have selected six of the most frequently utilized machine learning algorithms from previous studies as the modeling tools for this research.
The aforementioned studies have not considered remote sensing light data as a variable influencing waste generation in their predictive models. This oversight in effectively capturing the spatiotemporal dynamics of urban socio-economic activities has consequently diminished the accuracy of waste generation predictions across both spatial and temporal dimensions [19,25,26]. However, this research presents an innovative modeling approach that integrates machine learning algorithms with remote sensing light data to estimate waste production. The dual-objective model proposed by Zhao and Verter [27] performed well in optimizing costs and environmental risks. However, this study assumed that waste output was fixed and ignored the random volatility of waste output. Asefi et al. [28] considered multiple objectives in the LRP model, but still did not fully consider the volatility of waste output. Niu et al. [29] solved the random demand problem in vehicle path planning by using a multi-objective optimization algorithm, but the research was still not thorough enough in dealing with the volatility of garbage production. The green LRP model proposed by Okan-Ducanchi et al. [30] has made some contributions to optimizing the environmental impact of transportation and distribution, but these studies are mostly limited to fixed input data and lack adaptability to dynamic data.
This study significantly improves the prediction accuracy and the robustness of the model by introducing remote sensing data and considering the volatility of waste production, providing a more comprehensive, dynamic, and practical solution for waste management systems compared to previous studies. These innovations give this study important theoretical value and practical potential in the field of waste management system optimization.
3. Methods and Data Sources
We first summarized all the factors identified in previous studies associated with solid waste production and collected a variety of traditional urban data in Beijing. On this basis, we further introduced the night light remote sensing data, via the treatment of these data, to establish an index system to affect the production of waste. To determine the best predictive model, six machine learning algorithms were employed, including multiple linear regression, Bayesian ridge regression, elastic network regression, support vector regression, gradient boosted regression, and random forest algorithm. Based on this, we modeled the location and path planning issues of the waste disposal center as LRP models and selected two representative areas for case study. Using remote sensing technology, we have accurately located the service points and the pre-selected waste treatment centers in these areas. Then, the waste yield of each service point was predicted dynamically using the best performance regression model. Finally, we used the multi-objective optimization algorithms NSGA-II and MOEAs to solve the optimization problem and realized the comprehensive optimization of the location and route of the waste treatment center. Developed in the Python environment, this method provides a comprehensive solution that effectively balances multiple goals such as residential experience, economic cost, and environmental sustainability.
3.1. Impact Factor Selection
3.1.1. Traditional Indicators
Based on the summary of previous studies [31,32], this paper divides the indicators affecting domestic waste production into three parts: economic indicators, social indicators, and demographic indicators. The relevant data and indicators are organized as shown in Table 1:

Table 1.
Main factors affecting waste production.
After considering issues related to data availability and accuracy, we selected four indicators—household population per capita, disposable income per capita, consumption expenditure per capita, and population density—as being representative of spatial data. These indicators are not only directly related to waste generation but also effectively reflect economic and demographic conditions, providing a reliable basis for analysis. Furthermore, these indicators are relatively easy to obtain with high reliability, which helps simplify model complexity while enhancing predictive accuracy and interpretability.
While social indicators may play a role in waste management, we contend that economic and demographic metrics can more effectively elucidate changes in waste production levels. This assertion stems from their easier data accessibility coupled with higher reliability, thus offering a robust foundation for our analysis. Future research could consider incorporating social metrics into models to enrich predictions concerning waste generation.
3.1.2. Remote Sensing Indicators
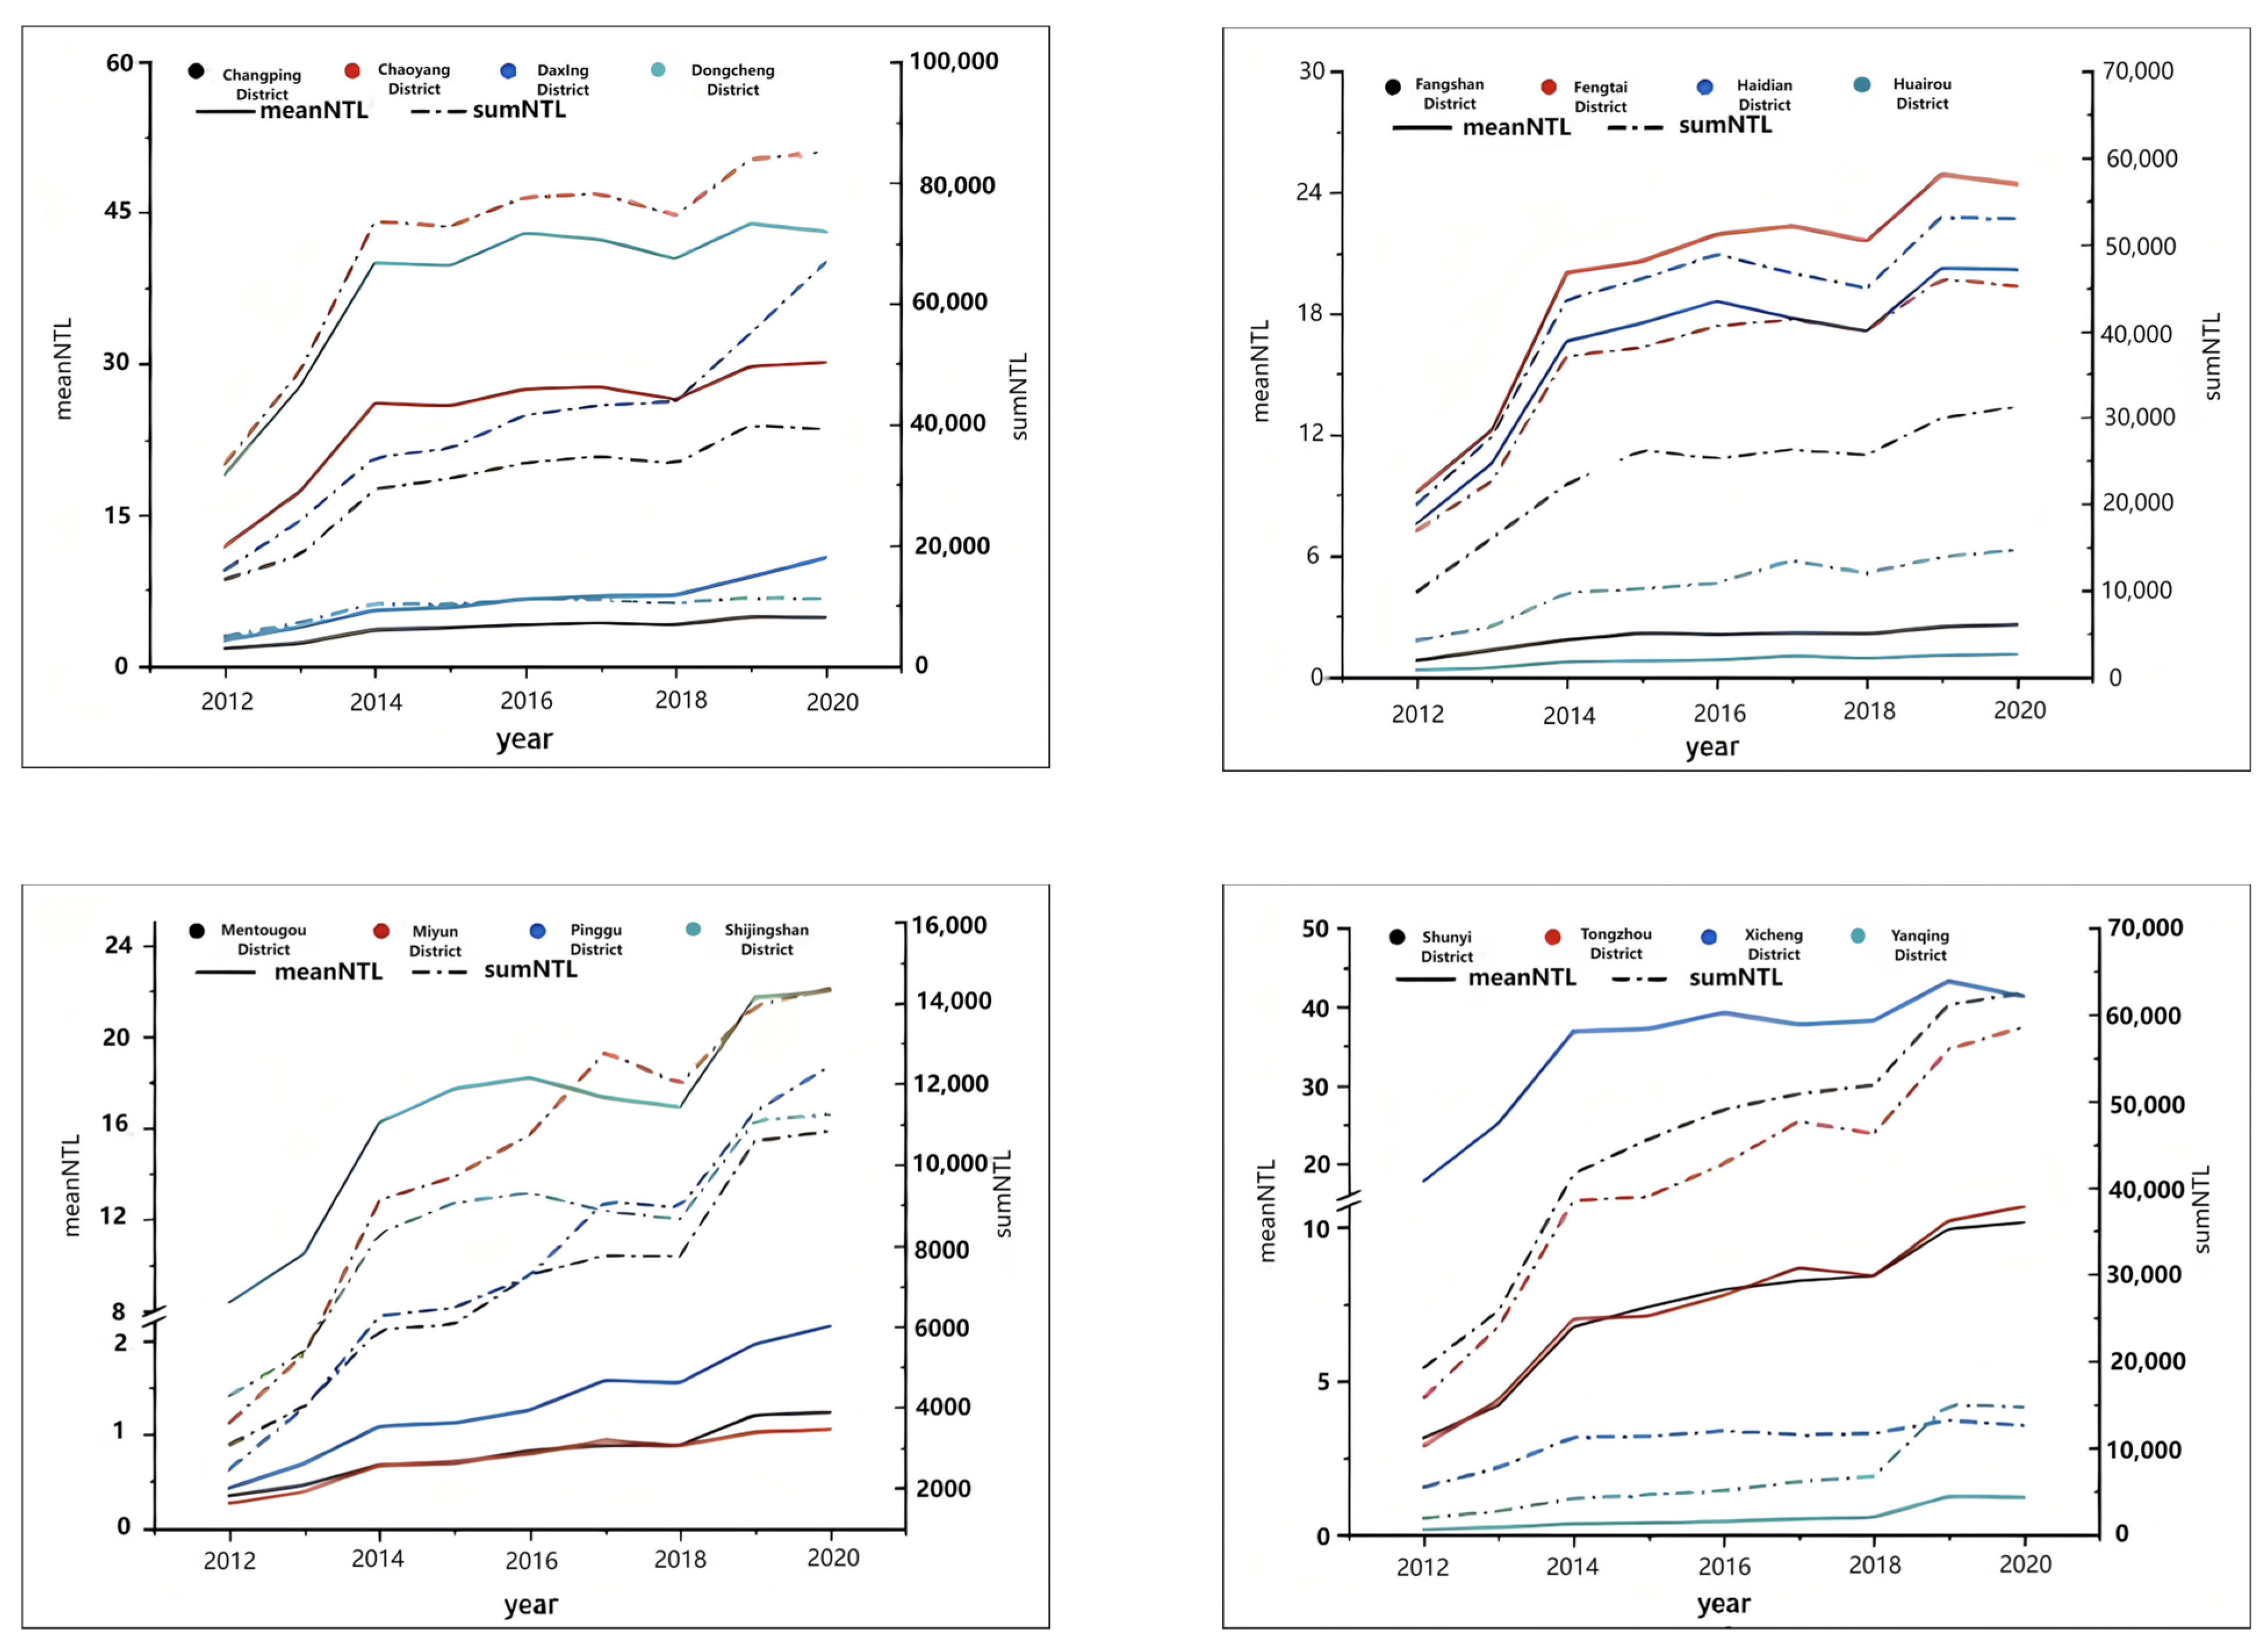
This study utilizes NPP/VIIRS nighttime light data as remote sensing information, sourced from the NPP system established by NASA. This system effectively eliminates transient brightness caused by factors such as fires and explosions, retaining only relatively stable lighting. Furthermore, the data employed are all cloud free, allowing for a more accurate reflection of population distribution and economic development. For this research, we have collected and processed monthly and annual average NPP/VIIRS data collected since 2012. During this process, we first excluded certain special areas (such as the National Grand Theatre and major airports in Beijing) that consistently exhibited high brightness anomalies to minimize errors. The brightness values of these excluded regions were replaced with the average values from other pixels within those areas. Subsequently, we extracted and processed the illumination intensity for each pixel. Figure 1 shows the changes in lighting data for each district in Beijing since 2012. The meanNTL in the figure indicates the average lighting brightness value of the area, and the sumNTL indicates the total lighting brightness value. From the figure, it can be seen that several districts in Beijing, such as Chaoyang District, Dongcheng District, Xicheng District, and Haidian District, where development has just started, and Tongzhou District, Shijingshan District, etc., where nighttime lighting data has been on a sharp upward trend in the past two years, the light brightness value of each district is overall constantly increasing. However, under the influence of the COVID-19 pandemic in 2019, the rising trend of nighttime lighting data slowed down from 2019 to 2020, with some districts showing a decline. Considering the contribution of district area factors to municipal waste production, sumNTL was chosen as a key influencing factor.

Figure 1.
Changes in nighttime lighting brightness in Beijing districts (2012–2020).
3.2. Regression Model Building and Testing
3.2.1. Construction of Machine Learning Regression Models
The regression model indicators are derived from economic and demographic aspects. Five factors—sumNTL, registered population (in ten thousand), per capita disposable income, per capita consumption expenditure, and resident population—were selected to construct the influencing factor system of the regression model. Precise data from 2012 to 2020 across 16 administrative districts in Beijing were collected, totaling 144 entries. Subsequently, a ten-fold cross-validation method was employed; this is a commonly used machine learning model evaluation technique that divides the original dataset into ten subsets. Nine subsets are utilized for training the model while one subset is reserved for testing it. This process is repeated ten times with each subset serving as the test set once; the average result of these ten iterations serves as the final evaluation outcome.
The advantages of this method include:
- Maximizing data utilization: By employing the entire dataset for model evaluation, maximum utilization of data can be achieved, leading to more reliable assessment results.
- Reducing evaluation error: Via repeated testing and averaging results, ten-fold cross-validation minimizes evaluation errors and yields more precise assessment outcomes.
- Assessing model generalization ability: Ten-fold cross-validation allows for an examination of a model’s generalization ability—that is, its performance on unseen data. Testing different data subsets provides a comprehensive evaluation of model performance.
- Avoiding overfitting: This approach helps mitigate overfitting issues where models perform well on training sets but poorly on test sets by evaluating them across various subsets.
Furthermore, this study conducted tuning work on various characteristics of each model (such as hyperparameters like decision tree count and classification status in random forests). These parameters significantly influence the accuracy of model operation; thorough tuning efforts yielded favorable results in predicting waste generation volumes.
3.2.2. Performance of Prediction Model
There are a series of evaluation indicators for regression models, mainly from two aspects: On the one hand are the traditional error indicators, which can effectively detect the error value between the current model prediction results and the real results, among which are mean absolute error (MAE), mean absolute percentage error (MAPE), and root mean squared error (MSE). On the other hand is the overall evaluation of the model’s overall fitting effect and explanatory ability, which is called R2, ranging from 0 to 1, indicating the percentage of variation in the outcome variables that can be explained by the predictor variables, i.e., the square of the correlation coefficient; the higher the value means the better the effect of the model, and the formula for them is explained below:
where is the number of data sets, is the actual garbage yield for data , and is the estimated garbage yield for data .
3.2.3. Kriging Testing
The Kriging interpolation method is a spatial interpolation technique designed to estimate the attribute values of any point in space based on known discrete data points. In this study, we employed the Kriging interpolation method to develop a predictive model for waste generation. According to research by Li et al. [19], the Kriging interpolation method demonstrated a more accurate representation in modeling the distribution of chemical contaminants, such as antimony (Sb), in soil. Consequently, after obtaining the predictive model for waste generation, we applied Kriging spatial interpolation to assess the accuracy of our model and identify any significant prediction errors. Via this approach, we are able to gain deeper insights into the spatial distribution characteristics of waste generation and provide reliable data support for subsequent waste management decisions.
3.3. MSW Management Statement and Model Formulation
This study models the municipal waste collection and transfer system of Beijing as a multi-objective site allocation model with stochastic demand, aiming to optimize the waste collection and transfer processes. We focus on three primary objectives: enhancing residents’ quality of life, achieving economic efficiency, and promoting environmental protection. The model identifies waste generation nodes within various communities and potential future waste treatment centers, while discussing how to optimize among these three objectives to ensure both the realism and feasibility of the model. To this end, several necessary assumptions are made in this paper:
- The demand of each garbage generating node is an independent random variable that undergoes certain fluctuations and the distribution obeys a normal distribution N(μ,σ2), where μ is the average value of the garbage generation obtained from the prediction and σ is set artificially.
- The demand at a single waste generation node must not exceed the maximum capacity of the vehicle to ensure that an empty vehicle can deliver all the waste from a single node.
- A garbage generation node can only be served by one vehicle but can be performed by splitting into two services. If the vehicle is full, the vehicle returns to the waste disposal center to be emptied and then returns to the waste generation node for service.
- All vehicles are identical and have a limited maximum distance they can travel.
- The time required to dispose of the waste at the waste disposal center is the same and constant.
- The model also needs to consider the cost of returning the vehicle to the waste disposal center and the cost of the truck driver’s wages for the time spent at work.
For the purpose of mathematical description, the symbols in the equations are described in Symbol Definitions.
The decision variables for this problem contain the following: Xijk, if the vehicle k travels from node i to node j, then Xijk = 1; otherwise Xijk = 0; yik, 1 if the node i is assigned to the vehicle k for service, 0 otherwise; Zi, assigned 1 if the waste disposal center i is selected for selection, 0 otherwise.
To facilitate the expression of the objective function, some variables appearing in the objective function are defined in the above equation. Equation (5) represents the sum of distances that the vehicle i needs to travel while performing the service, including the distance from the waste disposal center to the first waste generation node and the distance between different waste generation nodes for waste collection. In addition, if the vehicle finds that the remaining capacity does not meet the requirement after reaching the waste generation node, it needs to return to the waste disposal center for unloading and then return for further loading. Equation (6) is the time consumed by each vehicle, including the vehicle operation time from the waste disposal center to the first waste generation node, the vehicle operation time for collecting waste between different waste generation nodes and the service time of each waste generation node, and the corresponding time needs to be considered after considering the problem of returning to the waste disposal center midway. Equation (7) is the vehicle in the service node when the capacity cannot meet the requirements so return to the waste disposal center to unload the additional distance generated by unloading. Equation (8) is the corresponding additional time cost incurred for unloading. Equation (9) describes the driver’s pay, including the pay for normal working hours and the pay for outside normal working hours.
The three equations above represent the three objective functions: Equation (10) calculates the CO2 emissions of the proposed scenario. Equation (11) calculates the total cost of the proposal, including the cost of vehicle routes, driver wages, vehicle usage costs, and the cost of opening a waste disposal center. Equation (12) calculates the average distance between the location of the waste disposal center and the customer point. On the one hand, if the garbage disposal center is opened closer it will reduce the claimed cost, but it will make the living environment of the public worse, thus leading to a lower living experience. The objective function and constraints of the model are illustrated below with mathematical equations:
Above are some constraints on the decision variables: Equations (13) and (14) ensure that the waste generating node can only be served by one vehicle on one route (which can be replenished). Equation (15) shows the relationship between the two decision variables, where all routes between the waste collection center and the waste generation node are serviced by a vehicle that departs from a particular waste collection center.
3.4. Study Area Selection and Processing
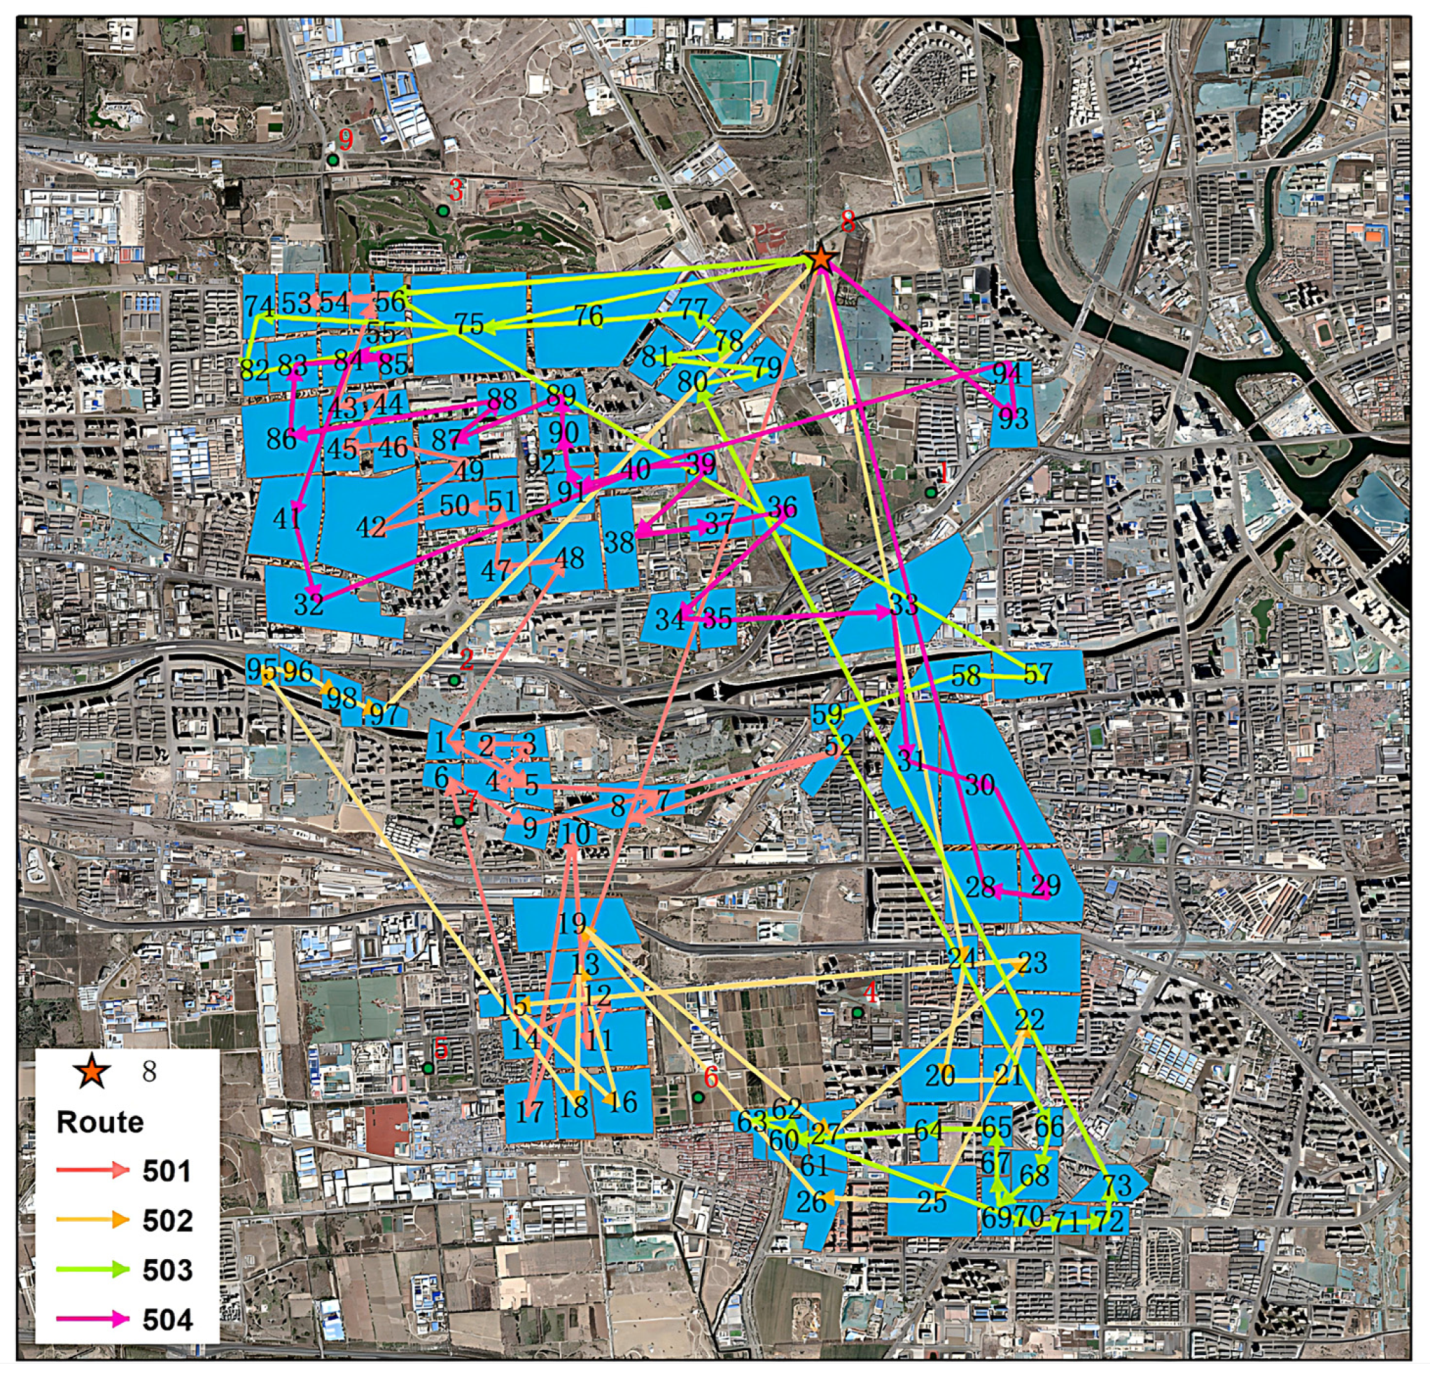
In this paper, two cases of Fangshan District, Beijing, and the border of Tongzhou District, Chaoyang District, are selected for the study. The pre-selected locations and service stores of waste disposal centers are selected using remote sensing technology in combination with relevant policies.
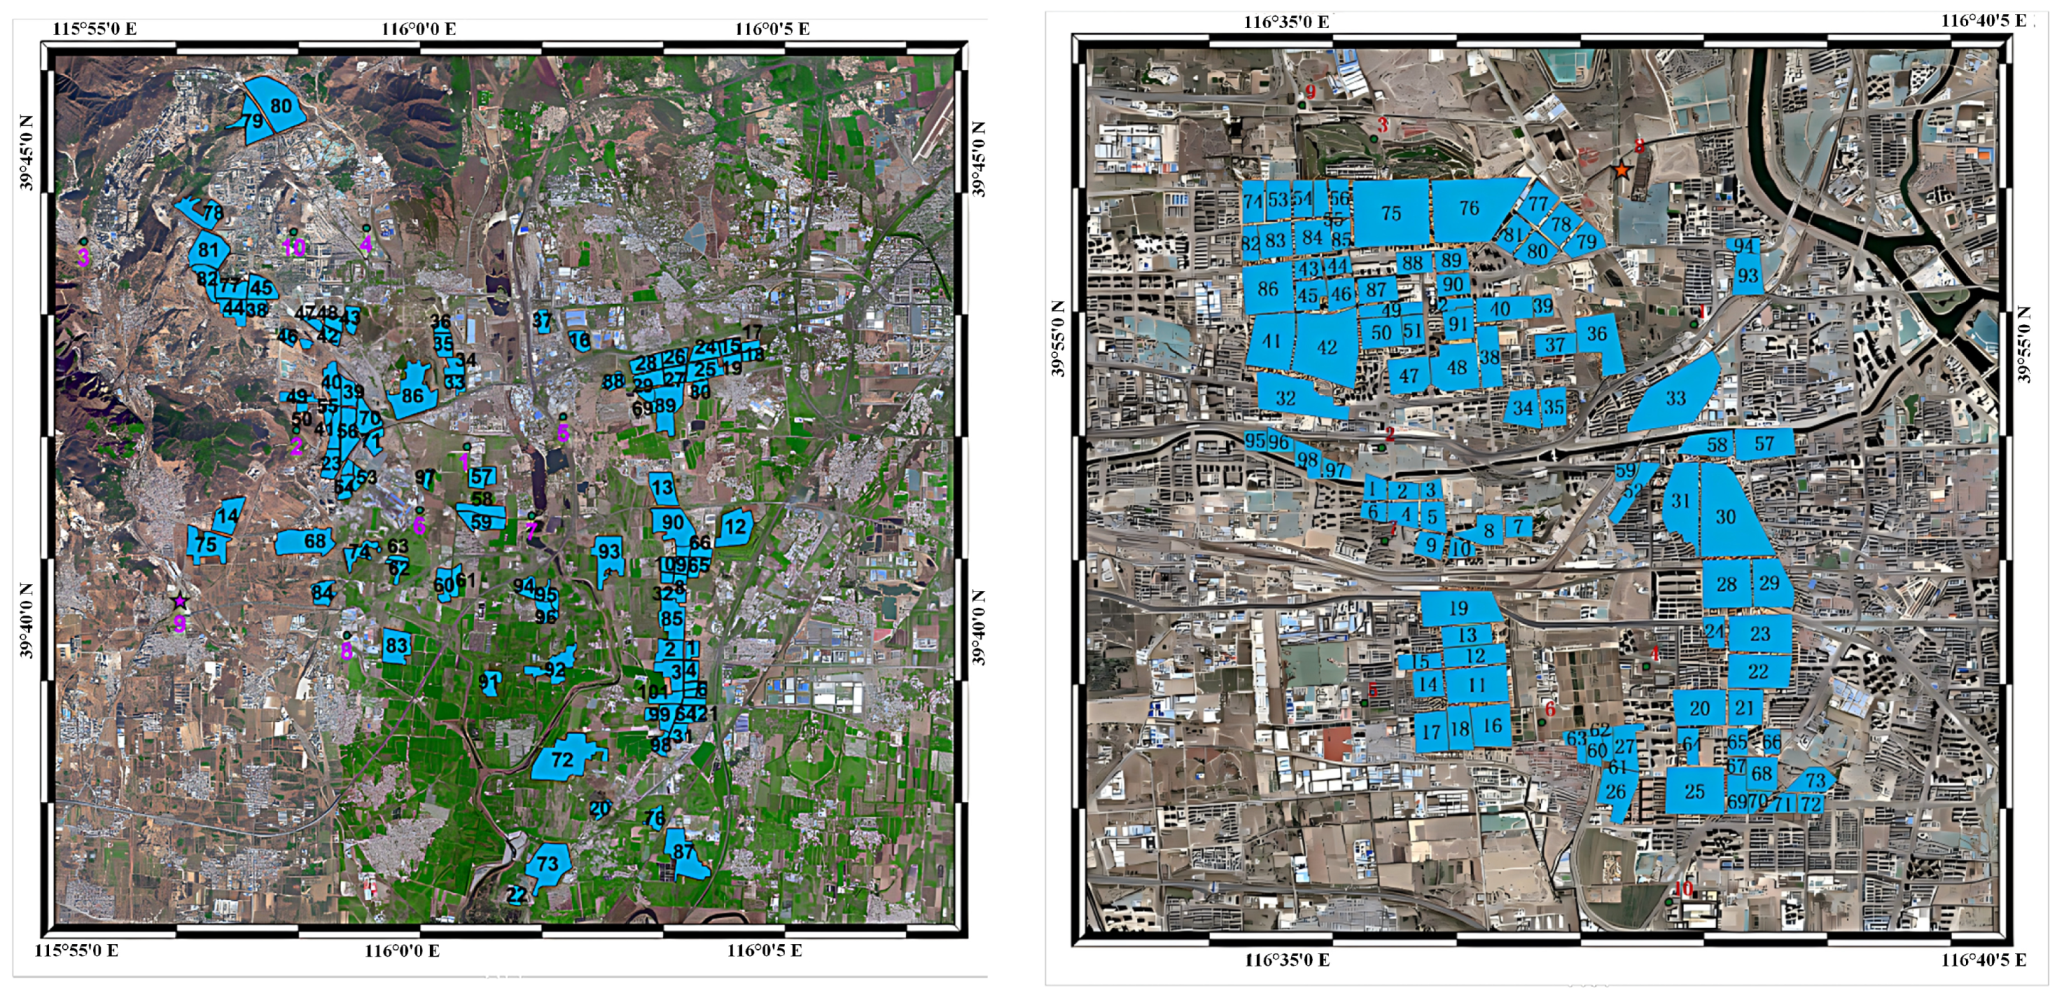
In this section, we present the selected study areas and the processing of the data. The pre-selected locations and service points for waste disposal centers in Fangshan District and the border area of Tongzhou District and Chaoyang District are illustrated in Figure 2. This figure provides a visual representation of the spatial distribution of the service points and pre-sited centers, which helps in understanding the geographical context and the layout of the waste management system.

Figure 2.
Spatial distribution of waste disposal service points and pre-sited centers in Fangshan, Tongzhou, and Chaoyang districts, Beijing. Blue marks: distribution of service stations, red and purple marks: pre-selected locations of waste disposal centers.
Chaoyang District is located in the northeastern part of Beijing and is the city’s center of commerce and business and a gathering place for high-end talents. Tongzhou District is located in the southeastern part of Beijing and is one of the core areas of the new round of urban expansion. The border area between the two districts is one of the city’s central urban areas, with high population density, rapid urbanization, and the presence of a number of commercial and catering enterprises, which contribute significantly to waste generation and disposal. There is increasing pressure on the waste disposal and recycling system in the area.
Located in the southern part of Beijing, Fangshan District is a typical combination of urban and rural areas and is a less developed area. The district has great potential for future development as one of the demonstration areas for the collaborative development of Tianjin and Hebei, but the existing waste treatment and recycling system is relatively imperfect.
In this paper, Google Earth satellite images and road network data extracted from Open Street Map are used for the study. These data are subjected to a series of pre-processing procedures including geographic alignment and geometric correction before being used. We classify them according to the following rules:
- Urban and rural areas are considered different areas.
- Villages are considered the same object, unless they are separated by large parcels of farmland, industrial parks, railroads, or highways.
- Urban areas separated by major roads are considered different areas.
- Different neighborhoods that do not distinguish between visible arterials are considered the same area.
A total of 98 urban objects and 10 pre-sited centers were selected in the border area of Tongzhou District, Chaoyang District, and 64 urban objects, 36 village objects, and 10 pre-sited centers were selected in the case of Fangshan District. We use the night light remote sensing data to process the brightness value of each district to get the real brightness value of each district, and at the same time, this paper generates the other four data (number of household population, per capita disposable income, per capita consumption expenditure, and resident population density) of the service point randomly, which will fluctuate within an interval of 20% above the mean value of the district for urban areas and 20% below for rural areas. Then, the data of each point in the region is substituted into the machine learning model to predict the mean value of its garbage production, and its variance is set to 0.1 to collate the data set with realism for each region.
3.5. Multi-Objective Optimization Algorithm
In this section, we will provide a detailed overview of the multi-objective optimization algorithms employed, specifically focusing on the implementation and characteristics of MOEAs and NSGA-II.
3.5.1. MOEA
The intrinsic core of the MOEA is a genetic algorithm, which employs the evolutionary mechanism of genetic algorithms to search for a better solution among the population of candidate solutions and to evaluate the fitness based on some evaluation metrics. The Pareto frontier is searched in the objective function space by genetic operations (e.g., crossover, mutation) and selection operations (e.g., roulette selection, tournament selection) during the search process, which has proven its effectiveness as a classical algorithm on several data sets.
3.5.2. NSGA-II
The non-dominated ranking genetic algorithm with elite strategy (NSGA-II) is an improvement on the genetic algorithm framework, proposed by Deb et al. in 2002, which is also the mainstream algorithm in multi-objective optimization problems nowadays. It is also able to obtain a series of optimal non-dominated rankings and crowding distances with uniform distribution and good diversity when solving large-scale optimization problems, and its main features are as follows:
- Fast non-dominated sorting: NSGA-II employs an efficient non-dominated sorting algorithm, which classifies the population into different ranks (fronts) based on their dominance relationships. Individuals in each rank are not dominated by any other individuals in the same rank for all objectives. This sorting method significantly reduces the computational complexity of the algorithm from O(MN3)O(MN3)O(MN3) to O(MN2)O(MN2)O(MN2), where MMM is the number of objectives, and NNN is the population size.
- Crowding distance calculation: To maintain solution diversity, NSGA-II introduces the concept of crowding distance. Crowding distance is a measure of how close an individual is to its neighbors, used to ensure an even distribution of solutions in the objective space. Within the same non-dominated rank, individuals with larger crowding distances are preferred, thereby ensuring population diversity.
- Elitist strategy: NSGA-II adopts an elitist strategy by selecting individuals not only from the offspring but also from the combined pool of parents and offspring in each generation. These individuals are selected based on non-dominated sorting and crowding distance. This strategy ensures that the best solutions are not lost and accelerates convergence.
- Binary tournament selection: During the selection process, NSGA-II uses a binary tournament selection mechanism. In each selection, two individuals are randomly chosen and compared. The individual with the higher rank is selected. If both individuals belong to the same non-dominated rank, the one with the larger crowding distance is selected. This approach ensures both selection directionality and population diversity.
- Crossover and mutation operations: NSGA-II employs classical genetic algorithm operations, including simulated binary crossover (SBX) and multi-point mutation. These operations explore a broader solution space by recombining and randomly altering the genes of individuals.
Few and stable parameters: NSGA-II has low parameter dependency, and the impact of parameter settings on algorithm performance is relatively stable, making the algorithm robust across different problems and datasets.
4. Results and Discussion
4.1. MSW Prediction Model
4.1.1. Accuracy Analysis
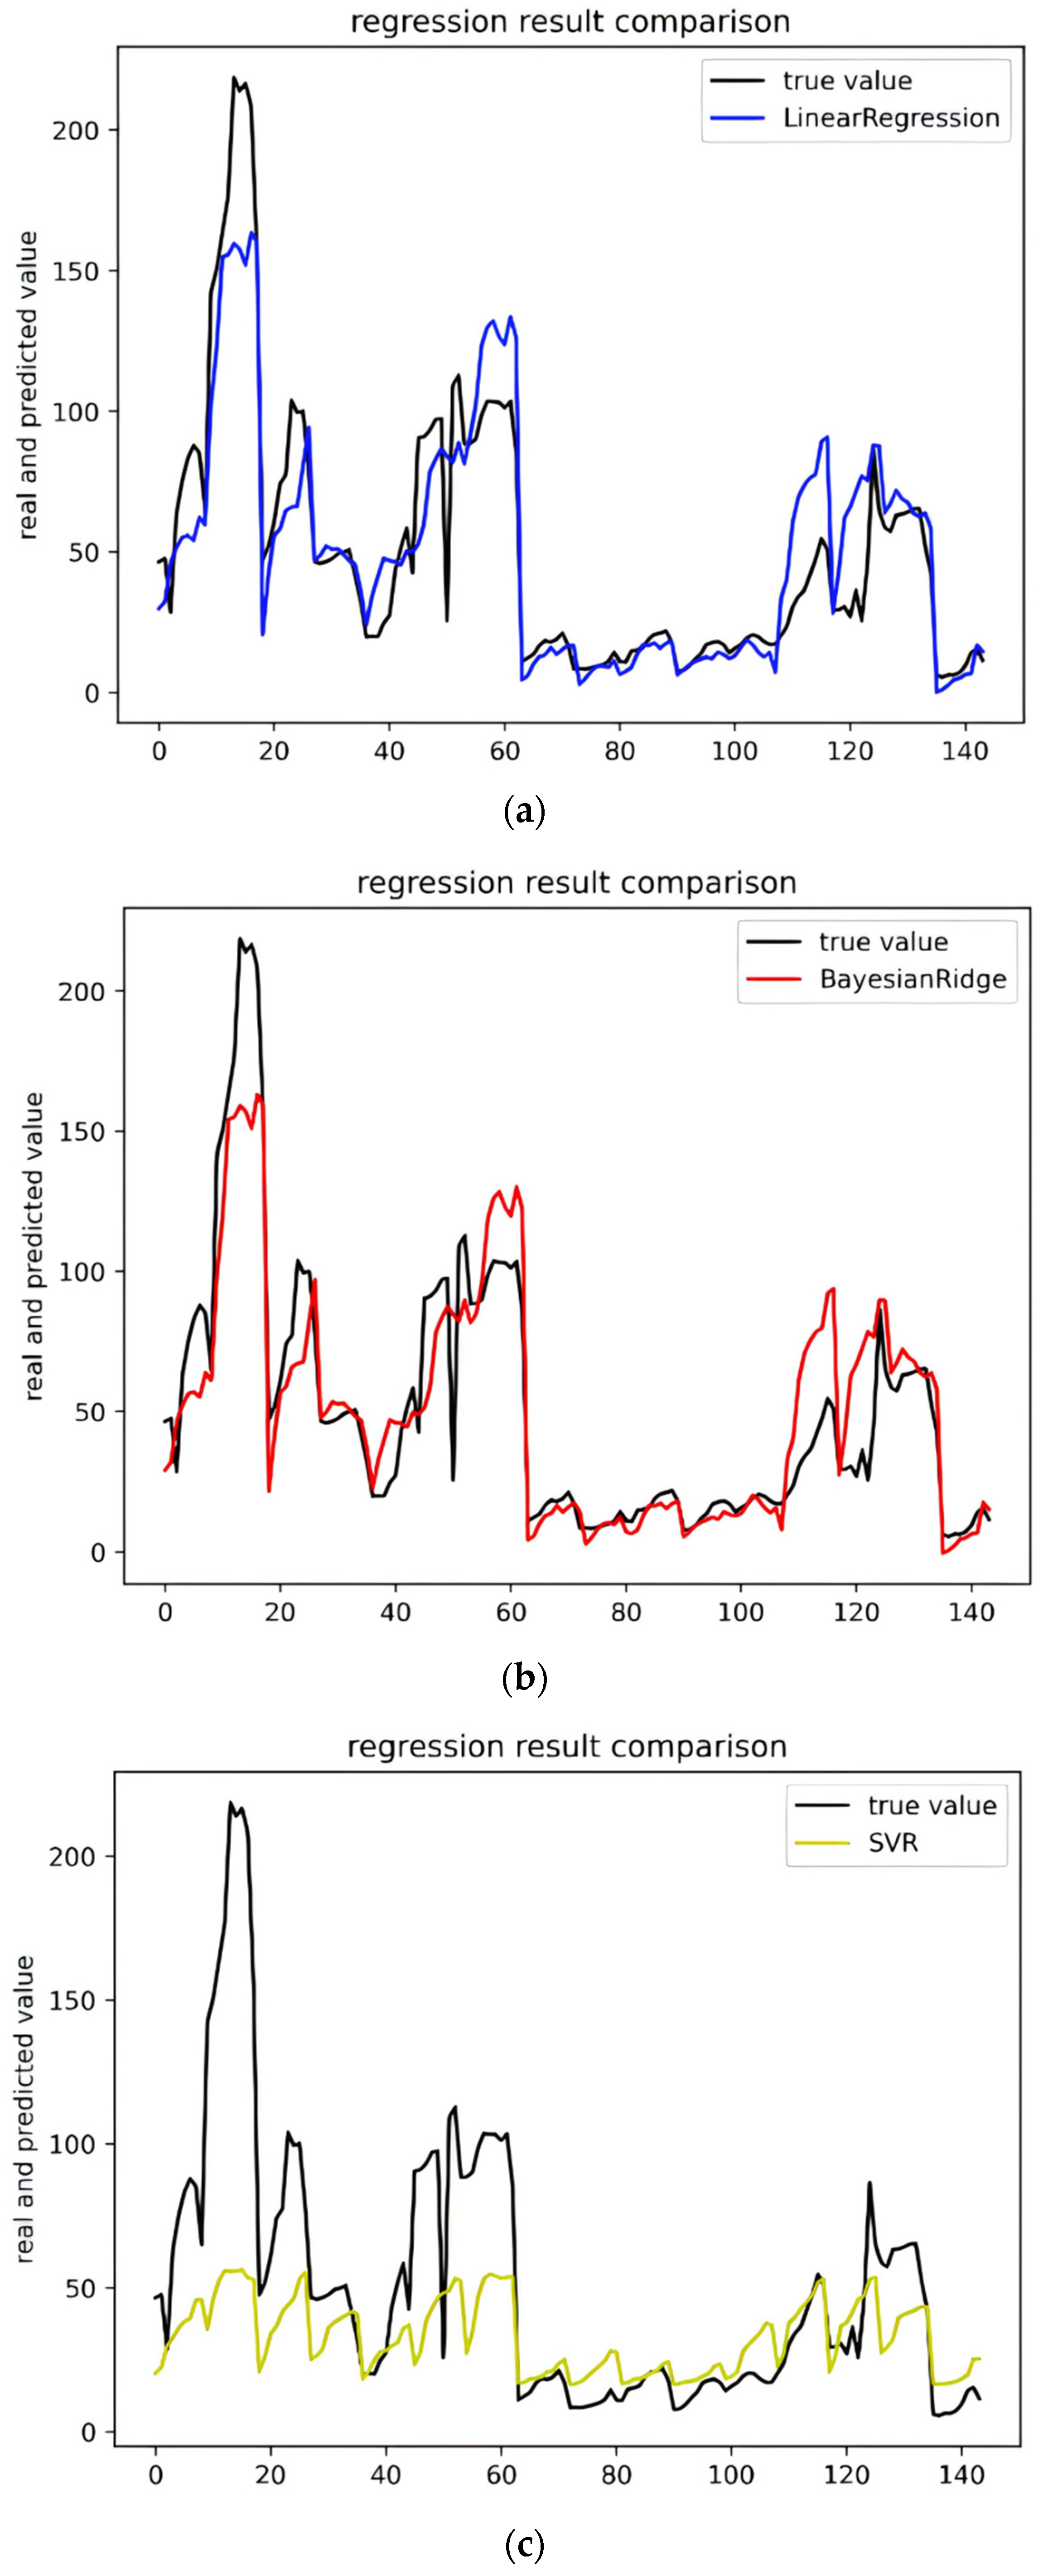
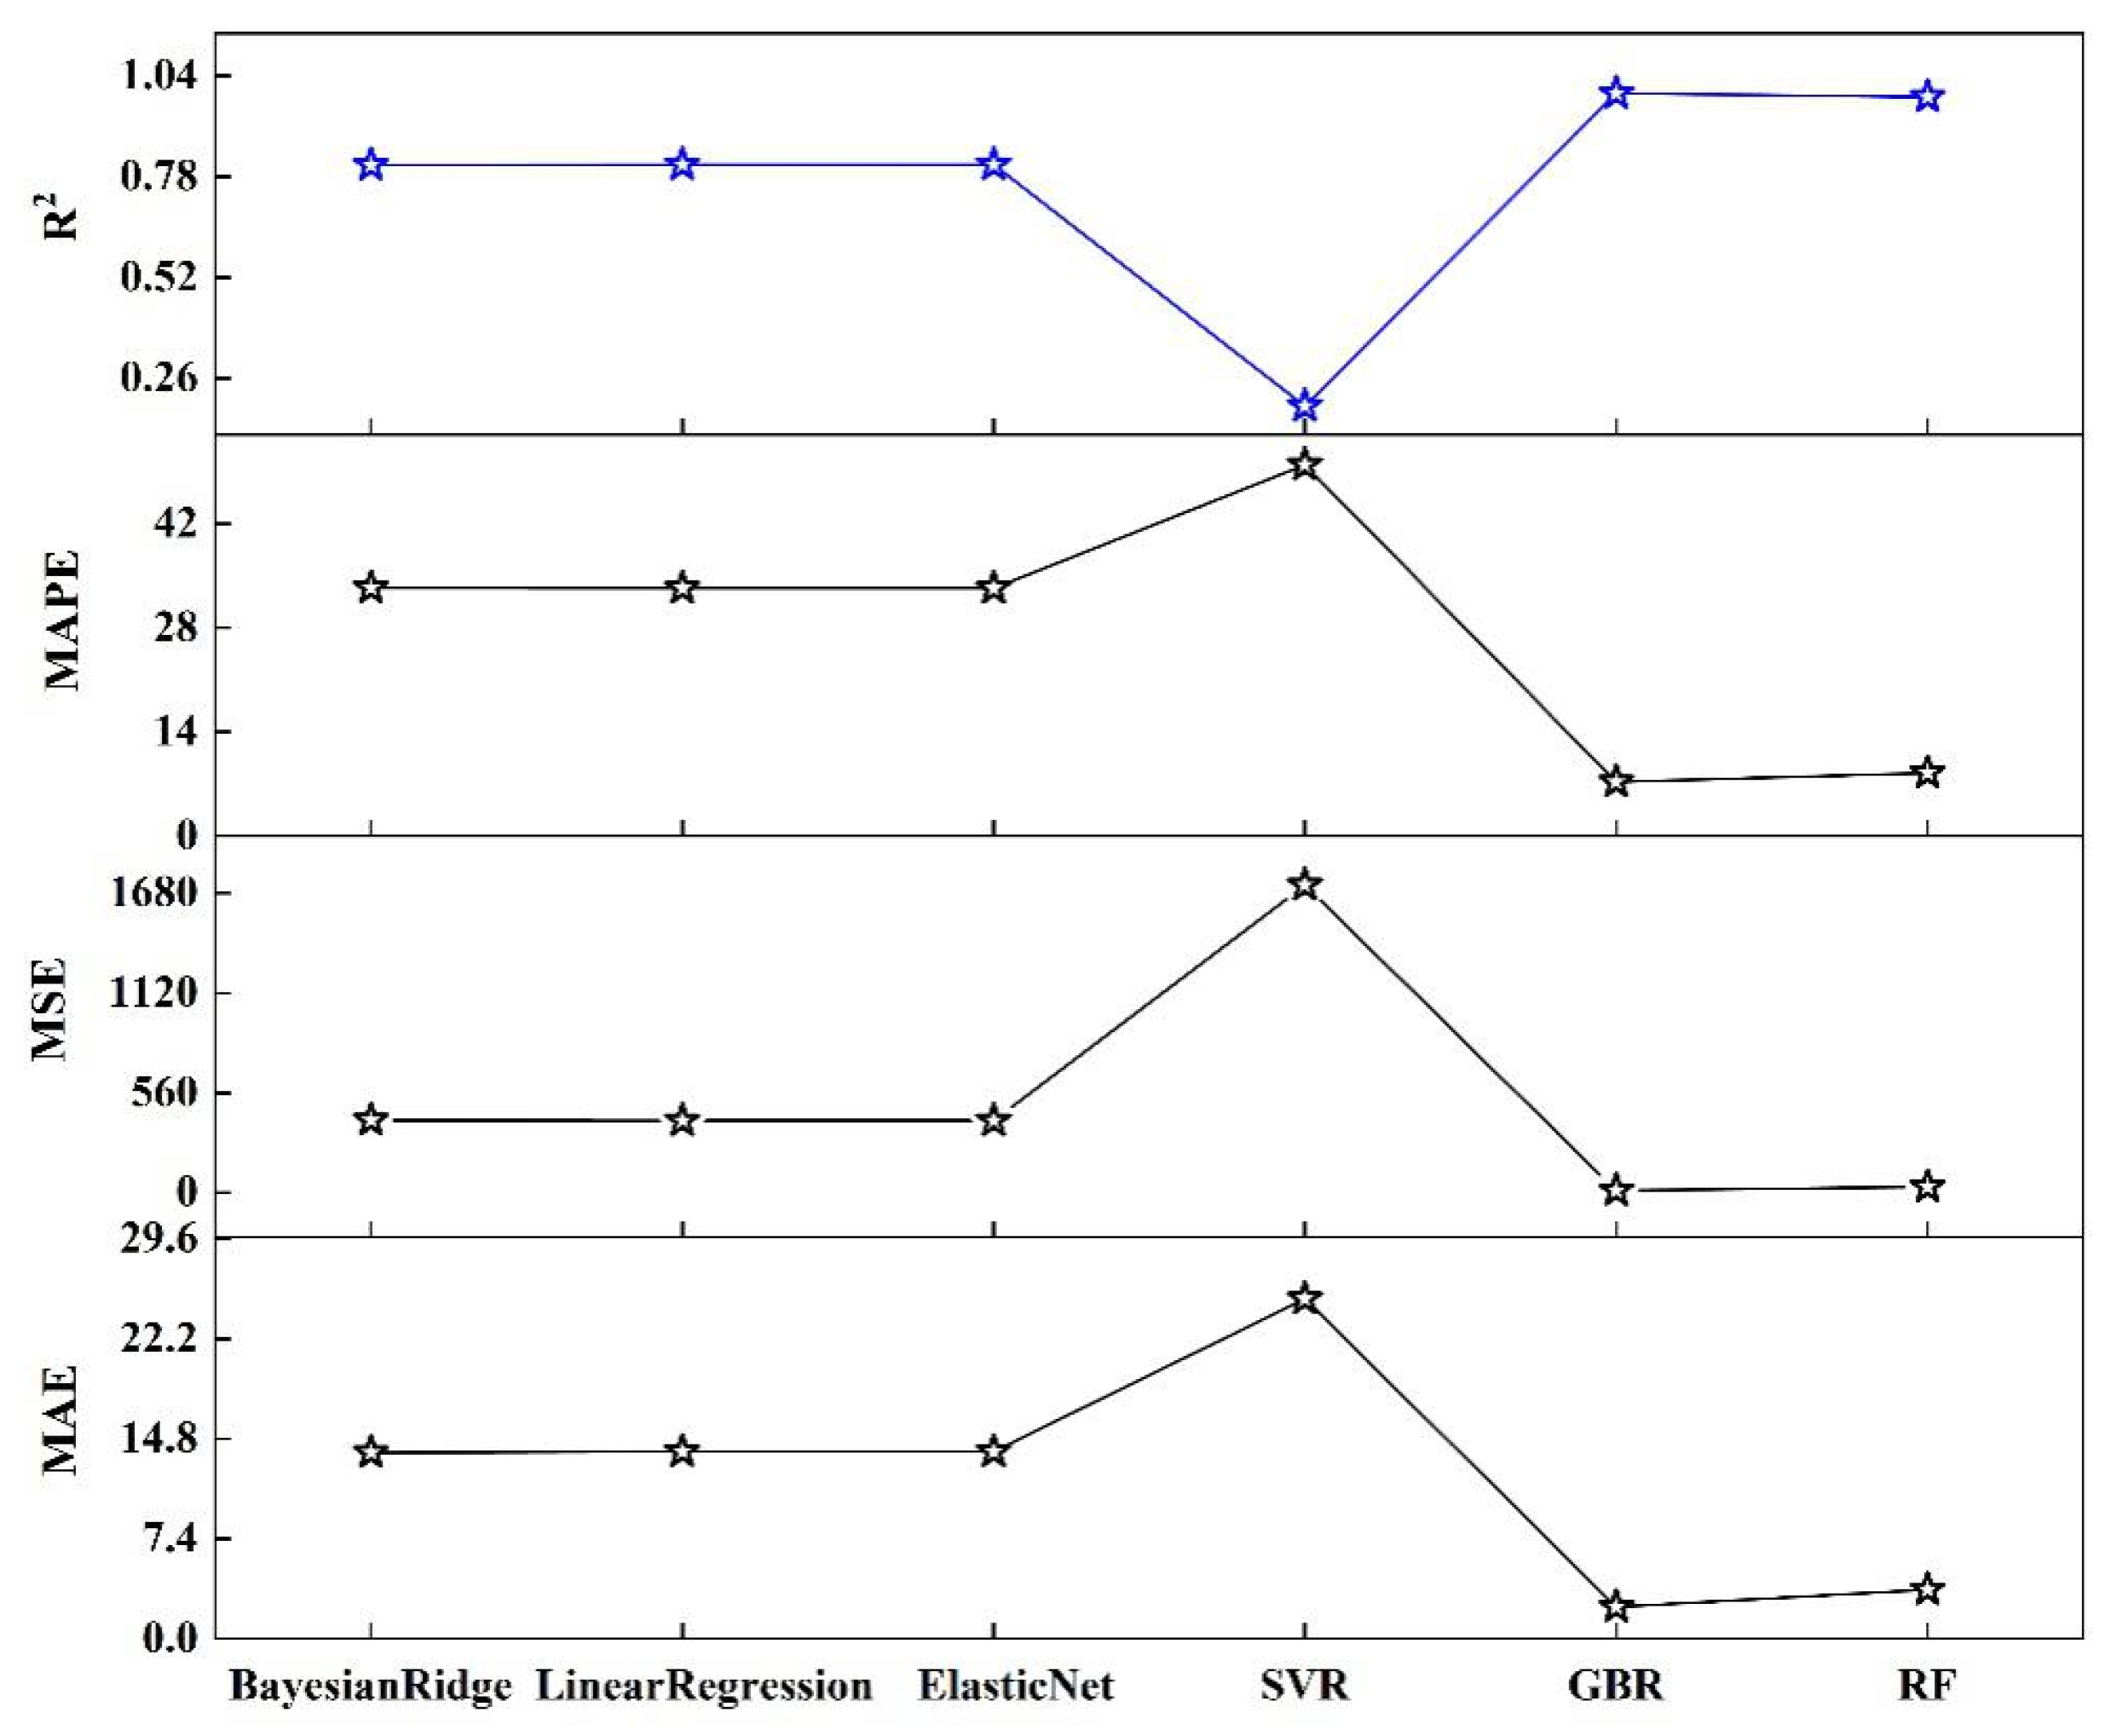
In this experiment, we used six machine learning algorithms to compare garbage yield prediction models. The algorithms included multiple linear regression, Bayesian ridge regression, support vector regression, elastic network regression, gradient boosted (GBR) regression, and random forest regression (RF). Figure 3a–f represent these methods, respectively, showcasing their fitting curves and performance across various indices. Linear regression and Bayesian ridge regression are relatively simple models, and there will undoubtedly be a large gap in comparison with the fitting effect of other models. Support vector regression is less effective overall, with high accuracy in predicting smaller amounts of waste generated but very poor on data with larger yields. GBR and RF are models based on boosting and bagging, respectively, which have better generalization ability and are better at solving high-dimensional tasks, and both of them perform much better than the other algorithms. Figure 4 and Table 2 show the performance of the six algorithms in the four evaluation metrics of MAE, MSE, MAPE, and R2. The lower the values of the first three metrics, the better the performance of the last metric. It is evident that gradient boosting regression (GBR) and random forest (RF) significantly outperform the other four models, with support vector regression (SVR) being identified as the least effective model. The table presents a comparative analysis of each model’s performance based on various evaluation indicators. Notably, GBR surpasses RF across all metrics, achieving results of 2.346329, 11.635605, 7.242440, and 0.994516 in these four indicators, respectively. Consequently, GBR has been selected as the preferred method for modeling municipal waste generation across different districts in Beijing.
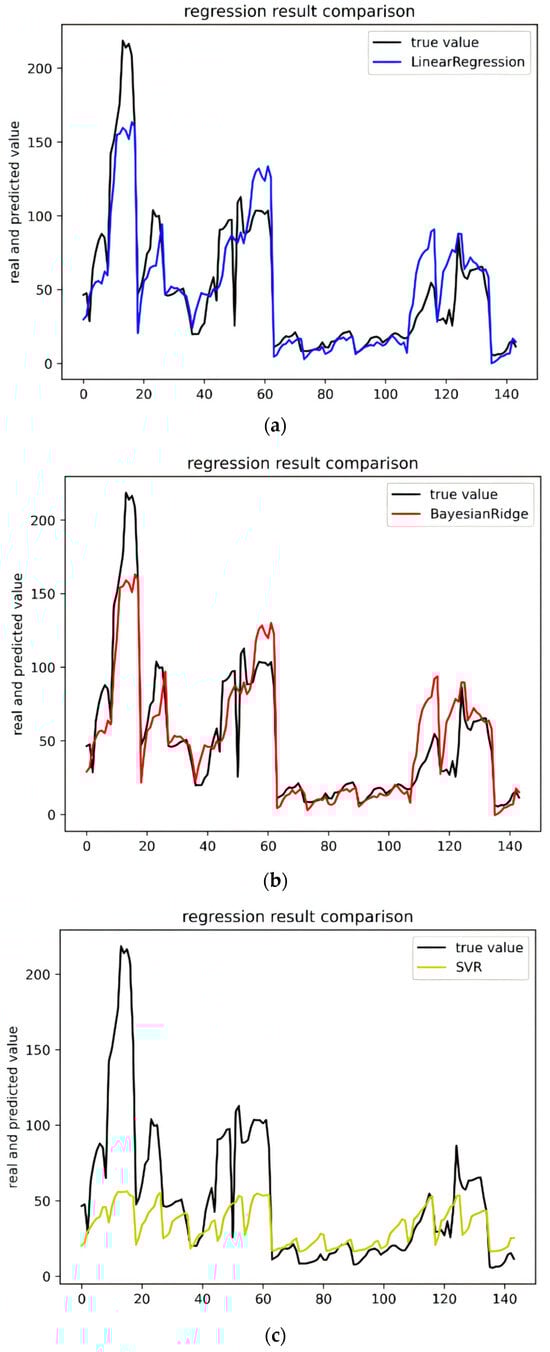
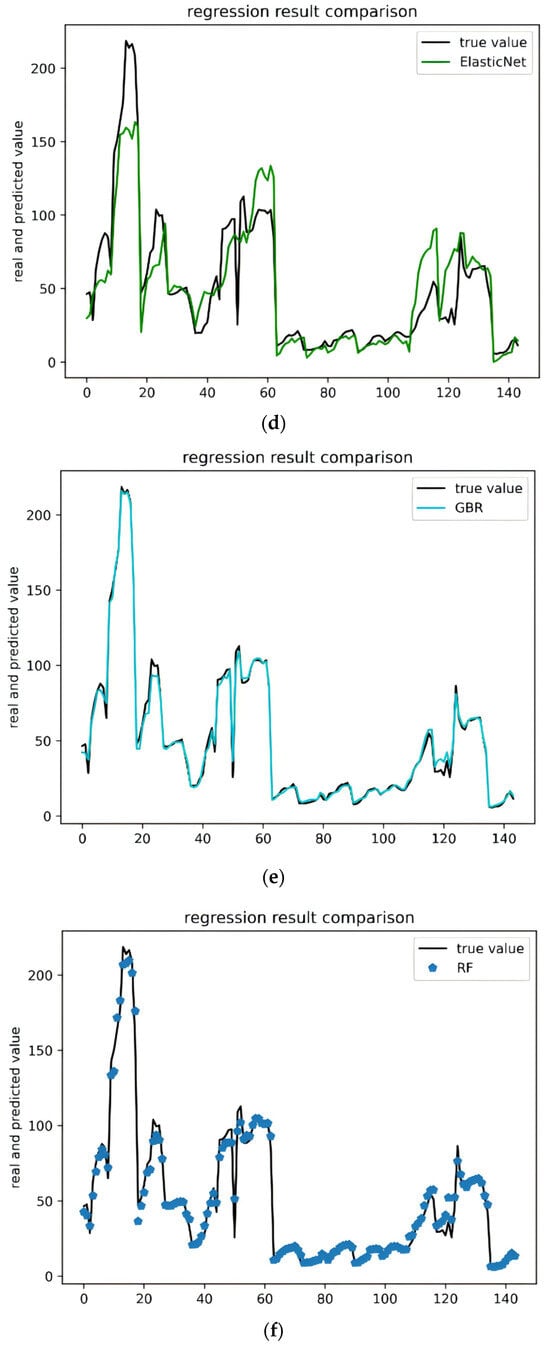
Figure 3.
Performance comparison of machine learning regression models for waste generation prediction. (a) Comparison of regression effects of linear regression models. (b) Comparison of regression effects of Bayesian ridge models. (c) Comparison of regression effects of SVR models. (d) Comparison of regression effects of elastic net models. (e) Comparison of regression effects of GBR models. (f) Comparison of regression effects of RF models.
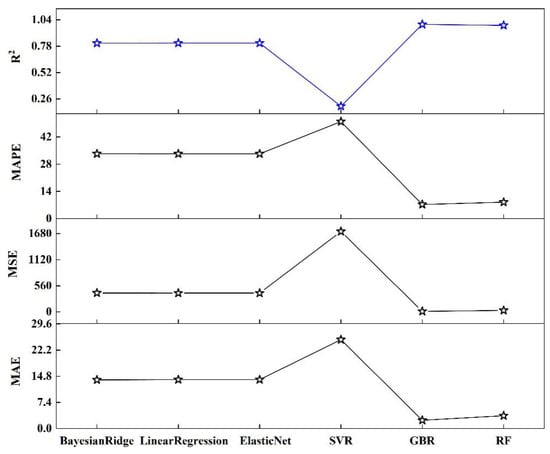
Figure 4.
Comparison of regression metrics of machine learning algorithm models.
Table 2.
Performance of different methods in predicting waste production.
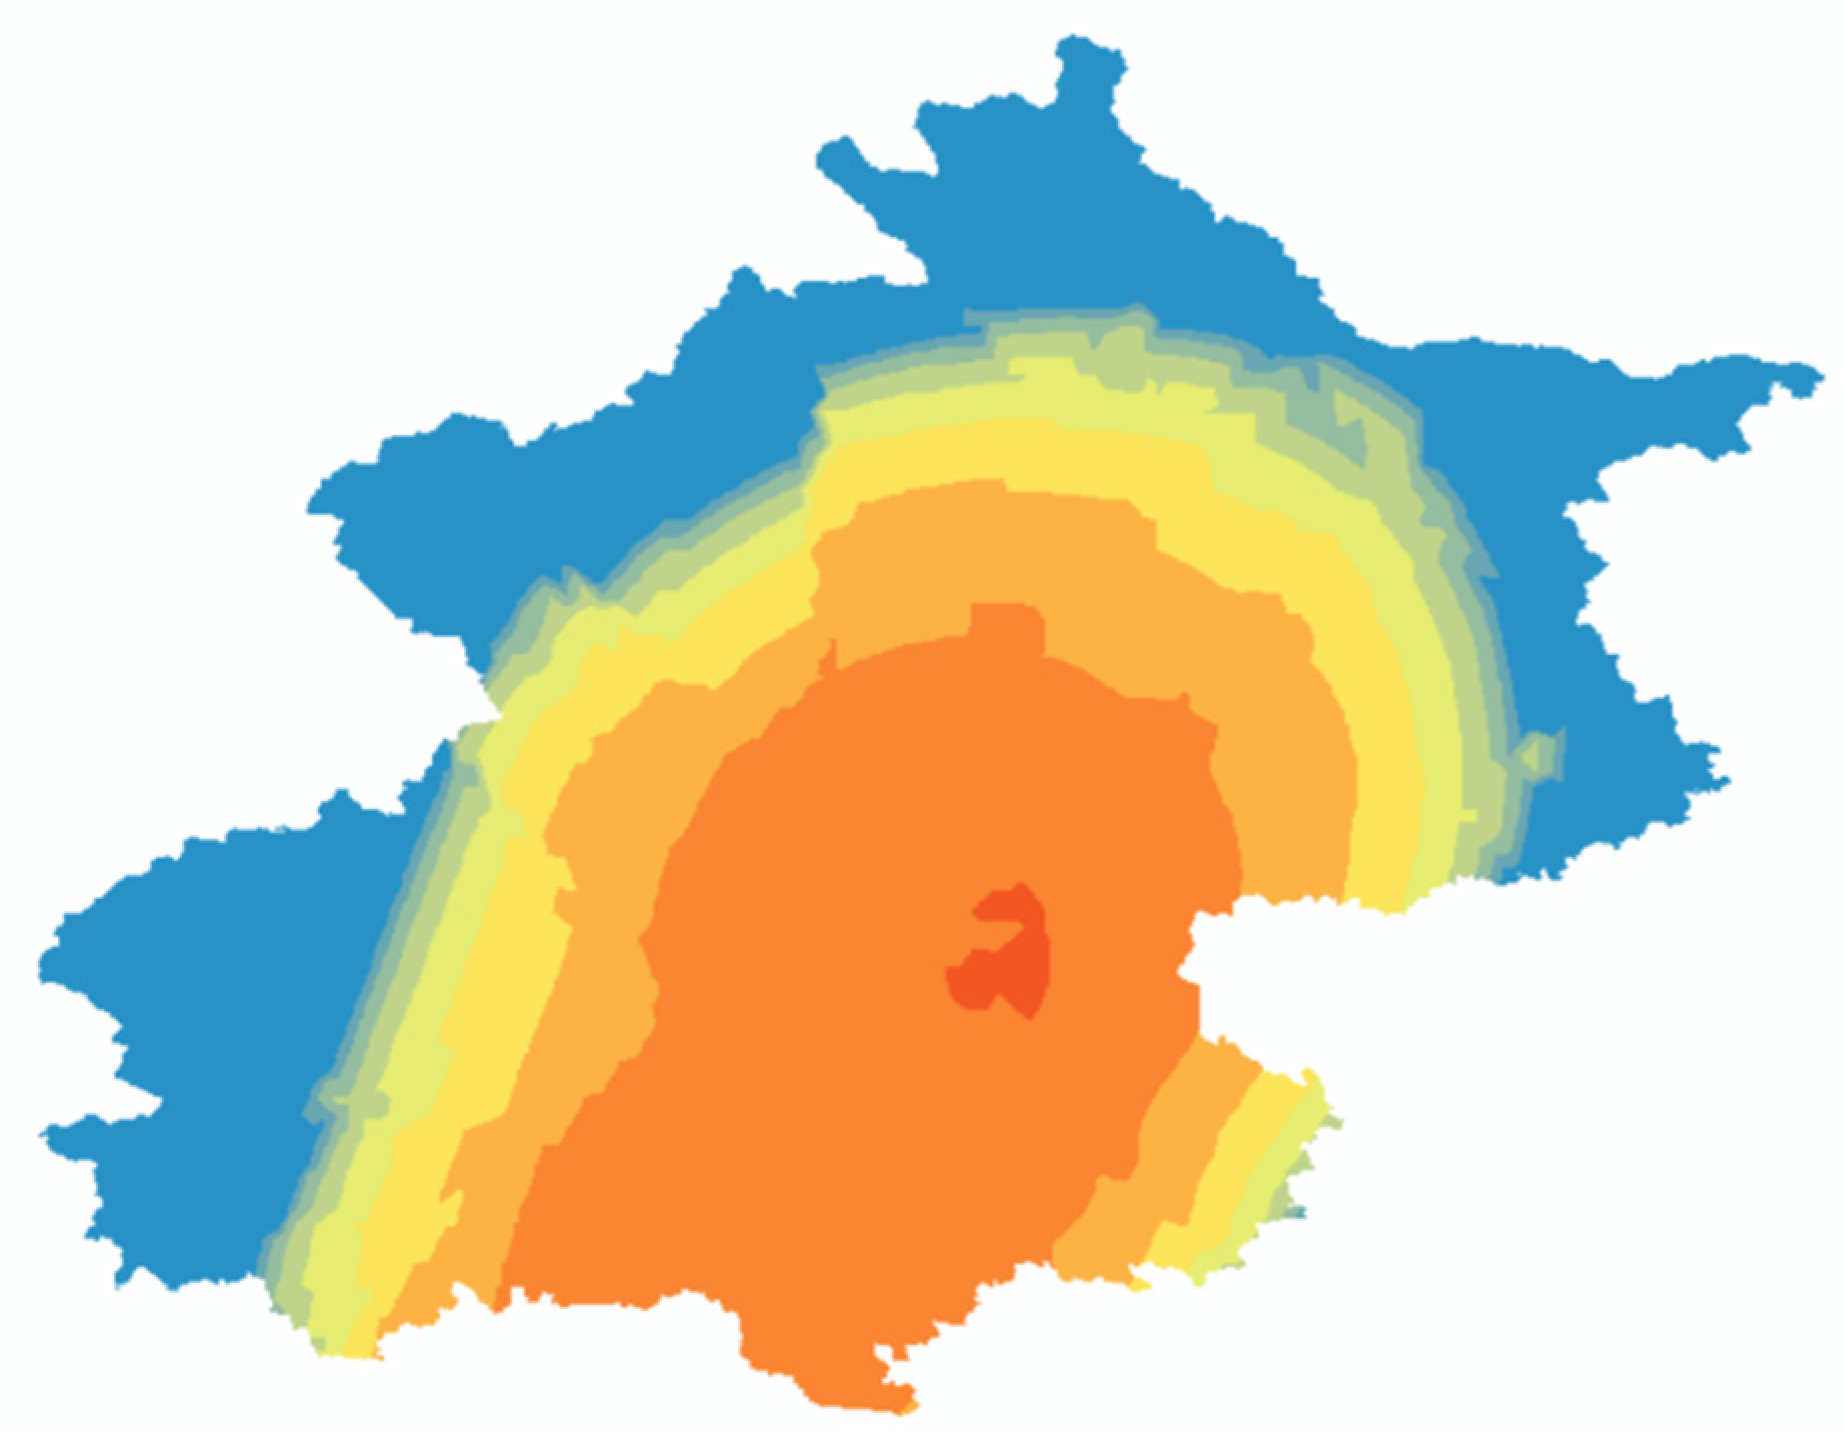
4.1.2. Kriging Spatialization
After establishing a high-precision domestic waste production prediction model, this paper spatialized the overall waste production in Beijing to visualize its distribution across the city and verify whether there is any error in the model. The spatialization results are shown below, revealing a distribution pattern similar to the ring pattern of Beijing. This similarity indicates that there are no significant errors in the data indicator system or the regression model construction. In Figure 5, the darker the color the higher the garbage production. According to our analysis, the average waste generation in the city center is approximately 961,100 tons, while the average waste generation in the peripheral areas is about 321,700 tons. The waste generation in the city center exceeds that of the peripheral regions by approximately 639,400 tons, which corresponds to an increase of 198.77%. This finding further corroborates the spatial distribution of waste generation and its consistency with Beijing’s “ring” model, thereby supporting the validity of our model.
Figure 5.
Results of Kriging interpolation spatialization.
4.2. MSW Management Case Study
4.2.1. Fangshan
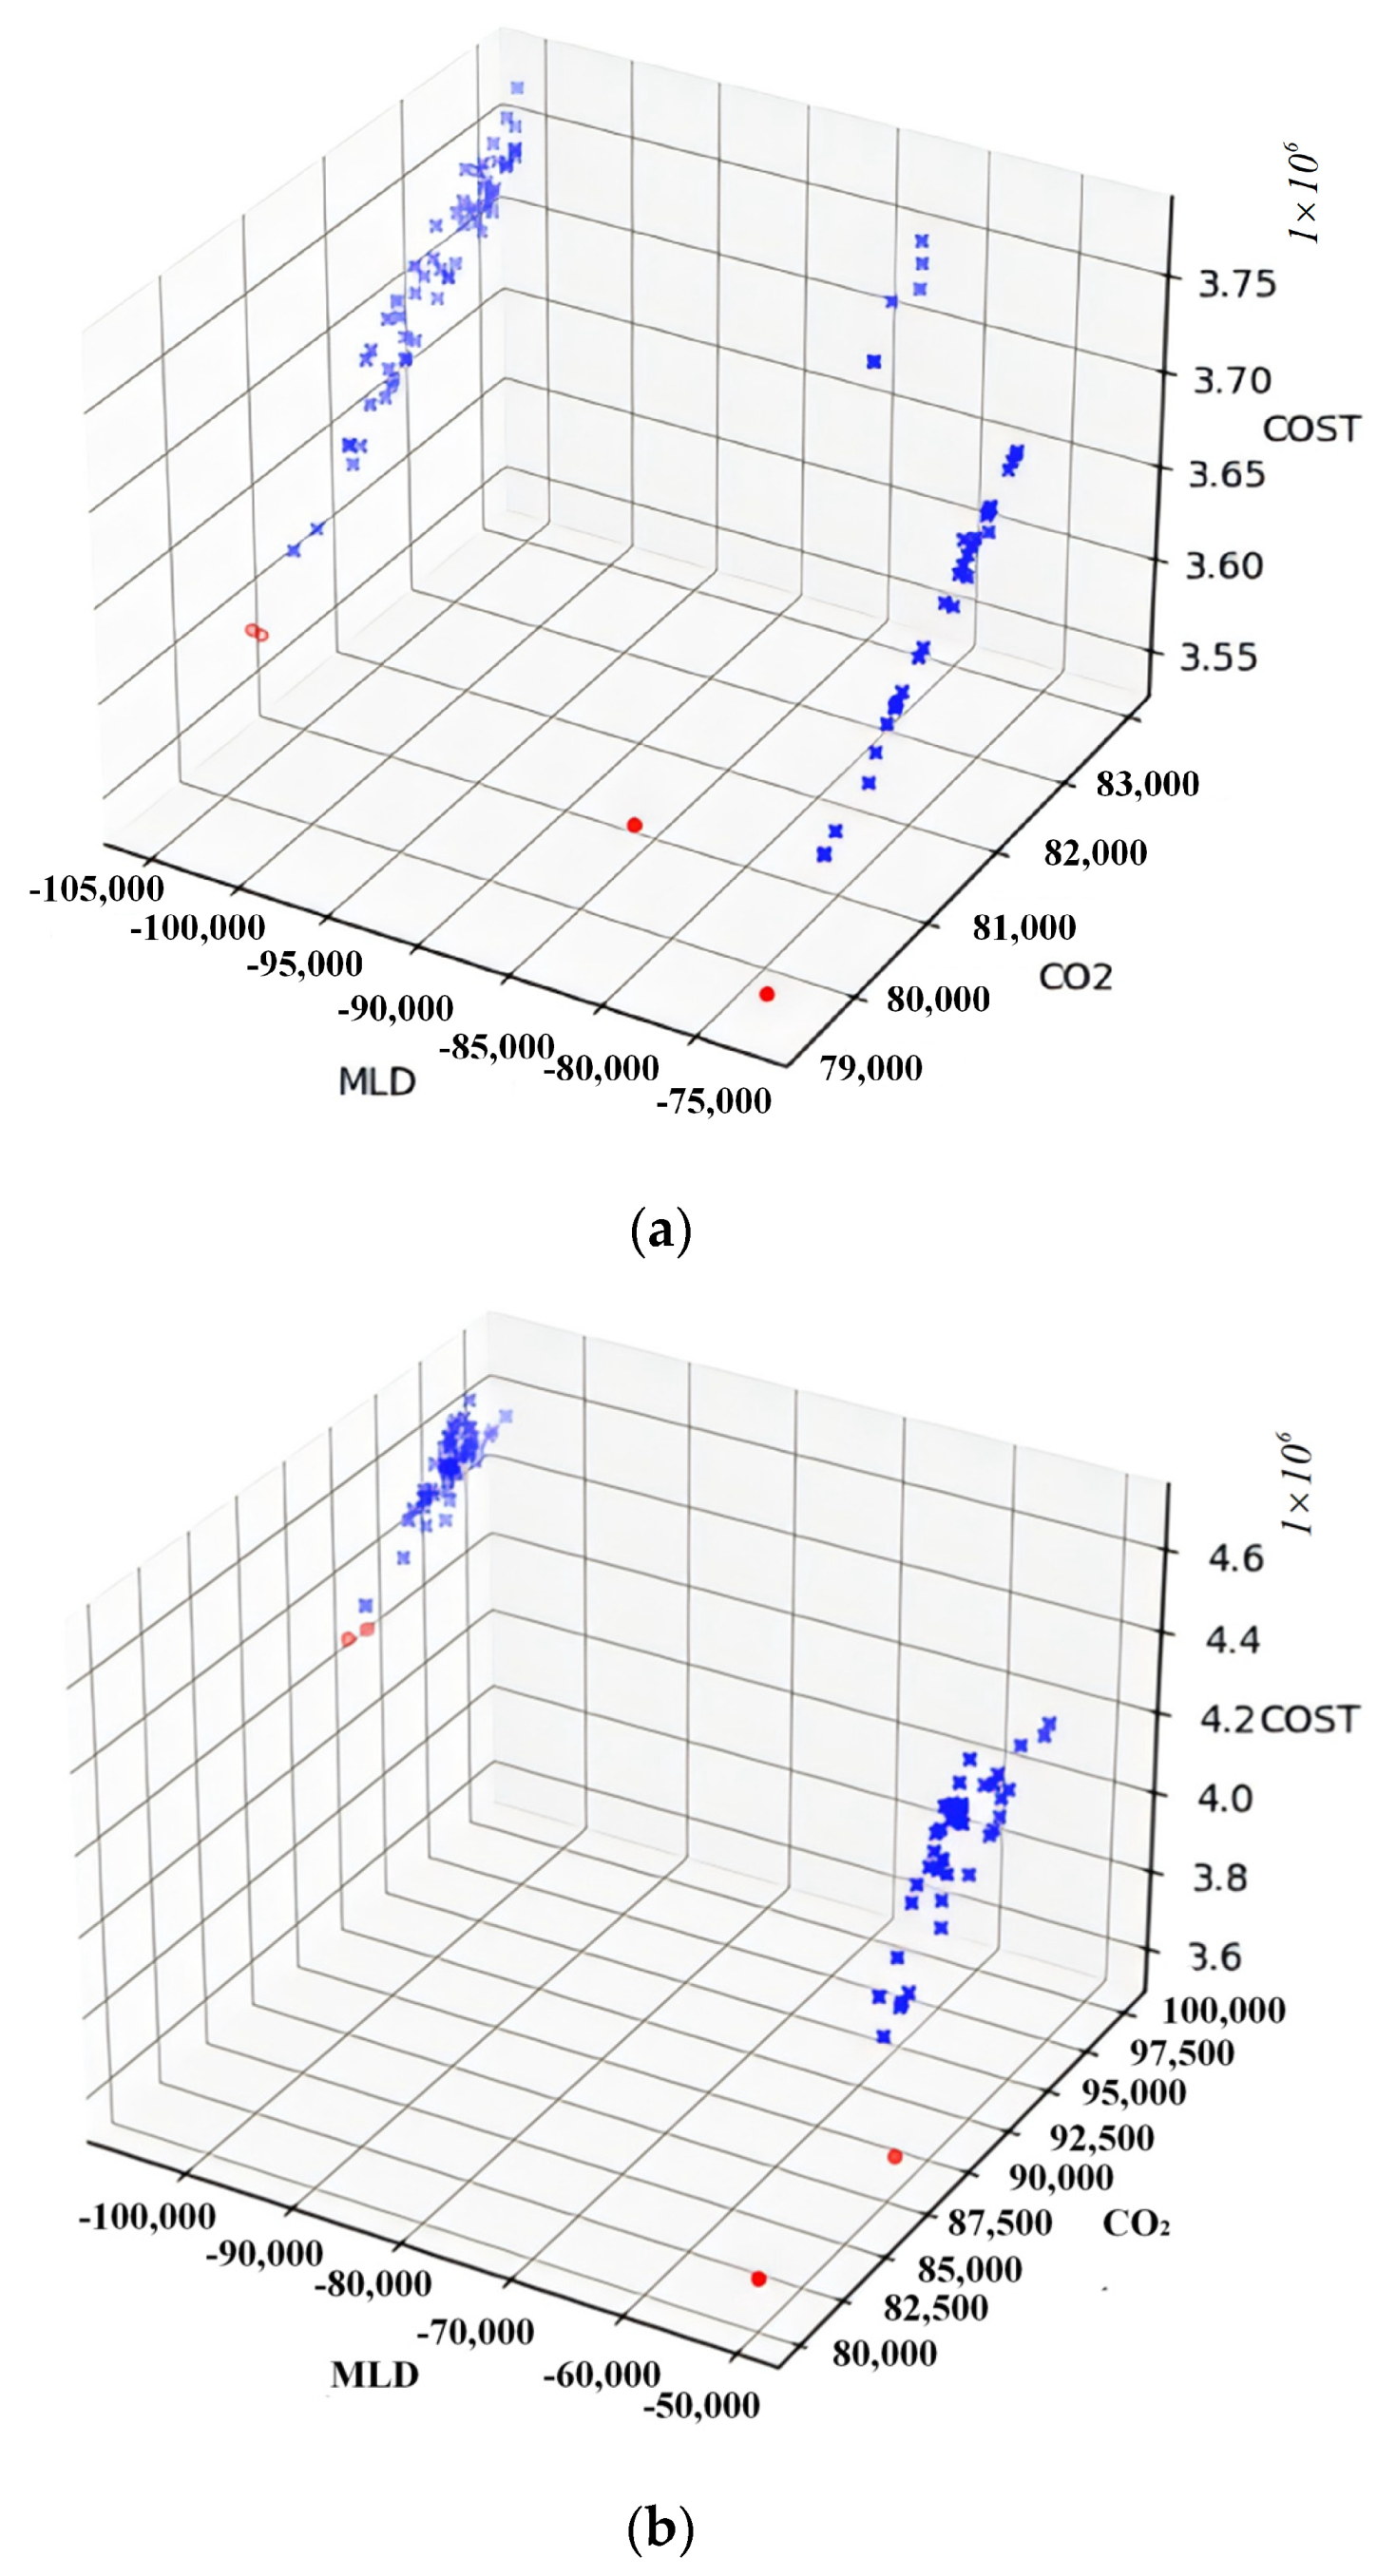
For the data of Fangshan District, this paper was solved using MOEAs and NSGA-II, respectively, where MOEAs obtained four non-dominated solutions and NSGA-II also obtained four non-dominated solutions, these solutions on the three objective functions are shown in the following table, where MLD denotes the average distance of the new waste treatment center from the customer point, CO2 denotes the number of CO2 emitted in the scheme, and COST denotes the total cost of the program:
Table 3 shows that the non-dominated solutions found by NSGA-II algorithm dominate the solutions found using the MOEA. Figure 6 illustrates the distribution of the solutions obtained by the two algorithms during the search, where a, b are the MOEAs and NSGA-II algorithms, respectively, the red dots indicate the non-dominated solutions found and the blue dots indicate some elite solutions in the search process. The pictures also show that the NSGA-II algorithm is less likely to fall into local optima and more likely to search for global optima when searching in the objective function space compared to the MOEA. The optimal solution is about 15% lower in CO2 emissions, 30% lower in total cost, and about 44% higher in average distance from residential areas compared to the worst solution. Figure 7 below represents one of the optimization schemes solved by NSGA-II.
Table 3.
Experimental results in Fangshan District.
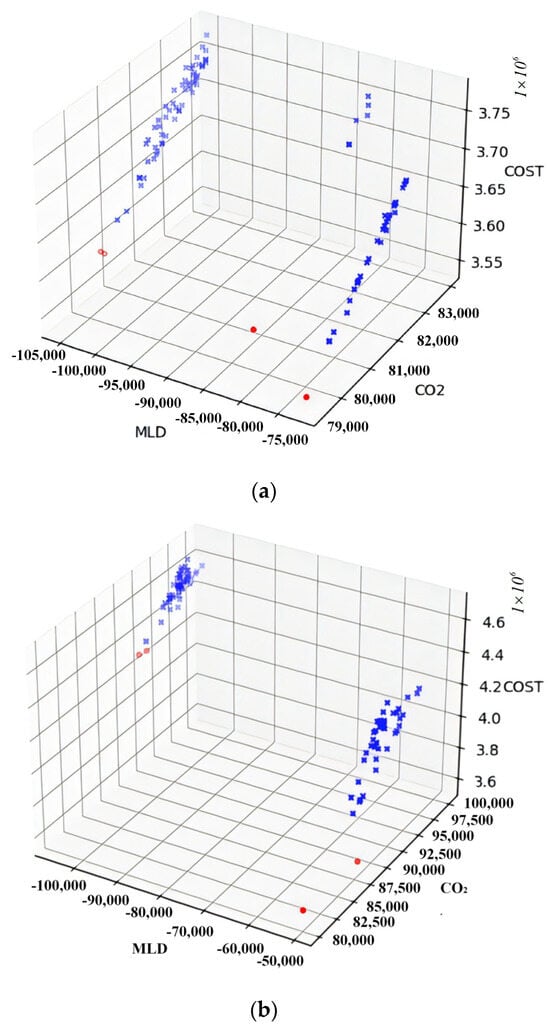
Figure 6.
Comparison of the algorithm’s search on the objective function space. (a) The solutions obtained using the MOEA are distributed across Fangshan District. (b) The solutions obtained using the NSGA-II are distributed across Fangshan District.
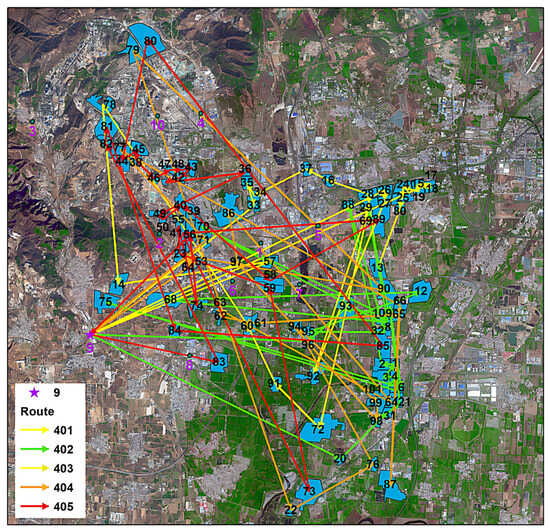
Figure 7.
Map of the solution scheme in FangShan District.
4.2.2. Boundary of Tongzhou and Chaoyang
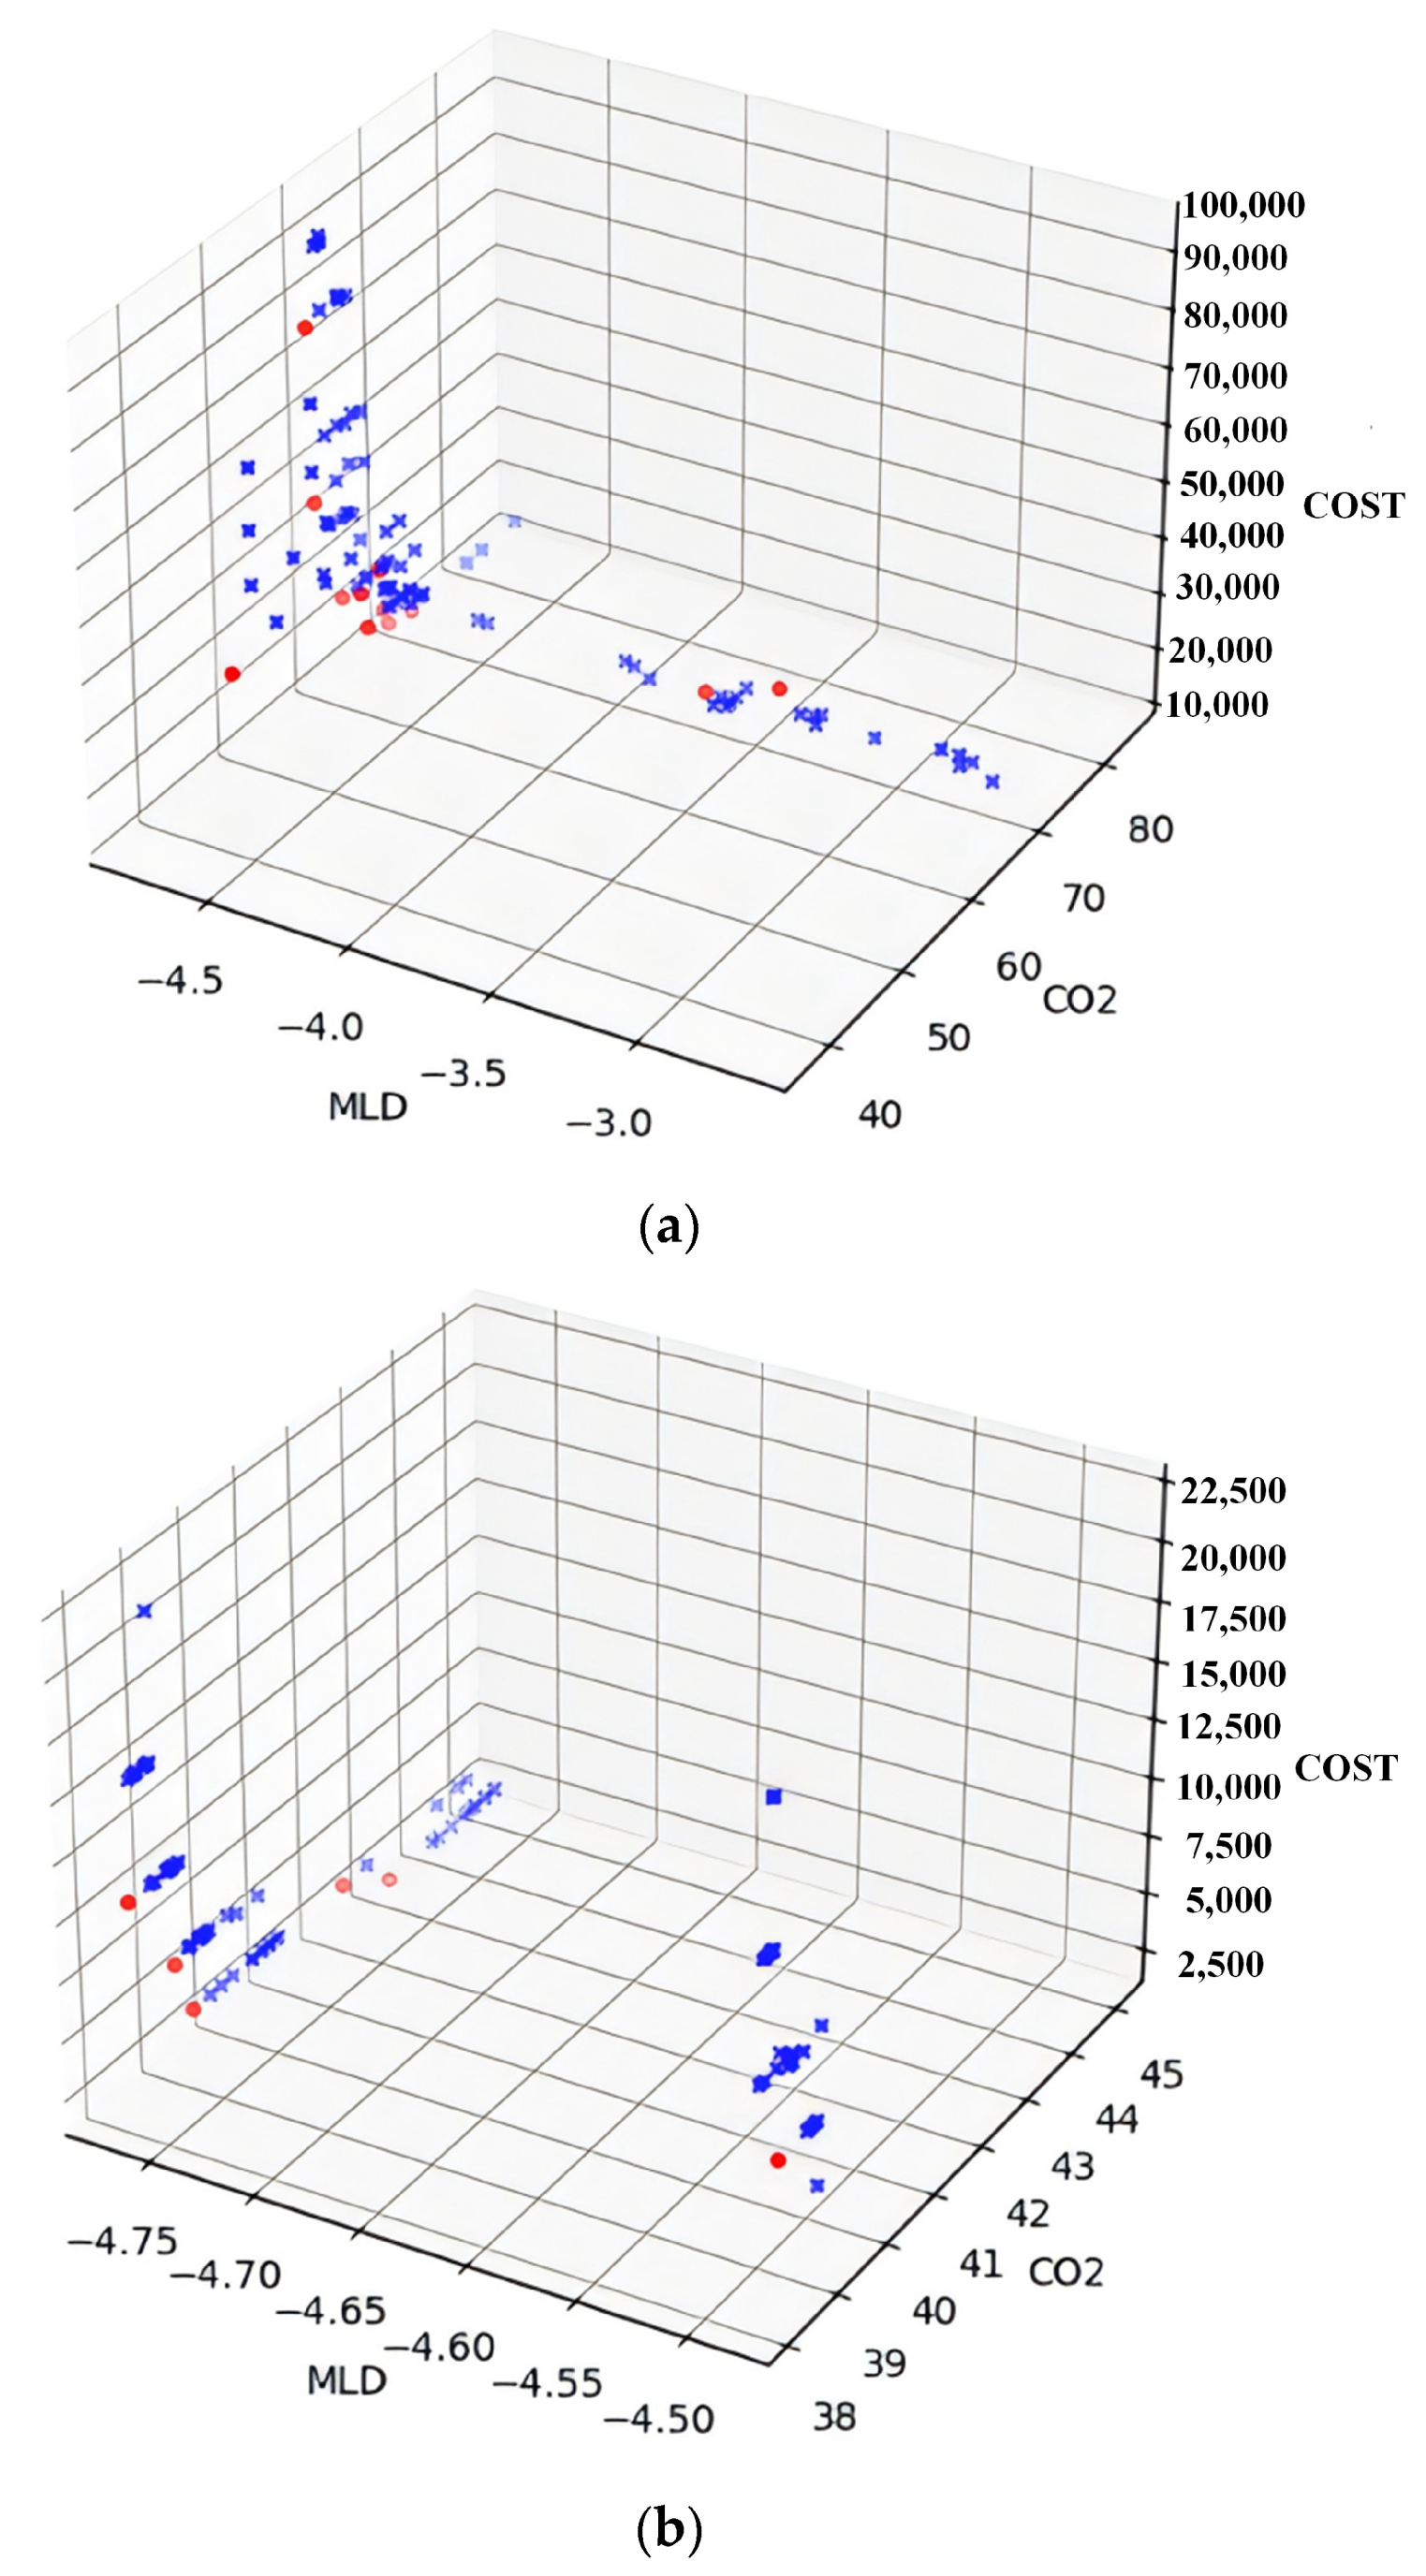
For the boundary area of Tongzhou and Chaoyang districts, two classical algorithms are also used to solve this paper. In the optimization of municipal waste recycling and transfer system in this area, 13 non-dominated solutions are obtained using the MOEAs and 6 non-dominated solutions are obtained by NSGA-II solutions for the following data:
Table 4 shows that the solutions found by NSGA-II algorithm generally perform better than the MOEA on the three objective functions. Figure 8 shows that the elite solutions are evenly distributed in the MOEA, while the NSGA-II algorithm has a concentrated distribution of elite solutions when searching in the objective function space, converges faster, and has better performance in finding the optimal solution. Figure 9 below represents an optimization scheme of NSGA-II solution.
Table 4.
Experimental results for the border area of Tongzhou District and Chaoyang District.
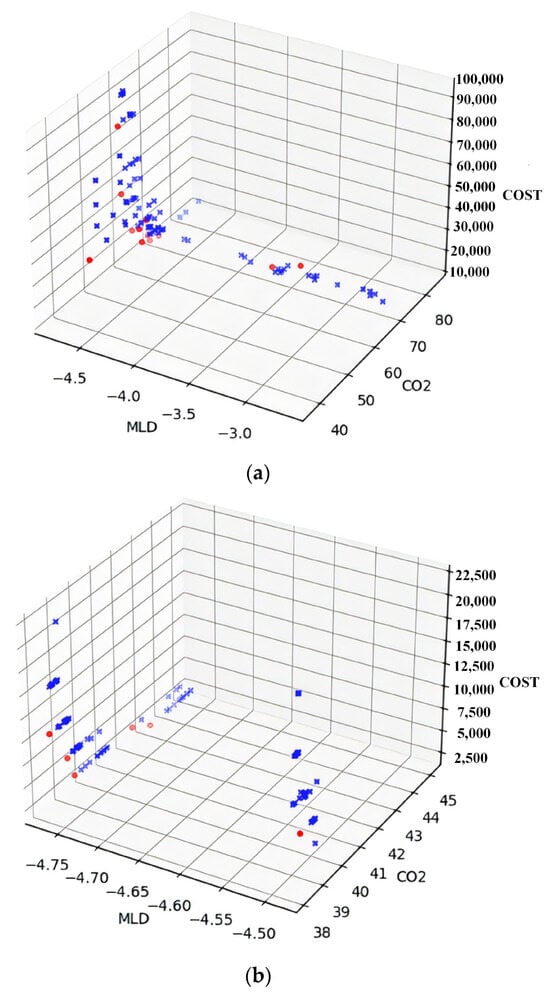
Figure 8.
Comparison of algorithms’ search on the objective function space. (a) The solutions obtained using the MOEA are distributed across boundary of Tongzhou and Chaoyang. (b) The solutions obtained using the NSGA-II are distributed across boundary of Tongzhou and Chaoyang.

Figure 9.
Map of the solution scheme in Chaoyang District, Tongzhou District.
4.2.3. Performance of the Evolution Algorithm
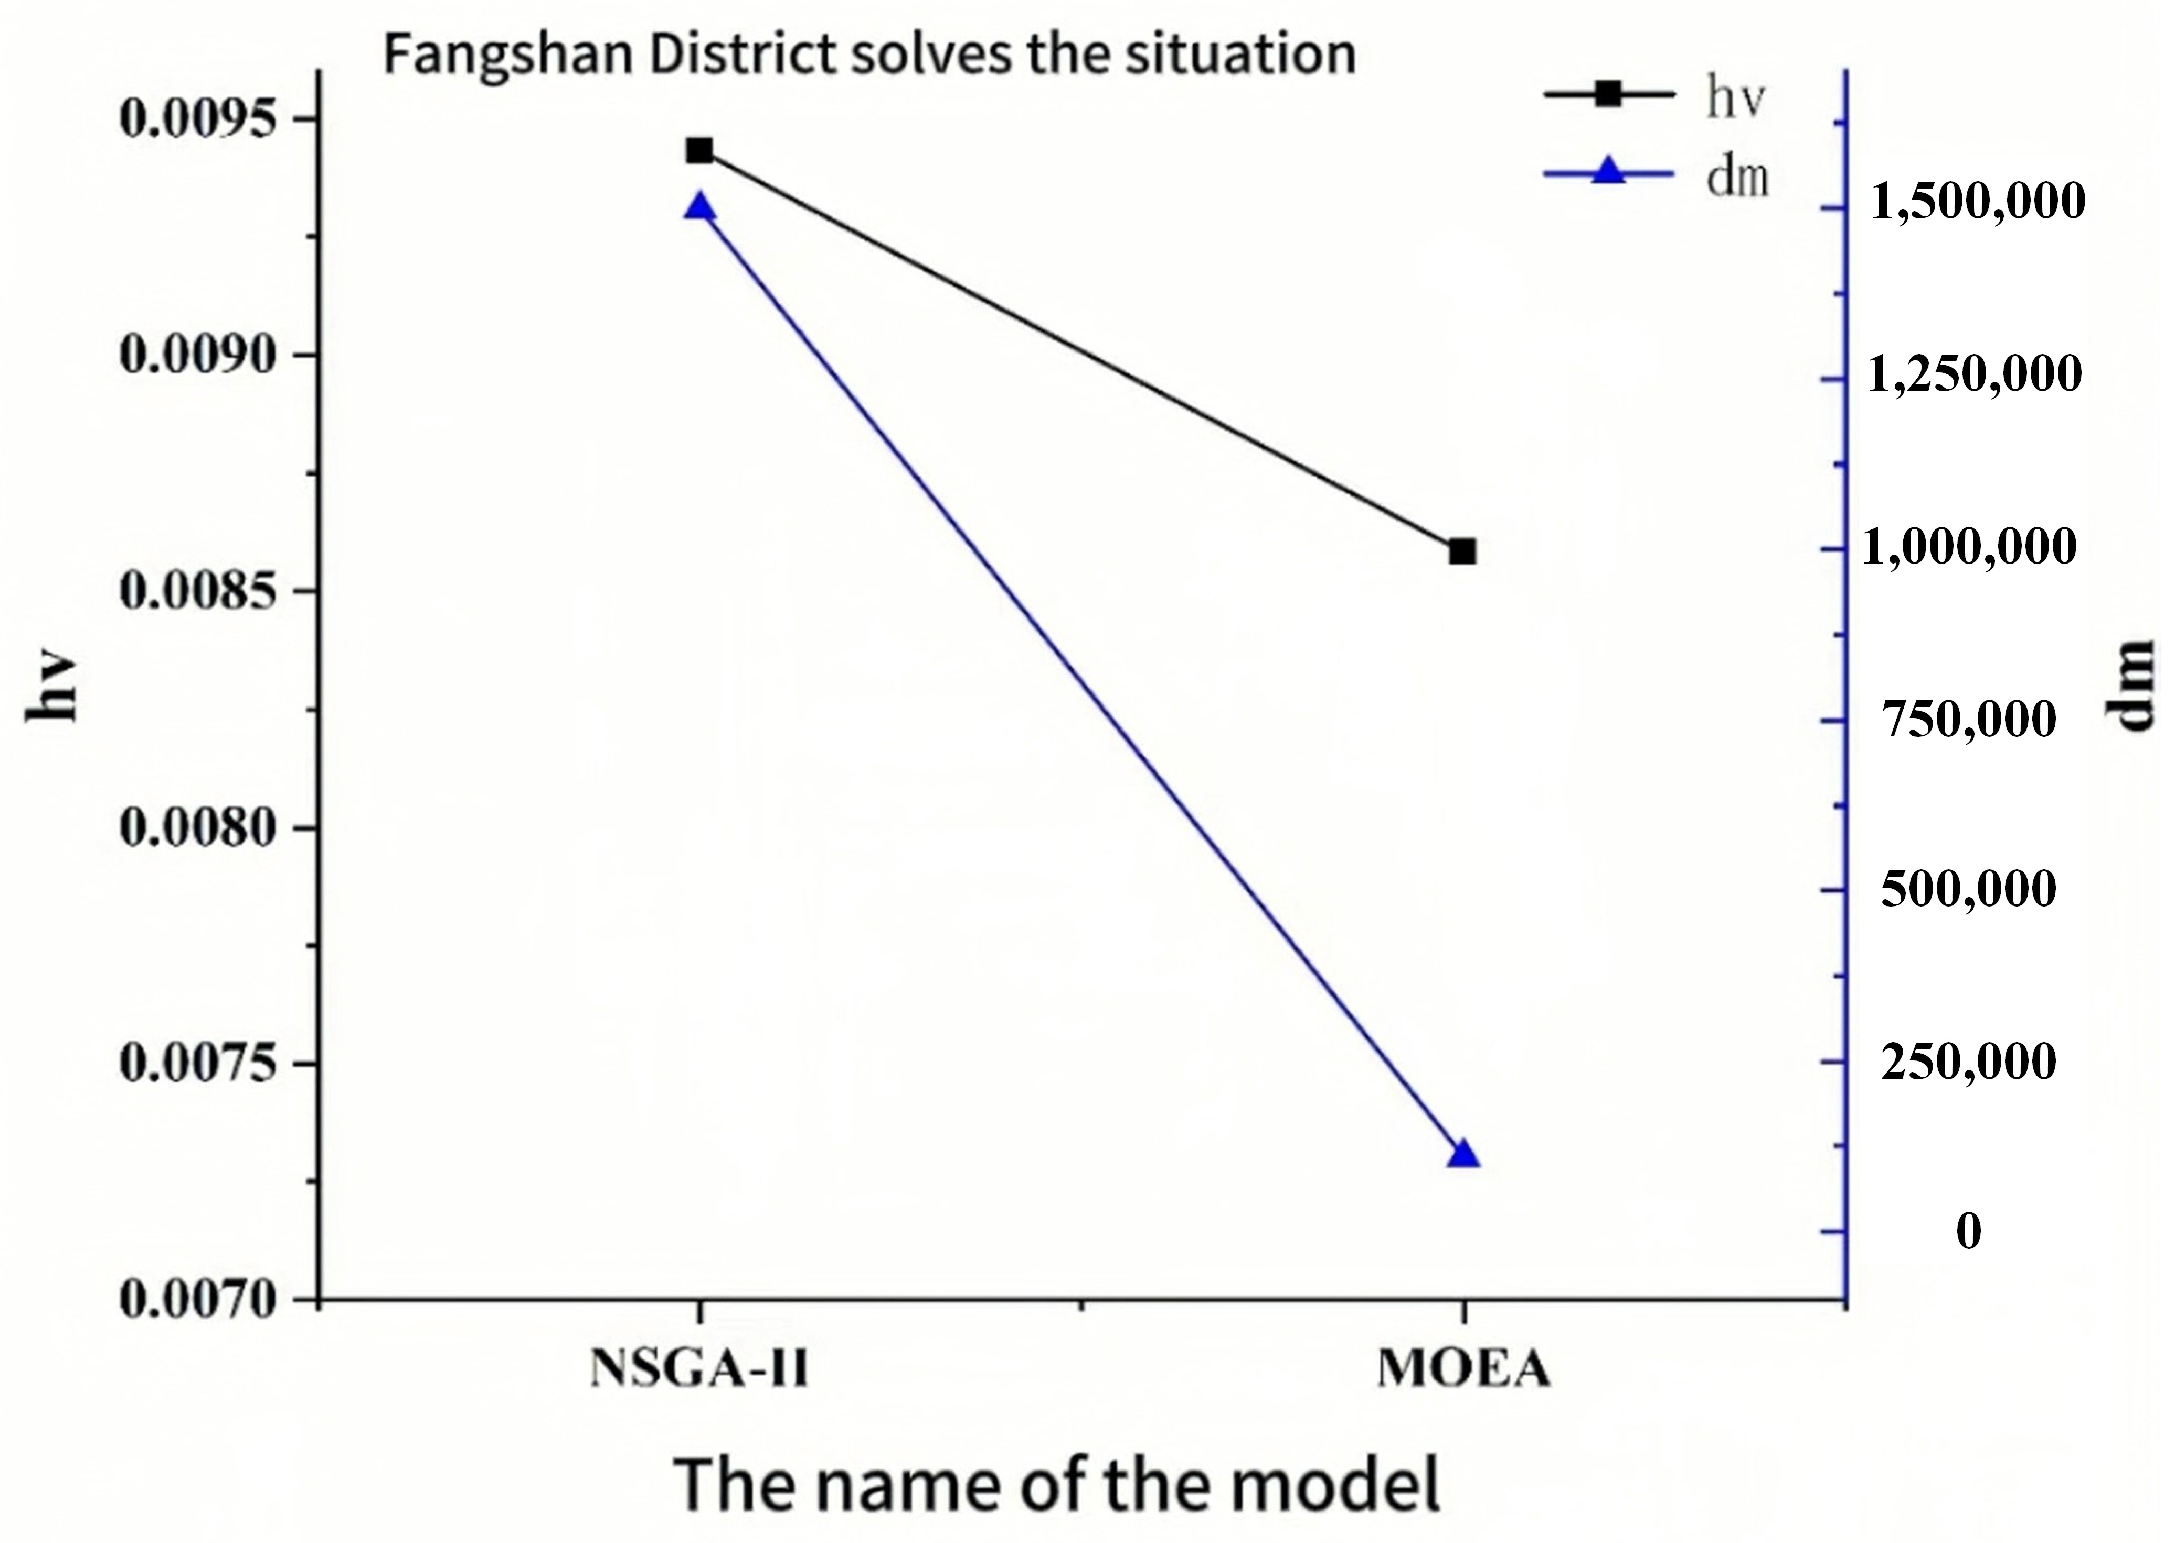
The multi-objective evolutionary algorithm can be evaluated based on both the convergence ability and its ability to find the diversity of solutions. The former reflects how closely the final solution approximates the global optimal solution, while the latter indicates the distribution of the solution found. In this paper, HV (super volume synthesis index) and DM (diversity metric) are selected as evaluation metrics. Figure 10 and Figure 11 show the performance of the algorithm on two example problems. For both HV and DM metrics, larger values indicate better performance. As seen in the figures, the NSGA-II algorithm outperforms the MOEA in both performance evaluation metrics, aligning with our expectations regarding algorithm performance.
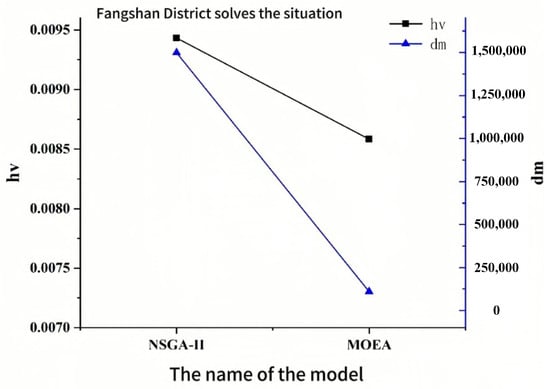
Figure 10.
Comparison of the performance of the algorithms studied in Fangshan District.
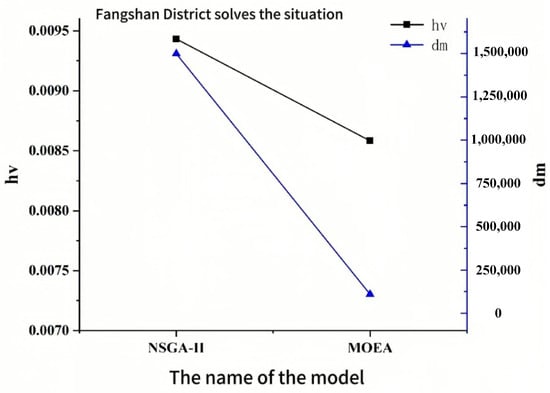
Figure 11.
Boundary algorithm performance comparison between Chaoyang District and Tongzhou District.
4.3. Research Limitations
Despite achieving certain results in constructing a high-precision waste generation prediction model and optimizing the municipal solid waste recycling and transfer system in Beijing, this study still faces several limitations and potential avenues for future improvement.
4.3.1. Data Collection and Processing
- Time range of data: The dataset utilized in this research spans from 2012 to 2020; however, changes due to urbanization processes and socio-economic factors may suggest that longer-term data could better reflect trends. Future studies should consider employing datasets with extended timeframes to enhance the robustness of the models.
- Data quality and timeliness: While efforts were made to ensure data quality, real-world applications may still be influenced by various factors affecting data timeliness and accuracy. For instance, nighttime light data can be impacted by weather conditions or seasonal variations. Therefore, it is crucial to continuously improve methods for data collection and processing to ensure both accuracy and timeliness.
- Expansion of data dimensions: This study primarily focused on the five key factors; however, other potential influencing elements such as changes in residents’ lifestyles or demographic age structures may also significantly impact waste generation. Future research could further explore these aspects and incorporate them into the models to enhance predictive accuracy.
4.3.2. Model Selection and Tuning
- Generalization capability of models: Although gradient boosting regression (GBR) demonstrated excellent performance in this study, its generalization capability across different cities or time points requires further validation. Subsequent research could apply this model in other urban contexts or regions to assess its adaptability and generalizability.
- Automation of hyperparameter tuning: This study improved model performance via manual hyperparameter tuning; however, this process demands substantial human effort and computational resources. Future work might benefit from integrating automated tools (such as GridSearchCV or RandomizedSearchCV) for more systematic hyperparameter optimization, thereby enhancing efficiency and effectiveness.
4.3.3. Multi-Objective Optimization Algorithms
- Selection and comparison of algorithms: This research primarily compared two multi-objective optimization algorithms—MOEA (multi-objective evolutionary algorithm) and NSGA-II (non-dominated sorting genetic algorithm II)—yet many advanced alternatives (such as SPEA2 or MOEA/D) remain unexamined. Future investigations should compare a broader range of algorithms to identify those best suited for specific problems.
- Diversity and flexibility of solutions: While NSGA-II excels in convergence ability along with solution quality, there are instances where the diversified solutions provided by the MOEAs may offer advantages. Further studies could explore how to combine the strengths of both algorithms into new hybrid approaches that simultaneously enhance convergence capabilities while maintaining solution diversity.
5. Conclusions
This study introduces nighttime light remote sensing data and integrates traditional urban metrics, such as GDP and per capita consumption, to construct an innovative indicator system for accurately predicting waste generation in Beijing. Six machine learning regression algorithms—linear regression, support vector machines, random forests, elastic net, Bayesian ridge regression, and gradient boosting regression—were employed for modeling. Experimental results indicate that the gradient boosting regression algorithm exhibited the best predictive performance, achieving an R2 value of 0.99 and a prediction accuracy of 92%. This high-precision model provides a solid data-driven foundation for forecasting future waste production in Beijing and optimizing resource allocation.
Furthermore, this research models Beijing’s municipal waste collection and transportation system as a multi-objective location-routing problem, considering three key optimization objectives: customer residential experience, cost efficiency, and environmental impact. By incorporating fluctuations in household waste generation and normally distributed stochastic perturbations, the model enhances its realism. Case studies in the boundary areas between Fangshan District and Tongzhou District, utilizing road network data and Google Maps, identified potential site centers and service points, establishing a high-quality dataset for waste generation predictions.
To address the location-routing issue effectively, we applied multi-objective evolutionary algorithms (MOEAs) and the non-dominated sorting genetic algorithm II (NSGA-II) for optimization design. The solutions proposed by the NSGA-II algorithm excelled in terms of environmental sustainability, economic savings, and resident satisfaction. These optimized solutions provide robust support for refining Beijing’s municipal waste collection and transportation system, enhancing waste management efficiency, reducing resource wastage, and improving overall operational effectiveness.
Moreover, the models and optimization strategies presented in this study offer scientific decision-making foundations for government agencies and relevant departments. They facilitate more effective policy measures and serve as references for other cities facing similar challenges. Specifically, this study demonstrates how data-driven decision-making methods can be applied within urban governance contexts to achieve rational resource distribution, lower costs, and enhance residents’ quality of life, thereby mitigating environmental pollution and promoting sustainable urban development.
In summary, this study makes significant contributions to the scientific rigor and sustainability of urban waste management practices. It not only enhances the precision of waste generation predictions but also provides practical, data-driven solutions for optimizing waste collection and transportation systems, ultimately contributing to more efficient and sustainable urban management.
Author Contributions
Methodology, J.X.; Software, J.X.; Validation, J.X.; Formal analysis, Y.L.; Investigation, Y.L.; Data curation, G.Z.; Writing—original draft, J.X.; Writing—original draft, H.Y.; Writing—review & editing, G.Z.; Visualization, Y.L.; Supervision, G.Z. All authors have read and agreed to the published version of the manuscript.
Funding
This research was funded by the Fundamental Research Funds for the Central Universities, China, grant number 2652019028.
Institutional Review Board Statement
Not applicable.
Informed Consent Statement
Not applicable.
Data Availability Statement
The raw data supporting the conclusions of this article will be made available by the authors on request.
Conflicts of Interest
The authors declare no conflict of interest.
Abbreviations
| Abbreviations | Full Name |
| MSW | Municipal solid waste |
| MOEAs | Multi-objective evolutionary algorithms |
| NSGA-II | Non-dominated sorting genetic algorithm II |
| GDP | Gross domestic product |
| NPP-VIIRS | National Polar-orbiting Partnership—Visible Infrared Imaging Radiometer Suite |
| MLR | Multiple linear regression |
| BRR | Bayesian ridge regression |
| SVR | Support vector regression |
| ENR | Elastic net regression |
| GBR | Gradient boosting regression |
| RF | Random forest |
| sumNTL | Sum of nighttime light |
| meanNTL | Mean of nighttime light |
| Symbol Definitions | |
| Symbols | Definition |
| Cus | The set of garbage generating nodes to be served |
| Center | Collection of available sites for waste disposal centers |
| Car | Collection of garbage collection carts available for use |
| N(Car/Center/Cus) | Collection of generation nodes, treatment centers and waste collection vehicles included in the generation scheme |
| i,j | Can represent the central node for waste generation and disposal, i.e., i,j ϵ Cus∪Center |
| disij | Distance between the node i and the node j |
| timeij | Travel time between the node i and the node j |
| Capacity of the vehicle i | |
| The amount of garbage already in the vehicle at the time it leaves the node | |
| uL | Collection of nodes where vehicles return midway to unload |
| uLtmi | Time spent unloading vehicles at i node |
| MSWi | The garbage yield of the node i, which is the true quantity after perturbation of the normal distribution |
| Servi | At the service time of the node i, this value is set to a fixed value |
| Saly | Hourly rate for drivers working hours (8 h per day) |
| Salyo | The driver’s hourly rate during overtime hours is set at two times the normal hourly rate. |
| δ | Cost of operating each waste collection vehicle |
| mi | Cost of opening each waste disposal center |
| CO2 | The amount of CO2 emitted per unit kilometer from a garbage collection vehicle |
References
- Tirkolaee, E.B.; Abbasian, P.; Weber, G.W. Sustainable fuzzy multi-trip location-routing problem for medical waste management during the COVID-19 outbreak. Sci. Total Environ. 2021, 756, 143607. [Google Scholar] [CrossRef] [PubMed]
- Yu, X.; Zhou, Y.; Liu, X.-F. The two-echelon multi-objective location routing problem inspired by realistic waste collection applications: The composable model and a metaheuristic algorithm. Appl. Soft Comput. 2020, 94, 106477. [Google Scholar] [CrossRef]
- Hoque, M.M.; Rahman, M.T.U. Landfill area estimation based on solid waste collection prediction using ANN model and final waste disposal options. J. Clean. Prod. 2020, 256, 120387. [Google Scholar] [CrossRef]
- Rabani, M.; Manavizadeh, N.; Boostani, A.; Aghamohamadi, S. A multiobjective model for the residential waste collection location-routing prob- m with time windows. J. Ind. Syst. Eng. 2020, 12, 227–241. [Google Scholar]
- Sakti, S.; Yu, V.F.; Sopha, B.M. Heterogeneous fleet location routing problem for waste management: A case study of yogyakarta, indonesia. Int. J. Inf. Manag. Sci. 2019, 30, 1–16. [Google Scholar]
- Yazdani, M.; Kabirifar, K.; Frimpong, B.E.; Shariati, M.; Mirmozaffari, M.; Boskabadi, A. Improving construction and demolition waste collection service in an urban area using a simheuristic approach: A case study in sydney, australia. J. Clean. Prod. 2021, 280, 124138. [Google Scholar] [CrossRef]
- Tirkolaee, E.B.; Mahdavi, I.; Esfahani, M.M.S.; Weber, G.-W. A robust green location-allocation-inventory problem to design an urban waste management system under uncertainty. Waste Manag. 2020, 102, 340–350. [Google Scholar] [CrossRef]
- Valizadeh, J. A novel mathematical model for municipal waste collection and energy generation: Case study of kermanshah city. Manag. Environ. Qual. Int. J. 2020, 31, 1437–1453. [Google Scholar] [CrossRef]
- Rad, R.S.; Nahavandi, N. A novel multi-objective optimization model for integrated problem of green closed loop supply chain network design and quantity discount. J. Clean. Prod. 2018, 196, 1549–1565. [Google Scholar]
- Trang, P.T.T.; Dong, H.Q.; Toan, D.Q.; Hanh, N.T.X.; Thu, N.T. The Effects of Socio-economic Factors on Household Solid Waste Generation and Composition: A Case Study in Thu Dau Mot, Vietnam. Energy Procedia 2017, 107, 253–258. [Google Scholar] [CrossRef]
- Ma, J.; Hipel, K.W.; Hanson, M.L.; Cai, X.; Liu, Y. An Analysis of Influencing Factors on Municipal Solid Waste Source-Separated Collection Behavior in Guilin, China by Using the Theory of Planned Behavior. Sustain. Cities Soc. 2017, 37, 336–343. [Google Scholar] [CrossRef]
- Ancuceanu, R.; Dinu, M.; Neaga, I.; Laszlo, F.G.; Boda, D. Development of QSAR machine learning-based models to forecast the effect of substances on malignant melanoma cells. Oncol. Lett. 2019, 17, 4188–4196. [Google Scholar] [CrossRef] [PubMed]
- Ayeleru, O.O.; Okonta, F.N.; Ntuli, F. Municipal solid waste generation and characterization in the City of Johannesburg: A pathway for the implementation of zero waste. Waste Manag. 2018, 79, 87–97. [Google Scholar] [CrossRef] [PubMed]
- Mushtaq, J.; Dar, A.Q.; Ahsan, N. Spatial–temporal variations and forecasting analysis of municipal solid waste in the mountainous city of north-western Himalayas. SN Appl. Sci. 2020, 2, 1161. [Google Scholar] [CrossRef]
- Estay-Ossandon, C.; Mena-Nieto, A.; Harsch, N. Using a fuzzy TOPSIS-based scenario analysis to improve municipal solid waste planning and forecasting: A case study of Canary archipelago (1999–2030). J. Clean. Prod. 2018, 176, 1198–1212. [Google Scholar] [CrossRef]
- Singh, A. Solid waste management through the applications of mathematical models. Resour. Conserv. Recycl. 2019, 151, 104503. [Google Scholar] [CrossRef]
- Sunayana; Kumar, S.; Kumar, R. Forecasting of municipal solid waste generation using non-linear autoregressive (NAR) neural models. Waste Manag. 2021, 121, 206–214. [Google Scholar] [CrossRef] [PubMed]
- Chu, Y.; Huang, C.; Xie, X.; Tan, B.; Kamal, S.; Xiong, X. Multilayer Hybrid Deep-Learning Method for Waste Classification and Recycling. Comput. Intell. Neurosci. 2018, 2018, 5060857. [Google Scholar] [CrossRef]
- Xi, C.; William, N. A Test of the New VIIRS Lights Data Set: Population and Economic Output in Africa. Remote Sens. 2015, 7, 4937–4947. [Google Scholar] [CrossRef]
- Johnson, N.E.; Ianiuk, O.; Cazap, D.; Liu, L.; Starobin, D.; Dobler, G.; Ghandehari, M. Patterns of waste generation: A gradient boosting model for short-term waste prediction in New York City. Waste Manag. 2017, 62, 3. [Google Scholar] [CrossRef]
- Nguyen, X.C.; Nguyen, T.T.H.; La, D.D.; Kumar, G.; Rene, E.R.; Nguyen, D.D.; Chang, S.W.; Chung, W.J.; Nguyen, X.H.; Nguyen, V.K. Development of machine learning—Based models to forecast solid waste generation in residential areas: A case study from Vietnam. Resour. Conserv. Recycl. 2021, 167, 105381. [Google Scholar] [CrossRef]
- Kannangara, M.; Dua, R.; Ahmadi, L.; Bensebaa, F. Modeling and prediction of regional municipal solid waste generation and diversion in Canada using machine learning approaches. Waste Manag. 2018, 74, 3. [Google Scholar] [CrossRef] [PubMed]
- Zhang, C.; Dong, H.; Geng, Y.; Liang, H.; Liu, X. Machine learning based prediction for China’s municipal solid waste under the shared socioeconomic pathways. J. Environ. Manag. 2022, 312, 114918. [Google Scholar] [CrossRef] [PubMed]
- Alidoust, P.; Keramati, M.; Hamidian, P.; Amlashi, A.T.; Gharehveran, M.M.; Behnood, A. Prediction of the shear modulus of municipal solid waste (MSW): An application of machine learning techniques. J. Clean. Prod. 2021, 303, 127053. [Google Scholar] [CrossRef]
- Zhao, M.; Cheng, W.; Zhou, C.; Li, M.; Wang, N.; Liu, Q. GDP Spatialization and Economic Differences in South China Based on NPP-VIIRS Nighttime Light Imagery. Remote Sens. 2017, 9, 673. [Google Scholar] [CrossRef]
- He, M.; Xu, Y.; Li, N. Population Spatialization in Beijing City Based on Machine Learning and Multisource Remote Sensing Data. Remote Sens. 2020, 12, 1910. [Google Scholar] [CrossRef]
- Zhao, J.; Verter, V. A bi-objective model for the used oil location-routing problem. Comput. Oper. Res. 2014, 62, 157–168. [Google Scholar] [CrossRef]
- Asefi, H.; Lim, S.; Maghrebi, M.; Shahparvari, S. Mathematical modeling, and heuristic approaches to the location-routing problem of a cost-effective integrated solid waste management. Ann. Oper. Res. 2019, 273, 75–110. [Google Scholar] [CrossRef]
- Niu, Y.; Kong, D.; Wen, R.; Cao, Z.; Xiao, J. An improved learnable evolution model for solving multi-objective vehicle routing problem with stochastic demand. Knowl.-Based Syst. 2021, 230, 107378. [Google Scholar] [CrossRef]
- Dukkanci, O.; Kara, B.Y.; Bektas, T. The green location-routing problem. Comput. Oper. Res. 2019, 105, 187–202. [Google Scholar] [CrossRef]
- Liu, B.; Zhang, L.; Wang, Q. Demand gap analysis of municipal solid waste landfill in Beijing: Based on the municipal solid waste generation. Waste Manag. 2021, 134, 42–51. [Google Scholar] [CrossRef] [PubMed]
- Li, S.; Xi, W.; Li, C.; Bi, T. Study on pollutant model construction and three-dimensional spatial interpolation in soil environmental survey. IOP Conf. Ser. Earth Environ. Sci. 2020, 467, 012154. [Google Scholar] [CrossRef]


Disclaimer/Publisher’s Note: The statements, opinions and data contained in all publications are solely those of the individual author(s) and contributor(s) and not of MDPI and/or the editor(s). MDPI and/or the editor(s) disclaim responsibility for any injury to people or property resulting from any ideas, methods, instructions or products referred to in the content. |
© 2024 by the authors. Licensee MDPI, Basel, Switzerland. This article is an open access article distributed under the terms and conditions of the Creative Commons Attribution (CC BY) license (https://creativecommons.org/licenses/by/4.0/).