Abstract
In recent years, additive manufacturing has been widely used in industrial, medical, and educational fields. Material extrusion is used in most industries to increase development efficiency and reduce costs. This study used the material extrusion to discuss the print quality of additive manufacturing and optimized the processing parameters based on material properties. Based on the literature, this study summarized the fishbone diagram influencing printing quality. The layer height, nozzle temperature, printing speed, infill pattern, and filling spacing were selected as the control factors of the Taguchi method. An orthogonal array L16 was used for parameter design. The optimal parameters were analyzed using the variance and the response surface method. The results of the study are as follows.
1. Introduction
Additive manufacturing, with its unique competitiveness, has advantages such as achieving manufacturing efficiency, producing complex structures, and reducing material waste, which have be challenges in traditional methods. It finds applications in various fields including automobiles, aerospace, medical appliances, and cultural and creative jewelry. Poor mechanical properties of products often occur in the additive manufacturing process. This leads to the breakage of mechanisms during assembly or actuation. Therefore, obtaining the best quality end products is very important.
In this study, the literature was collected first, and then the fishbone diagram was used to list the processing parameters affecting that affect the quality of the print. Based on the factor of nozzle gap height, extruder temperature, bed temperature, infill print head velocity, retraction velocity, Infill pattern, and fill spacing. Design parameter combinations in orthogonal table L16(45), 3D printing and analysis of the optimal parameters with the Taguchi method and the Response surface methodology. Its dimensional accuracy is optimal parameters: nozzle gap height 0.1 mm, extruder temperature 185 °C, bed temperature 75 °C, infill print head velocity 35 mm/s, retraction velocity 65 mm/s; and ultimate strength are nozzle gap height 0.1 mm, filling spacing 0.6 mm, Infill pattern triangular, infill print head velocity 35 mm/s, extruder temperature 220 °C. Finally, the dimensional accuracy is increased by 22.54%, and the ultimate strength is increased by 5.731 MPa. From the research results, the relationship between the factors of additive manufacturing, and it is expected that this research will contribute to the users of additive manufacturing.
The material extrusion technology is greatly affected by machine parameters, so the parameters must be selected correctly to enhance the quality characteristics [1]. Many parameters/factors in the additive manufacturing process influence products’ mechanical properties. Among these parameters/factors, nozzle gap height, fill spacing, infill print head velocity, and extruder temperature have a greater influence [2,3,4,5,6,7,8,9,10]. The influence of additive manufacturing processing parameters on the end products’ end properties is discussed using the Taguchi method to analyze the optimal combination of processing parameters [11,12,13]. Using Tensile testing, all results from defect observation, microstructural and mechanical properties confirmed the potential for WAAM process reuse [14,15,16,17,18].
Based on the aforementioned literature, research has only focused on individual outcomes. Compared to Refs. [1,2,5], they only study the mechanical properties of 3D printed products. Nowadays, the applications of 3D printing are extensive, so the dimensional accuracy of the finished products is certainly important. Therefore, this study investigates two experimental objectives: dimensional accuracy and Tensile strength, in order to obtain the optimal set of printing process parameters.
2. Materials and Methods
This paper is divided into four chapters, and its flowchart is shown in Figure 1.
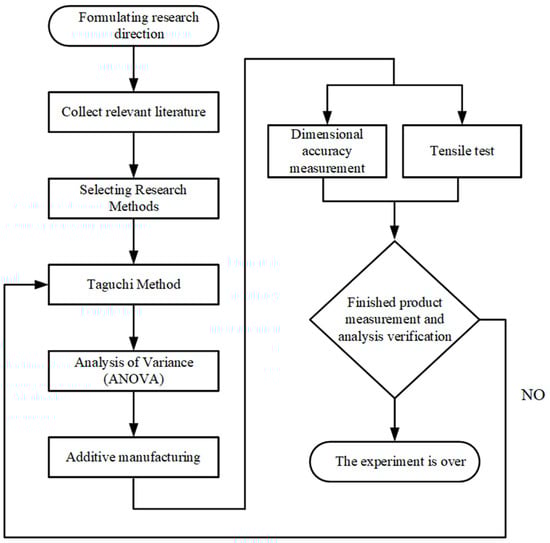
Figure 1.
Research Flowchart.
2.1. Experimental Materials
In this paper, PLA is used as the material for the experimental model. In addition, the properties of the material, such as water absorption, quality, degradation, and color, will affect the results. If other materials are used, the finished product will have different results. Compared to other materials, PLA has a lower shrinkage rate, resulting in less deformation, making it a suitable material for beginners. In 3D printing parameter settings, the general extruder temperature for PLA is between 180 to 210 °C, while the bed temperature is between 45 to 75 °C. The bed temperature speed is 25–55 mm/s.
2.2. Research Model
Various studies designed different experimental models to analyze the printing quality of FDM [19,20,21]. This study of dimensional accuracy experiment based on the circle’s outer diameter, the length, and width of the rectangle, the circular hole, the rectangular groove, thickness, and tip height, as shown in Figure 2. The experimental model in this study, as shown in Figure 1, features 40 measured dimensions, including circular outer diameter, rectangular length and width, circular holes, rectangular slots, thickness, and tip height, as listed in Table 1.
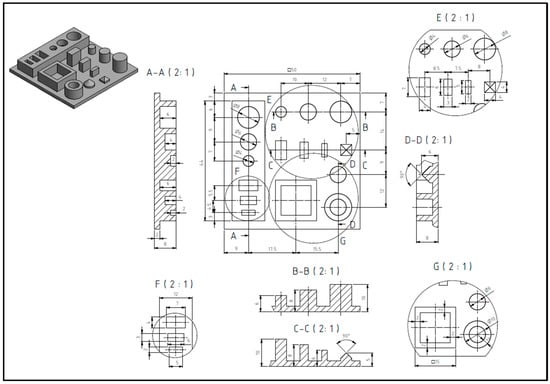
Figure 2.
Research Model Diagram.

Table 1.
Model Size Measurement Description Table.
This study used Autodesk Inventor 2022 drawing software to draw the model. The tensile test model design followed ASTM D638-10 Type I to study the tensile strength of Material extrusion [22], as shown in Figure 3. The processing parameter settings include nozzle gap height, extruder temperature, printing platform temperature, infill print head velocity, retraction speed, filling spacing, and infill pattern. The L16 orthogonal array of the Taguchi method is used for experiments to discuss the control factors’ influence on the products’ quality. After finding the optimized parameter combination, the response surface method is used for analysis. Then the optimal parameter combination of the response surface method is determined. The relevant experimental factors for improving the tensile strength are used for design and improvement. The optimal combination of parameters/factors is used for additive manufacturing, and the mechanical strength is analyzed. To verify the optimized parameter combination, they were compared with the experimental group’s results in the orthogonal array.
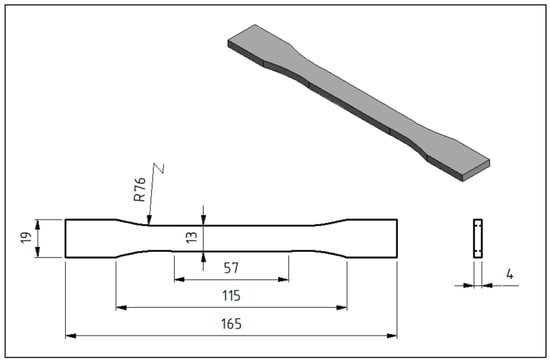
Figure 3.
Tensile test model.
2.3. Experimental Equipment
The Additive manufacturing used in this experiment was DUAL300, produced by Linkin Factory Co., Ltd. (Taoyuan City, Taiwan), and the material is polylactic acid (PLA). The water absorption, quality, degradation, and color may induce inaccurate test data. This is due to external variables during printing or experiments. These external variables included the fineness and quality of the end products or the strength calculation during the impact test. The slicing software uses PING SlicerV2.1 as the control software. The processing parameters were set up through the software, and the model sample was converted into G-code for model printing. The printer’s appearance is shown in Figure 4.
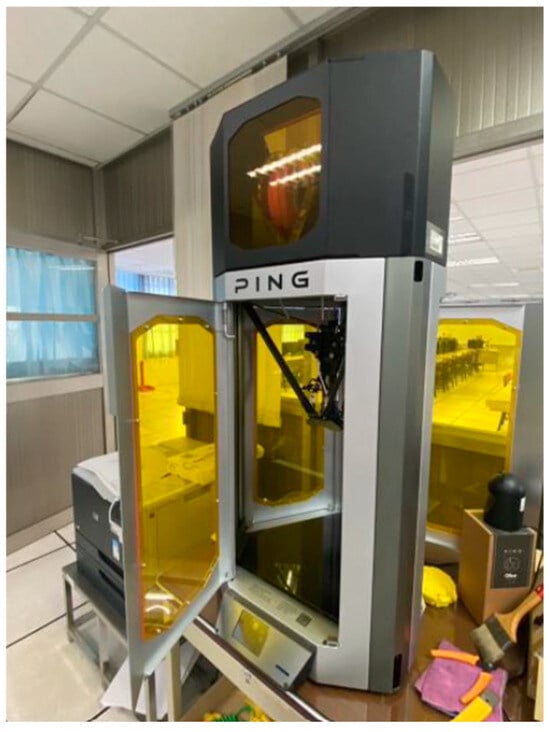
Figure 4.
Outside view of Additive manufacturing.
The prepared sample of standard specifications was put in a universal testing machine that can pull, press, and bend, as shown in Figure 5. After fixing the sample, a pulling force was applied to both ends until it breaks. The tensile test aims to test the strength and ductility of the material. The proportional limit, elastic limit, yield point, yield strength, tensile strength, elongation, and reduction of material area is obtained. When the load exceeds the yield point, the elongation increases greatly as the load increases, and the diameter decreases uniformly until the load increases to the ultimate stress. If the load of the ultimate stress is divided by the original cross-sectional area, the material’s tensile strength can be obtained. The unit is generally MPa, and the tensile strength is expressed as Equation (1):
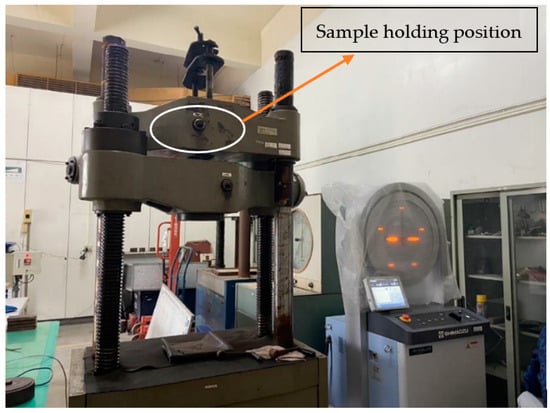
Figure 5.
Universal testing machine.
= Tensile strength [MPa], = load [N], = original sectionasl area [].
3. Results and Discussion
This section analyzes the dimensional accuracy and tensile strength of the print. The tensile strength of the end product requires improvement. It is analyzed through the tensile test. The data are collected and discussed at last. Afterward, five control factors are combined with the orthogonal array L16 (). This is to perform 16 printing experiments with different parameter combinations. This study uses the larger-the-better characteristic, which is expressed as Equation (2):
= larger-the-better characteristic S/N ratio, n = Number of experiments of each group, = experimental data of each group.
3.1. Taguchi Method
The Taguchi method mainly designs the orthogonal table by passing the control factors and horizontal strata, and cooperates with the S/N analysis and Analysis of Variance ANOVA to study the influence of design parameters on product quality, so as to obtain the optimal combination of parameters.
3.1.1. Taguchi Method of Dimensional Accuracy
Five control factors and four levels influencing the quality characteristics are selected. This study selected important parameters as the setting basis based on [9,10,11,12]. findings. These are nozzle gap height (mm), Extruder temperature (°C), bed temperature (°C), Infill print head velocity (mm/s), and retraction velocity (mm/s). The processing parameters are determined based on material’s characteristics, as shown in Table 2. The printing material used in this study is PLA. After the model is printed, measurements are taken for specific dimensions, and the values are converted into scores based on the measurement deviations. The scoring method for quality characteristics is detailed in Table 3. The recorded scores are used to calculate the S/N ratio for each group using Formula (2), as shown in Table 4. Five measurements were conducted, and the standard error of dimensional accuracy of fraction is ±0.0003.
Table 2.
Control factor level (Dimensional accuracy).
Table 3.
The scoring method for quality characteristics is detailed.
Table 4.
Dimensional accuracy and S/N ratio of each group (Dimensional accuracy).
From Table 5, It is possible to obtain a response table showing how various factors affect the dimensional accuracy of additive manufacturing. Figure 6 displays the response graph for each factor’s impact on the dimensional accuracy of additive manufacturing. In terms of quality characteristics, a larger S/N ratio indicates better quality characteristics. According to Figure 6 and Table 5, the optimal factor level combination is A1 B1 C4 D2 E3, with a layer height of 0.1 mm, nozzle temperature of 185 °C, print platform temperature of 75 °C, print speed of 35 mm/s, and retraction speed of 65 mm/s.
Table 5.
Response table of factors to S/N ratio (Dimensional accuracy).
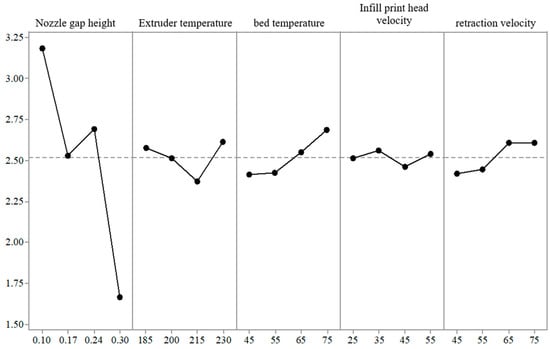
Figure 6.
Response diagram of factors to S/N ratio (Dimensional accuracy).
Through Table 5, we can see the effect of each factor on dimensional accuracy. The greater the factor effect, the larger the impact on the experimental results. From the table, it can be observed that Factor A (layer height) has a significant impact on the dimensional accuracy of additive manufacturing, while Factor D (printing speed) has a relatively smaller effect on dimensional accuracy.
3.1.2. Taguchi Method of Tensile Strength
Five control factors and four levels influencing the quality characteristics are selected. This study selected important parameters as the setting basis based on [9,10,11,12]. These are nozzle gap height (mm), fill spacing (mm), infill pattern, infill print head velocity (mm/s), and extruder temperature (°C). The printing material used in this study is PLA. The processing parameters are determined based on material’s characteristics, as shown in Table 6. After the model is printed, the universal tensile testing machine is used for the tensile strength experiment. The experimental data are recorded, and the S/N ratio of each group is calculated, as shown in Table 7. Five measurements were conducted, and the standard error of tensile strength is ±0.6 MPa.
Table 6.
Control factor level (Tensile strength).
Table 7.
Tensile strength and S/N ratio of each group (Tensile strength).
Table 8 is the response table of the factors to the maximum tensile strength of the print and Figure 7 is the response graph of the factors to the maximum tensile strength of the print. Among them, experimental error in tensile strength is ±10%, and this data is provided by the manufacturer. Regarding the latter-the-better quality characteristic, a larger S/N ratio represents a better quality characteristic. According to Table 8, the optimal factor level combination is A1 B1 C3 D2 E4. Specifically, the nozzle gap height of 0.1 mm, fill spacing of 0.6 mm, infill pattern triangle, infill print head velocity of 35 mm/s, and extruder temperature of 220 °C.
Table 8.
Response table of factors to S/N ratio (Tensile strength).
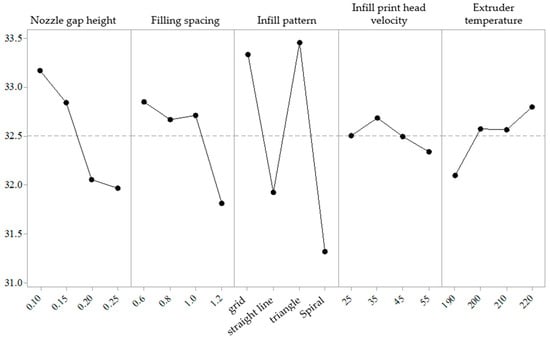
Figure 7.
Response diagram of factors to S/N ratio (Tensile strength).
The response factor table in Table 8 shows the effect of the factors on tensile strength. The greater the factorial effect, the greater the influence on the experimental results. According to the table, factor C (Infill pattern) has a greater effect on the maximum tensile strength of the print. In contrast, factor D (infill print head velocity) has less effect on the maximum tensile strength of the print.
3.2. ANOVA
ANOVA is to analyze the error values and factors of the experimental results and the significance of the experimental errors. The second purpose of the ANOVA is to test the significance of each factor. The analytical method was the F-test. When the F-number is very large, the sample space is altered, which means that the control factor is influential.
3.2.1. ANOVA of Dimensional Accuracy
The factors with small contributions are not considered in the experiment for evaluating the errors. First, this study performs the S/N ratio variation analysis for the control factors, as shown in Table 9. It can be observed that factor D (infill print head velocity) has a lower influence than the other factors. The analysis values of the second S/N ratio variation analysis are shown in Table 10.
Table 9.
The first S/N ratio variation analysis (Dimensional accuracy).
Table 10.
The Second S/N ratio variation analysis (Dimensional accuracy).
According to the ρ% in Table 10, factor A (Nozzle gap height) significantly affects the print’s dimensional accuracy. Whereas factor E (Retraction velocity) has no significant effect. The ρ% value of factor A (Nozzle gap height) is 91.34%, followed by factor C (Bed temperature) at 3.79%. The ρ% value of factor B (Extruder temperature) is 2.50% with a confidence level of 90%, indicating an influential factor. According to Literature 1, only three parameters, namely build orientation, nozzle diameter, and infill density, were statistically significant. In the future, these parameters can be combined with the parameters from this article for research, which means the control factors will be build orientation, nozzle diameter, infill density, nozzle gap height, extruder temperature, and bed temperature.
ANOVA is to compare the differences between groups and within groups. In other words, the differences between groups should be as large as possible, and the differences within groups should be minimized to draw a conclusion of significant difference. Therefore, some refer to the difference between groups as treatment variance, while the difference within groups is considered error. The error in Table 10 refers to the difference within groups.
3.2.2. ANOVA of Tensile Strength
The factors with small contributions are not considered in the experiment for evaluating the errors. First, this study performs the S/N ratio variation analysis for the control factors, as shown in Table 11. It can be observed that factor D (infill print head velocity) has a lower influence than the other factors. The analysis values of the second S/N ratio variation analysis are shown in Table 12.
Table 11.
The first S/N ratio variation analysis (Tensile strength).
Table 12.
The Second S/N ratio variation analysis (Tensile strength).
According to the ρ% in Table 5, factor C (Infill pattern) significantly affects the print’s tensile strength. Whereas factor E (extruder temperature) has no significant effect. The ρ% value of factor C is 62.93%, followed by factor A (nozzle gap height) at 19.60%. The ρ% value of factor B (fill spacing) is 12.50% with a confidence level of 95%, indicating an influential factor.
3.3. RSM
The Response Surface Method collects experimental data through statistical methods and uses mathematical calculations to find the relationship between an independent variable in multiple parameters and a response variable. The aim is to analyze the rules between the test indicator (response variable y) and each factor. The relationship between the independent variable and the response variable is studied to find the optimal combination of factor levels (optimized process parameters).
3.3.1. RSM of Dimensional Accuracy
The three factors with the highest F values in the above variation analysis results are used as the design variables of the response surface method. These are A (Nozzle gap height (X1)), B (Extruder temperature (X2)), and C (Bed temperature (X3)). The parameters of the levels are shown in Table 13. The levels of the factors are performed by the Central Composite Design. The levels of the factors are converted into 20 orthogonal arrays. After printing the model, use a caliper to measure the dimensions and record the data. In addition, the experiment was repeated three times and the average was taken. The results are shown in Table 14. The model of Minitab17 is used for analysis. A second-order regression model of the dimensional accuracy score is built. The regression model coefficients are shown in Table 15.
Table 13.
Response Surface Method (RSM) Level Parameter Design (Dimensional accuracy).
Table 14.
Design results of Response Surface Method (Dimensional accuracy).
Table 15.
Regression model coefficients (Dimensional accuracy).
The regression coefficients are shown in the second line of Table 15. The multinomial regression equation can be obtained by adding the variable and cross terms, expressed as Equation (3):
Y = −663 + 5 X1 + 1.86 X2 + 5.24 X3 − 71.2 X12 − 0.00199 X22 − 0.01030 X32 + 0.713 X1 × X2 − 0.212 X1 × X3 − 0.00713 X × X3
Y = dimensional accuracy of fraction, X1 = Nozzle gap height [mm], X2 = Extruder temperature [°C], X3 = Bed temperature [°C].
Given the general p value of 0.05, the variable term has a significant effect on the experimental results if the p value is smaller than 0.05. Table 15 shows that the Nozzle gap height (X1) and Bed temperature (X3) are the factors with an interaction. They significantly affect the dimensional accuracy of the print.
The response surface plot is drawn using the Minitab program, as shown in Figure 8. It is observed in Figure 8a that at extruder temperature and bed temperature and smaller nozzle gap height, the dimensional accuracy is higher. While at bed temperature and nozzle gap height and larger extruder temperature, the dimensional accuracy is higher. According to Figure 8b, the dimensional accuracy is higher at extruder temperature and bed temperature and a smaller nozzle gap height. When the extruder temperature and nozzle gap height are fixed, and lower bed temperature, dimensional accuracy is higher. In Figure 8c, the dimensional accuracy is higher when the nozzle gap height and bed temperature are fixed with larger extruder temperature. The dimensional accuracy is higher at a fixed nozzle gap height and extruder temperature with lower bed temperature.
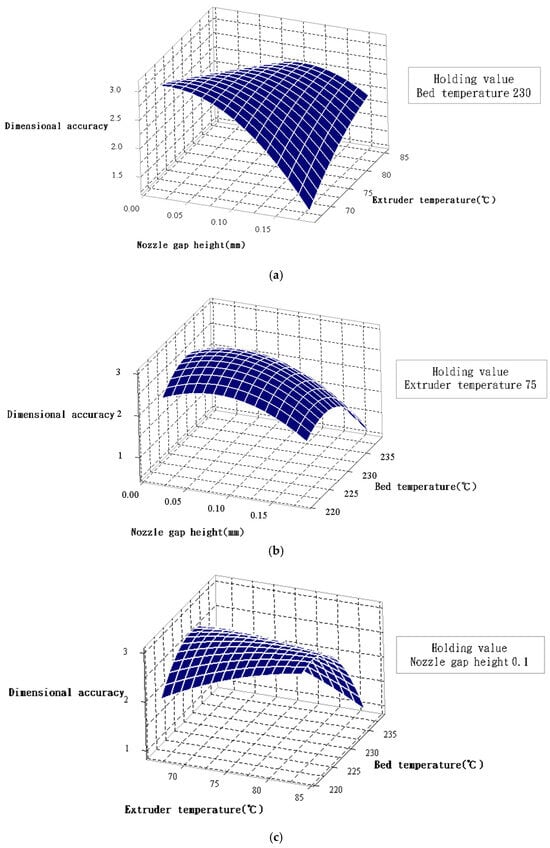
Figure 8.
Factor contour diagram (Dimensional accuracy). (a) Contour diagram of Dimensional accuracy versus Extruder temperature and Nozzle gap height. (b) Contour diagram of Dimensional accuracy versus bed temperature and Nozzle gap height. (c) Contour diagram of Dimensional accuracy versus bed temperature and Extruder temperature.
A single-factor experiment is used for analysis to verify the existence of an optimal combination of printing parameters for the maximum dimensional accuracy. A total of 25 experimental groups were designed. A single factor/parameter is changed at a time. The relationships of the factors are analyzed. The optimal parameters of various groups were compared, and then five parameters were combined. These are verified optimal process parameters for printing. The parameters are designed according to the Taguchi and the response surface methods, as shown in Table 16.
Table 16.
Single-factor experiment control levels (Dimensional accuracy).
A total of 25 experiments were performed based on parameter combinations. The results are shown in Table 17. The calculation results show that the optimal parameter combination is A1 B5 C5 D2 E5. They are nozzle gap height (0.1 mm), extruder temperature (220 °C), bed temperature (70 °C), infill print head velocity (30 mm/s), and retraction velocity (65 mm/s) to form the 26th set of parameters. The experimental model is printed based on this parameter combination for subsequent comparison and verification.
Table 17.
Single factor experiment datasheet (Dimensional accuracy).
3.3.2. RSM of Tensile Strength
The three factors with the highest F values in the above variation analysis results are used as the design variables of the response surface method. These are A (nozzle gap height (X1)), B (fill spacing (X2)), and C (Infill pattern (X3)). The parameters of the levels are shown in Table 18. The levels of the factors are performed by the Central Composite Design. The levels of the factors are converted into 20 orthogonal arrays. After printing the model, the universal tensile testing machine measured the maximum tensile strength, and the data were recorded. In addition, the experiment was repeated three times and the average was taken. The results are shown in Table 19. The model of Minitab software is used for analysis. A second-order regression model of the dimensional accuracy score is built. The regression model coefficients are shown in Table 20.
Table 18.
Response Surface Method (RSM) Level Parameter Design (Tensile strength).
Table 19.
Design results of Response Surface Method (Tensile strength).
Table 20.
Regression model coefficients (Tensile strength).
The regression coefficients are shown in the second line of Table 20. The multinomial regression equation can be obtained by adding the variable and cross terms, expressed as Equation (4):
where Y = maximum tensile strength [MPa], X1 = nozzle gap height [mm], X2 = fill spacing [mm], X3 = Infill pattern.
Y = 71.2 − 61 X1 − 53.0 X2 − 1.2 X3 − 80 X12 − 17.7 X22 − 0.49 X32 + 398 X1 × X2 − 105.7 X1 × X3 + 20.44 X × X3
Given the general p value of 0.05, the variable term has a significant effect on the experimental results if the p value is smaller than 0.05. Table 20 shows that the Nozzle gap height (X1) and Fill spacing (X2) are the factors with an interaction. They significantly affect the maximum tensile strength of the print.
The response surface plot is drawn using the Minitab program, as shown in Figure 9. It is observed in Figure 9a that at fixed Infill pattern and fill spacing and smaller nozzle gap height, the tensile strength is higher. While at fixed Infill pattern and nozzle gap height and larger fill spacing, the tensile strength is higher. According to Figure 9b, the tensile strength is higher at fixed fill spacing and Infill pattern and a smaller nozzle gap height. When the fill spacing and nozzle gap height are fixed, and the Infill pattern is closer to the straight line, tensile strength is higher. In Figure 9c, the tensile strength is higher when the nozzle gap height and Infill pattern are fixed with a smaller fill spacing. The tensile strength is higher at a fixed nozzle gap height and fill spacing with closer Infill pattern and straight line.
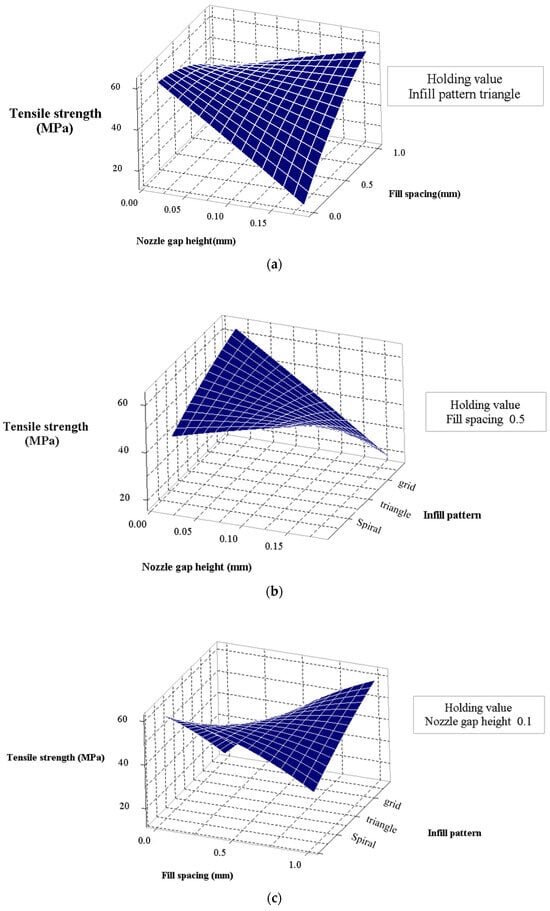
Figure 9.
Factor contour diagram (Tensile strength). (a) Contour diagram of Tensile strength versus Nozzle gap height and Fill spacing. (b) Contour diagram of Tensile strength versus Nozzle gap height and Infill pattern. (c) Contour diagram of Tensile strength versus Nozzle gap height and Infill pattern.
A single-factor experiment is used for analysis to verify the existence of an optimal combination of printing parameters for the maximum tensile strength. A total of 25 experimental groups were designed. A single factor/parameter is changed at a time. The relationships of the factors are analyzed. The optimal parameters of various groups were compared, and then five parameters were combined. These are verified optimal process parameters for printing. The parameters are designed according to the Taguchi and the response surface methods, as shown in Table 21.
Table 21.
Single-factor experiment control levels (Tensile strength).
A total of 25 experiments were performed based on parameter combinations. The results are shown in Table 22. The calculation results show that the optimal parameter combination is A1 B1 C3 D3 E3. They are nozzle gap height (0.1 mm), fill spacing (0.4 mm), Infill pattern triangle, infill print head velocity (35 mm/s), and nozzle temperature (210 °C) to form the 26th set of parameters. The experimental model is printed based on this parameter combination for subsequent comparison and verification.
Table 22.
Single factor experiment datasheet (Tensile strength).
3.4. Validation of Optimal Parameter Combination
3.4.1. Dimensional Accuracy
Three experiments were conducted with the Taguchi experimental method, response surface method, and single factor experiment to verify the optimal parameter combination. The set parameters are shown in Table 23. The experimental results are analyzed in Table 24. Figure 10 is a printed model of dimensional accuracy. Although the model appears the same in Figure 10, the measurement results of the dimensions are different.
Table 23.
Taguchi method, response surface, and single factor experiment settings (Dimensional accuracy).
Table 24.
Result datasheet (Dimensional accuracy).
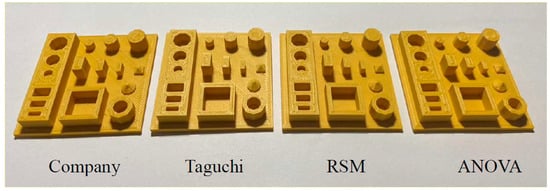
Figure 10.
End product of tensile test model (Dimensional accuracy).
As shown in Table 23, The precision score percentage is the ratio of dimensional accuracy to the theoretical value, where the theoretical value is a perfect score of 5 points for the precision score. The best dimensional accuracy is the Dimensional accuracy of Taguchi Method is 4.11, Dimensional accuracy percentage is 82.20%, As shown in Table 24.
3.4.2. Tensile Strength
Three experiments were conducted with the Taguchi experimental method, response surface method, and single factor experiment to verify the optimal parameter combination. The set parameters are shown in Table 25. The experimental results are analyzed in Table 26. The experimental error is the ratio of the maximum tensile strength to the theoretical value of 60 MPa for PLA material [14]. The stress-strain diagram of the tensile test is shown in Figure 11. It can be seen that the parameter combinations obtained from the Taguchi experiment for printing models can withstand larger loads. The tensile test model is shown in Figure 12. After conducting the tensile test, data on its tensile strength was collected. Additionally, it is evident that the fracture points differ with various parameter combinations. Perhaps further research can be conducted on this to analyze whether the printing parameters are related to the fracture locations.
Table 25.
Taguchi method, response surface, and single factor experiment settings (Tensile strength).
Table 26.
Result datasheet (Tensile strength).
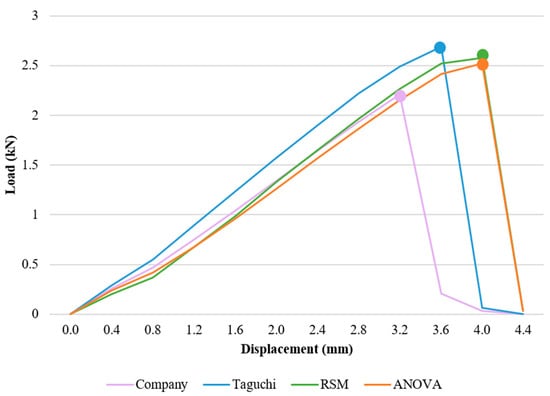
Figure 11.
Tensile test stress-strain diagram.
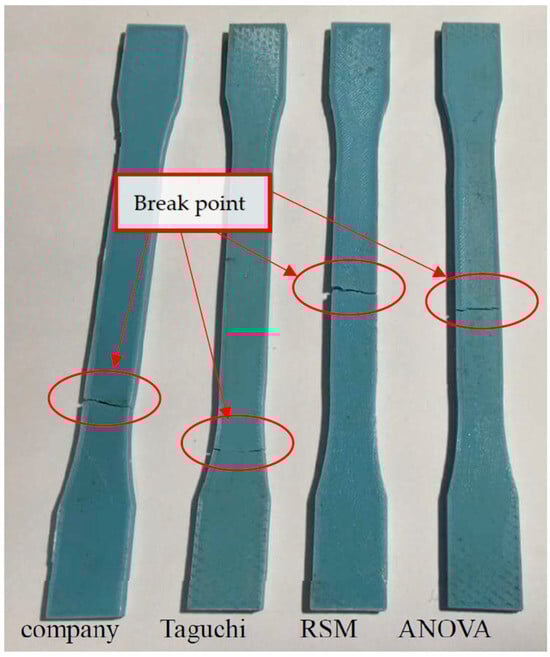
Figure 12.
Stereogram of the tensile test model.
As shown in Table 26, the experimental error is the ratio of the maximum tensile strength to the theoretical value, and the theoretical value is the maximum tensile strength of PLA material 60 MPa. The maximum tensile strength is the Tensile strength of Taguchi Method is 52.29 MPa, Experimental error is 12.85%
4. Conclusions
- The number of experiments can be effectively reduced using the Taguchi method. The factors influencing the printing quality can be found with ANOVA. The factors’ influence can be obtained from the S/N ratio. Based on the actual printing and analysis, the nozzle gap height is the most important factor influencing dimensional accuracy. It is followed by the printing platform temperature and the nozzle temperature; the contribution values are 91.34%, 3.79%, and 2.50%, respectively. The Infill pattern is the most important factor influencing the tensile strength, followed by the nozzle gap height and the fill spacing; the contribution values are 62.93%, 19.60%, and 12.50%, respectively.
- Comparing the results of the Taguchi and the response surface methods, the Taguchi method is better. The results show that the Dimensional accuracy increased to 82.20% and the tensile strength is increased by 5.731 MPa. The experimental S/N ratios of the optimized parameters of the experiment fall in the prediction confidence interval, meaning the parameters are reliable.
- The research results indicate that nozzle gap height has a significant impact on both dimensional accuracy and tensile strength, while other processing parameters need to be adjusted according to the specific application. Further investigation will be conducted to explore whether there is an interaction between the two sets of processing parameters.
- This research can help manufacturers using additive manufacturing to reduce material waste, save time, and reduce costs when printing PLA materials.
- As part of future work, it is recommended to conduct additional tests, such as bending and impact tests, as well as tests on the morphology of the parts, to highlight the performance of components manufactured using 3D printing technology. This is part of the research we are currently undertaking.
Author Contributions
All authors contributed meaningfully to this study. D.-C.C. and Y.-T.C., research topic; Y.-T.C., data acquisition and analysis; D.-C.C., methodology support; D.-C.C. and Y.-T.C., original draft preparation; D.-C.C. and Y.-T.C., writing—review and editing. All authors have read and agreed to the published version of the manuscript.
Funding
This research received no external funding.
Institutional Review Board Statement
Not applicable.
Informed Consent Statement
Not applicable.
Data Availability Statement
Data are contained within the article.
Conflicts of Interest
The authors declare no conflict of interest.
References
- Mohammed, H.; Sarkawt, R.; Yassin, M.A. Investigation of tensile property-based Taguchi method of PLA parts fabricated by FDM 3D printing technology. Results Eng. 2021, 11, 100264. [Google Scholar]
- Cristina, V.; Liviu, M.; Mihai, M.; Linul, E.; Razavi, N.; Berto, F. Effect of manufacturing parameters on tensile properties of FDM printed specimens. Procedia Struct. Integr. 2020, 26, 313–320. [Google Scholar]
- Agnieszka, S.; Grzegorz, A. Using thermal annealing and salt remelting to increase tensile properties of 3D FDM prints. Eng. Fail. Anal. 2022, 132, 105932. [Google Scholar]
- Enemuoh, E.U.; Duginski, S.; Feyen, C.; Menta, V.G. Effect of Process Parameters on Energy Consumption, Physical, and Mechanical Properties of Fused Deposition Modeling. Polymers 2021, 13, 2406. [Google Scholar] [CrossRef] [PubMed]
- Rodríguez-Reyna, S.L.; Mata, C.; Díaz-Aguilera, J.H.; Acevedo-Parra, H.R.; Tapia, F. Mechanical properties optimization for PLA, ABS and Nylon + CF manufactured by 3D FDM printing. Mater. Today Commun. 2022, 33, 104774. [Google Scholar] [CrossRef]
- Zhong, C.F. Effect of Printing Parameters on the Mechanical Properties of 3D-Printed Polylactic Acid (PLA) Based on Fused Deposition Modeling. Master’s Thesis, National Kaohsiung University, Kaohsiung, Taiwan, 2022. [Google Scholar]
- Padhy, C.; Suryakumar, S.; Bhattacharjee, D.; Reddy, N.R. Parametric analysis of 3D printing (FDM) process parameters on mechanical behaviour of PEEK-A high-grade polymer. AIP Conf. Proc. 2024, 3031, 030008. [Google Scholar]
- Samykano, M.; Selvamani, S.K.; Kadirgama, K.; Ngui, W.K.; Kanagaraj, G.; Sudhakar, K. Mechanical property of FDM printed ABS: Influence of printing parameters. Int. J. Adv. Manuf. Technol. 2019, 102, 2779–2796. [Google Scholar] [CrossRef]
- Schwicker, M.; Nikolov, N.; Enk, D. Optimizing the fused deposition modelling process in terms of surface roughness. AIP Conf. Proc. 2024, 3078, 020002. [Google Scholar]
- Potdar, V.V.; Joshi, N.K. The enhancement in process parameters of fused deposition modelling used for 3D printed components from the perspective of enhancement of mechanical strength properties: A narrative review. AIP Conf. Proc. 2024, 3013, 020015. [Google Scholar]
- Yao, T.; Ye, J.; Deng, Z.; Zhang, K.; Ma, Y.; Ouyang, H. Tensile failure strength and separation angle of FDM 3D printing PLA material: Experimental and theoretical analyses. Compos. Part B Eng. 2020, 188, 107894. [Google Scholar] [CrossRef]
- Pulipaka, A.; Gide, K.M.; Beheshti, A.; Bagheri, Z.S. Effect of 3D printing process parameters on surface and mechanical properties of FFF-printed PEEK. J. Manuf. Process. 2021, 85, 368–386. [Google Scholar] [CrossRef]
- Rauf, N.A.A.A.; Mehat, N.M.; Kamaruddin, S. Optimisation of 3d printing parameters of acrylonitrile-butadiene-styrene thin-walled and hollow structure via integration Taguchi method and principle component analysis. AIP Conf. Proc. 2024, 2934, 050008. [Google Scholar]
- Duong, V.; Van, T.L. Metallurgical Characterization of SS 316L Repurposed by Wire Plus Arc Additive Manufacturing. Int. J. Eng. Technol. Innov. 2023, 13, 189–202. [Google Scholar] [CrossRef]
- Fong, H.L.; Chie, S.C.; Keat, Y.C.; Leng, T.P.; Tammizi, K.A.A.B.; Ai, T.M.; Wei, K.K. Effect of printing parameter on mechanical properties cPLA/Fe2O3 composites using FDM. AIP Conf. Proc. 2024, 2883, 050005. [Google Scholar]
- Czyżewski, P.; Marciniak, D.; Nowinka, B.; Borowiak, M.; Bieliński, M. Influence of extruder’s nozzle diameter on the improvement of functional properties of 3D-printed PLA products. Polymers 2022, 14, 356. [Google Scholar] [CrossRef] [PubMed]
- Bintara, R.D.; Andoko, A.; Suprayitno, S.; Aminnudin, A.; Suryanto, H.; Pradana, Y.R.A.; Fikri, A.A. The study of resin polymer reinforced 3D printed part to tensile strength. AIP Conf. Proc. 2024, 3110, 020058. [Google Scholar]
- Junk, S.; Schaumburg, K. Mechanical properties of multi-material polymers additively manufactured with fused layer modeling using a single nozzle. AIP Conf. Proc. 2024, 3012, 020009. [Google Scholar]
- Agarwal, K.M.; Shubham, P.; Bhatia, D.; Sharma, P.; Vaid, H.; Vajpeyi, R. Analyzing the Impact of Print Parameters on Dimensional Variation of ABS specimens printed using Fused Deposition Modelling (FDM). Sens. Int. 2022, 3, 100149. [Google Scholar] [CrossRef]
- Syrlybayev, D.; Perveen, A.; Talamona, D. Fused deposition modelling: Effect of extrusion temperature on the accuracy of print. Mater. Today Proc. 2021, 44, 832–837. [Google Scholar] [CrossRef]
- Verma, N.; S, A.; Banerjee, S.S. Development of material extrusion 3D printable ABS/PC polymer blends: Influence of styrene–isoprene–styrene copolymer on printability and mechanical properties. Polym.-Plast. Technol. Mater. 2023, 62, 419–432. [Google Scholar] [CrossRef]
- Backar, A. ASTM D638-10 Type I Tensile Specimen. Available online: https://www.researchgate.net/figure/Schematic-representation-of76standard-specimens-for-mechanical-testing-ASTM-D638-10-Type_fig1_341357867/ (accessed on 24 December 2023).
Disclaimer/Publisher’s Note: The statements, opinions and data contained in all publications are solely those of the individual author(s) and contributor(s) and not of MDPI and/or the editor(s). MDPI and/or the editor(s) disclaim responsibility for any injury to people or property resulting from any ideas, methods, instructions or products referred to in the content. |
© 2024 by the authors. Licensee MDPI, Basel, Switzerland. This article is an open access article distributed under the terms and conditions of the Creative Commons Attribution (CC BY) license (https://creativecommons.org/licenses/by/4.0/).