Abstract
Cr-doped Al2O3 spheres with strong red emission were produced using a simple laser processing approach with a 50 W continuous CO2 laser. Structural characterization revealed that the produced spheres were monophasic, comprising the α-Al2O3 phase. Photoluminescence (PL) studies indicated that the observed red emission originates from multiple Cr3+ optical centers being dominated by the 2E → 4A2 transition (R-lines), with a further contribution from the parity and spin forbidden 2T1 → 4A2 transition (R′-lines). The identification of additional radiative recombination from chromium ion pairs (N-lines) evidences that the produced samples are heavily doped. As such, energy transfer processes between the different chromium optical centers are seen to take place, as suggested by the lifetime decay analysis. PL excitation revealed that the room temperature luminescence is preferentially populated via the spin-allowed 4A2 → 4T2,4T1 transitions and by the parity and spin-forbidden 4A2 → 2T2 (B-lines), 2T1 (R′-lines), 2E (R-lines). Such results demonstrate that the present synthesis method is able to deliver high-optical-quality Al2O3:Cr crystals in a fast and simple way, with potential interest for optical, sensing, or lasing applications.
1. Introduction
The optical properties of trivalent chromium (Cr) ions in bulk alumina (Al2O3) have been extensively studied in the past and resulted in the development of the ruby laser, as reported by Maiman et al. [1,2], which emits in the red region of the electromagnetic spectrum. Sugano and Tanabe [3,4,5,6] studied the electronic energy levels of Cr3+ in Al2O3 both from the theoretical and experimental points of view. Under diluted doping conditions, Cr3+ ions are known to substitute Al3+ in the Al2O3 lattice forming a trigonal distorted octahedron [3,4,5,6]. As such, the levels of the ion in the cubic field are further split by the interplay of the trigonal field strength and the spin–orbit interaction [3,4,5,6]. Accordingly, in octahedral symmetry, and for a measured crystal field and Racah parameters of Dq/B = 2.8 (obtained from absorption spectroscopy measurements), the electronic states of the ion correspond to the ground state and , , , , excited states (excluding the ones of higher energy) [3,4,5,6,7,8,9,10], where the lowest excited state is the , as expected for the ion under a strong crystalline field [6,10]. The states are further split into two Kramers doublets and the main emission is due to the parity and spin-forbidden 2E → 4A2 transition, resulting in two sharp zero phonon lines (ZPL) at ~1.79 eV in the red region, the so-called R-lines [1,2,3,4,5,6,7,8,9,10]. The absorption is dominated by the broad bands corresponding to the spin-allowed 4A2 transitions with maxima near 2.2 eV and 3.1 eV, respectively [9,10].
Recently, the remarkable optical properties of α-Al2O3:Cr have been exploited in a myriad of applications such as temperature, pressure, and stress sensors [11,12,13,14], dosimeters in ionizing radiation therapy [15,16,17], red-emitting phosphors for plant growth [18,19], or fluorescent probes for biological applications [20], among others. In addition, doped polycrystalline alumina is a material of excellence in high-power phosphor color converters or laser gain media [21,22]. The doping is typically attained during the growth [17,21,23] but there are some works reporting on ex situ doping, for instance by ion implantation [24]. Particularly, micrometer-sized crystalline spheres are known to be suitable for application in non-linear optical devices, quantum optics, sensing, and lasing [25,26,27]. Indeed, microspheres are amongst the most common microresonators that sustain whispering gallery modes (WGM), providing the highest quality factor (Q factor) values when compared with structures like microdisks and Fabry–Perot cavities [25,26]. The use of WGM microresonators as microlasers is one of the most interesting possibilities, given the high Q factor and small volumes of the modes, which allow for obtaining an ultralow lasing threshold [26,27]. Additionally, biosensors based on microcavities are especially valuable for exploiting the effects generated by the evanescent electromagnetic field in the surroundings of the surface, allowing the detection of analytes linked to the surface by monitoring the changes in the resonance frequency that they promote [26]. Likewise, among other sensor types (e.g., gas, humidity), they can also be used as temperature sensors, since temperature leads to deviations in the resonance frequency of the microcavity [26]. Nevertheless, producing high sphericity particles with dimensions in the micrometer range, mandatory for highly efficient lasing, remains a challenge [25]. The main fabrication approaches typically involve the melting of glass materials or the sol-gel process [26]. Other methods to produce crystalline spheres of different sizes (from nano to some millimeters) have been reported and include laser ablation [25,28,29,30], spray pyrolysis [31,32], microfluidic synthesis strategies [33], hydrolysis-precipitation methods [34], hydrothermal [35], and even other laser sintering approaches [36].
Although Al2O3 is a very well-known material, there is still plenty of room to improve its fabrication methods toward simplicity, low-cost, and eco-friendly approaches [21,27,37]. Therefore, there is a growing interest in finding new strategies to attain Cr-doped Al2O3 crystals with excellent optical properties, including high transparency [21,38,39]. To achieve such properties, densification of the material is usually required in order to minimize the residual porosity at the same time preserving a fine microstructure, i.e., small grain size [21,38]. Most of the currently employed methods involve high-temperature synthesis and/or controlled sintering approaches such as vacuum, pressure-assisted, or field-assisted sintering techniques [21,23,38,40,41]. Nowadays, the use of laser processing as a synthesis method is of particular relevance in additive manufacturing, enabling the production of several types of ceramic materials from precursor powders in a fast way. For instance, laser ablation in fluids, which relies on ultrahigh pressure and ultrahigh temperature, has been used to produce crystalline microspheres with high sphericity, presenting very interesting results in the synthesis of materials such as zinc oxide (ZnO), cadmium selenide (CdSe), zinc selenide (ZnSe), or cerium oxide (CeO2) [25].
In this context, the use of fast and inexpensive synthesis methods, together with the incorporation of dopants in inorganic matrices that allow optical pumping tuning for laser action, has assumed particular relevance [27]. Hence, the purpose of the present work can be divided into two main goals: (1) to demonstrate that laser technology can be used to process Al2O3 and Cr2O3 powders to obtain chromium-doped crystalline α-Al2O3 spheres in air atmosphere simply and promptly, without the need of expensive equipment or post-sintering heat treatments to obtain α-Al2O3:Cr with strong red emission; and (2) to investigate the optical properties of the doped spheres using photoluminescence (PL), PL excitation (PLE), time-resolved PL (TRPL), and Raman spectroscopies. Temperature and excitation energy-dependent PL and lifetime measurements were also performed to establish the recombination models and clarify the Cr3+ optical signatures on the laser-processed α-Al2O3 spheres.
2. Materials and Methods
Material synthesis was carried out using a commercial CO2 50 W laser marking system (Redsail M500) with air-assist off and the XY motion disabled. Al2O3 (Sigma-Aldrich, St. Louis, MO, USA, activated, basic, Brockmann I, powder ≥ 99.5%) and Cr2O3 (Sigma-Aldrich, St. Louis, MO, USA, powder ≥ 98%) powders were mixed in an agate mortar in a 97:3 (w/w) proportion, according to reference [42], to lead to the formation of Cr-doped Al2O3. Then, the powders were inserted in a Ø 6 mm × 6 mm graphite crucible. The crucible was then placed into the laser system with the top of the powder set at 4 cm below the focal point of the system. This process is performed out-of-focus to minimize thermal gradients and allow the production of larger spheres. Also, if the laser was focused on the powder surface, a violent ejection of material would occur at the ~100 µm irradiated region. After five 1-second bursts at 5 W to sinter the surface of the powder and prevent the ejection of powder during temperature ramp-up, the laser was set at 50 W for 20 s. The sample was then left to cool, and the produced sphere was removed from the crucible. One sphere was produced each time. Figure 1 displays a schematic representation of the experimental setup used to synthesize the Al2O3:Cr spheres.
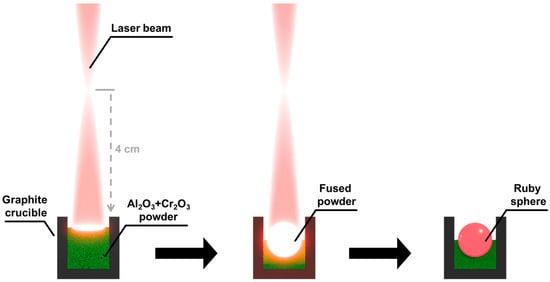
Figure 1.
Schematic representation of the experimental setup used to synthesize the spheres.
Sample morphology was evaluated using secondary-electron scanning electron microscopy (SEM) on a TESCAN VEGA3 microscope with a working distance of 15 mm and a 10 keV electron beam. A carbon coating was applied to reduce the charge effect. Additionally, energy dispersive X-ray (EDS) spectra were acquired with a Bruker XFlash Detector 410-M to assess the doping levels. X-ray diffraction (XRD) analysis was employed to identify the crystalline structure of the prepared samples using a PANalytical X’Pert PRO diffractometer operating in the Bragg-Brentano configuration and with CuKα radiation (λ = 1.54056 Å). Raman spectroscopy measurements were performed at room temperature (RT) in a backscattering configuration on a Horiba HR800 micro-Raman spectrometer equipped with a 600 grooves mm−1 grating and using the 441.6 nm laser line from a HeCd laser (Kimmon IK Series, Fukushima, Japan) and a 50× objective (spot size ~2 µm, NA = 0.7, Olympus). A neutral density filter OD = 1 was used to attenuate the laser power to prevent the luminescence from saturating the detector.
Steady-state PL was carried out by exciting the samples with the 325 nm (~3.81 eV) line from a cw He-Cd laser (Kimmon IK Series, excitation power density ~0.6 W cm−2). The samples were placed in a cold finger of a closed-cycle helium cryostat and the temperature was controlled in the range between 14 K and RT. A dispersive system SPEX 1704 monochromator (equipped with a 1200 grooves mm−1 diffraction grating) coupled to a cooled Hamamatsu R928 photomultiplier tube was used to measure the luminescence of the produced spheres. Further RT energy excitation-dependent PL and PLE experiments were performed in a Fluorolog-3 Horiba Scientific modular system, equipped with a double additive grating Gemini 180 scanning monochromator (with 1200 grooves mm−1 diffraction grating) for excitation, and an iHR550 spectrometer (1200 grooves mm−1 diffraction grating blazed at 500 nm) for the emission. This system is also fitted with an R928P photomultiplier detector. A 450 W Xe arc lamp was used as the excitation source. The PLE measurements were conducted by setting the emission monochromator at the maxima of the Cr3+ emission lines and the excitation wavelengths being scanned to higher energies. RT TRPL spectra were acquired with the same Fluorolog-3 system using a pulsed Xe lamp (operating at up to 25 Hz) coupled to the same excitation monochromator and with the excitation fixed at either 372 nm (~3.333 eV) or 520 nm (~2.385 eV), matching the Cr3+ absorption bands. The full width at half maximum (FWHM) of each lamp pulse is 3 μs, so that lamp interference during the acquisition of decay curves is minimized. The measurement conditions were set to a sample window of 5 ms, with 20 ms of time per flash and a flash count of 100. Several time delays after flash were employed from 0.05 to 20 ms. Lifetime decays were also recorded in this time range and under similar experimental conditions (sample window, number of flashes, and time per flash). In this case, three wavelengths were used for the excitation, 372 nm (~3.333 eV), 520 nm (~2.385 eV), and 550 nm (~2.273 eV), and the PL intensity was monitored at either 692 nm (~1.792 eV) or 704 nm (~1.761 eV).
3. Results and Discussion
3.1. Morphological and Structural Characterization
Figure 2a shows an optical photograph of the macroscopic appearance of one of the produced spheres when illuminated with a UV hand lamp (λexc = 365 nm), exhibiting the strong red luminescence typical of ruby crystals. Although spherical in shape, some irregularities are present at the surface, which can be seen in detail in the SEM micrograph of Figure 2b. The spherical shape probably results from the solidification process that follows melting induced by the local heating of the Gaussian-profile laser beam. This behavior explains the bubble-shaped irregularities at the sphere surface. At a higher magnification (Figure 2c) it is possible to observe a small roughness that comes from the polycrystalline nature of the outer sphere. The microcrystals at the surface exhibit polyhedral shapes dominated by a cubic geometry with dimensions ranging from 5 to 30 µm. EDS analysis revealed an average of 0.47 at.% and 1.19 wt.% for chromium, showing an effective doping with high homogeneity, with a maximum variation between the three probed points of 0.17 wt.%. XRD analysis (Figure 3a) of the powdered sample puts in evidence its monophasic constitution, corresponding to 100% of the α-Al2O3 crystalline phase, according to ICDD Ref. 04-005-4505 data. The Raman characterization (Figure 3b) corroborates the XRD results. α-Al2O3 possesses a rhombohedral crystal structure, with two Al2O3 units per unit cell, belonging to the D3d space group. The optical modes of such structure can be described by the irreducible representation Γ = 2A1g + 2A1u + 3A2g + 2A2u + 5Eg + 4Eu, among which the A1g and Eg modes are Raman active. Hence, seven modes were predicted in the Raman spectrum of the prepared crystal [43,44]. Indeed, Figure 3b evidences the presence of the typical main set of peaks assigned to the vibration modes of α-Al2O3. In fact, as shown in Figure 3b, the expected Raman features were all observed in spectra taken from the samples’ surface, namely five modes with Eg symmetry at 380, 432, 450, 578, and 752 cm−1 and two others with A1g symmetry at 418 and 646 cm−1 [43].
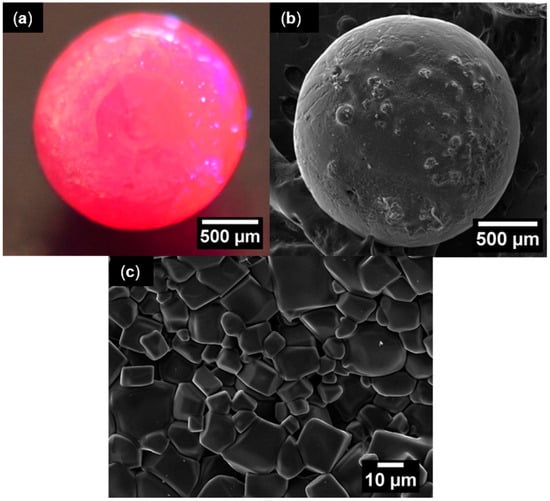
Figure 2.
(a) Optical photograph of the ruby sphere when illuminated with a UV lamp (365 nm); (b) electron microscopy image of the α-Al2O3 sphere surface; (c) high-magnification SEM image evidencing the polycrystalline nature at the outer sphere.
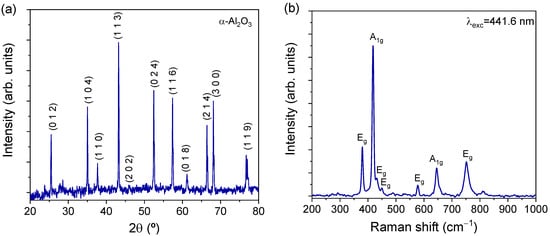
Figure 3.
(a) XRD diffractogram of the powdered sample demonstrating its monophasic nature; (b) Raman spectrum performed with 441.6 nm laser line of a HeCd laser.
3.2. Photoluminescence Analysis
RT PLE and selectively excited PL spectra of the α-Al2O3:Cr spheres are shown in Figure 4. The PL spectra are dominated by two narrow lines (the above-mentioned R-lines) in the red spectral region, which are due to the 2E → 4A2 transition (see the Tanabe–Sugano diagram in Figure 4c and energy level scheme in Figure 4b). These lines appear with a separation of 3.6 meV from each other, the first one placed at 1.792 eV (R2) and the other at 1.788 eV (R1). This observation agrees well with the values reported for individual Cr3+ in Al substitutional sites identified in dilute doped samples [3,7,8]. As above-mentioned, the observation of the two R-lines indicates that, in the studied samples, the trivalent chromium ions are in distorted octahedral sites and their energy levels are split by a low symmetry trigonal component of the crystal field and spin-orbit coupling. At RT, the FWHM of the R-lines is about 2.5 meV. On the lower and higher energies sides of the zero phonon R-lines, a vibrationally assisted structure can be identified, corresponding to the Stokes and anti-Stokes emission, respectively. In addition, on the low energy side of the R-lines, sharp features can be discerned at ca. 1.77 eV and 1.76 eV, assigned to the presence of chromium ion pairs and/or Cr3+-complex defects, the so-called, N-lines (N2 and N1, respectively, due to fourth-nearest neighbor and second-nearest neighbor pairs, respectively), whose intensity ratio to the R-lines is known to be dependent on the chromium concentration [45,46,47,48,49]. On the high-energy side of the R-lines, two zero-phonon lines separated by ca. 27 meV and located at 1.882 eV and 1.855 eV, respectively, are well-resolved. These, called R′-lines, are assigned to the 2T1 → 4A2 transition due to the partial relaxation of the spin multiplicity rule [6,8]. All these transitions are schematized in the diagram of Figure 4d.
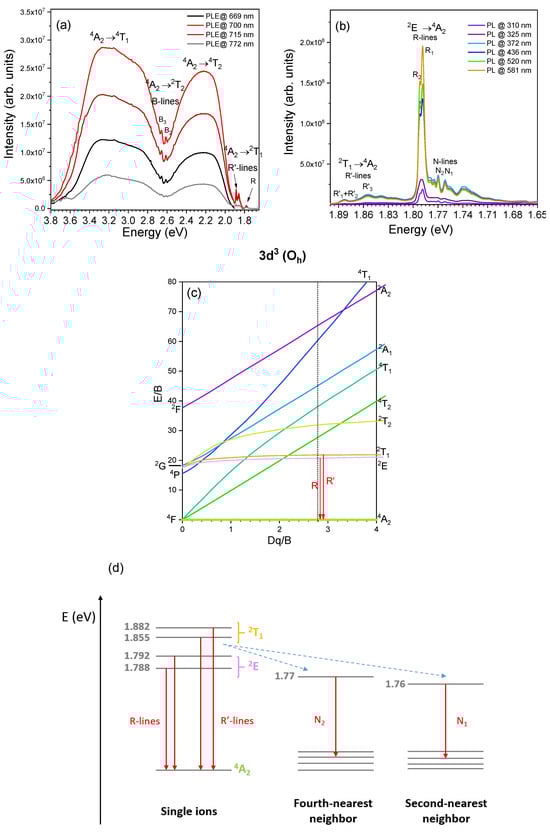
Figure 4.
RT (a) PLE and (b) PL spectra of the analyzed α-Al2O3:Cr sphere; (c) Tanabe–Sugano diagram for the single Cr3+ ions (3d3 electronic configuration) in octahedral symmetry (Oh). The dashed line corresponds to Dq/B = 2.8, as reported for isolated Cr3+ in Al3+ substitutional sites [3,4,5,6]; (d) schematic representation of the split emitting levels under trigonal distortion for a single Cr3+ and their nonradiative transfer to the N pairs, namely second- (N1) and fourth- (N2) nearest neighbors. The energy values correspond to the ones measured in the present samples. The levels’ energy positions are not at scale. The vertical full arrows denote the observed radiative transitions (R-, R′-, and N-lines), while the dashed arrows represent energy transfer. Scheme based on reference [47].
By monitoring the luminescence at the maximum of the intra-ionic Cr3+ lines, it was verified that the main populating mechanisms in the studied spectral range correspond to the spin-allowed 4A2 → 4T2, 4T1 transitions, giving rise to asymmetric broad excitation bands (FWHM of ca. 450 meV) with maxima around 3.1 eV and 2.2 eV. The asymmetrical band shape is in accordance with the splitting of the excited states into three Kramers doublets. However, the FWHM is wider than the ones reported for a single Cr3+ center, which is about 250 meV [2]. Therefore, the broad asymmetric excitation bands likely correspond to a spectral overlap of several excitation bands due to multiple optical centers of Cr3+. Besides the R-lines, a set of other narrow lines overlapped on the onset of the broad excitation bands were identified. In particular, the excitation lines corresponding to the parity and spin-forbidden 4A2 → 2T1 R′-lines were seen to be a mirror image (without Stokes shift) of the ones observed in the PL spectra. Moreover, additional sharp lines are seen 50 meV apart in the blue region of the electromagnetic spectrum, at 2.66 eV and 2.61 eV, respectively, assigned to the 4A2 → 2T2 transitions (B-lines). The R-, R′-, and B-lines result from the spin-orbit admixture of the 4T1 and 4T2 electronic states with the 2E, 2T1, and 2T2 levels [4,50]. According to the measured spectra, the highest emission intensity occurs for the blue and green photon excitation. As such, the data are consistent with the fact that at RT, after excitation to any of the Cr3+ higher excited states, the system efficiently relaxes to the 2T1 and 2E levels, from which emission to the ground 4A2 state occurs. Simultaneously, the used excitation also promotes the recombination of the chromium ion pairs (N-lines, as observed in the PL spectra of Figure 4b). Nevertheless, the presence of other Cr3+-complex defects emitting in the same spectral region cannot be discarded [45,46,47,48,49,51].
To acquire additional information on the spectral features of the Cr-doped α-Al2O3 spheres, the temperature of the samples was lowered down to 14 K. Figure 5 shows a highly resolved PL spectrum obtained at 14 K with 3.81 eV photon excitation. The low-temperature spectrum exhibits additional spectral complexity, with the presence of several lines at lower energies than the R ones, which are absent at high temperatures. At 14 K, the R-lines are peaked at 1.793 eV (R2) and 1.789 eV (R1). Besides the appearance of new lines on the low energy side of the R ones, on the high energy side, the R′-lines are observed, meaning that the emission from the 2T1 level to the ground state occurs even at 14 K. Additionally, new doublet lines emerge at 14 K, with maxima at 1.809 eV and 1.805 eV, here assigned as R2″- and R1″-lines, respectively. Analogously to the R-lines, the two R″-lines are 4 meV apart and are likely to be due to a 2E → 4A2 transition from a distinct trivalent charged chromium optical center, thus justifying a model corresponding to multi-non-equivalent Cr3+ optical centers.
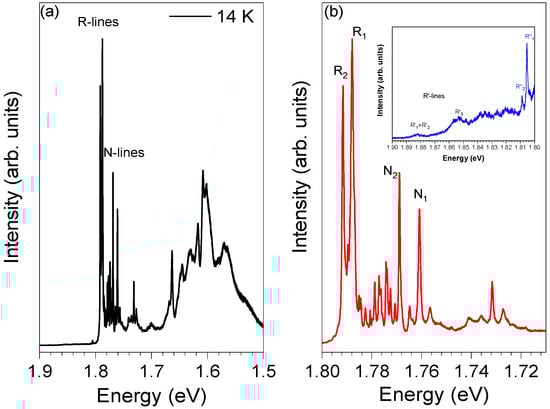
Figure 5.
(a) The 14 K PL spectrum of α-Al2O3:Cr spheres obtained with 3.81 eV photon excitation; (b) enlarged spectrum in the region of the R- and N-lines. In the inset, the high-energy side of the R-lines is displayed.
Figure 6 depicts the PL spectra obtained at several temperatures under 3.81 eV photon excitation. As seen, between 14 K and RT, the overall luminescence intensity decreases with increasing temperatures. The PL intensity of the distinct Cr3+ optical centers exhibits distinct sensitivities to the temperature rise. It was verified that the peak position of the R′-lines slightly shifts toward lower energies with increasing temperature. This deviation is accompanied by an increase in the PL intensity of the lines from 14 K to RT, suggesting the existence of a thermal population process of the 2T1 electronic state. For the case of the R2″- and R1″-lines, it is seen that the intensity of the R2″-line decreases rapidly for temperatures above 70 K, while it is possible to observe the R1″-line up to the RT, with a shift of its maximum toward lower energies. The R-lines show an analogous behavior, exhibiting a decrease in their PL intensity. This is more pronounced for temperatures above 90 K, accompanied by a redshift of the line peak position along with an enlargement of its width with increasing temperature (please note that each R-line is a multi-component line, as shown in Figure 6c). It was also observed that the intensity of the N2- and N1-lines dropped more rapidly than that of the R-lines for temperatures above 14 K. Their emission maxima also show a shift to lower energies, which is also accompanied by an increase in their FWHM.
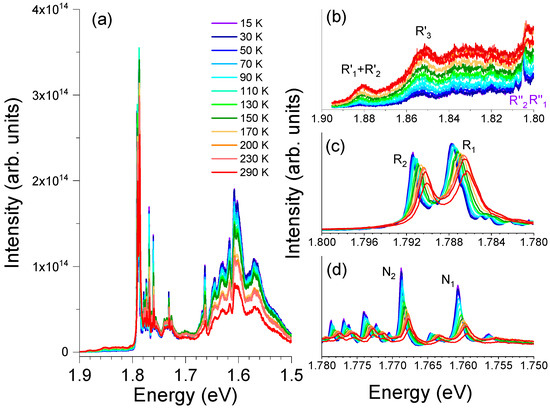
Figure 6.
(a) Temperature dependence PL spectra of the α-Al2O3:Cr spheres obtained with 3.81 eV photon excitation. Enlarged spectra in the region of (b) the R′- and R″-lines, (c) R2- and R1-lines, and (d) the N2- and N1-lines.
Figure 7 shows the temperature dependence of the peak position for the R″-, R-, and N-lines and the dependence of the FWHM for the R- and N-lines. The linewidth and temperature shift of the R- and N-lines in dilute and heavily chromium-doped Al2O3 can be explained based on the contributions of the microscopic strains and impurity-phonon interactions [8,46]. For the case of samples doped with 2.1 at.% and 0.94 at.% Cr, Powell et al. [46] measured a redshift of about 2–2.5 meV for the peak position and a line broadening of about 1–2 meV for both the R- and N-lines when inspected between 13 K and RT. Considering a simplified model where the energy shift is proportional to the phonon population number, the temperature dependence of the peak position, , can be expressed by [52],
where is the line energy at 0 K, corresponds to a proportionality factor, is the energy of the phonons involved, is the reduced Planck constant, is the Boltzmann constant, and is the absolute temperature. The best fits to Equation (1) to the temperature dependence of the lines’ peak position are shown by the solid lines in Figure 7. The values of 1.809 eV, 1.805 eV, 1.793 eV, 1.789 eV, 1.769 eV, and 1.761 eV were found for the R2″, R1″, R2, R1, N2, and N1 lines, respectively. Constant factors of 2.7 × 10⁻³ eV, 0.7 × 10⁻³ eV, and 0.6 × 10⁻³ eV were determined for the (R2″, R1″), (R2, R1), and (N2, N1) lines, and about 10 meV was obtained for the of the R1″, R2, R1, N2, and N1 lines.
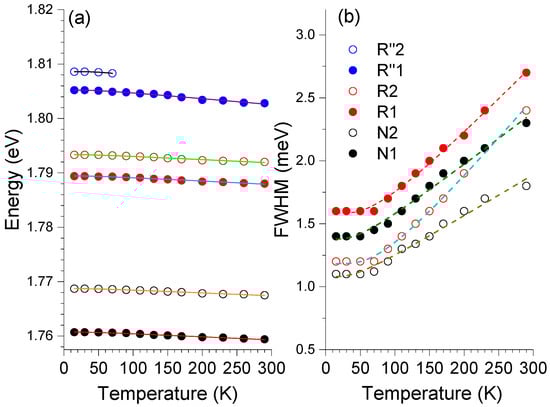
Figure 7.
Temperature dependence of the (a) peak position of the R-″, R-, and N-lines obtained with 3.81 eV photon excitation and (b) full width at half maximum of the R- and N-lines. Symbols denote the experimental values while full and dashed lines correspond to the theoretical fits of Equations (1) and (2), respectively.
Similarly, using the simplified model, the temperature dependence of the lines FWHM, Γ(T), can be determined by [52],
where is the lines’ FWHM at 0 K and corresponds to a proportionality factor. The best fit to Equation (2) was reached for equal to 1.18 meV, 1.58 meV, 1.08 meV, and 1.38 meV for the R2, R1, N2, and N1 lines, respectively, B constants of 0.6 meV, 1.2 meV, 0.4 meV, and 0.6 meV, and values of 19 meV (R2, R1) and 11 meV (N2, N1) for the .
The temperature dependence of the R- and N-lines PL intensity has been previously studied by Powell et al. [46] and Fonger et al. [53], allowing the identification of the location of the energy diagrams, transitions from isolated Cr3+ ions (R-lines), and Cr3+ complexes (N1 and N2 lines), as well as the energy transfer processes between the different chromium optical centres present in the samples. The energy transfer process between single and exchange-coupled pairs of chromium ions (R and N lines) was also previously studied by Imbusch [47] via lifetime measurements in low, intermediate, and highly doped samples. Imbusch [47] proved that the energy transfer from single ions to pairs occurs nonradiatively with a fast transfer of excitation between the single ions until they are close enough for the energy to be transferred to the pairs. In addition, following the model proposed by Dexter [54] and Forster [55], the author was able to identify that the nonradiative energy transfer is driven by electric quadrupole–quadrupole interaction, rather than exchange and magnetic dipole–dipole interactions, or electric dipole–dipole interaction, which are all weaker than the former [47]. In his studies, Imbusch [47] found that the radiative decay of the R-lines is distinct from the N-lines, being slower in the former. Even for low-doped samples, the decay measured at 77 K for the R-lines (8.8 ms) was higher than that detected by Nelson et al. [9] for single chromium ions (4.2 ms) as a consequence of the luminescence-trapping dependence of the radiative recombination on the chromium concentration. Additionally, the N-lines evidenced a non-exponential lifetime at this temperature (77 K), described by a fast component in the order of 1.0 ms and a slow component with the same decay rate as the R-lines, showing that energy transfer occurs from the single chromium ions to chromium pairs [47]. Figure 8 shows the time-resolved spectra and decay times measured at RT in the present α-Al2O3:Cr samples. Considering the 4A2 → 4T2,4T1 excitation, it was possible to notice that the emission intensity of the R-lines decreases at 1/e from its initial value at about 3.0 ms, following the measured single average exponential decay of 3.2 ms shown in Figure 6b. Additionally, the decay times measured at the N2 line (the N-one with the highest intensity at RT) can be fitted to a multi-exponential model, with a fast lifetime of less than 0.5 ms, an intermediate one of 1.5 ms, and a slow lifetime similar to that of R-lines (~3.1 ms). It is worth mentioning that, as depicted in Figure 6b, different excitation wavelengths were employed to assess the lifetime of the mentioned emissions and all led to similar values. As above-mentioned, and in line with what was previously reported, this behavior suggests that there is energy transfer between the different chromium optical centres [47].
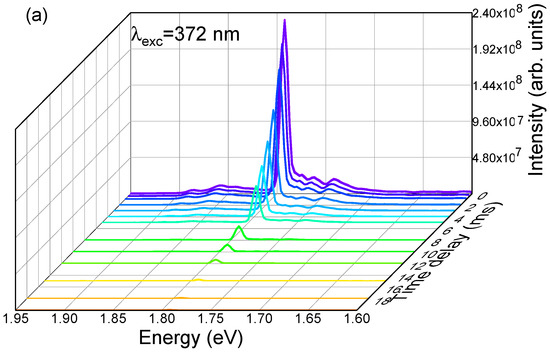
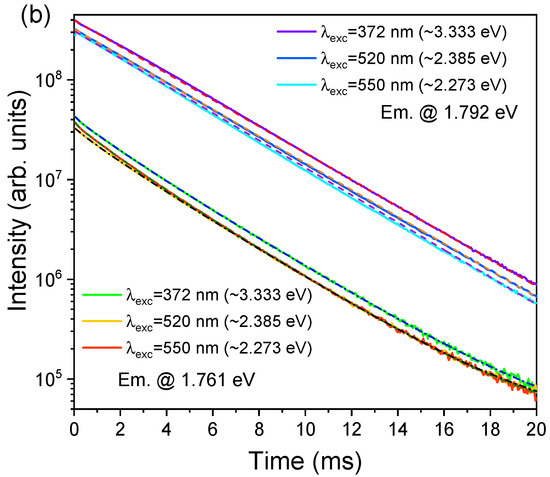
Figure 8.
RT (a) TRPL spectra obtained with 4A2 → 4T1 excitation (similar spectra were obtained with 4A2 → 4T2 excitation) and (b) decay times measured at R- and N2-lines with different excitation wavelengths. Broken lines: experimental fits to a single (R-lines, emission @ 1.792 eV)- and multi-exponential (N-lines, emission @ 1.761 eV) decay.
4. Conclusions
Crystalline α-Al2O3:Cr spheres were easily and quickly produced using laser synthesis under air atmosphere conditions with Al2O3 and Cr2O3 mixture powders as precursor materials, which can be extended to a large-scale process. The spheres were seen to be monophasic and with a polycrystalline nature and average doping of 0.47 at.% and 1.19 wt.% of Cr. Photoluminescence and photoluminescence excitation revealed that the main red luminescence is due to the single Cr3+ ions in trigonal distorted Al3+ octahedral sites, as identified by the dominant split R-lines due to the 2E → 4A2 transition. Additionally, emission from the parity and spin-forbidden 2T1 → 4A2 transition (R′-lines) was also observed. Besides the recombination from single Cr3+ ions, the synthesis conditions favor the observation of the radiative recombination from chromium ion pairs (N-lines), meaning that the produced samples are heavily doped. The presence of multiple Cr3+ optical centers is corroborated by the presence of a new doublet of lines (R″-lines) at low temperature and by the FWHM of the excitation bands, which are wider than those expected for the case of single Cr3+ ions. At room temperature, the R-lines exhibit a single exponential decay of about 3.2 ms, while the N-lines can be well-fitted to a multi-exponential model with a fast decay time of less than 0.5 ms, an intermediate one of about 1.5 ms, and a slow lifetime similar to that of R-lines, suggesting that energy transfer processes between the different chromium optical centers are taking place.
Author Contributions
Conceptualization, A.F.C.; methodology, J.R., A.F.C., A.J.S.F., F.M.C. and T.M.; formal analysis, J.R., A.F.C., A.J.S.F., F.M.C. and T.M.; investigation, J.R., A.F.C., J.Z., A.J.S.F., F.M.C. and T.M.; data curation, J.R., A.F.C. and T.M.; writing—original draft preparation, J.R. and T.M.; writing—review and editing, J.R., A.F.C., J.Z., A.J.S.F., F.M.C. and T.M. All authors have read and agreed to the published version of the manuscript.
Funding
This research was funded by the FCT—Portuguese Foundation for Science and Technology, within the scope of the project i3N, UIDB/50025/2020, UIDP/50025/2020, and LA/P/0037/2020.
Institutional Review Board Statement
Not applicable.
Informed Consent Statement
Not applicable.
Data Availability Statement
The data presented in this study are available in the article.
Acknowledgments
J. Rodrigues acknowledges FCT for Program Stimulus of Scientific Employment–Individual Support (grant 2022.00010.CEECIND/CP1720/CT0023, DOI: 10.54499/2022.00010.CEECIND/CP1720/CT0023).
Conflicts of Interest
The authors declare no conflicts of interest.
References
- Maiman, T.H. Stimulated Optical Radiation in Ruby. Nature 1960, 187, 493–494. [Google Scholar] [CrossRef]
- Maiman, T.H.; Hoskins, R.H.; D’Haenens, I.J.; Asawa, C.K.; Evtuhov, V. Stimulated Optical Emission in Fluorescent Solids. II. Spectroscopy and Stimulated Emission in Ruby. Phys. Rev. 1961, 123, 1151–1157. [Google Scholar] [CrossRef]
- Sugano, S.; Tanabe, Y. The line spectra of Cr3+ ion in crystals. Discuss. Faraday Soc. 1958, 26, 43. [Google Scholar] [CrossRef]
- Sugano, S.; Tanabe, Y. Absorption Spectra of Cr3+ in Al2O3 Part A. Theoretical Studies of the Absorption Bands and Lines. J. Phys. Soc. Jpn. 1958, 13, 880–899. [Google Scholar] [CrossRef]
- Sugano, S.; Tsujikawa, I. Absorption Spectra of Cr3+ in Al2O3 Part B. Experimental Studies of the Zeeman Effect and Other Properties of the Line Spectra. J. Phys. Soc. Jpn. 1958, 13, 899–910. [Google Scholar] [CrossRef]
- Sugano, S.; Tanabe, Y.; Kamimura, H. Multiplets of Transition-Metal Ions in Crystals; Academic Press: New York, NY, USA; London, UK, 1970. [Google Scholar]
- Macfarlane, R.M. Analysis of the Spectrum of d3 Ions in Trigonal Crystal Fields. J. Chem. Phys. 1963, 39, 3118–3126. [Google Scholar] [CrossRef]
- McCumber, D.E.; Sturge, M.D. Linewidth and Temperature Shift of the R Lines in Ruby. J. Appl. Phys. 1963, 34, 1682–1684. [Google Scholar] [CrossRef]
- Nelson, D.F.; Sturge, M.D. Relation between Absorption and Emission in the Region of the R Lines of Ruby. Phys. Rev. 1965, 137, A1117. [Google Scholar] [CrossRef]
- Henderson, B.; Imbusch, G.F. Optical Spectroscopy of Inorganic Solids; Oxford University Press: Oxford, UK, 2006; ISBN 0199298629. [Google Scholar]
- Yamaoka, H.; Zekko, Y.; Jarrige, I.; Lin, J.-F.; Hiraoka, N.; Ishii, H.; Tsuei, K.-D.; Mizuki, J. Ruby pressure scale in a low-temperature diamond anvil cell. J. Appl. Phys. 2012, 112, 124503. [Google Scholar] [CrossRef]
- Yang, W.; Cortés-Vega, F.D.; Ahmadi, K.; Castaneda, N.; Paidpilli, M.; Majkic, G.; Selvamanickam, V.; Brankovic, S.R.; Robles-Hernandez, F.C. Accurate Ruby Sensor for Stress Analysis in Electronics. ACS Appl. Electron. Mater. 2022, 4, 4332–4339. [Google Scholar] [CrossRef]
- Mykhaylyk, V.; Kraus, H.; Zhydachevskyy, Y.; Tsiumra, V.; Luchechko, A.; Wagner, A.; Suchocki, A. Multimodal Non-Contact Luminescence Thermometry with Cr-Doped Oxides. Sensors 2020, 20, 5259. [Google Scholar] [CrossRef] [PubMed]
- Mironova-Ulmane, N.; Brik, M.G.; Grube, J.; Krieke, G.; Kemere, M.; Antuzevics, A.; Gabrusenoks, E.; Skvortsova, V.; Elsts, E.; Sarakovskis, A.; et al. EPR, optical and thermometric studies of Cr3+ ions in the α-Al2O3 synthetic single crystal. Opt. Mater. 2022, 132, 112859. [Google Scholar] [CrossRef]
- Oh, R.; Yanagisawa, S.; Tanaka, H.; Takata, T.; Wakabayashi, G.; Tanaka, M.; Sugioka, N.; Koba, Y.; Shinsho, K. Thermal Neutron Measurements Using Thermoluminescence Phosphor Cr-doped Al2O3 and Cd Neutron Converter. Sensors Mater. 2021, 33, 2129. [Google Scholar] [CrossRef]
- Einbergs, E.; Zolotarjovs, A.; Bite, I.; Cipa, J.; Vitola, V.; Laganovska, K.; Trinkler, L. Re-Evaluation of Chromium Doped Alumina for Dosimetric Applications. Latv. J. Phys. Tech. Sci. 2021, 58, 15–22. [Google Scholar] [CrossRef]
- Ahmed, M.; Salah, A.; Ashour, A.; Hafez, H.; El-Faramawy, N. Dosimetric properties of Cr doped Al2O3 nanophosphors. J. Lumin. 2018, 196, 449–454. [Google Scholar] [CrossRef]
- Van Quang, N.; Thi Huyen, N.; Tu, N.; Quang Trung, D.; Duc Anh, D.; Tran, M.T.; Hung, N.D.; Viet, D.X.; Huy, P.T. A high quantum efficiency plant growth LED by using a deep-red-emitting α-Al2O3:Cr3+ phosphor. Dalt. Trans. 2021, 50, 12570–12582. [Google Scholar] [CrossRef] [PubMed]
- Wang, L.; Seto, T.; Wang, Y. A new efficient deep-red-emission phosphor Al2O3:Cr3+/Y3Al5O12:Ce3+ for plant growth. Dalt. Trans. 2021, 50, 3542–3549. [Google Scholar] [CrossRef]
- Alkahtani, M.H.; Almuqhim, A.A.; Alshehri, A.A.; Almughem, F.A.; AlHazaa, A.N.; Hemmer, P. Fluorescent ruby nanocrystals for biocompatible applications. Appl. Phys. Lett. 2021, 118, 233701. [Google Scholar] [CrossRef]
- Ratzker, B.; Wagner, A.; Favelukis, B.; Ayalon, I.; Shrem, R.; Kalabukhov, S.; Frage, N. Effect of synthesis route on optical properties of Cr:Al2O3 transparent ceramics sintered under high pressure. J. Alloys Compd. 2022, 913, 165186. [Google Scholar] [CrossRef]
- Penilla, E.H.; Devia-Cruz, L.F.; Duarte, M.A.; Hardin, C.L.; Kodera, Y.; Garay, J.E. Gain in polycrystalline Nd-doped alumina: Leveraging length scales to create a new class of high-energy, short pulse, tunable laser materials. Light Sci. Appl. 2018, 7, 33. [Google Scholar] [CrossRef]
- Wang, C.; Zhao, Z. Transparent polycrystalline ruby ceramic by spark plasma sintering. Mater. Res. Bull. 2010, 45, 1127–1131. [Google Scholar] [CrossRef]
- Hensen, T.M.; de Dood, M.J.A.; Polman, A. Luminescence quantum efficiency and local optical density of states in thin film ruby made by ion implantation. J. Appl. Phys. 2000, 88, 5142–5147. [Google Scholar] [CrossRef]
- Okamoto, S.; Inaba, K.; Iida, T.; Ishihara, H.; Ichikawa, S.; Ashida, M. Fabrication of single-crystalline microspheres with high sphericity from anisotropic materials. Sci. Rep. 2014, 4, 5186. [Google Scholar] [CrossRef] [PubMed]
- Zheng, Y.; Wu, Z.; Ping Shum, P.; Xu, Z.; Keiser, G.; Humbert, G.; Zhang, H.; Zeng, S.; Quyen Dinh, X. Sensing and lasing applications of whispering gallery mode microresonators. Opto-Electron. Adv. 2018, 1, 18001501–18001510. [Google Scholar] [CrossRef]
- Chen, Z.; Dong, G.; Barillaro, G.; Qiu, J.; Yang, Z. Emerging and perspectives in microlasers based on rare-earth ions activated micro-/nanomaterials. Prog. Mater. Sci. 2021, 121, 100814. [Google Scholar] [CrossRef]
- Fabitha, K.; Ramachandra Rao, M.S. Biocompatible miniature temperature sensor based on whispering gallery modes of Sm3+ activated ZnO optical micro-resonators. Appl. Phys. Lett. 2021, 118, 163104. [Google Scholar] [CrossRef]
- Fabitha, K.; Wakiyama, Y.; Oshima, H.; Nakamura, D.; Ramachandra Rao, M.S. Realization of sharp visible WGM lasing from Sm3+:ZnO micro-spheres fabricated by laser ablation technique. J. Phys. D Appl. Phys. 2020, 53, 135302. [Google Scholar] [CrossRef]
- Tasaki, R.; Higashihata, M.; Suwa, A.; Ikenoue, H.; Nakamura, D. High-speed observation of semiconductor microsphere generation by laser ablation in the air. Appl. Phys. A 2018, 124, 161. [Google Scholar] [CrossRef]
- Pugina, R.S.; Hilário, E.G.; da Rocha, E.G.; da Silva-Neto, M.L.; Das, A.; Caiut, J.M.A.; Gomes, A.S.L. Nd3+:YAG microspheres powders prepared by spray pyrolysis: Synthesis, characterization and random laser application. Mater. Chem. Phys. 2021, 269, 124764. [Google Scholar] [CrossRef]
- Li, X.Z.; Liu, H.; Cheng, L.F.; Tong, H.J. Photocatalytic Oxidation Using a New Catalyst TiO2 Microspherefor Water and Wastewater Treatment. Environ. Sci. Technol. 2003, 37, 3989–3994. [Google Scholar] [CrossRef]
- Campbell, Z.S.; Bateni, F.; Volk, A.A.; Abdel-Latif, K.; Abolhasani, M. Microfluidic Synthesis of Semiconductor Materials: Toward Accelerated Materials Development in Flow. Part. Part. Syst. Charact. 2020, 37, 2000256. [Google Scholar] [CrossRef]
- Yang, Z.; Cai, W.; Zhou, J.; Xia, Q.; Wang, T. Fast, Large-Scale, and Stable Preparation of η-Al2O3 Microspheres by Fully Utilizing N,N-Dimethylformamide at Room Temperature. Ind. Eng. Chem. Res. 2020, 59, 4203–4209. [Google Scholar] [CrossRef]
- Zhang, T.; Yue, X.; Yang, D.; Guo, Q.; Qiu, F.; Li, Z. Hybridization of Al2O3 microspheres and acrylic ester resins as a synergistic absorbent for selective oil and organic solvent absorption. Appl. Organomet. Chem. 2018, 32, e4244. [Google Scholar] [CrossRef]
- Wu, J.-M.; Li, M.; Liu, S.-S.; Shi, Y.-S.; Li, C.-H.; Wang, W. Selective laser sintering of porous Al2O3-based ceramics using both Al2O3 and SiO2 poly-hollow microspheres as raw materials. Ceram. Int. 2021, 47, 15313–15318. [Google Scholar] [CrossRef]
- Lewis, P.M.; Keerthana, N.; Hebbar, D.; Choudhari, K.S.; Kulkarni, S.D. Cr3+ doped Al2O3 nanoparticles: Effect of Cr3+ content in intensifying red emission. Curr. Appl. Phys. 2021, 32, 71–77. [Google Scholar] [CrossRef]
- Ratzker, B.; Wagner, A.; Favelukis, B.; Goldring, S.; Kalabukhov, S.; Frage, N. Optical properties of transparent polycrystalline ruby (Cr:Al2O3) fabricated by high-pressure spark plasma sintering. J. Eur. Ceram. Soc. 2021, 41, 3520–3526. [Google Scholar] [CrossRef]
- Apetz, R.; Bruggen, M.P.B. Transparent Alumina: A Light-Scattering Model. J. Am. Ceram. Soc. 2003, 86, 480–486. [Google Scholar] [CrossRef]
- Drdlikova, K.; Klement, R.; Drdlik, D.; Galusek, D.; Maca, K. Processing and properties of luminescent Cr3+ doped transparent alumina ceramics. J. Eur. Ceram. Soc. 2020, 40, 2573–2580. [Google Scholar] [CrossRef]
- Liu, Q.; Yang, Q.H.; Zhao, G.G.; Lu, S.Z.; Zhang, H.J. The thermoluminescence and optically stimulated luminescence properties of Cr-doped alpha alumina transparent ceramics. J. Alloys Compd. 2013, 579, 259–262. [Google Scholar] [CrossRef]
- Vlasova, M.; Ragulya, A.; Stetsenko, V.; Kakazey, M.; Aguilar, M.; Timofeeva, I.; Tomila, T.; Arellano, J. The layer by layer selective laser synthesis of ruby. Sci. Sinter. 2010, 42, 3–13. [Google Scholar] [CrossRef]
- Thapa, J.; Liu, B.; Woodruff, S.D.; Chorpening, B.T.; Buric, M.P. Raman scattering in single-crystal sapphire at elevated temperatures. Appl. Opt. 2017, 56, 8598. [Google Scholar] [CrossRef] [PubMed]
- Porto, S.P.S.; Krishnan, R.S. Raman Effect of Corundum. J. Chem. Phys. 1967, 47, 1009–1012. [Google Scholar] [CrossRef]
- Schawlow, A.L.; Wood, D.L.; Clogston, A.M. Electronic Spectra of Exchange-Coupled Ion Pairs in Crystals. Phys. Rev. Lett. 1959, 3, 271–273. [Google Scholar] [CrossRef]
- Powell, R.C.; DiBartolo, B.; Birang, B.; Naiman, C.S. Temperature Dependence of the Widths and Positions of the R and N Lines in Heavily Doped Ruby. J. Appl. Phys. 1966, 37, 4973–4978. [Google Scholar] [CrossRef]
- Imbusch, G.F. Energy Transfer in Ruby. Phys. Rev. 1967, 153, 326–337. [Google Scholar] [CrossRef]
- Powell, R.C.; DiBartolo, B.; Birang, B.; Naiman, C.S. Fluorescence studies of energy transfer between single and pair Cr3+ systems in Al2O3. Phys. Rev. 1967, 155, 296–308. [Google Scholar] [CrossRef]
- Powell, R.C.; Dibartolo, B. Optical properties of heavily doped ruby. Phys. Status Solidi 1972, 10, 315–357. [Google Scholar] [CrossRef]
- Adachi, S. Luminescence spectroscopy of Cr3+ in Al2O3 polymorphs. Opt. Mater. 2021, 114, 111000. [Google Scholar] [CrossRef]
- Birang, B.; Di Bartolo, B.; Powell, R.C. Temperature Effects on Several Fluorescence Pair Lines in Ruby. J. Appl. Phys. 1967, 38, 5113–5116. [Google Scholar] [CrossRef]
- Tokida, Y.; Adachi, S. Photoluminescence spectroscopy and energy-level analysis of metal-organic-deposited Ga2O3:Cr3+ films. J. Appl. Phys. 2012, 112, 063522. [Google Scholar] [CrossRef]
- Fonger, W.H.; Struck, C.W. Temperature dependences of Cr+3 radiative and nonradiative transitions in ruby and emerald. Phys. Rev. B 1975, 11, 3251–3260. [Google Scholar] [CrossRef]
- Dexter, D.L. A Theory of Sensitized Luminescence in Solids. J. Chem. Phys. 1953, 21, 836–850. [Google Scholar] [CrossRef]
- Förster, T. Mechanisms of Energy Transfer. In Comprehensive Biochemistry; Elsevier: Amsterdam, The Netherlands, 1967; pp. 61–80. [Google Scholar]
Disclaimer/Publisher’s Note: The statements, opinions and data contained in all publications are solely those of the individual author(s) and contributor(s) and not of MDPI and/or the editor(s). MDPI and/or the editor(s) disclaim responsibility for any injury to people or property resulting from any ideas, methods, instructions or products referred to in the content. |
© 2024 by the authors. Licensee MDPI, Basel, Switzerland. This article is an open access article distributed under the terms and conditions of the Creative Commons Attribution (CC BY) license (https://creativecommons.org/licenses/by/4.0/).