Abstract
The effects of the anisotropic properties (wettability and roughness) of microgrooved surfaces on heat transfer were experimentally investigated during pool boiling using Novec-7100 as a working fluid. The idea for introducing the concept of anisotropic wettability in boiling experiments draws inspiration from biphilic surfaces. The investigation is also motivated by two-phase immersion cooling, which involves phase-change heat transfer, using a dielectric liquid as a working fluid. Very few studies have focused on the effects of surfaces with anisotropic properties on boiling performance. Thus, this study aims to examine the pool-boiling heat transfer performance on surfaces with microgroove-induced anisotropic properties under the saturation condition. A femtosecond-laser texturing method was employed to create microgrooved surfaces with different groove spacings. The results indicated that anisotropic properties affected the heat transfer coefficient and critical heat flux. Relative to the plain surface, microgrooved surfaces enhanced the heat transfer performance due to the increased number of bubble nucleation sites and higher bubble detachment frequency. An analysis of bubble dynamics under different surface conditions was conducted with the assistance of high-speed images. The microgrooved surface with a groove spacing of 100 μm maximally increased the BHTC by 37% compared with that of the plain surface. Finally, the CHF results derived from experiments were compared with related empirical correlations. Good agreement was achieved between the results and the prediction correlation.
1. Introduction
With the growing ubiquity of information technologies, the development of data centers is becoming increasingly necessary. Owing to the high-power requirement of these data centers, cooling methods are crucial for dealing with large amounts of waste heat generated by the servers. The total power consumption of data centers has significantly increased [1,2] and is projected to make up ~20% of global electricity usage by 2025 [3]. To mitigate the electricity usage, liquid cooling has become popular for its outstanding energy efficiency and cooling performance. For example, two-phase immersion cooling using highly wetted dielectric liquids as working fluids is a promising liquid cooling method, notable for its exceptional heat transfer performance and energy efficiency. This liquid cooling technique can significantly reduce the PUE to approximately 1.08 [3] relative to 1.38 for air cooling. The applications of immersion cooling are expected to be observed in data centers [4,5,6], solar panels [7,8,9], and electrochemical batteries [10,11,12]. The primary heat transfer mechanism of two-phase immersion cooling is related to the boiling heat transfer. The boiling mechanism has been widely applied in various fields, including electronic devices [13,14,15], nuclear power plants [16,17], and ink head printers [18,19,20].
The boiling heat transfer performance mainly depends on the surface characteristics. Surface roughness and wettability play essential roles in boiling. As the surface roughness increases, the heat transfer coefficient (HTC) also enhances owing to the increased number of bubble nucleation sites [21,22,23,24]. Highly wetted surfaces exhibit lower HTCs at low heat-flux intervals because they require more thermal energy to activate bubble nucleation. Conversely, surfaces with lower wettability show higher HTCs at low heat-flux intervals because they allow for early bubble nucleation and more nucleation sites [25,26,27,28]. The relationship between HTC and CHF has been established such that a surface with low wettability achieves an increased HTC at the expense of a decreased CHF. In contrast, a surface with high wettability achieves an increased CHF at the expense of a decreased HTC [29,30,31].
Owing to the development of two-phase immersion cooling, boiling with highly wetted liquids has been extensively studied in recent years. To improve the boiling heat transfer of a highly wetted liquid, surface modification methods, such as ultrafast laser texturing [32,33,34] and chemical coating [28,35], have been widely used. Gregorcic et al. [32] conducted pool boiling experiments using water and FC-72 on laser-textured surfaces. The laser-textured surfaces offered multi-scale microcavities to facilitate nucleation. Ho et al. [33] conducted pool boiling experiments using water and FC-72 as working fluids on surfaces produced using selective laser melting. They found that the fin separation of micro-fin surfaces had a significant impact on the HTC. Their results indicated that the optimal fin separation for micro-fin surfaces was 300 μm. Su et al. [28] conducted pool boiling tests on graphene and fluorinated-graphene-coated surfaces, using R-141b as a working fluid. The superior heat transfer performance of the F-graphene-coated surface was attributed to its highest contact angle among the test surfaces, which led to a greater number of nucleation sites.
To further enhance BHTC, the use of a biphilic surface as a boiling surface is beneficial because it exploits the advantages of high and low wettabilities. Inspired by biphilic surfaces [36,37,38], surfaces with anisotropic wettability also exhibit distinct wettability characteristics [39,40,41,42,43]. Liu et al. [40] used a laser belt–processing method to create microgrooves on an Inconel 718 surface. The contact angle measured in the direction parallel to the groove was different from that measured in the normal direction. This phenomenon was attributed to variations in the energy barriers between the two directions. Similar findings were reported in [41], which demonstrated the presence of an energy barrier that liquid droplets must overcome in the normal direction. Droplets were attracted to the microstructure and extended in the direction parallel to the microgrooves, facilitated by the continuous three-phase contact lines along the microgrooves. These microgrooves effectively prevented the diffusion of droplets in the normal direction.
In the present work, although the test surfaces were not biphilic surfaces, the idea of surface modification came from the concept of wettability difference on a surface. Very few studies have investigated the boiling heat transfer of a copper surface with anisotropic properties, particularly when a dielectric liquid (Novec-7100) is employed as the working fluid. Novec-7100 was selected as a working fluid owing to its electrical insulating property and potential for developing two-phase immersion cooling. Therefore, this study investigated the effects of anisotropic properties on microgrooved surfaces in boiling heat transfer, using Novec-7100 as a working fluid. During the experiments, bubble dynamics were analyzed through high-speed visualizations. The HTC and CHF performances are discussed with the assistance of bubble dynamics and the mechanisms of the anisotropic properties.
2. Experiments
2.1. Experimental Setup
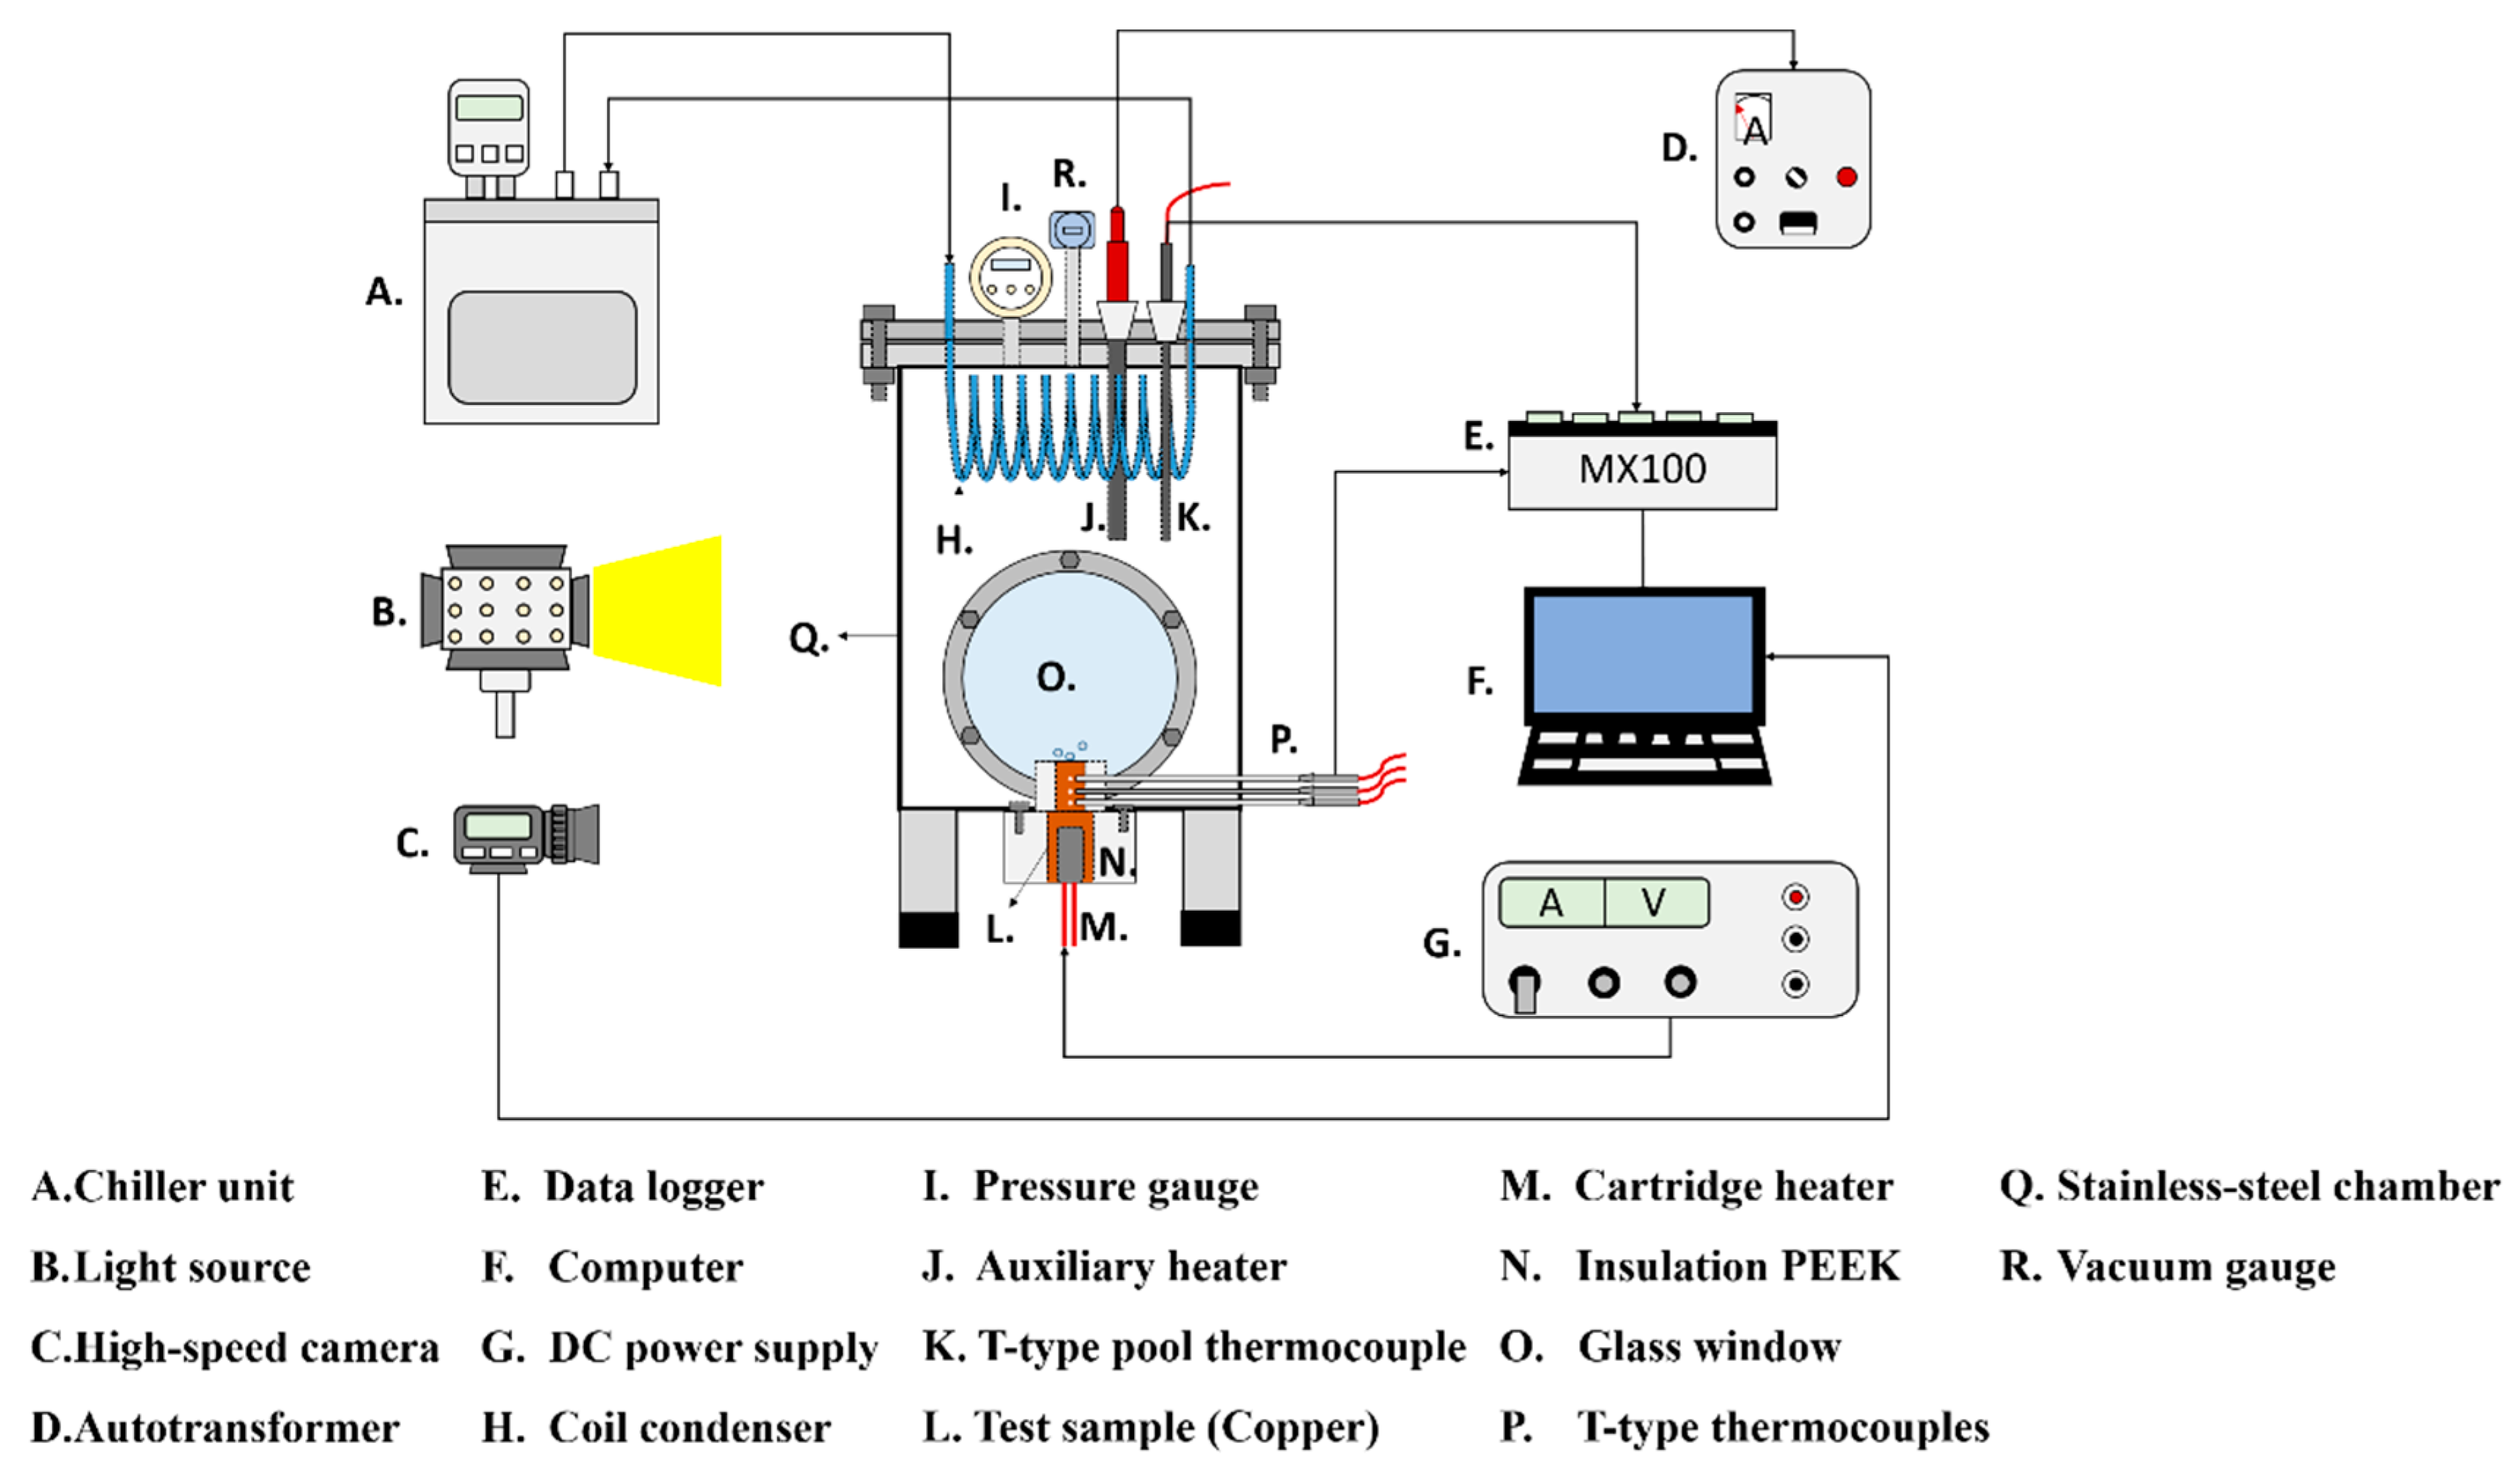
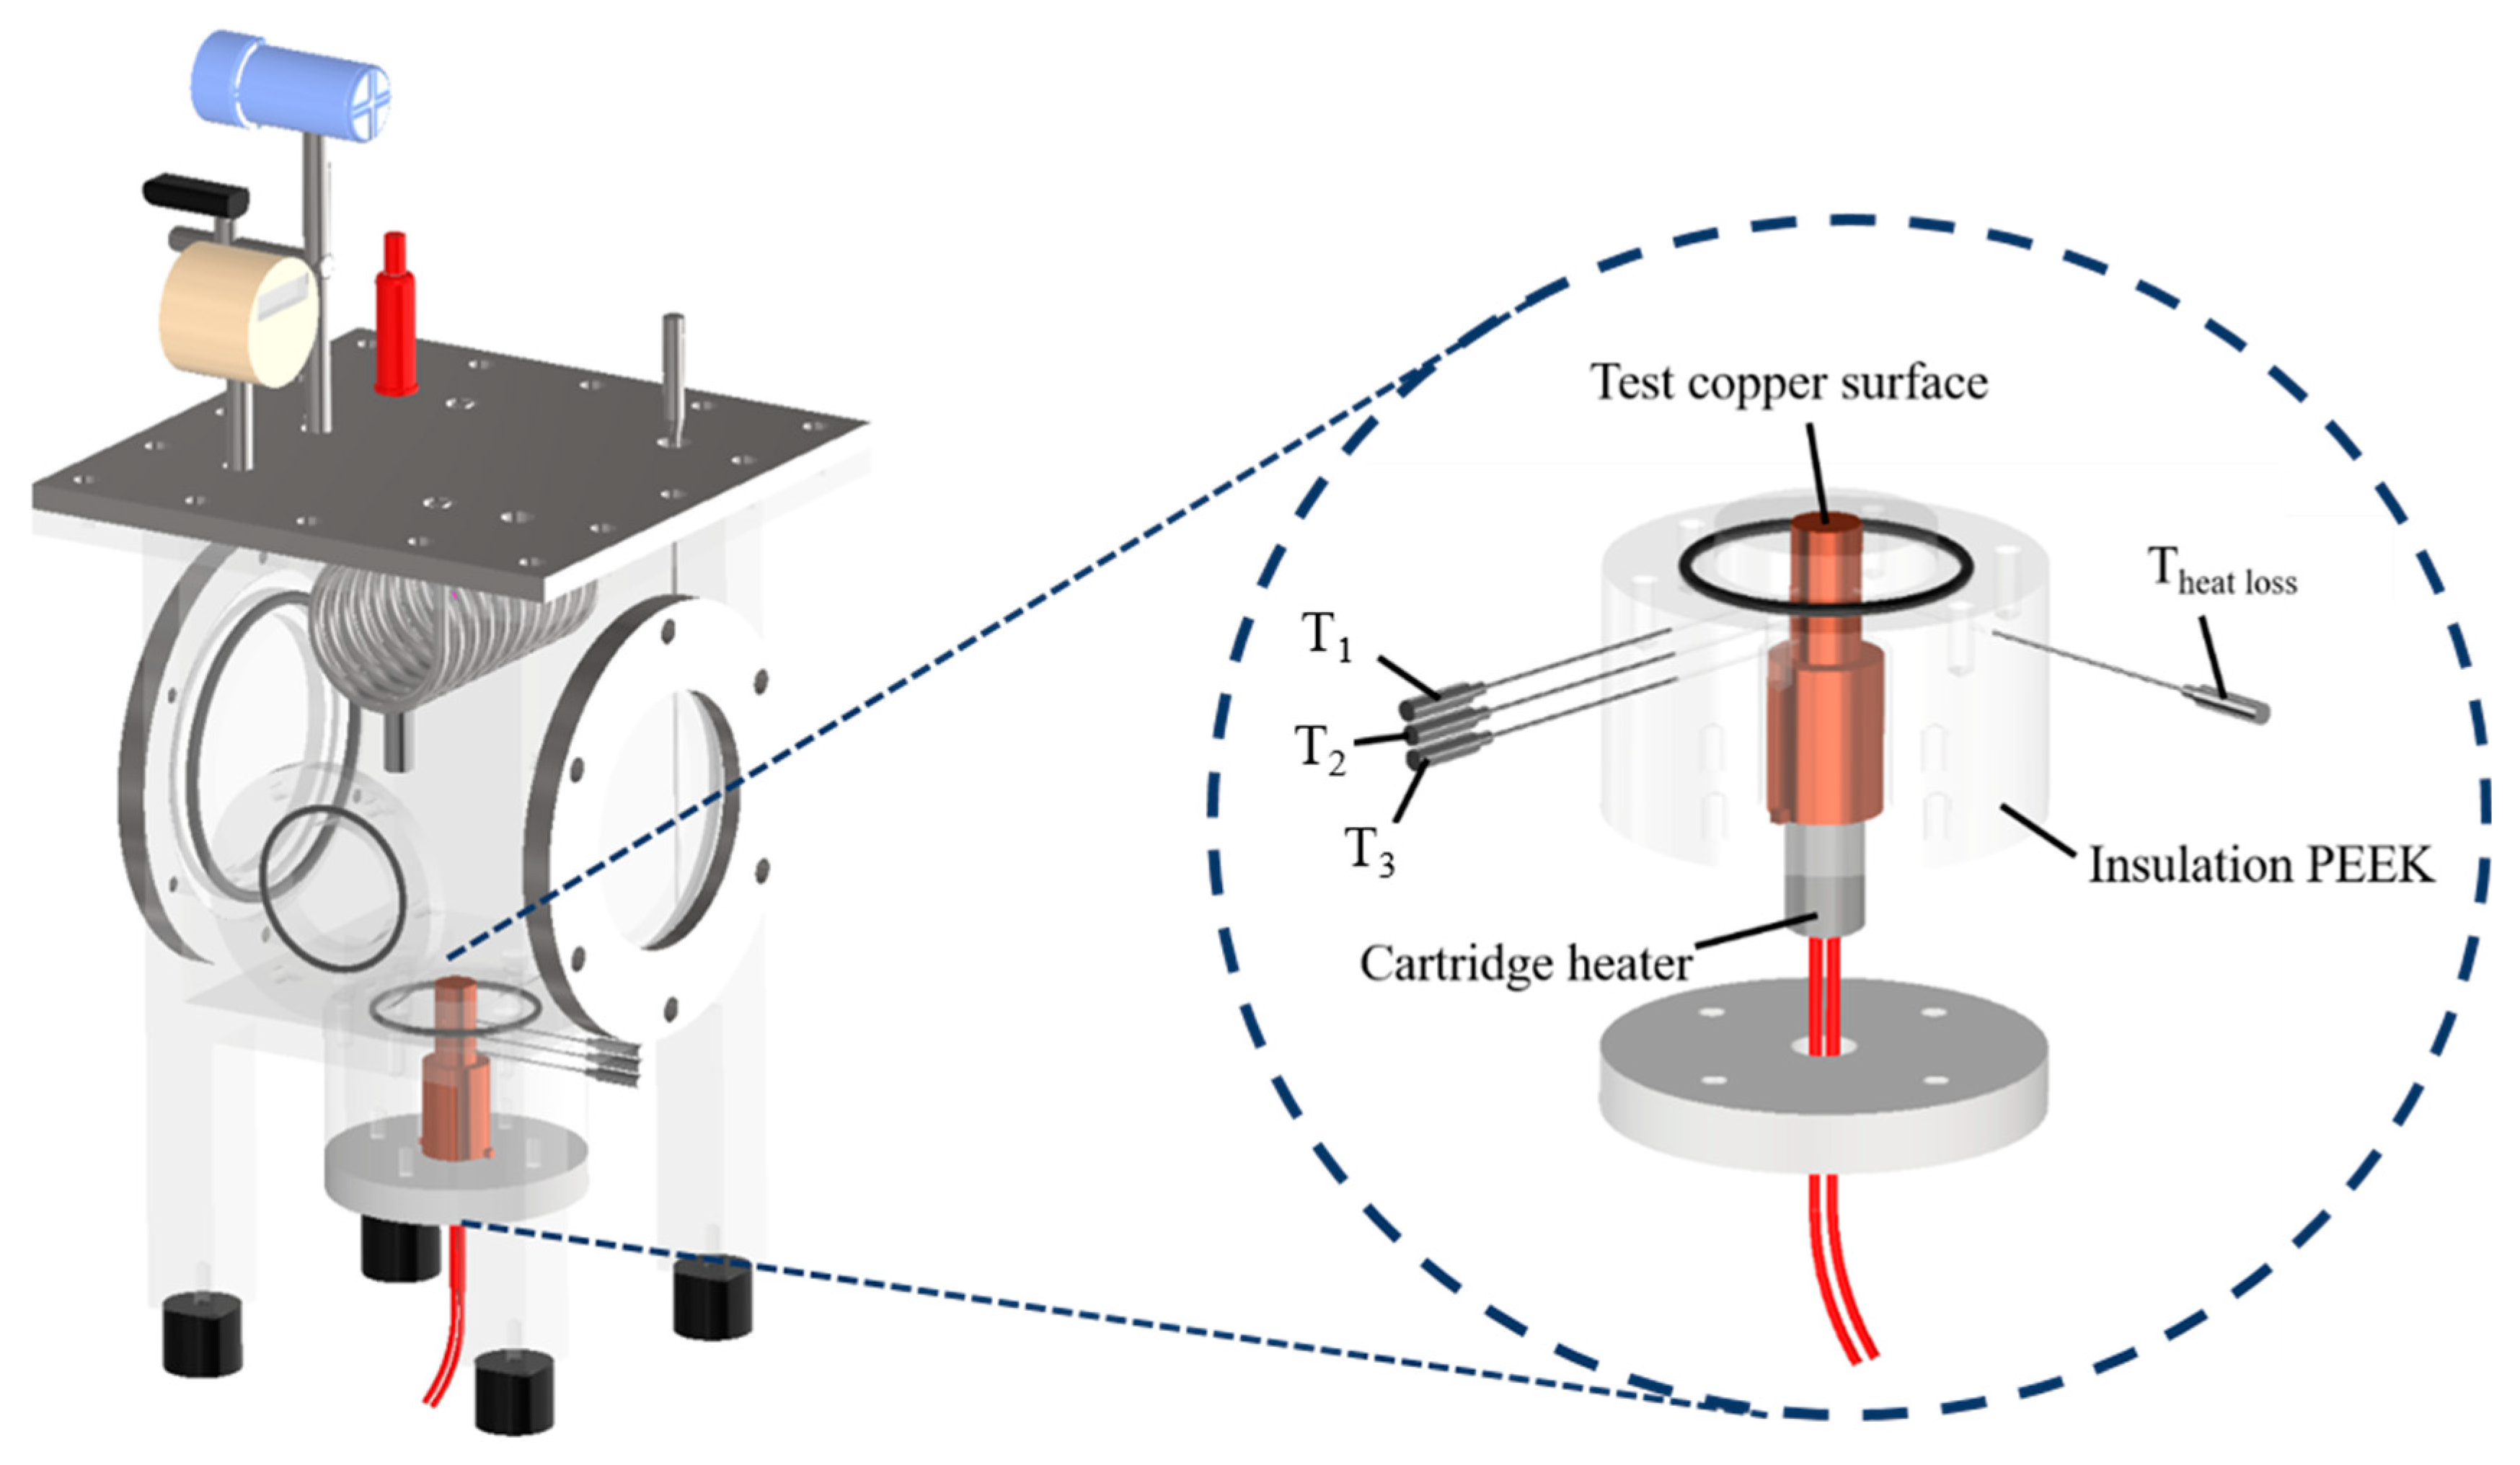
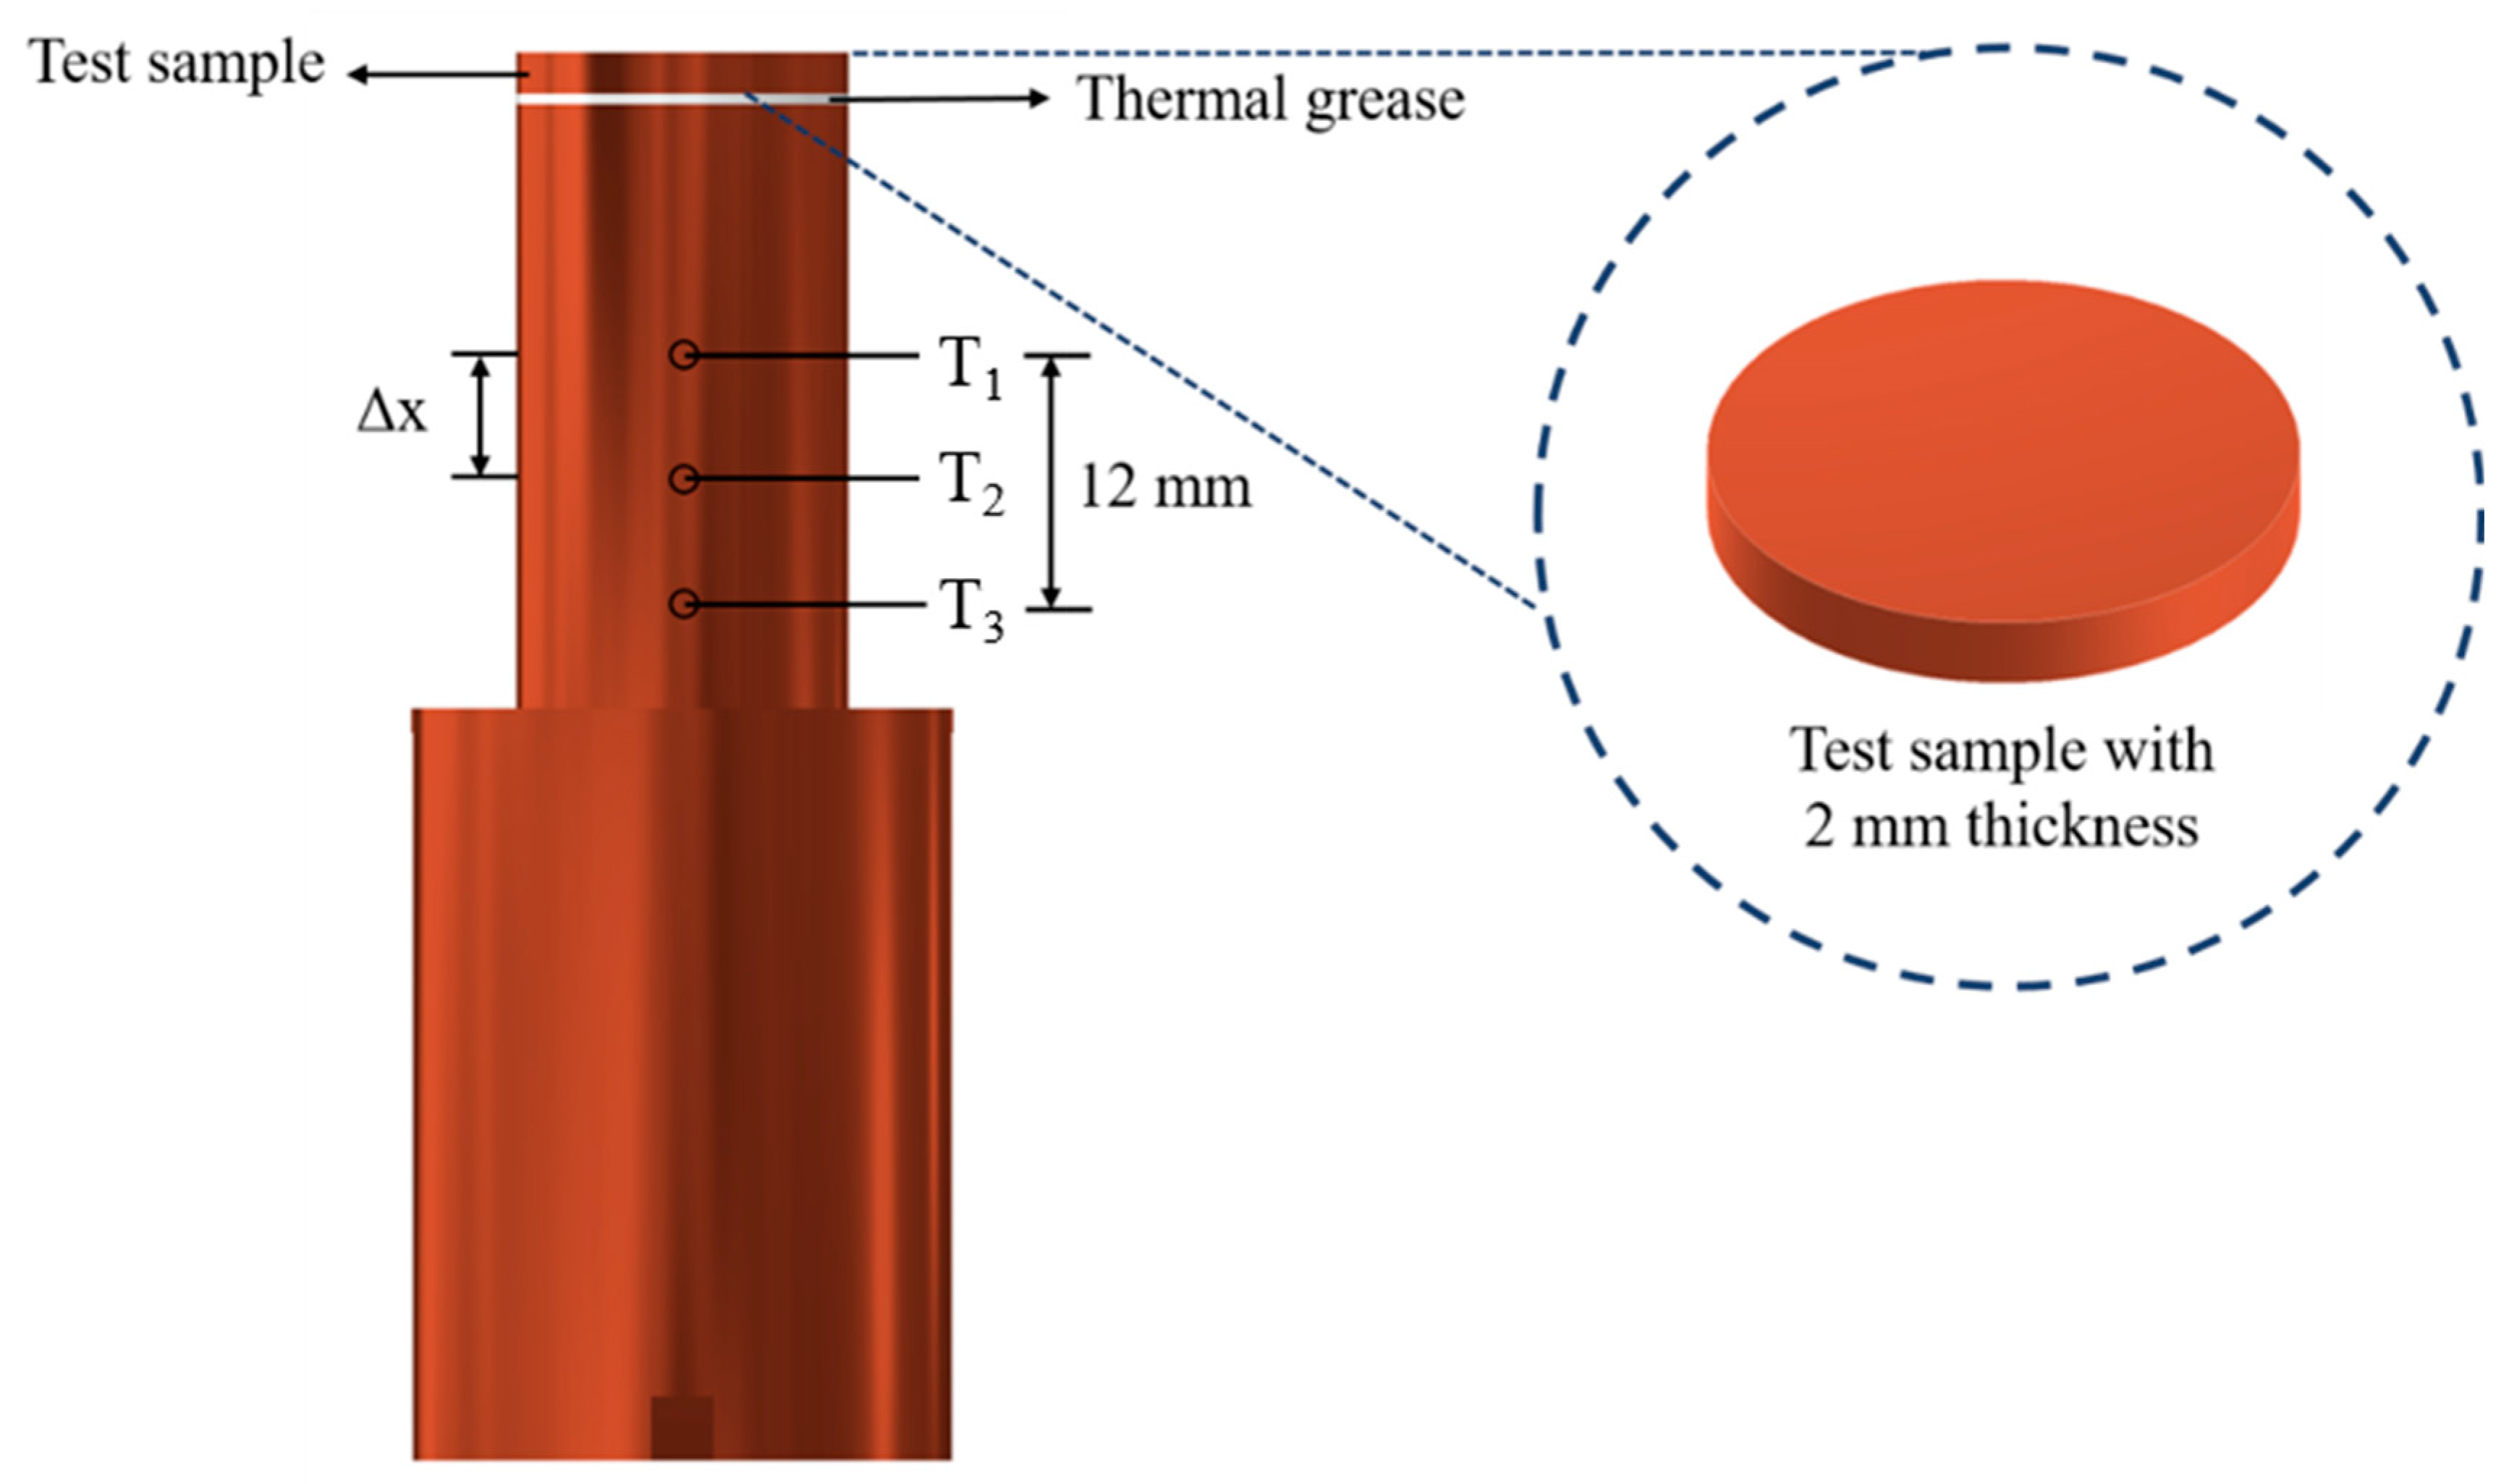
The experimental setup is shown in Figure 1. This setup aimed to investigate the effects of the anisotropic properties of microgrooved flat copper surfaces on the heat transfer during pool boiling. All the experiments were conducted under atmospheric pressure, and the working fluid was maintained at the saturation temperature. The dielectric liquid (Novec-7100, 3M) was employed as the working fluid in the experiments. An auxiliary heater (CCTCL) connected to an autotransformer (CCTCL) was used to maintain the saturated state of the working fluid. To supply power to the test sample, a cartridge heater (220 V/800 W, CCTCL) was used and inserted into a copper block, as shown in Figure 2. The heat input to the cartridge heater was regulated using a DC power supply (GPR-20H50D, GW Instek). The copper block was covered with a PEEK holder (0.25 W/m·K) to ensure thermal insulation. Three T-type thermocouples (CCTCL) connected to a data logger (MX100) were inserted into the copper block to record temperature data for the heat transfer analysis, as depicted in Figure 2. To reduce the heat resistance, thermal grease (SG-7650, Hasuncast), with a thermal conductivity of 0.94 W/m·K, was applied to the surface of the cartridge heater and the thermocouples. The test sample, with a thickness of 2 mm and a diameter of 16 mm, was pasted on the top surface of the copper block (Figure 3), and a thermal grease made of liquid metal (Thermalright, Silver King, 79 W/m·K) was applied at the interface between the test sample and copper block.
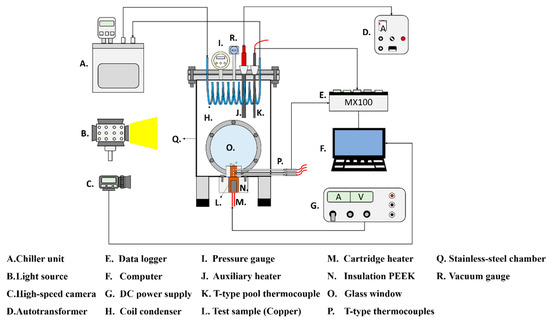
Figure 1.
Schematic of the pool boiling experimental setup.
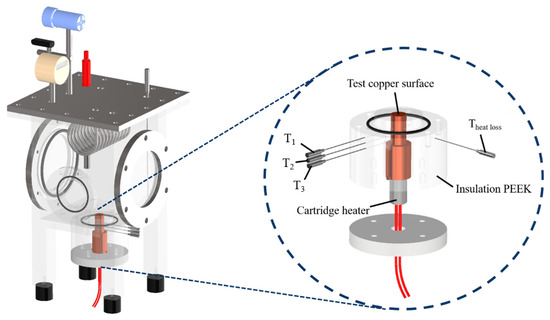
Figure 2.
Three-dimensional computer-aided design of the boiling chamber. (T1, T2 and T3 are the measured temperatures of the thermocouples at distances of 14 mm, 20 mm and 26 mm from the test copper surface. Theat loss is the measured temperature of the thermocouple for heat loss evaluation in the radial direction).

Figure 3.
Design of the test section. (T1, T2 and T3 are the measured temperatures of the thermocouples at distances of 14 mm, 20 mm and 26 mm from the test copper surface. Theat loss is the measured temperature of the thermocouple for heat loss evaluation in the radial direction).
To maintain the working fluid’s circulation and atmospheric pressure, a coil condenser (CCTCL) was installed inside the boiling chamber and connected to the cooling system. The cooling coil was able to condense the saturated vapor back to the bulk liquid pool. High-speed images of boiling bubbles were captured using a high-speed camera (AOS technologies AG, Promon U800) at a fixed frame rate of 210 fps and a spatial resolution of 1280 × 1024. A white-light-emitting diode was used for illumination during high-speed image recording.
2.2. Properties of Working Fluid
To prevent electricity conduction, a dielectric fluid with a high dielectric constant is widely used in immersion cooling [44]. The boiling experiment is a simple way to investigate the two-phase heat transfer performance of dielectric liquids. In some previous studies, dielectric liquids have been employed as working fluids for boiling experiments [45,46]. The dielectric liquid produced by the 3M company consists of the FC and Novec series. The primary difference between these two series lies in their global warming potential (GWP). The Novec series offers a significantly lower GWP, making it a superior alternative to the FC series. Therefore, Novec-7100, with a lower GWP and a boiling point of 61 °C, was chosen as the working fluid in this study. Unlike DI water, Novec-7100 exhibits a much lower surface tension (9.3 mN/m) and boiling point (61 °C). Owing to a significant reduction in surface tension, the CA of Novec-7100 on a plain copper surface is ~15°, and that of DI water on a plain copper surface is ~73°. The properties of DI water and Novec-7100 are listed in Table 1.

Table 1.
Properties of Novec-7100 and DI water at their boiling points.
2.3. Surface Preparation
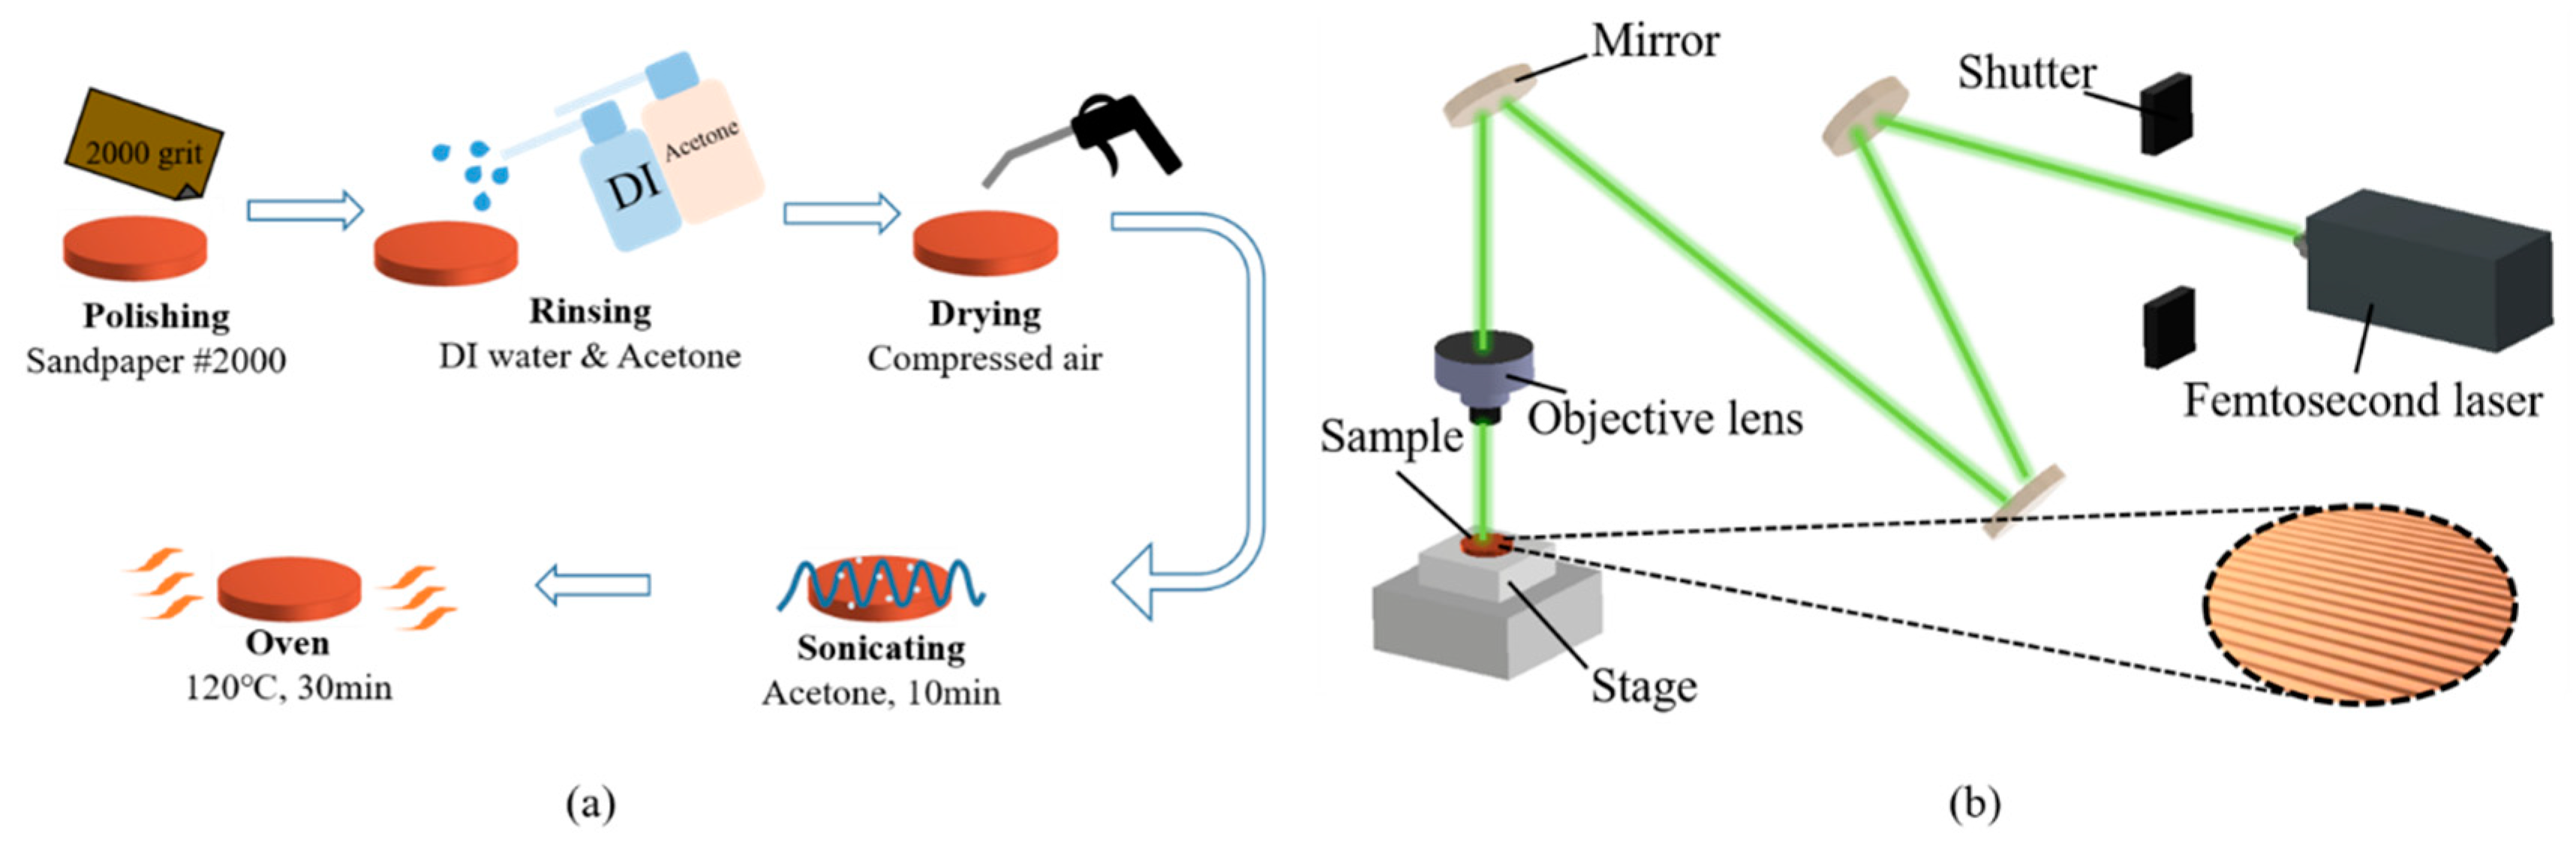
The flat copper samples, with a thickness and diameter of 2 mm and 16 mm, respectively, were used as the test surfaces in the boiling experiments. The procedure for fabricating smooth copper surfaces is illustrated in Figure 4a. To remove the oxidation layer, the copper samples were polished using 2000-grit sandpaper. After polishing, the samples were rinsed with deionized water and acetone. Subsequently, the copper samples were immersed in acetone and subjected to sonication for 10 min to completely remove the residue on the surface. Finally, the copper samples were dried in an oven for 10 min.
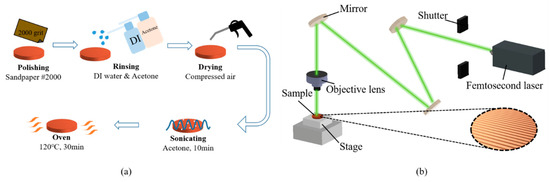
Figure 4.
Surface treatment before the boiling experiments: (a) sandpaper polishing process; (b) laser texturing process.
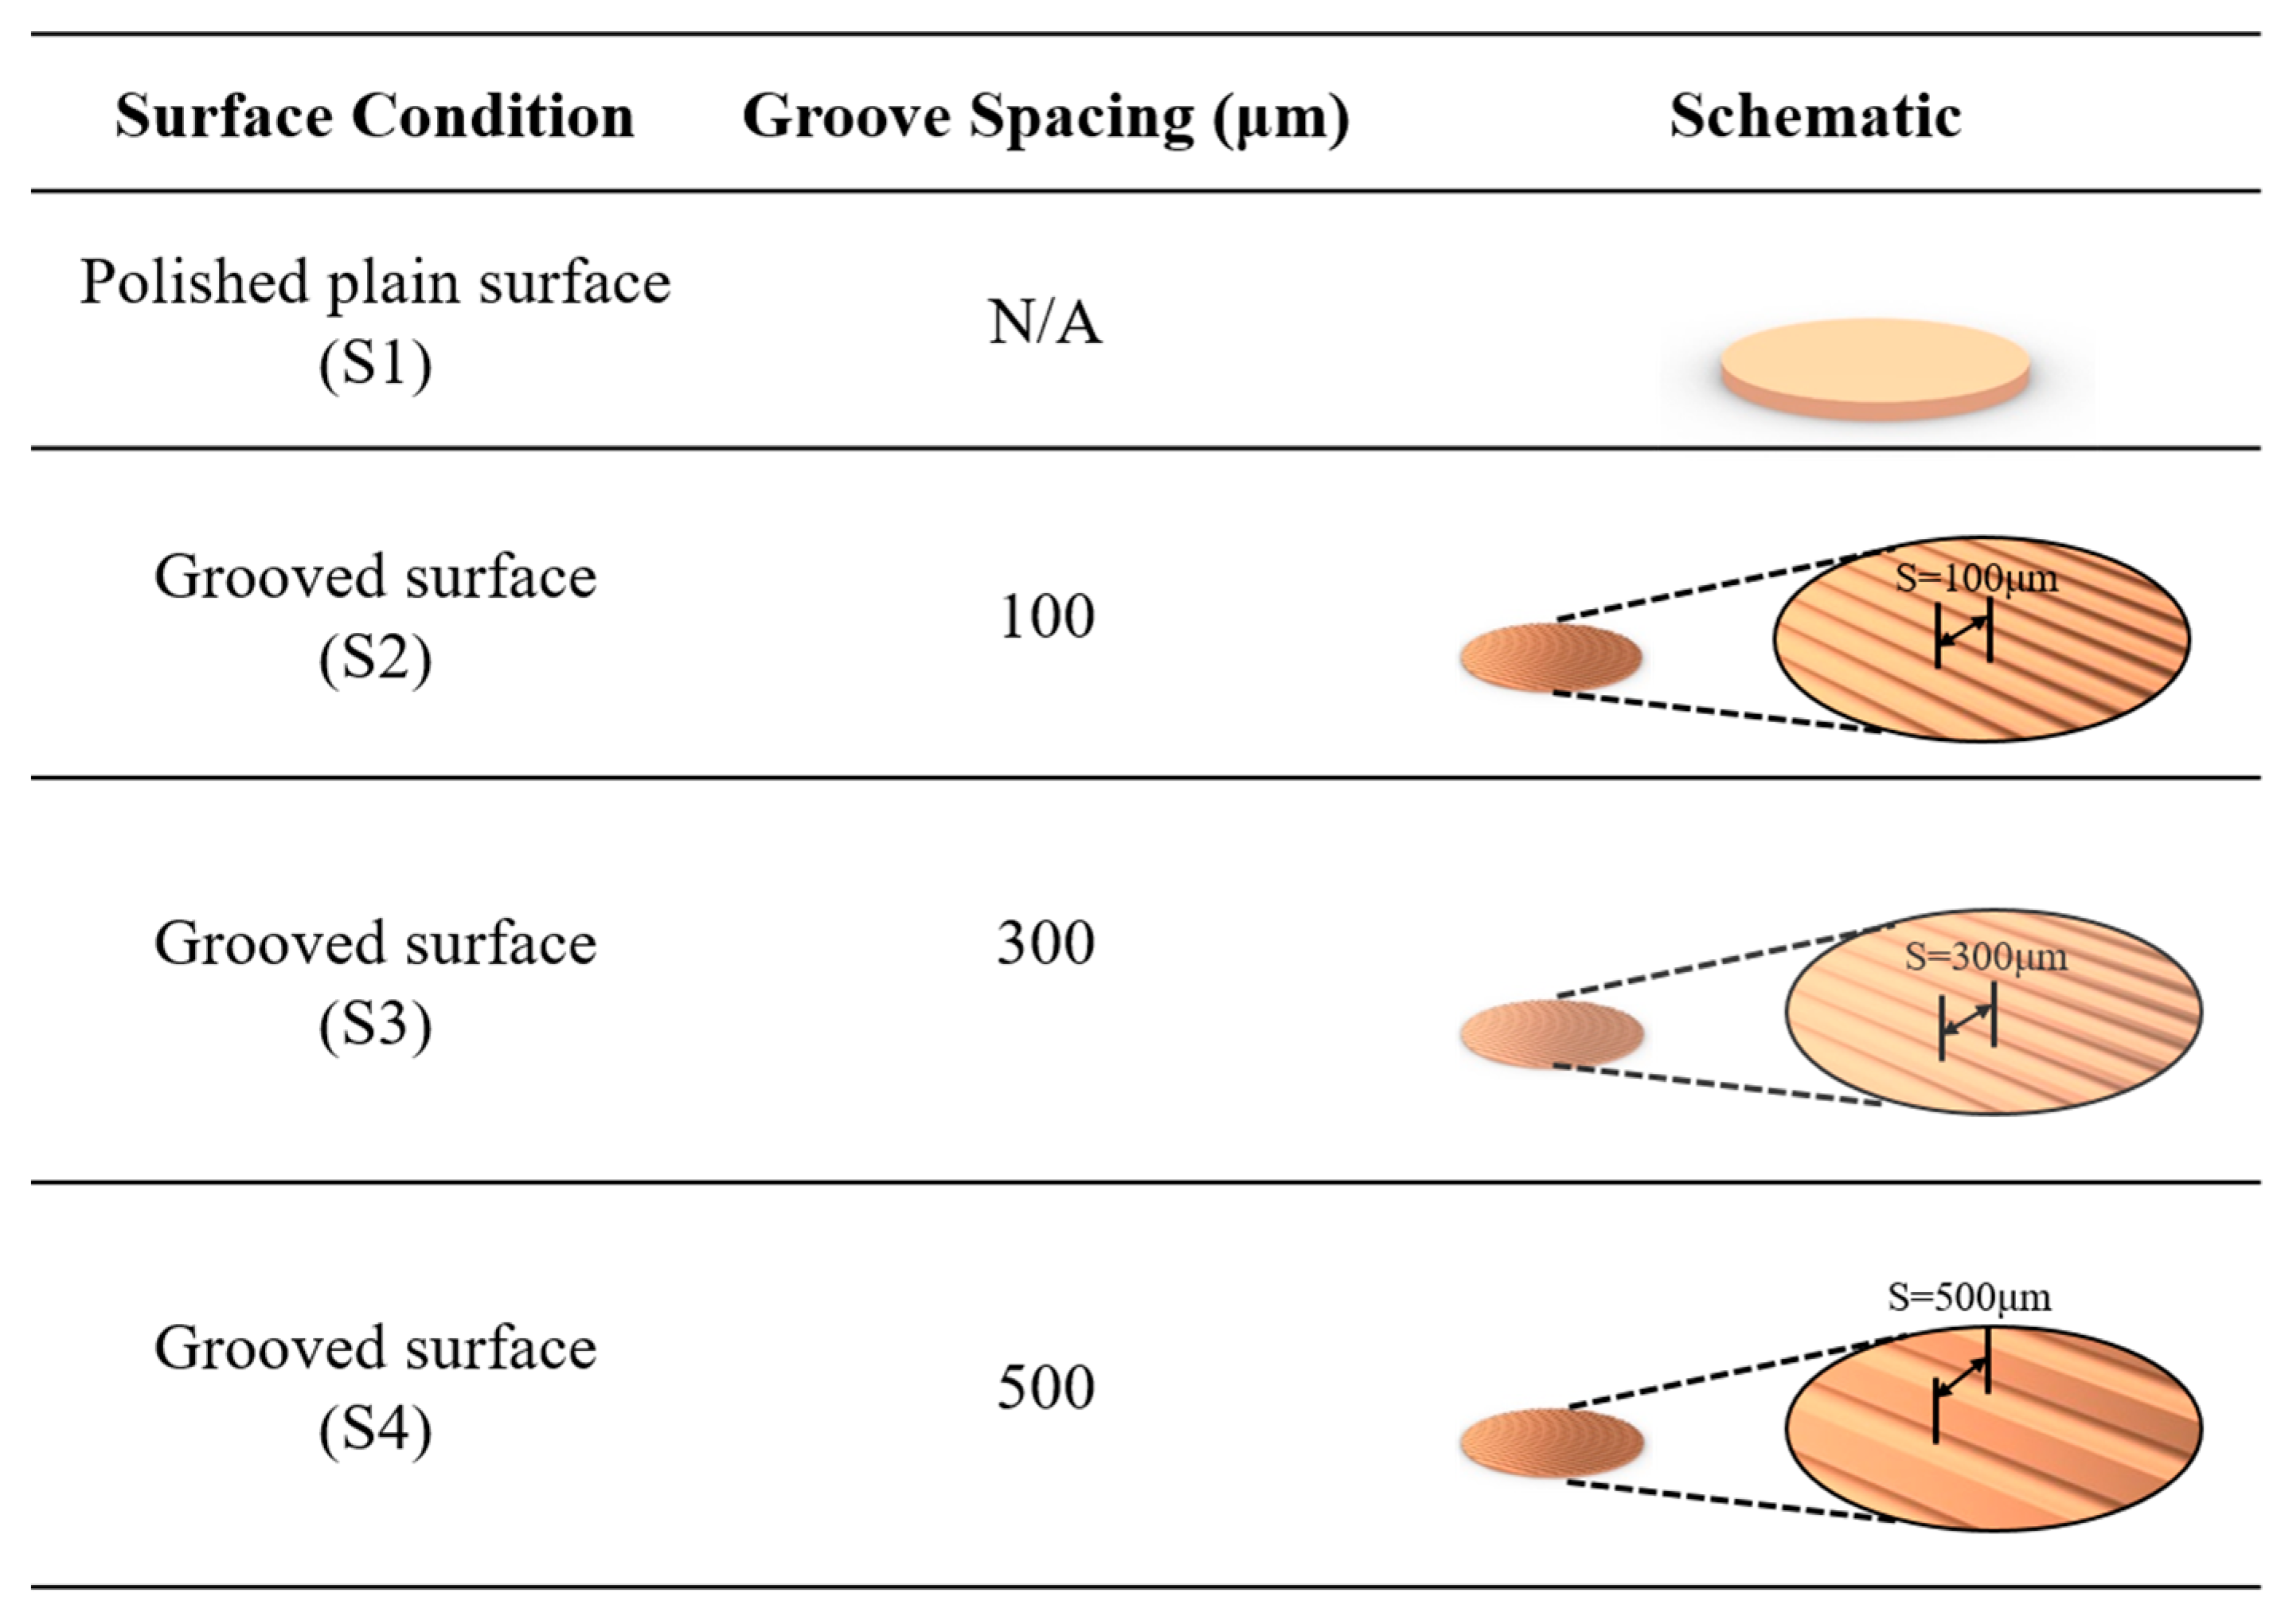
The plain copper samples were textured with microgrooves, using a femtosecond laser (Tongtai, TLFS-500). The parameters of the femtosecond laser are listed in Table 2. The laser system had an average power of 5.4 W, a scanning speed of 100 mm/s, and a pulse repetition rate of 1 MHz. A schematic of the laser-scanning path is shown in Figure 5. The horizontal line interval for each scanning path was 10 μm, and the diameter of the laser spot size was 15 μm. A total laser fluence of ~3 J/cm2 was used to fabricate microgrooves on the plain surfaces. All the test surface conditions are listed in Figure 6. S1 represents the plain copper surface; S2, S3, and S4 represent the microgrooved surfaces under the condition of different groove spacings. The various groove spacings were produced by changing the number of laser-scanning paths.
Table 2.
Parameters of ultrafast femtosecond laser.
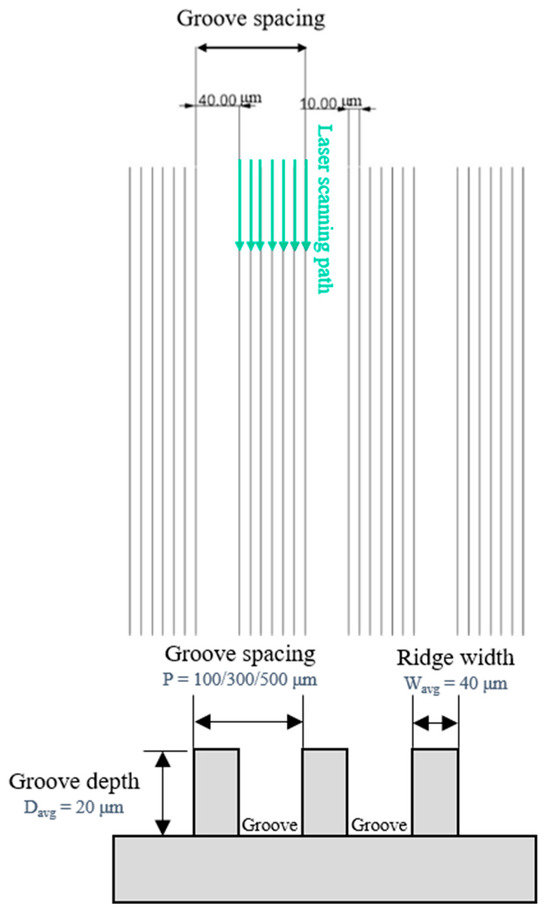
Figure 5.
Schematic of laser-scanning path and groove spacing in the present study.

Figure 6.
Schematic of test surface conditions in pool boiling experiments.
2.4. Surface Characterization
2.4.1. Surface Roughness
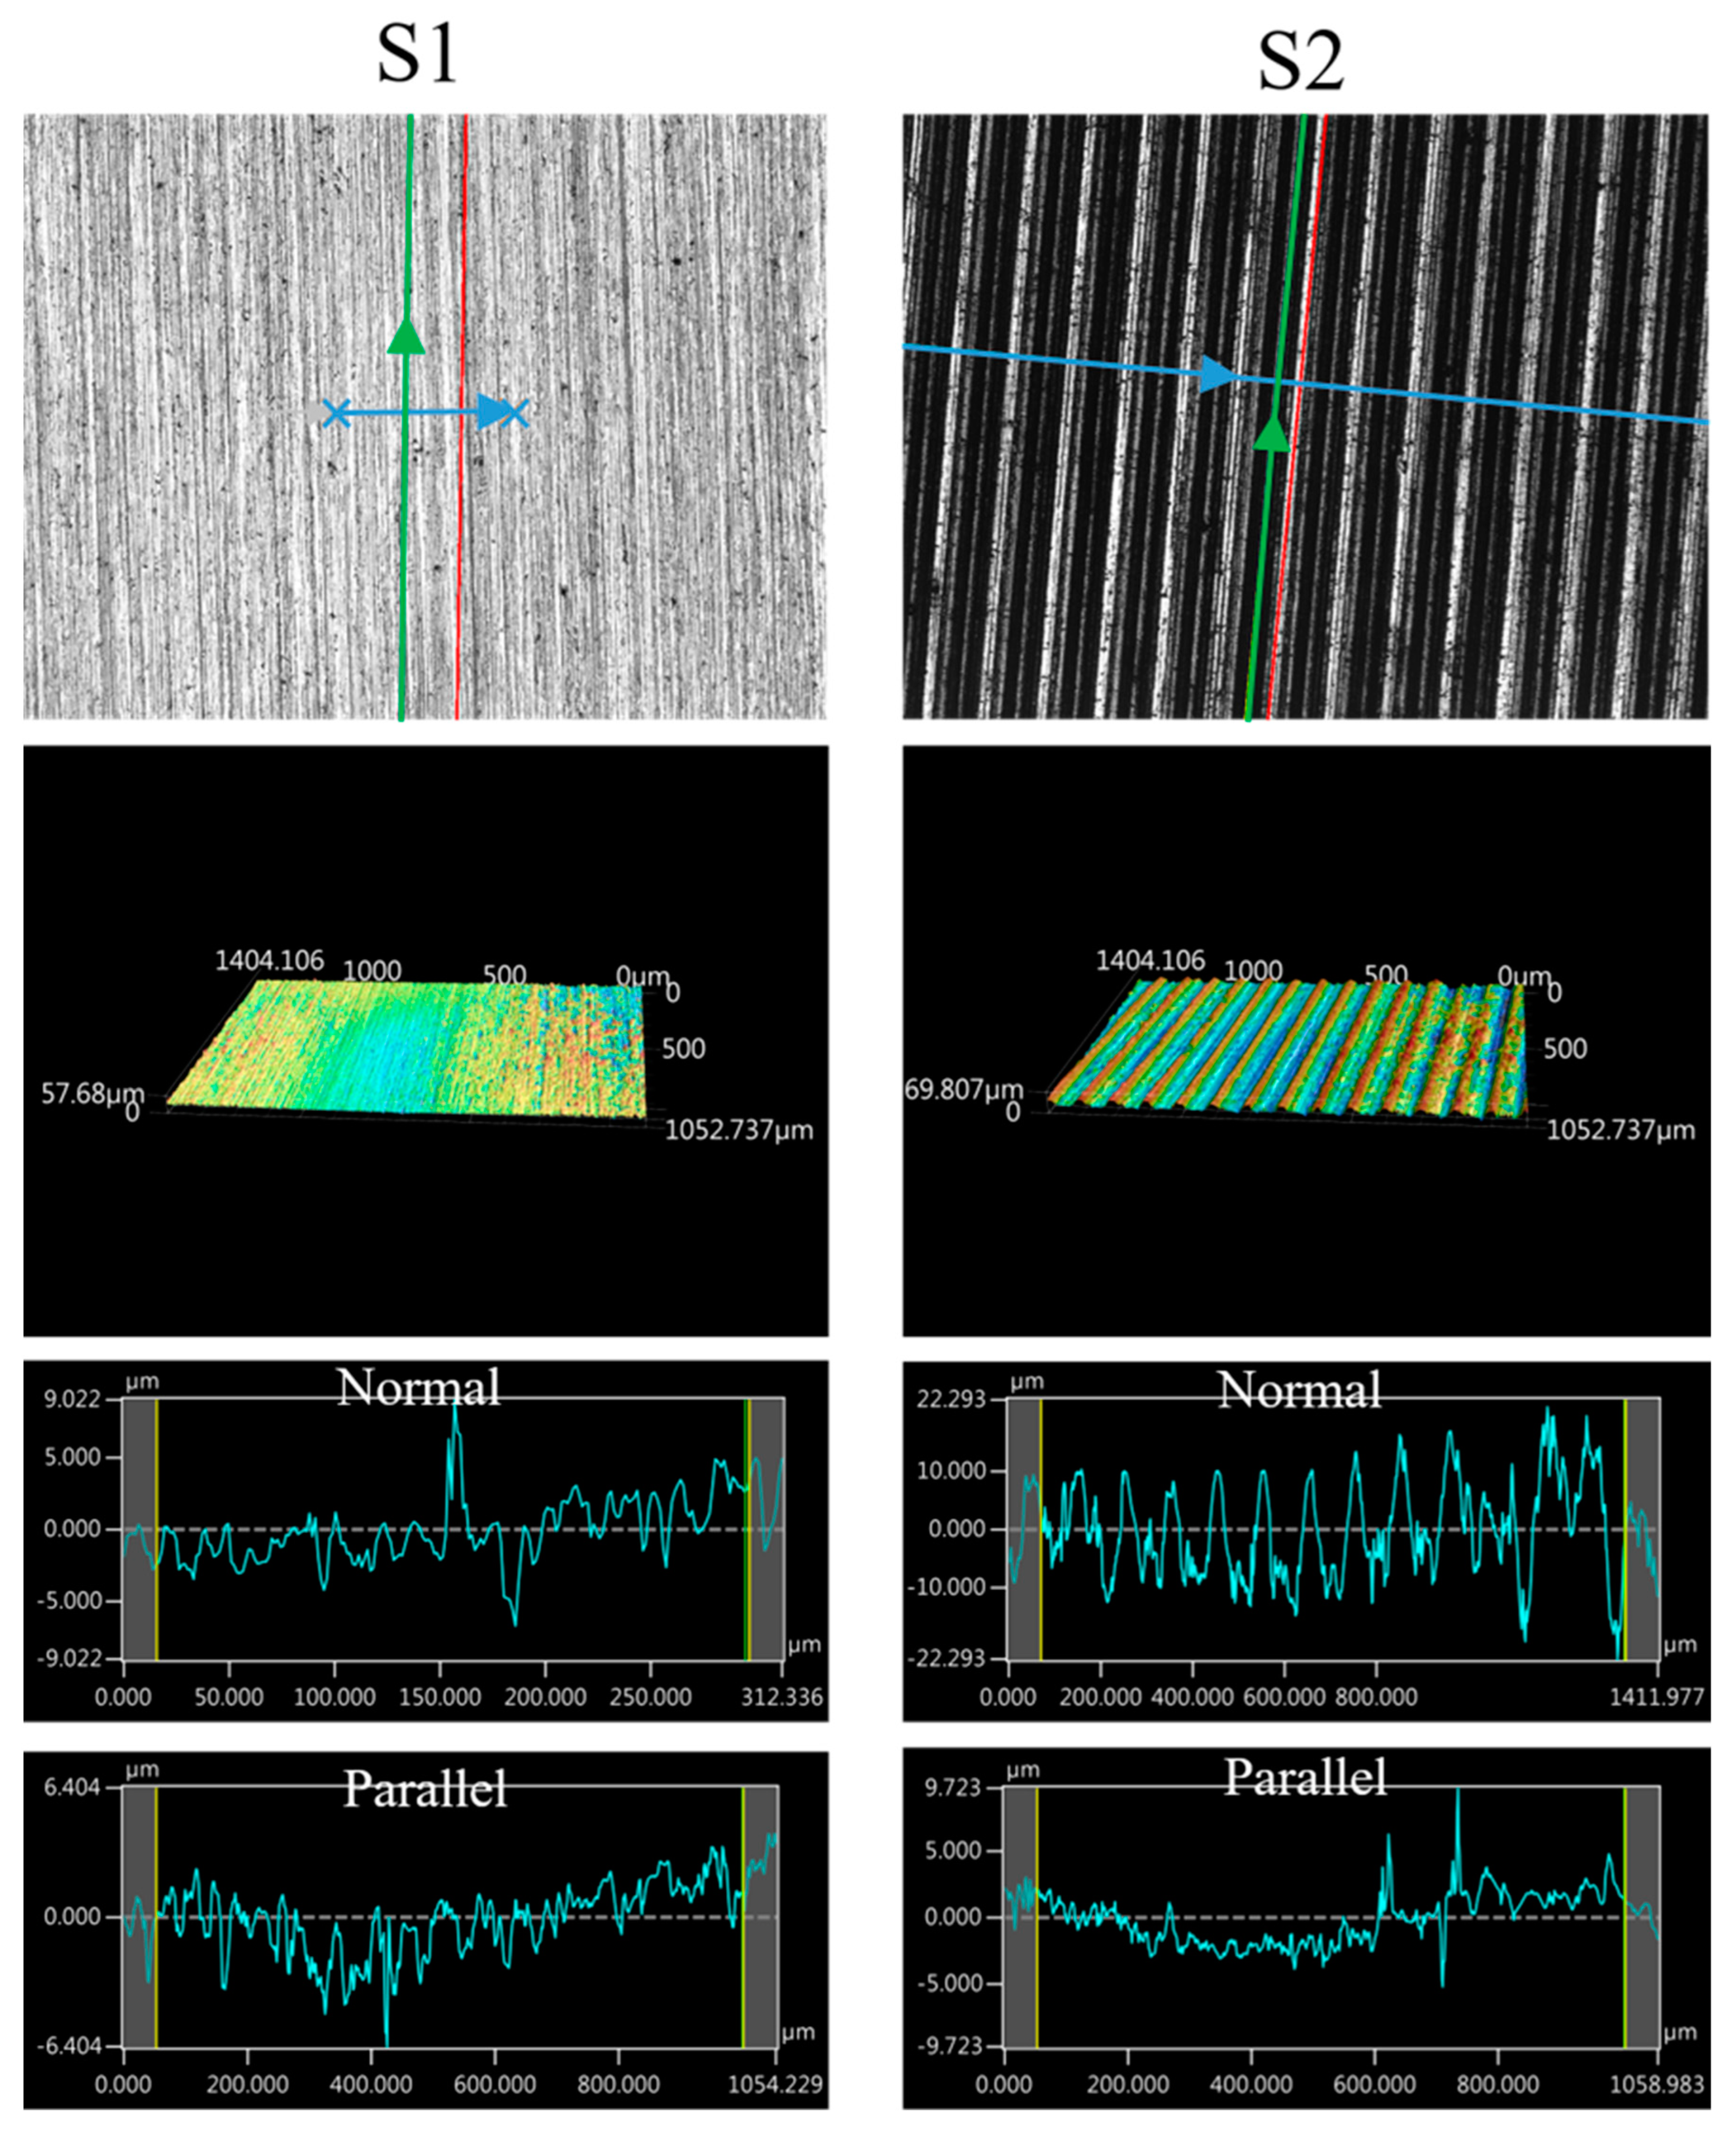
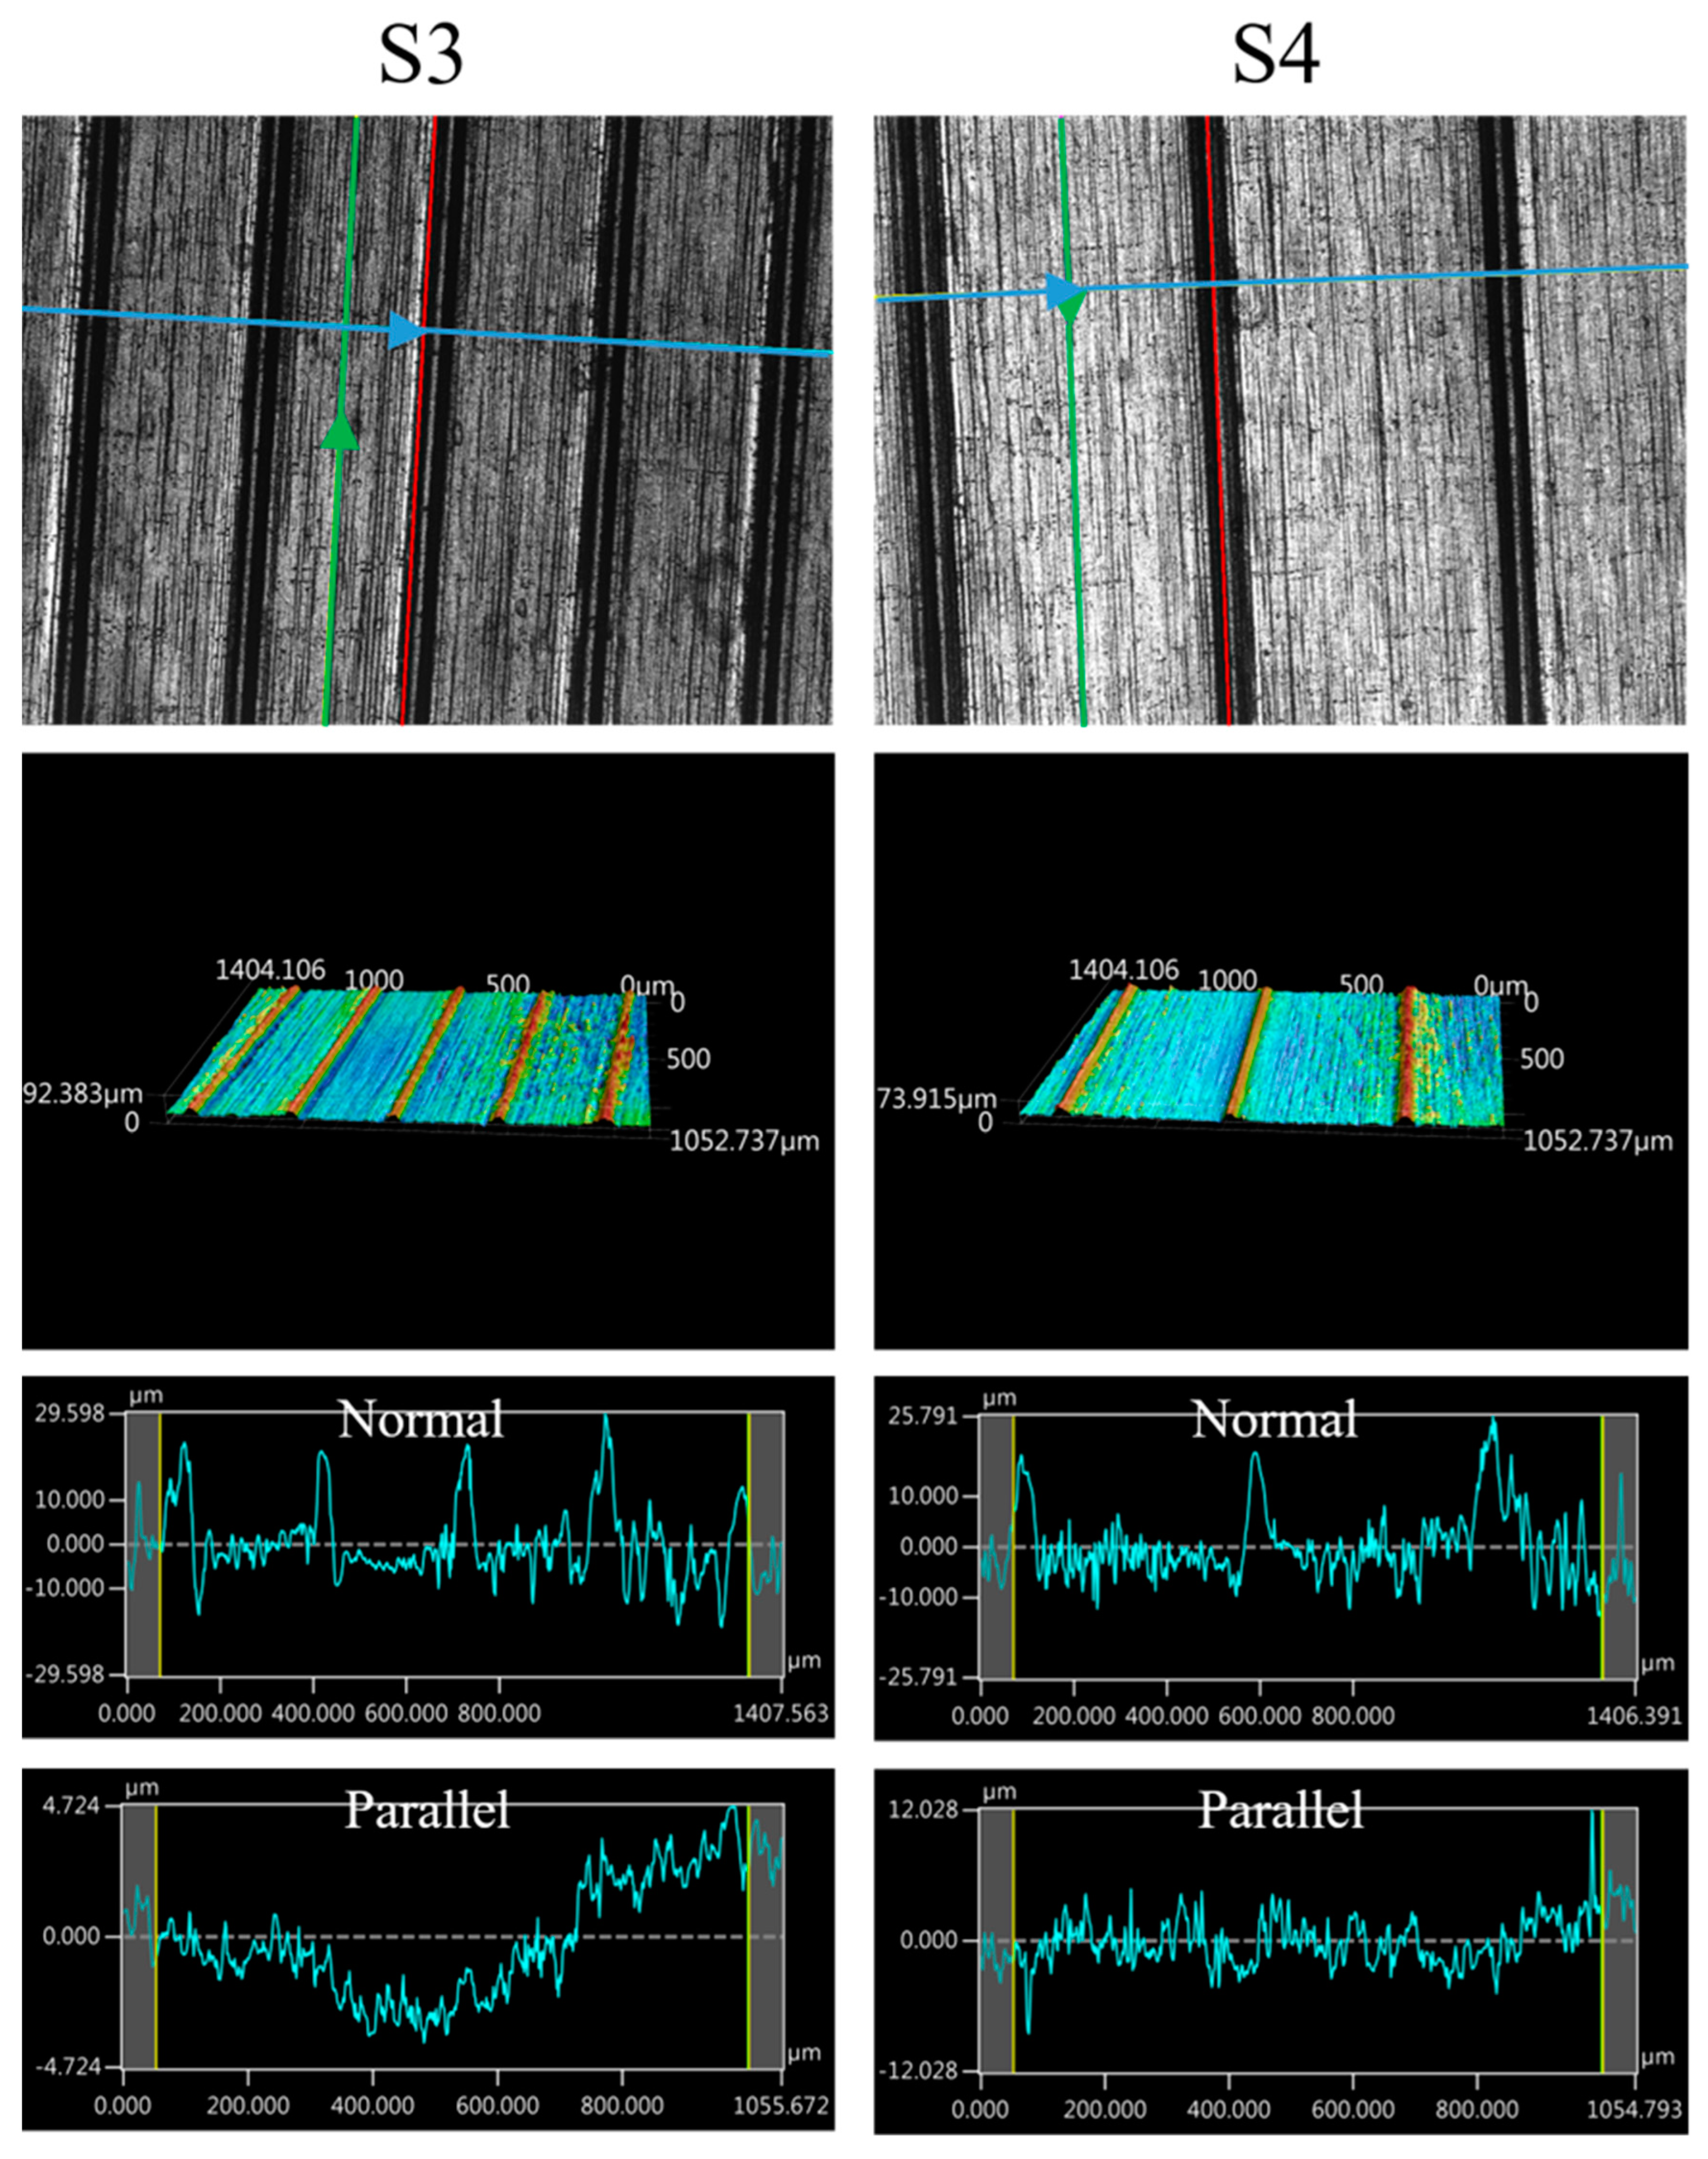
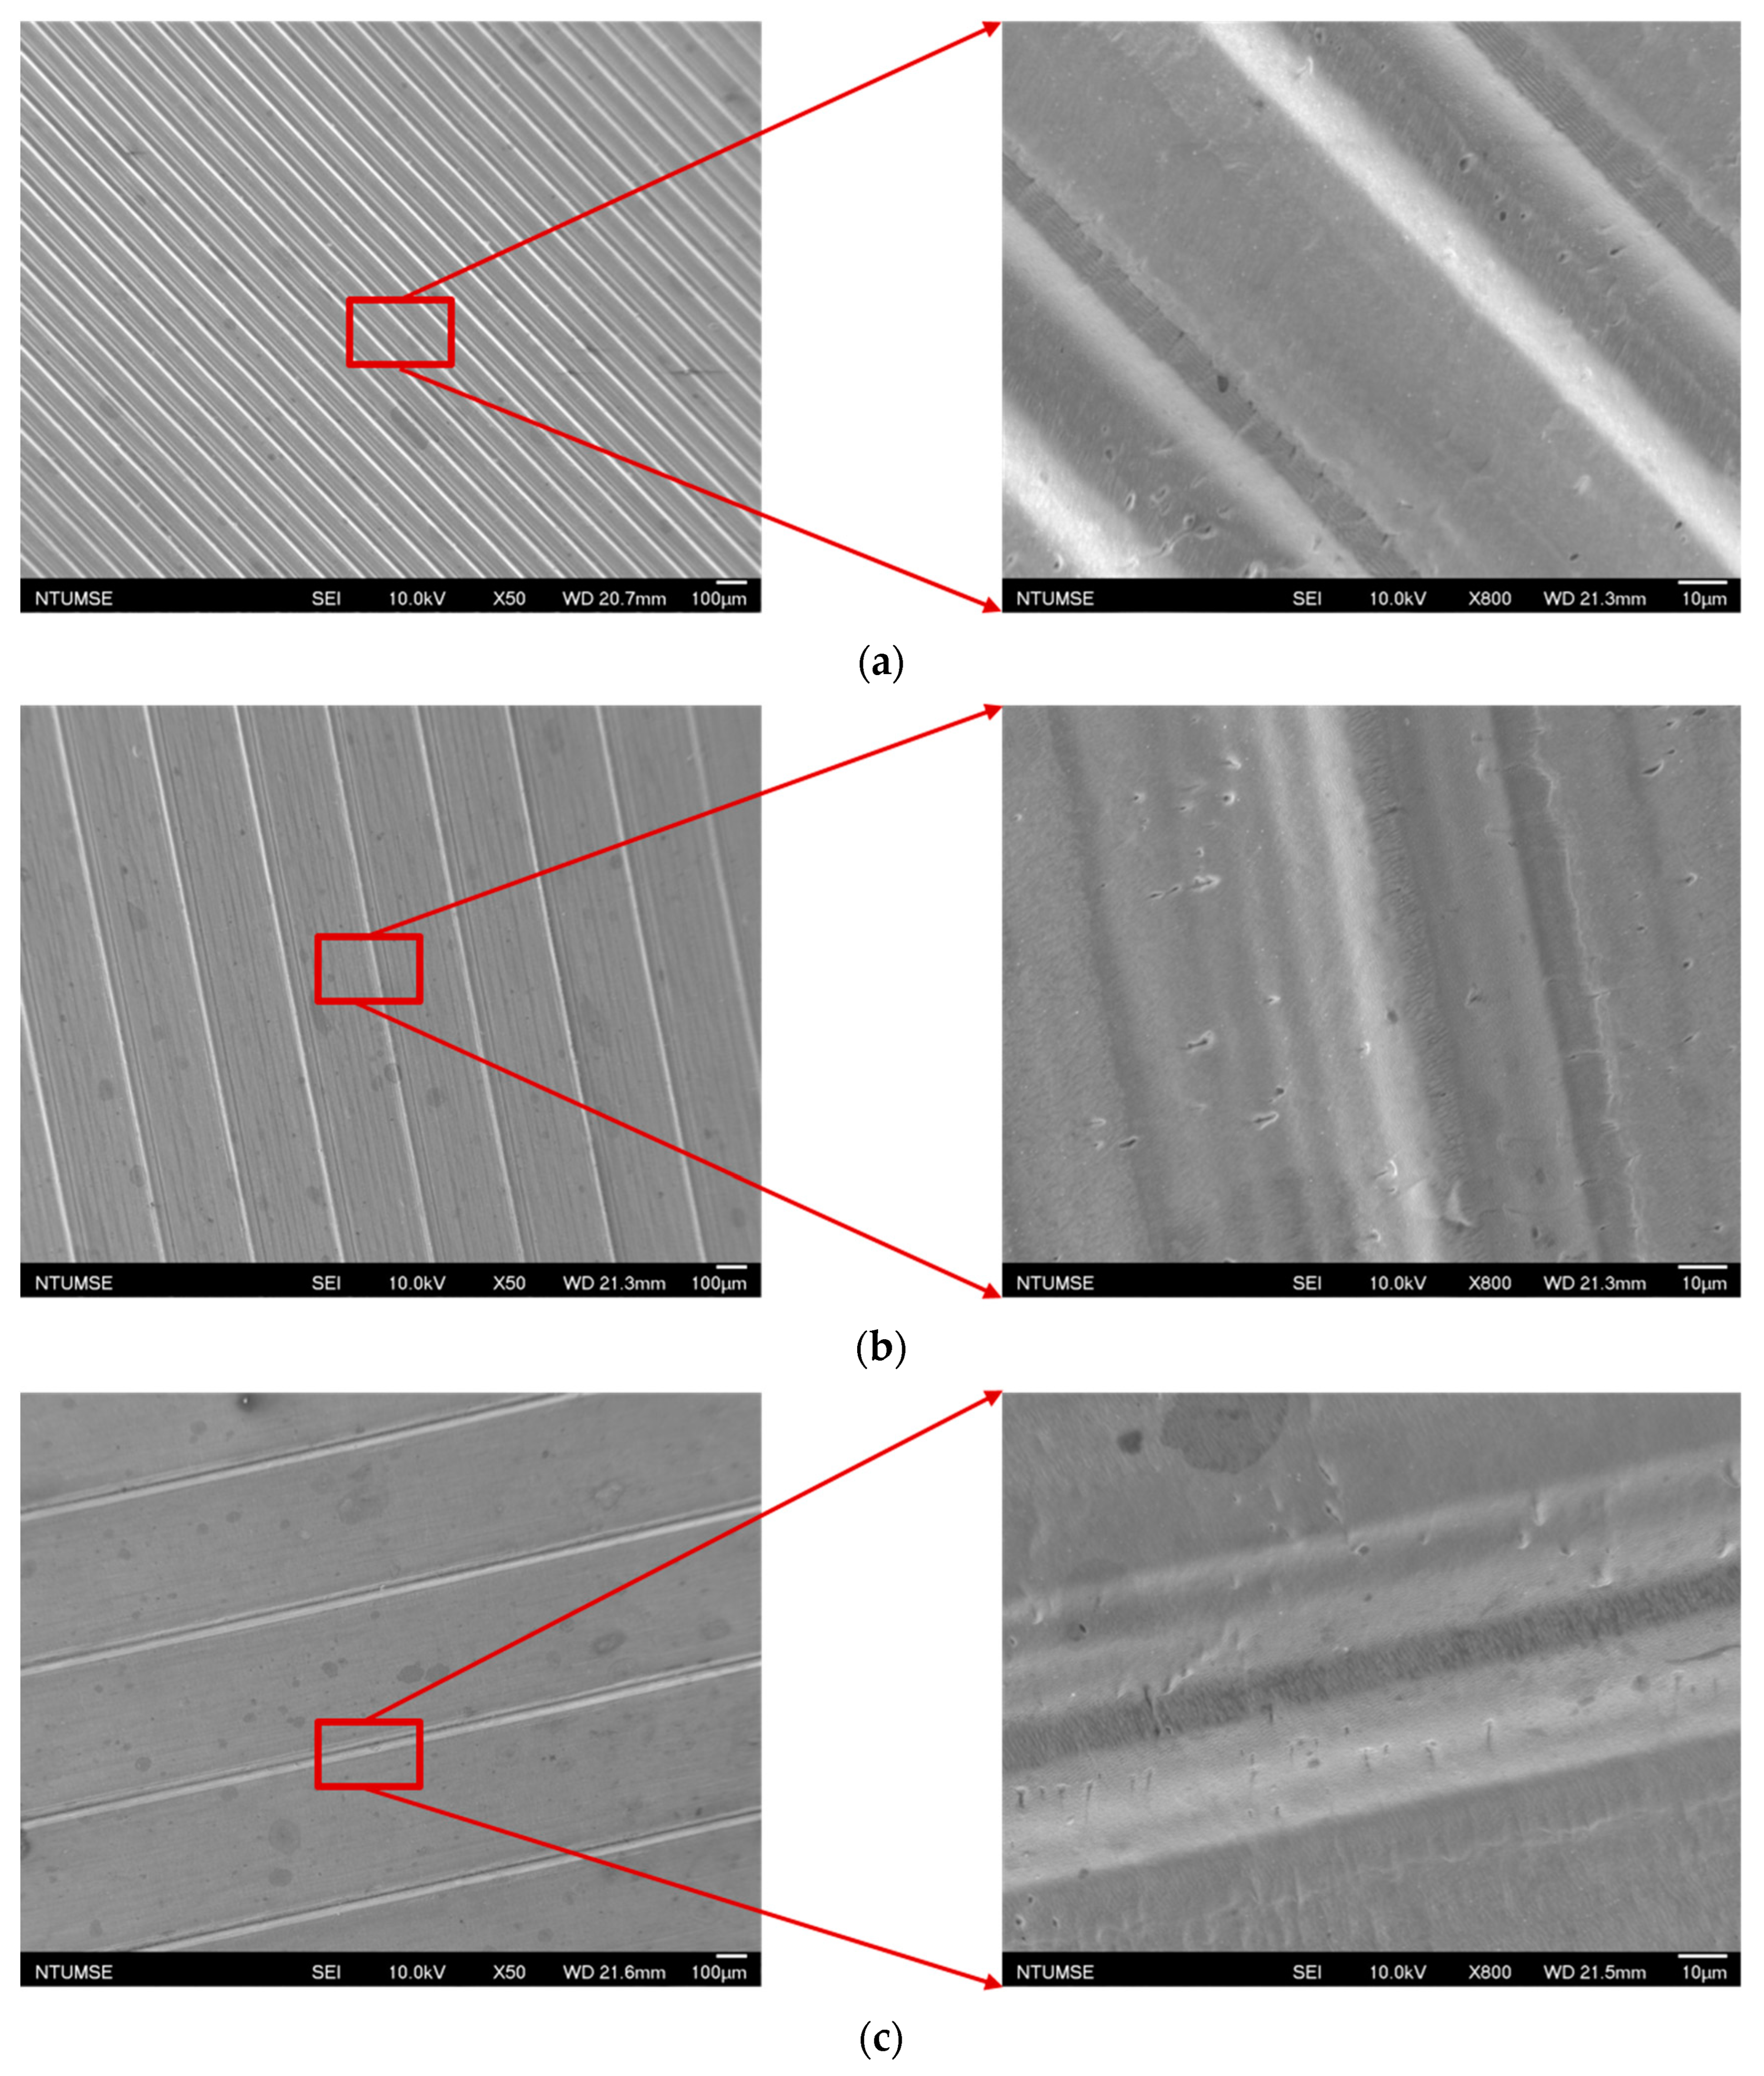
The images of the surface morphology for all the surface conditions were obtained using a laser-scanning confocal microscope (NTUME Precision Metrology Lab, Brand: Keyence, Osaka, Japan, Controller: VK-X1000, Measuring Head: VK-X1100). Confocal, three-dimensional, and surface profile images are shown in Figure 7 and Figure 8. Surface roughness is a critical factor that can significantly influence the boiling heat transfer performance. Many studies have focused on the roughness effect on boiling surfaces; however, very few studies have considered anisotropic surface roughness, which depends on the measurement direction in microgrooves. The measurement results obtained in the parallel and normal directions to the microgrooves are shown in Table 3. To provide greater detail for the morphology of the microgrooves, scanning electron microscopy (SEM) images of the microgrooved surfaces are presented in Figure 9.

Figure 7.
Confocal, three-dimensional (3D), and surface profile images for S1 and S2 conditions measured using the laser confocal microscope. (The blue arrow represents the measured direction is normal to the grooves, and the green arrow represents the measured direction is parallel to the grooves).
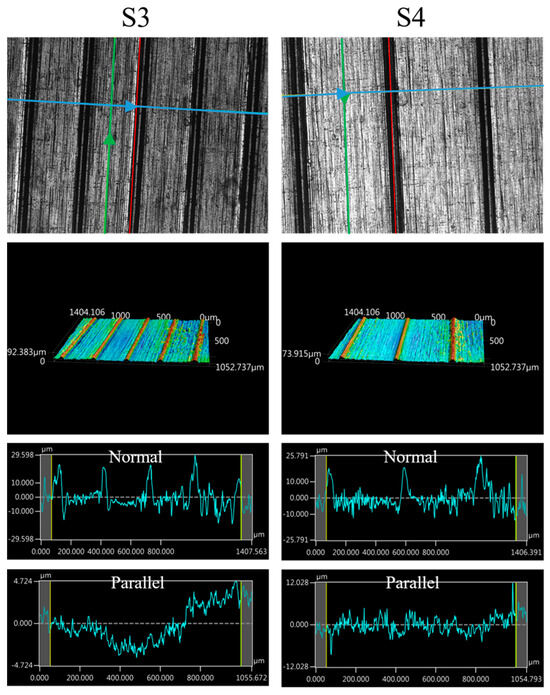
Figure 8.
Confocal, three-dimensional (3D), and surface profile images for S3 and S4 conditions measured using the laser confocal microscope. (The blue arrow represents the measured direction is normal to the grooves, and the green arrow represents the measured direction is parallel to the grooves.)
Table 3.
Surface roughness measured in parallel and normal directions on S1–S4 surfaces.
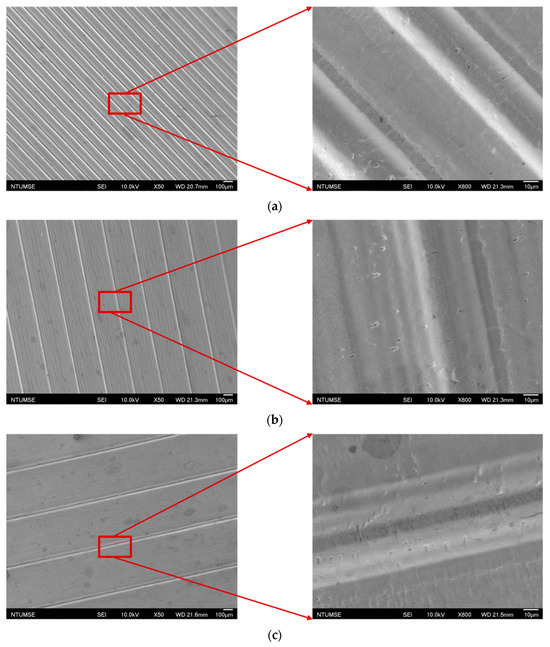
Figure 9.
Scanning electron microscopy images for (a) S2, (b) S3, and (c) S4 surfaces.
2.4.2. Surface Wettability
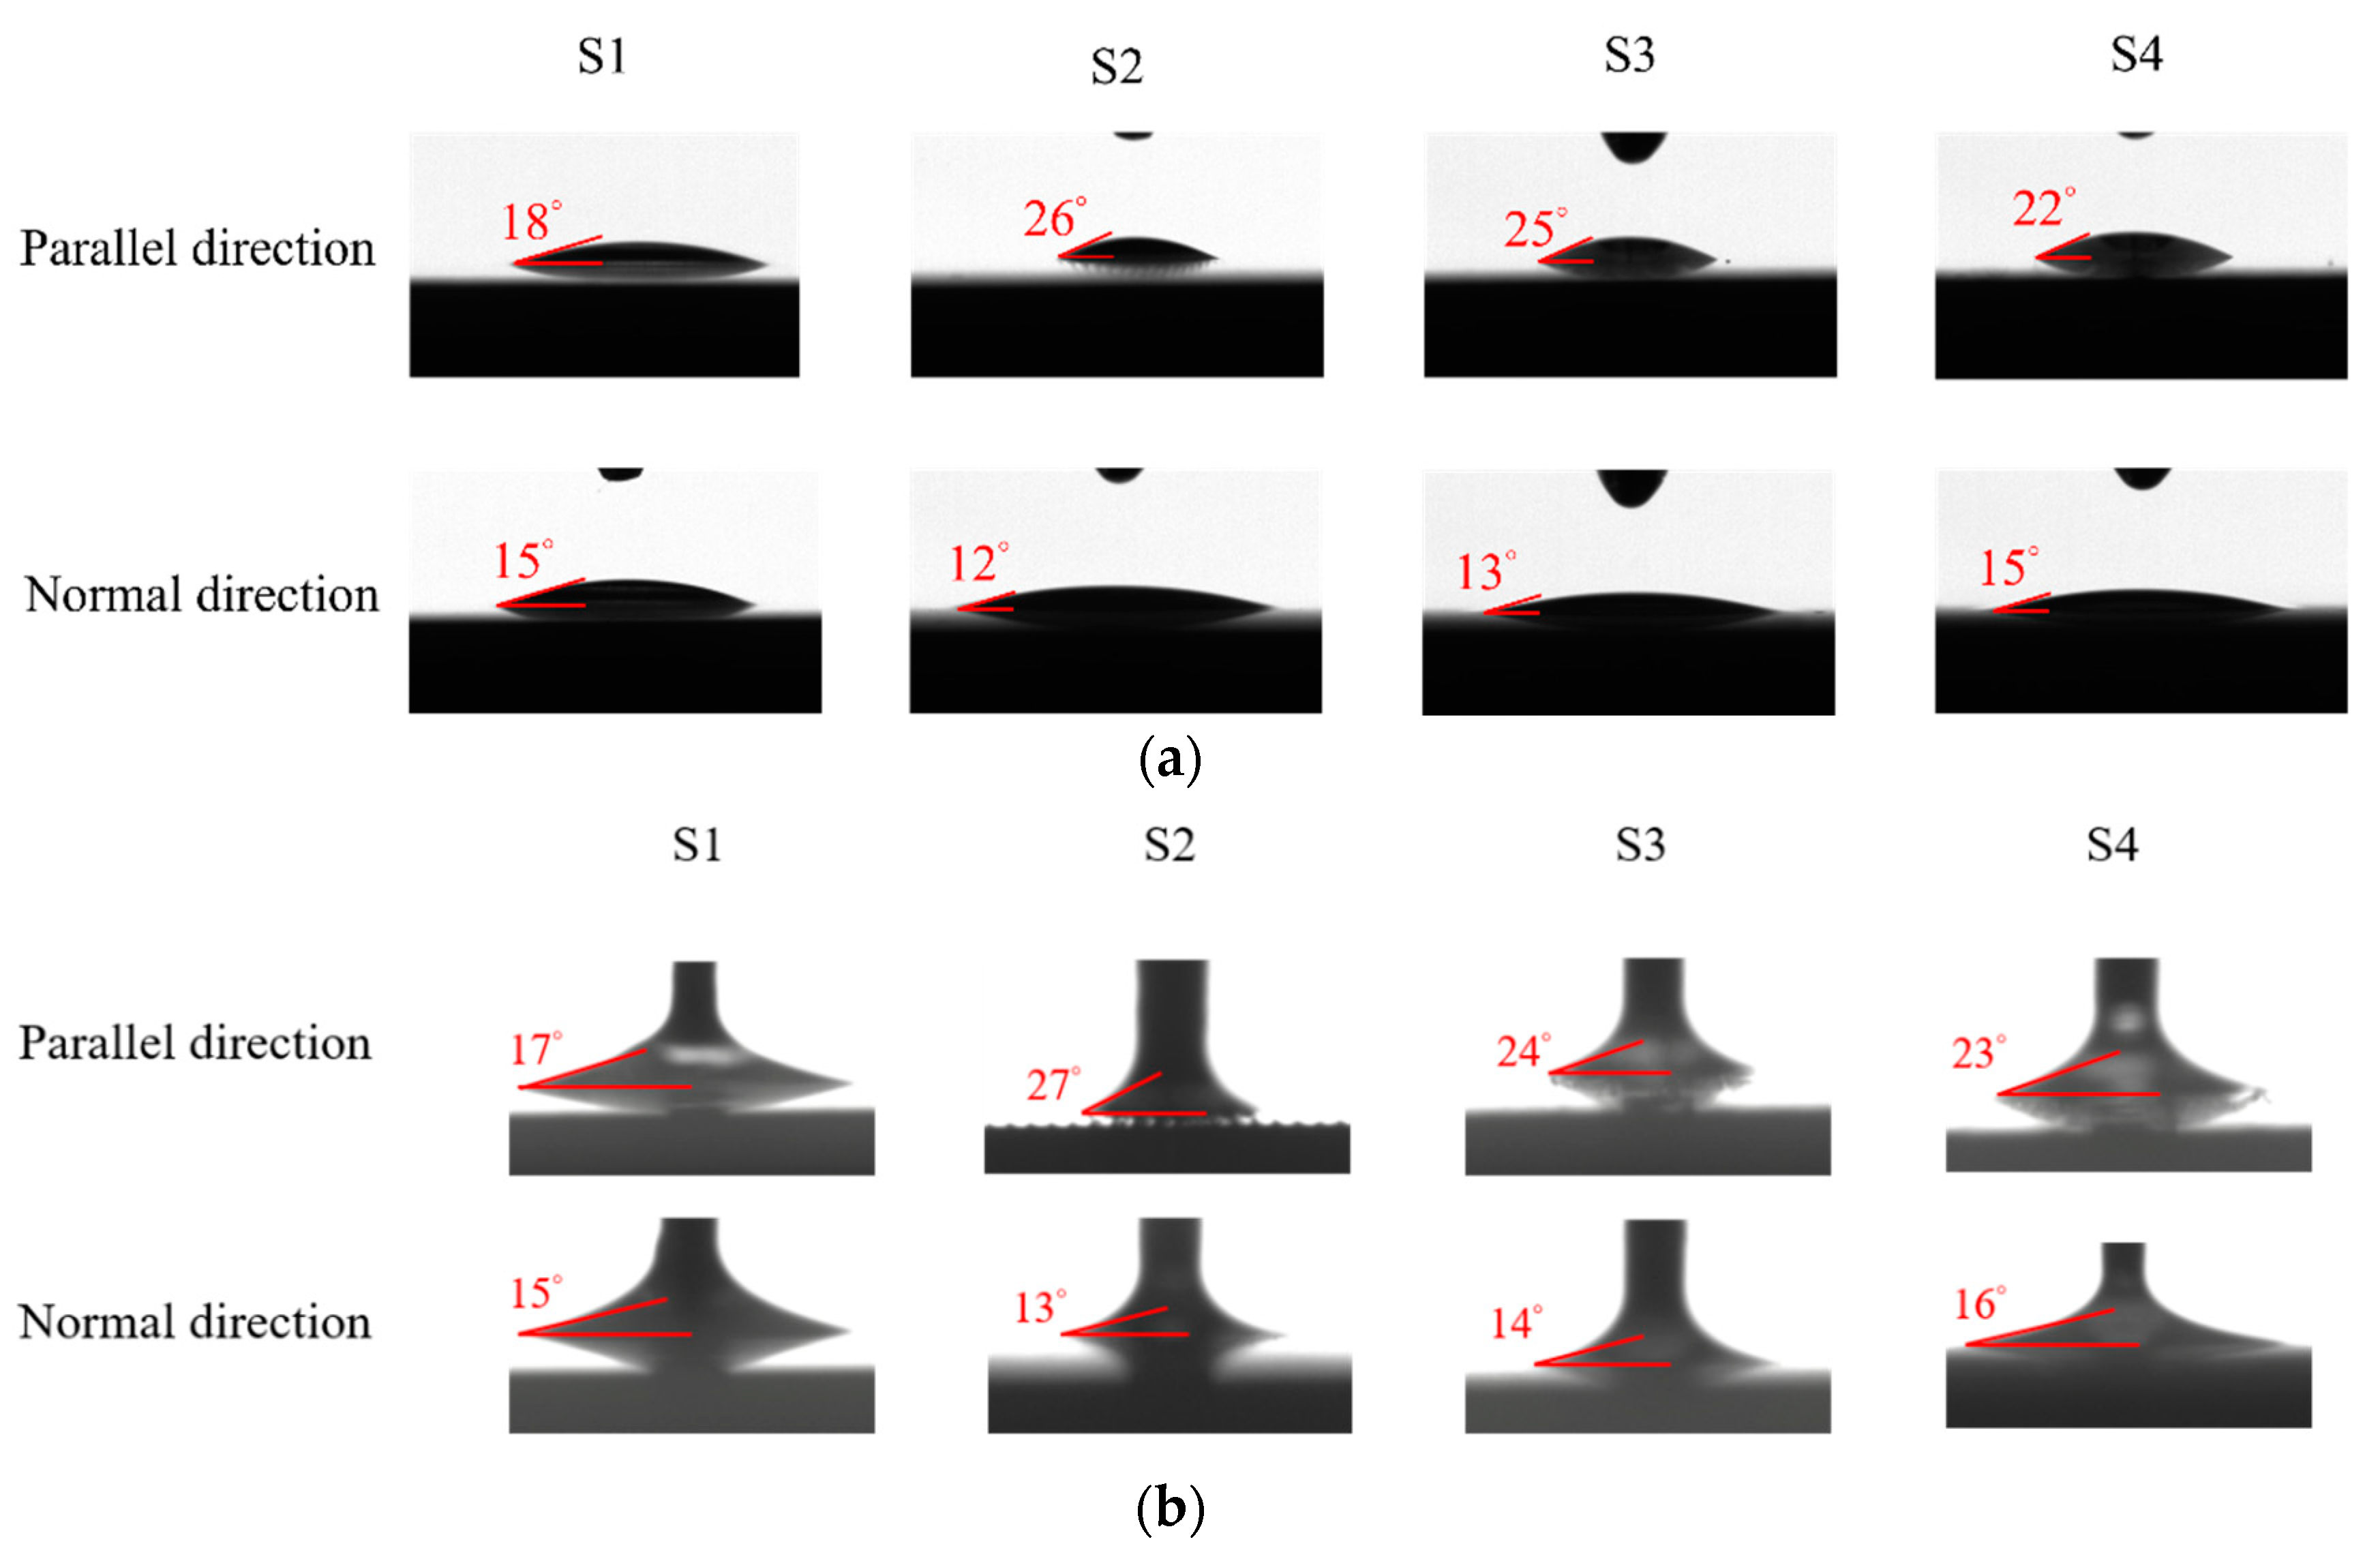
The surface wettability data and CA measurement images of all the test samples were recorded using a contact angle goniometer (NTU MEMS Thermal Control Lab, Brand: Model 100SB, Sindatek Instruments Co., Ltd., Taipei, Taiwan). A 3 μL water droplet was dropped onto each test sample for the CA measurement. The static CA and receding CA for Novec-7100 measured in directions parallel (θ1) and normal (θ2) to the microgrooves are displayed in Table 4. The deviation between the parallel CA and normal CA is known as the degree of anisotropy (Δθ12). This concept could be observed in Liu’s study [40]. The characteristic of the anisotropic wettability may also appear on a surface with a unidirectional structure [22,47]. The images of the static CA and dynamic CA measurements are shown in Figure 10.
Table 4.
Static and receding CA results measured in parallel and normal directions on S1–S4 surfaces.
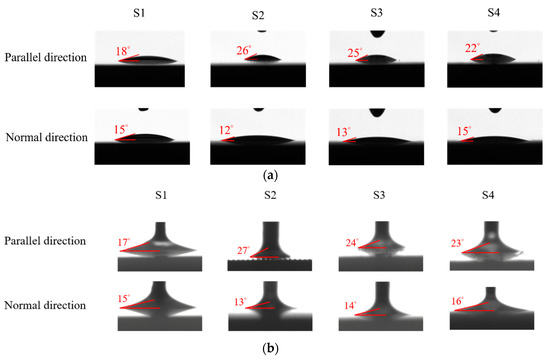
Figure 10.
Images of (a) static CA and (b) receding CA measured in parallel and normal directions on S1–S4 surfaces.
2.5. Data Reduction and Uncertainty Analysis
The heat loss analysis for the plain copper surface at different heat-flux intervals is shown in Table 5. As a baseline check for the experimental data, the heat loss percentages were less than 10% in the experiments.
Table 5.
Heat loss analysis during the boiling experiments.
Owing to the good insulation condition during the experiments, the heat transfer mode was considered as 1D heat conduction. The temperature gradient, , was calculated using the linear property of the heat conduction, defined in Equation (1) as follows:
where is the distance between the and thermocouples. The heat flux, , was derived using Fourier’s heat conduction law, expressed in Equation (2) as follows:
where is the thermal conductivity of copper (400 W/m·K). The surface temperature, , was estimated through back-calculation, given by Equation (3) as follows:
where is the thermal conductivity of the thermal grease (79 W/m·K), is the distance between the thermocouple and the upper surface, and is the thickness of the applied thermal grease. The wall superheat, , was estimated using Equation (4) as follows:
where represents the saturation temperature of the working fluid. The saturation temperature for Novec-7100 is 61 °C.
Finally, the boiling heat transfer coefficient, h, was evaluated using Equation (5) as follows:
The estimation of uncertainties within specific heat-flux intervals was conducted using Taylor’s method [48]. The uncertainty analysis of the S1 surface is presented in Table 6. The subsequent equations are the general formulae of the uncertainty calculation. Equation (6) is the general formula for determining uncertainties for various parameters, including the heat flux, wall superheat, and HTC. Up denotes the uncertainty in the derived parameter p, whereas Uaexp represents the uncertainties associated with all the measured parameters indicated as aexp.
Table 6.
Uncertainty analysis for a plain copper surface (S1), using Novec-7100 as the working fluid at different heat-flux intervals.
The calculation of the uncertainty for the heat flux was performed using Equation (7) as follows:
Equation (8) was applied to determine the uncertainty of the wall superheat as follows:
To estimate the uncertainty of the HTC, Equation (9) was employed as follows:
2.6. Experimental Procedure
Before the experiments, 2 L of Novec-7100 was poured into the boiling chamber, and the auxiliary heater was activated by turning on the autotransformer. The auxiliary heater was used to increase the working fluid’s temperature to its saturation temperature (61 °C). Subsequently, a DC power supply connected to a cartridge heater was switched on, and the temperature readings of the thermocouples in the copper block were recorded using a data logger. To regulate the input power to the test sample, the current was adjusted using the DC power supply. The current was gradually increased at an increment of 0.05 A for measuring each experimental datum. When the temperature fluctuations of the thermocouples in the copper block were less than 0.1 °C within a 5 min interval, the steady-state condition was confirmed. Finally, CHFs were achieved under all the test conditions. Once the CHF was reached, film boiling occurred on the flat copper surface, causing the surface temperature to rapidly rise by over 20 °C within 1 min. After this, the DC power supply was turned off immediately to avoid burning out the apparatus. To verify the repeatability, experiments for each test condition were conducted three times in the study.
3. Results and Discussion
3.1. Validation of Experimental Setup
To validate the experimental setup, the pool boiling curve for a plain copper surface, obtained using Novec-7100 as the working fluid, was compared with the Rohsenow correlation curve [49] and similar pool boiling curves in the related literature [50,51]. The widely used correlation proposed by Rohsenow is expressed in Equation (10) as follows:
where is the dynamic viscosity of the liquid, is the latent heat, is the gravitational acceleration, is the density of the liquid, is the density of the vapor, σ is the surface tension, is the specific heat of the liquid, is the wall superheat, is the Prandtl number, is the surface-fluid factor, and is the experimental constant.
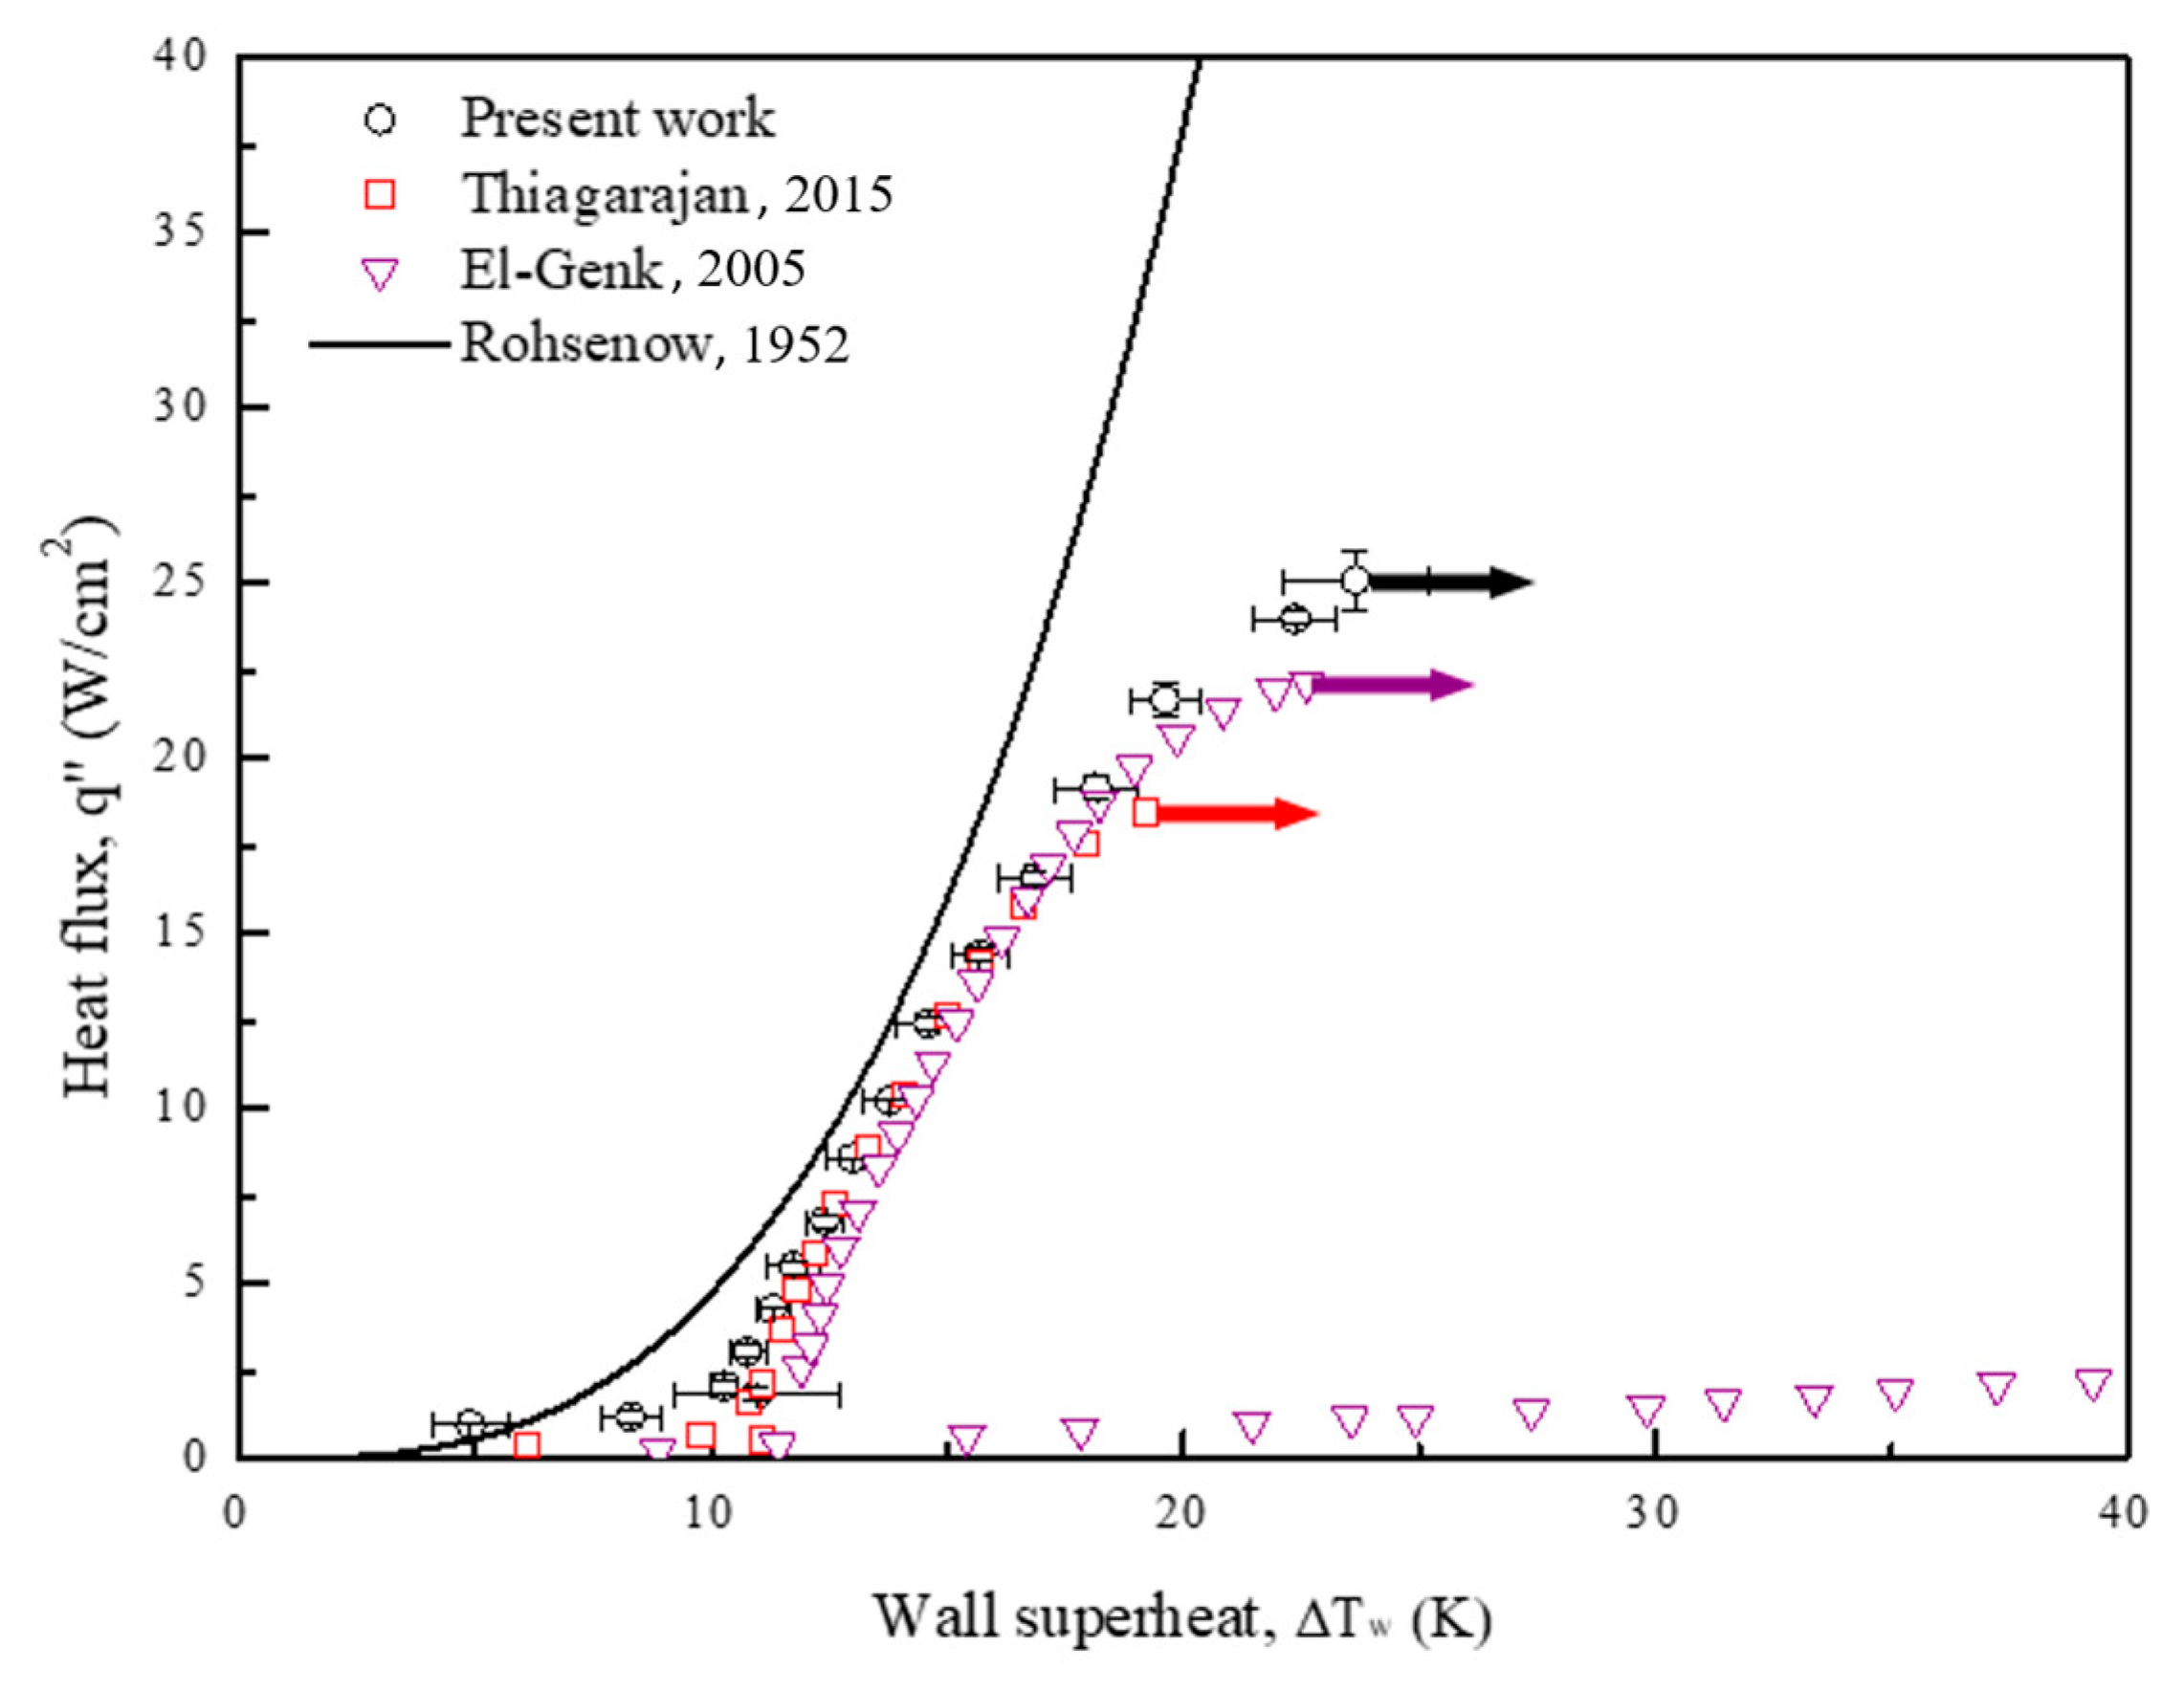
In the current study, equals 1.7 for fluids other than water. The surface-fluid combination, , equals 0.0036 based on the experimental data for Novec-7100 [52,53]. As depicted in Figure 11, the boiling results obtained for the plain surface in the present work are almost consistent with the Rohsenow correlation and those obtained for the plain surface in the related studies. However, owing to the prediction limit of the Rohsenow correlation, the experimental data diverge in the high heat-flux regime. A vapor film gradually forms from the intensified bubble aggregation in this regime and deteriorates the heat transfer rate. Therefore, the boiling curve diverges to the right in the end. Similar phenomena can be found in the above literature [50,51].

Figure 11.
Pool boiling curves of a plain copper surface, obtained using Novec-7100 as the working fluid, compared with Rohsenow correlation curve [49] and similar pool boiling curves in related literature [50,51]. The references are from Rohsenow [49], Thiagarajan et al. [50] and El-Genk et al. [51].
3.2. Evaluation of Boiling Heat Transfer Data
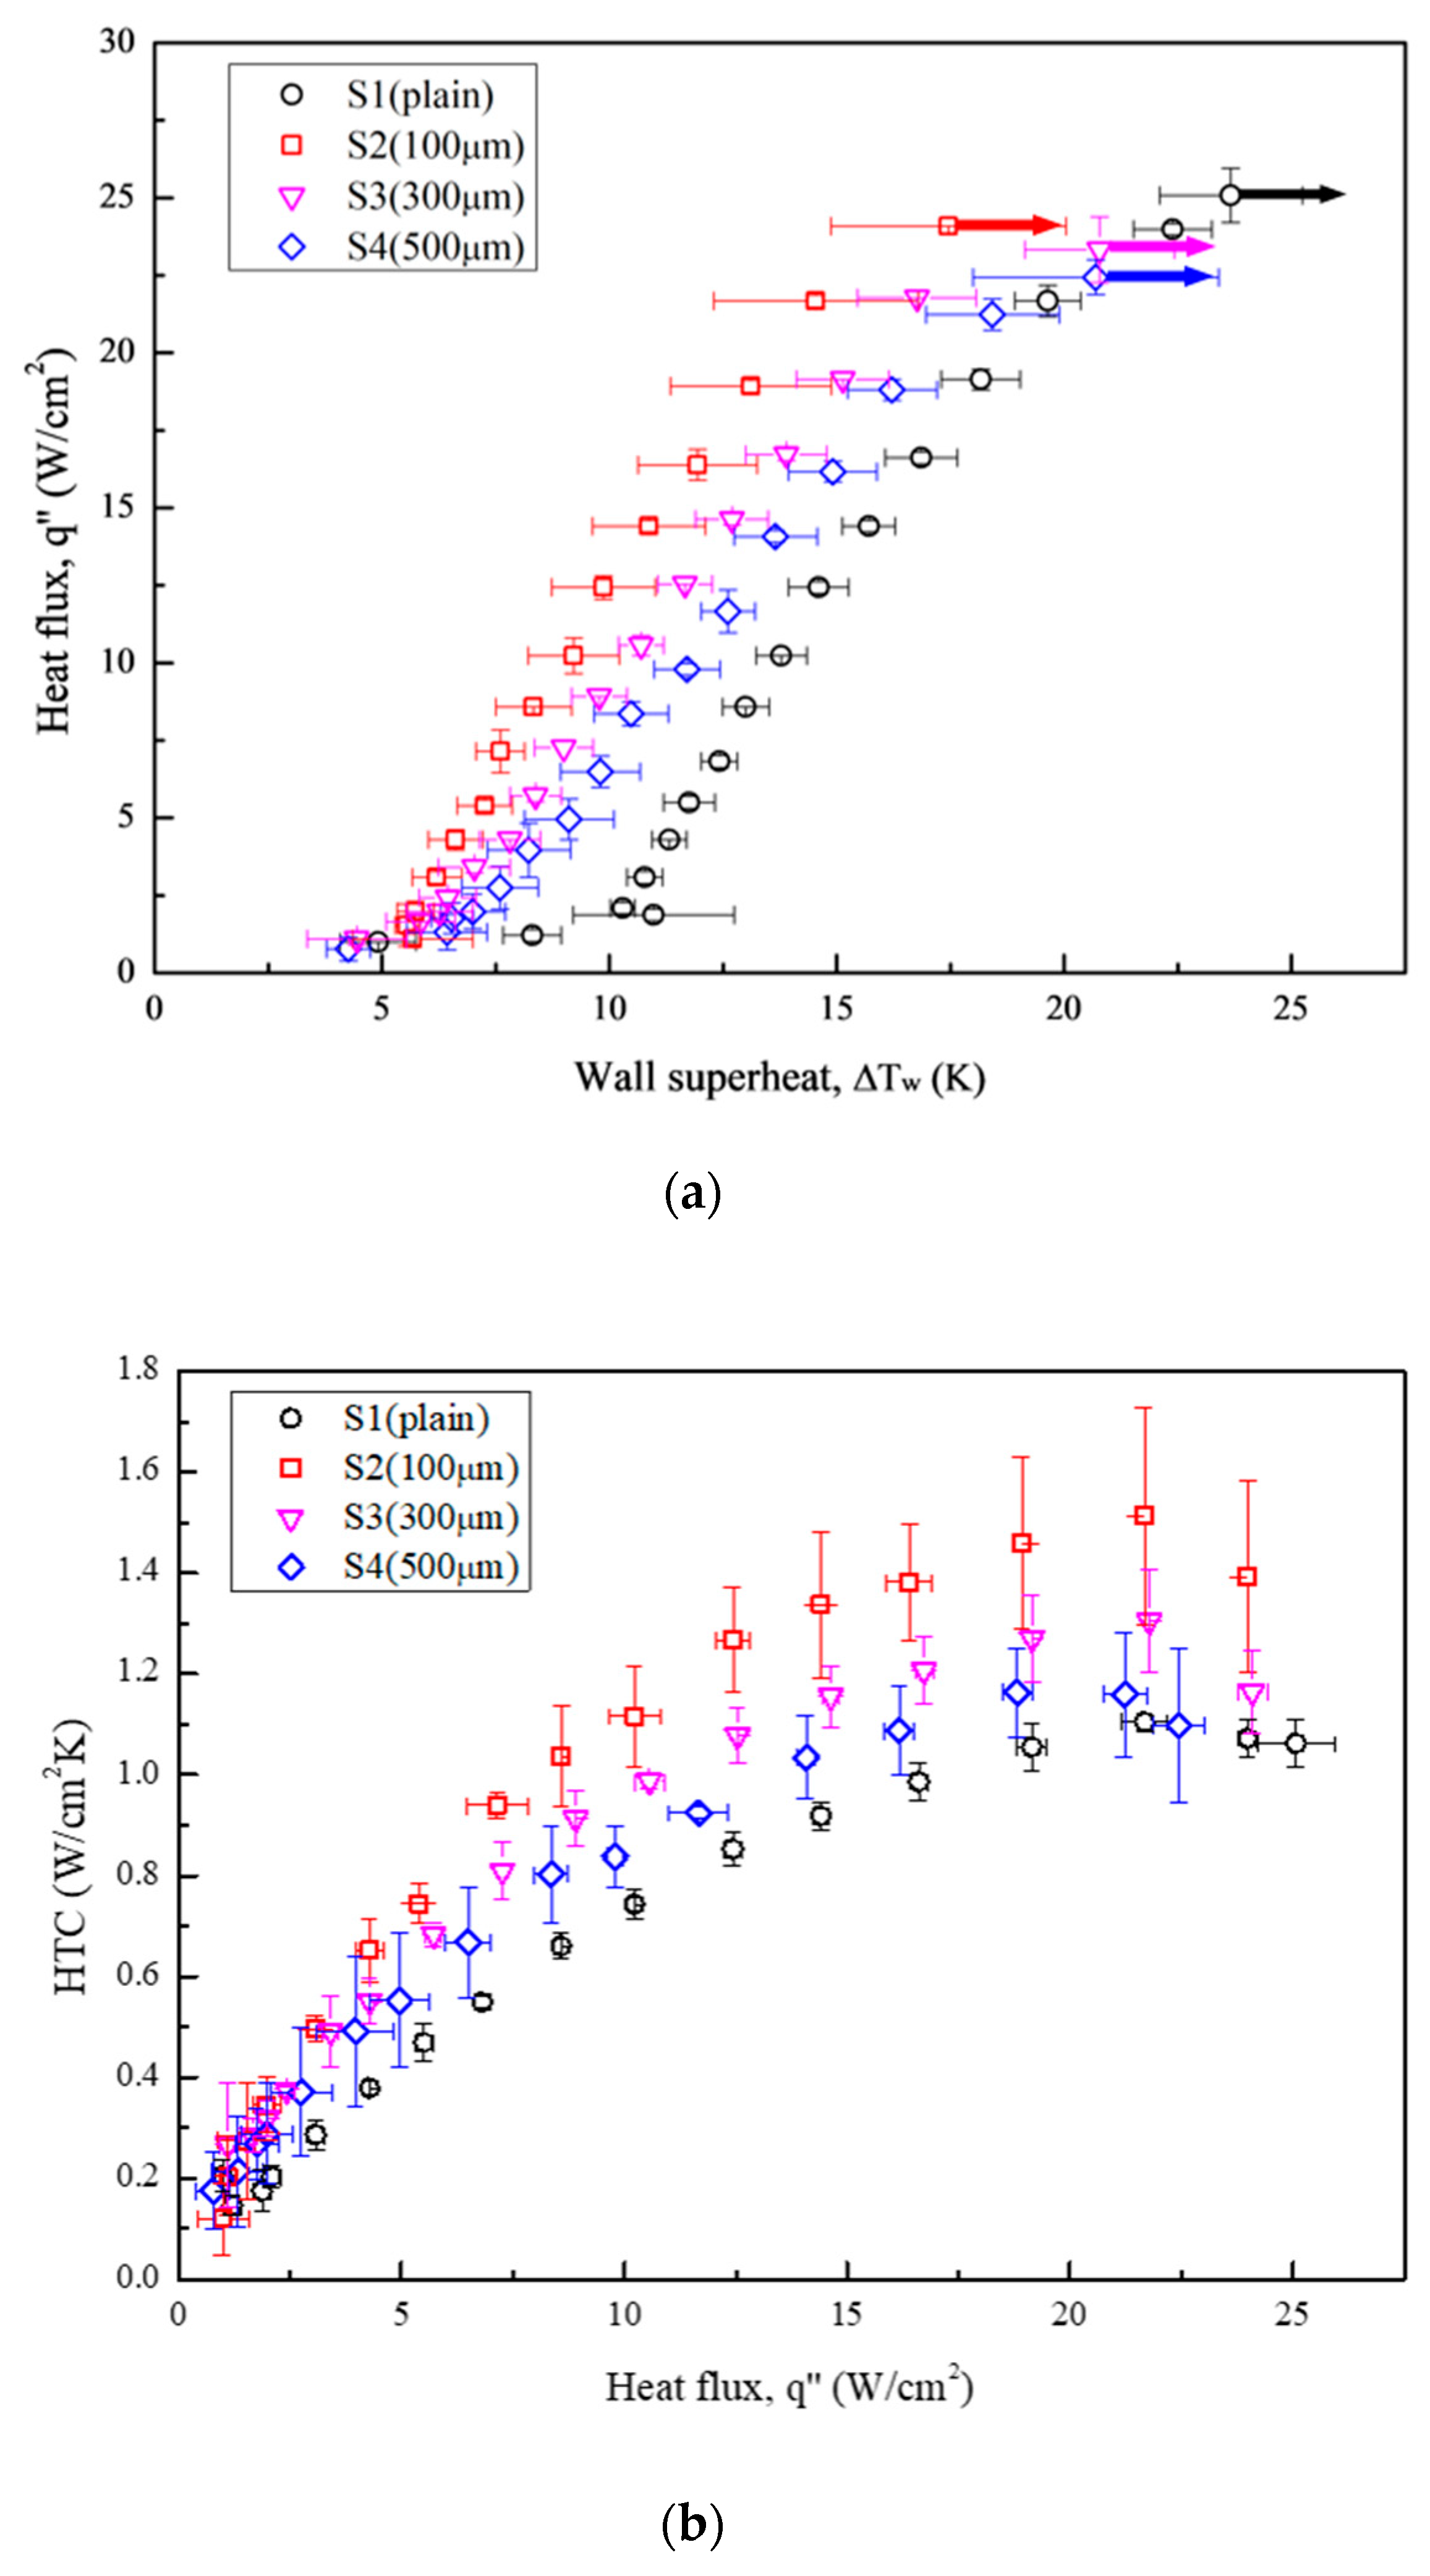
Figure 12 illustrates the boiling curves (Figure 12a) and HTC curves (Figure 12b) obtained for all the test conditions. Table 7 presents the increment in HTCs relative to the plain surface (S1) at the highest heat flux of S4 (22.44 W/cm2). S2 exhibited the furthest leftward-shifted boiling curve, with an HTC enhancement by a factor of 1.37 compared with that of S1. Although the HTCs of S3 and S4 were lower than that of S2, theirs still increased by factors of 1.18 and 1.05, respectively, relative to the reference condition (S1). For CHF values, the boiling tests conducted using microgrooved surfaces as test surfaces exhibited slightly lower CHF values than that of the plain surface. A minor decrease in CHF was attributed to earlier bubble aggregation on microgrooved surfaces. This led to a large vapor slug, which hindered the heat transfer between the surface and the liquid. As a result, the highest HTC improvement among all the test surfaces was an increase by a factor of 37% owing to the enhanced bubble nucleation facilitated by the characteristics of the anisotropic wettability and roughness. More details of the bubble dynamics supported by the high-speed visual study will be introduced in the following section.
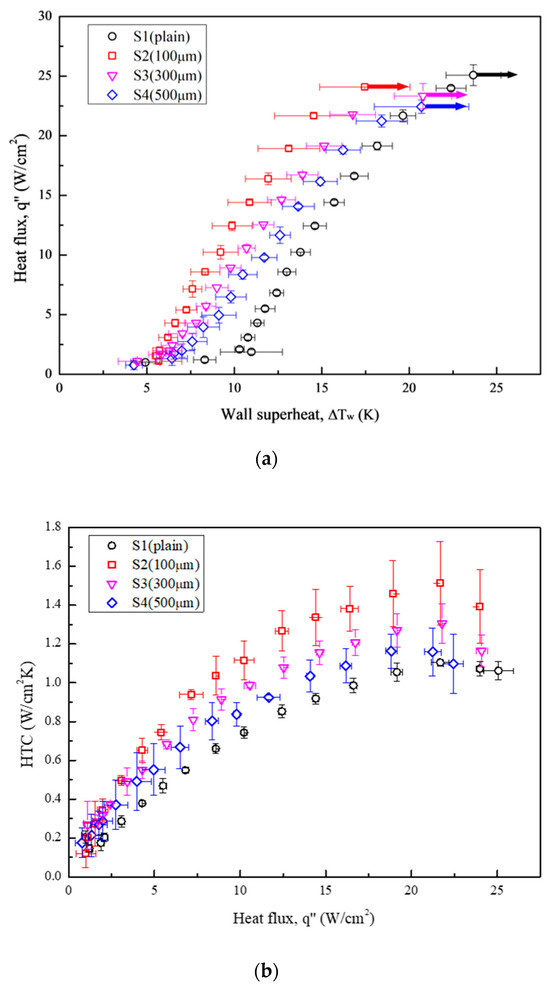
Figure 12.
(a) Pool boiling curves obtained under test conditions using Novec-7100 as the working fluid; (b) HTCs obtained under test conditions using Novec-7100 as the working fluid.
Table 7.
Boiling results obtained under S1–S4 conditions.
3.3. Effects of Groove-Induced Anisotropic Wettability and Roughness
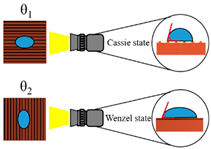
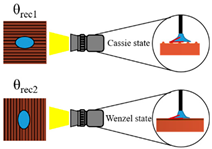
The texturing of the microgrooves on the surface can induce anisotropic properties. Kwon et al. [54] explored the influence of microgrooved surfaces on water droplet repellency. Their CA measurements revealed observable anisotropy between the directions normal and parallel to the groove. Gui et al. [55] similarly investigated the microgroove effect on the surface wettability and suggested the utility of Wenzel’s model [56] for predicting the CA along the grooves and Cassie’s model [57] for predicting the CA in the normal direction.
In the present study, a similar phenomenon was observed on the microgrooved surfaces, where Wenzel’s and Cassie’s wetting states dominated in the directions parallel and normal to the groove, respectively. Therefore, the existence of the wettability anisotropy, as shown in Table 4, can be explained by this difference in the wetting states. Wenzel’s and Cassie’s models are respectively shown by Equations (11) and (12) as follows:
where is the contact angle on the rough surface in Wenzel’s model; is the roughness factor, which is defined as the ratio of the real surface area to the apparent surface area; and represents Young’s contact angle for smooth surfaces as follows:
where is the Cassie–Baxter contact angle for the rough surface, is the area fraction of the solid wetted by the liquid, and is the area fraction of the liquid in contact with the vapor.
With the groove spacing increasing from 100 µm to 500 µm, an enhancement in CA in the normal direction was observed, as shown in Table 4. This groove-spacing effect slightly influenced the CHF values in the boiling heat transfer. Furthermore, the existence of microgrooves on the surface significantly enhances the surface roughness in the normal direction, as displayed in Table 3. With the groove spacing decreasing from 500 µm to 100 µm, a smaller groove spacing and more microgrooves can induce more available nucleation sites in the normal direction inside the grooves. This enhancement in the nucleation ability was attributed to the increased surface area provided by more microgrooves on the surface. As a result, groove-induced wettability and roughness variations may influence the boiling heat transfer performance. The effects of the anisotropic properties on the boiling heat transfer are discussed in the following section.
3.4. Effects of Anisotropic Wettability and Roughness on Boiling Heat Transfer
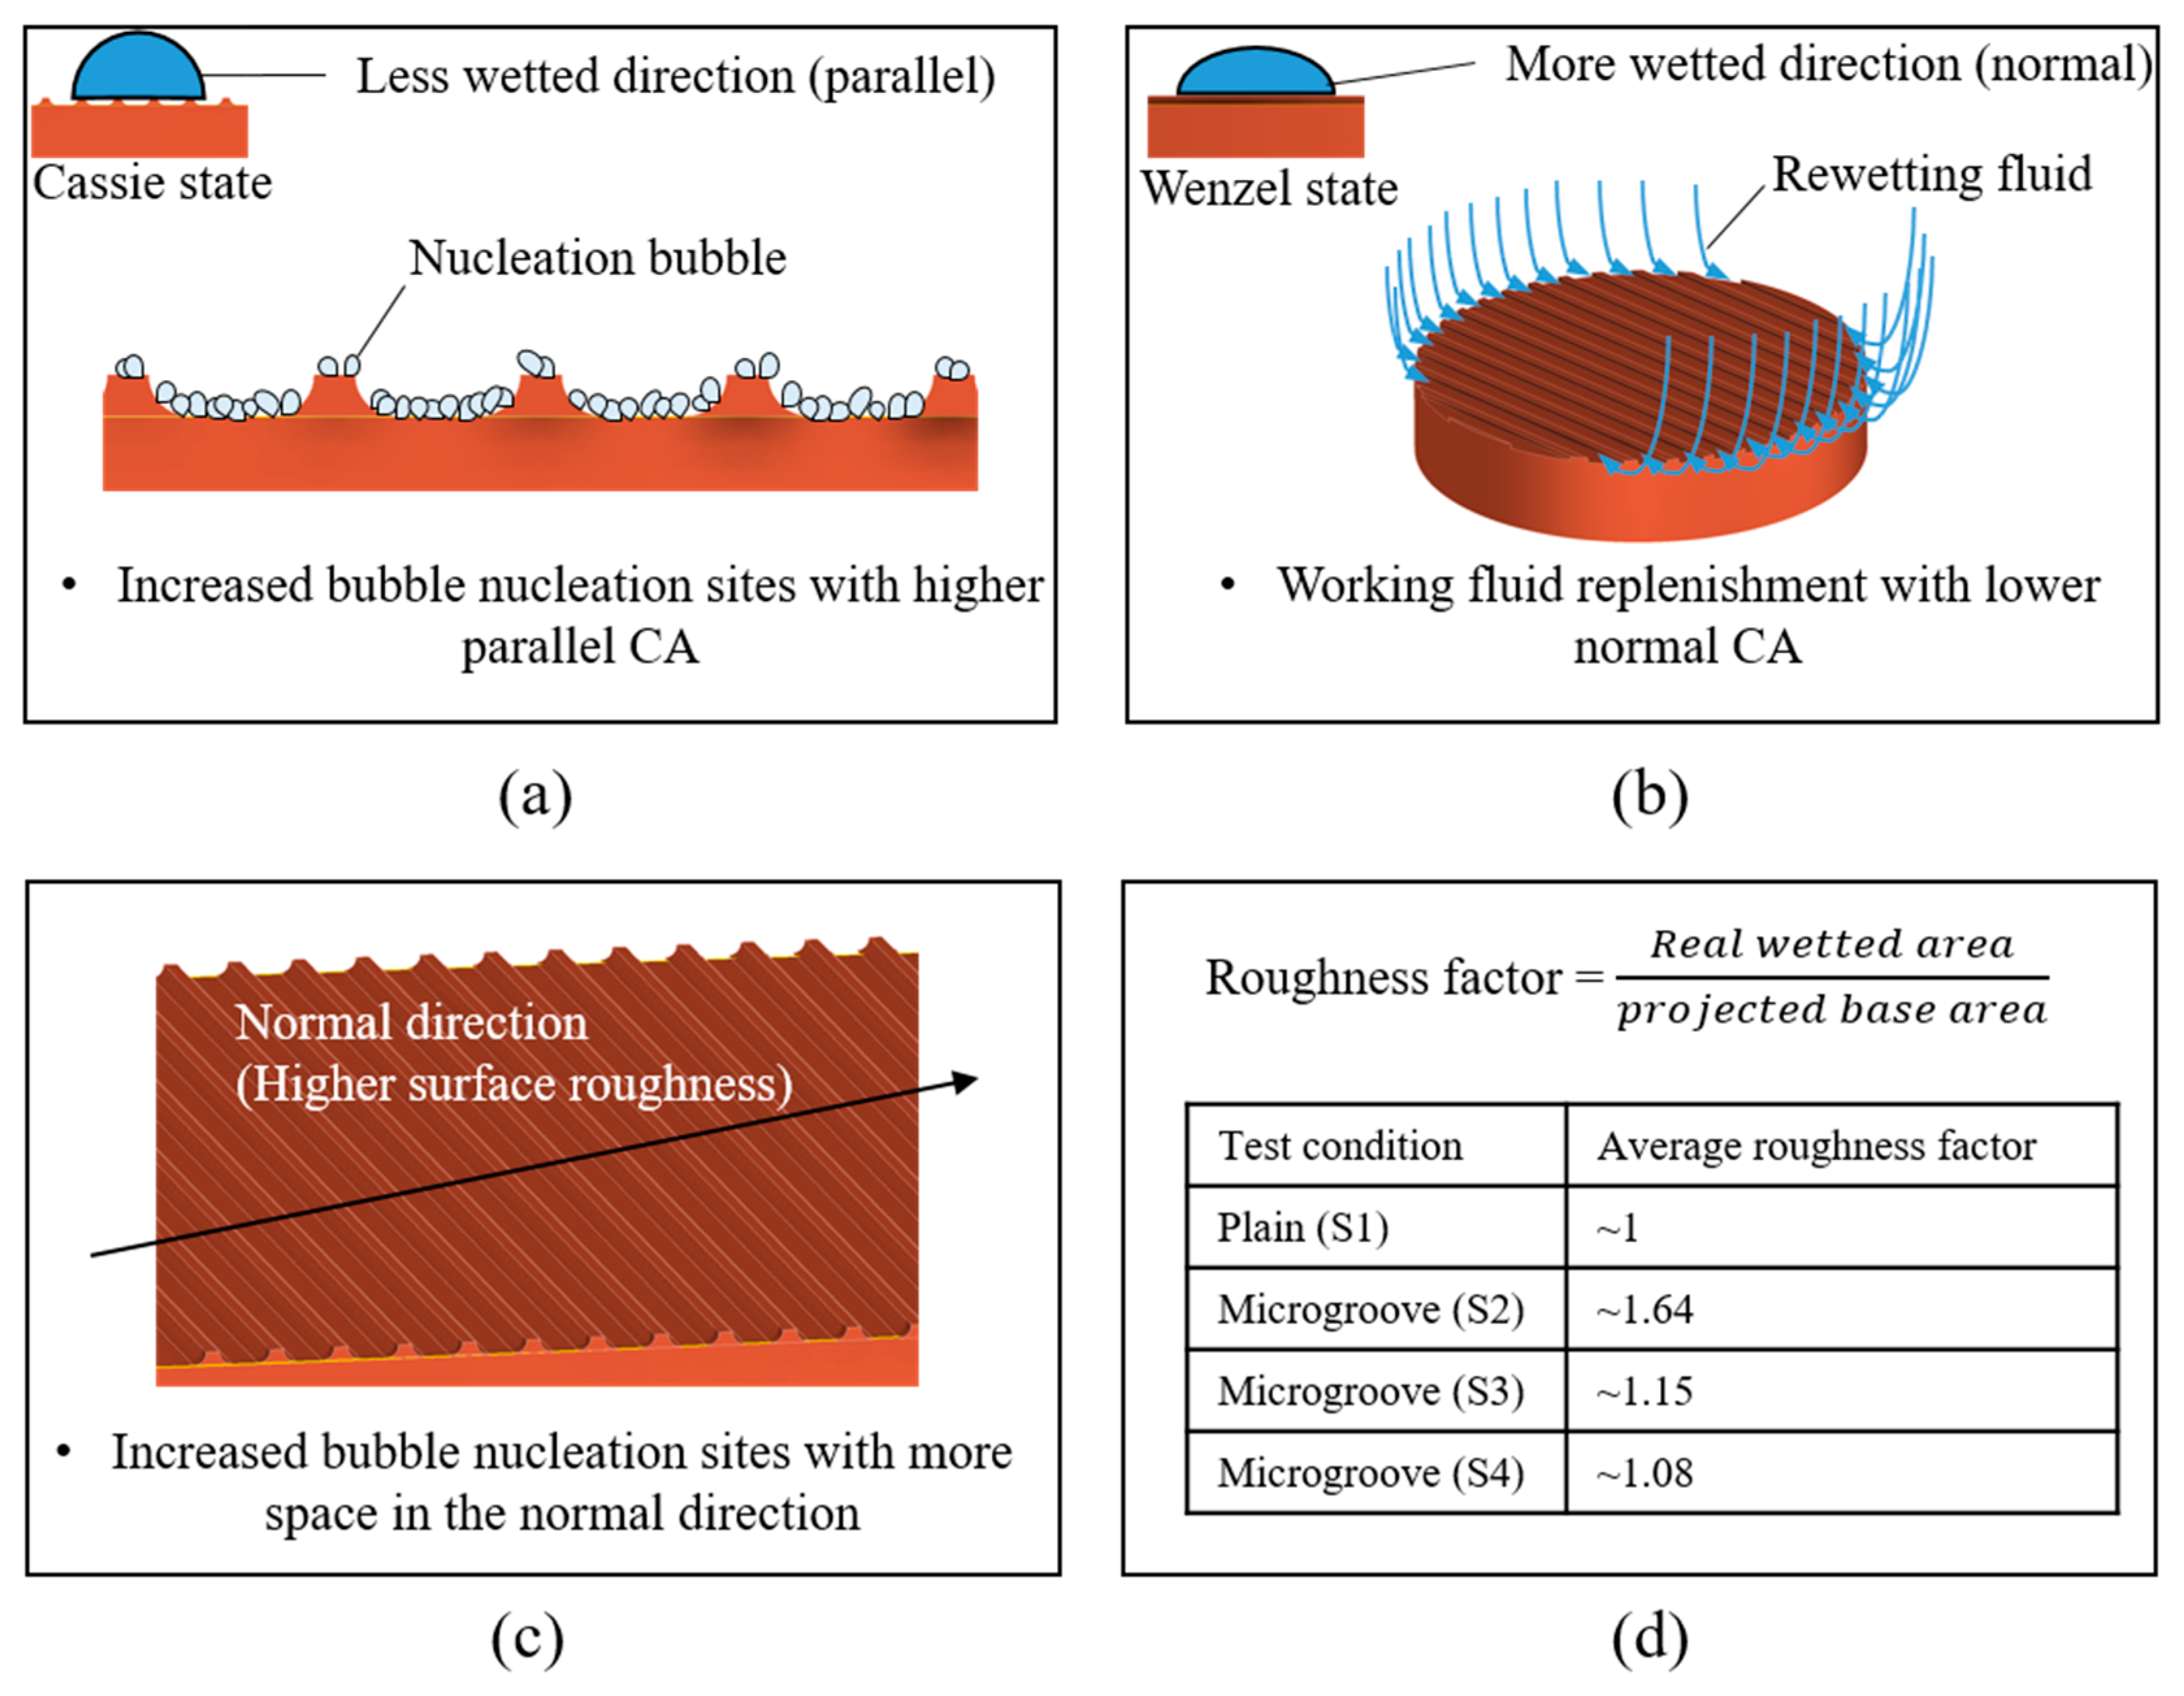
Figure 13a,b illustrate the mechanisms of bubble nucleation and liquid rewetting on microgrooved surfaces. As depicted in the figure, more bubble nucleation sites were activated when the wettability in the parallel direction was lower. In addition, higher wettability in the normal direction provided good rewetting because it facilitated liquid spreading [41]. Therefore, a superior heat transfer performance was achieved with a larger CA difference between the parallel and normal directions, which is denoted as higher anisotropy. The experimental results showed that the S2, S3, and S4 surfaces demonstrated greater heat transfer performance than the S1 surface owing to their increased anisotropy, as observed in Table 4. Supported by slightly increased anisotropy, the S2 surface with the smallest groove spacing exhibited a higher HTC than and a CHF similar to those of the S3 and S4 surfaces.
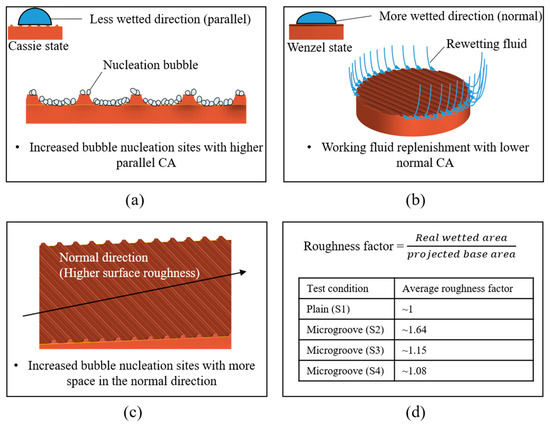
Figure 13.
Mechanisms of structure-induced anisotropic properties: (a,b) surface wettability effect; (c,d) surface roughness effect.
The effects of the anisotropic roughness can be observed in Table 3 and Figure 13c,d. In the normal direction, the S2, S3, and S4 surfaces exhibited more significant surface roughness compared with that of the plain surface (S1). For the S1 condition, the surface was relatively smooth, leading to limited space for nucleation. On the contrary, the microgrooved surfaces with sufficient space inside the grooves could provide more nucleation sites. The strengthened nucleation ability achieved a superior HTC on the microgrooved surfaces. Similar boiling experiment results can be observed in previous studies [24,58]. The average roughness factors are shown in Figure 13d. These roughness factors were mainly affected by the groove spacing, suggesting that the smaller the groove spacing that was selected, the higher the roughness factor that was derived. This is because more microgrooves could be presented on the test surface with a smaller spacing. With a larger space for bubble nucleation, the S2 surface could exhibit an HTC superior to those of the S3 and S4 surfaces.
3.5. Analysis of Bubble Dynamics
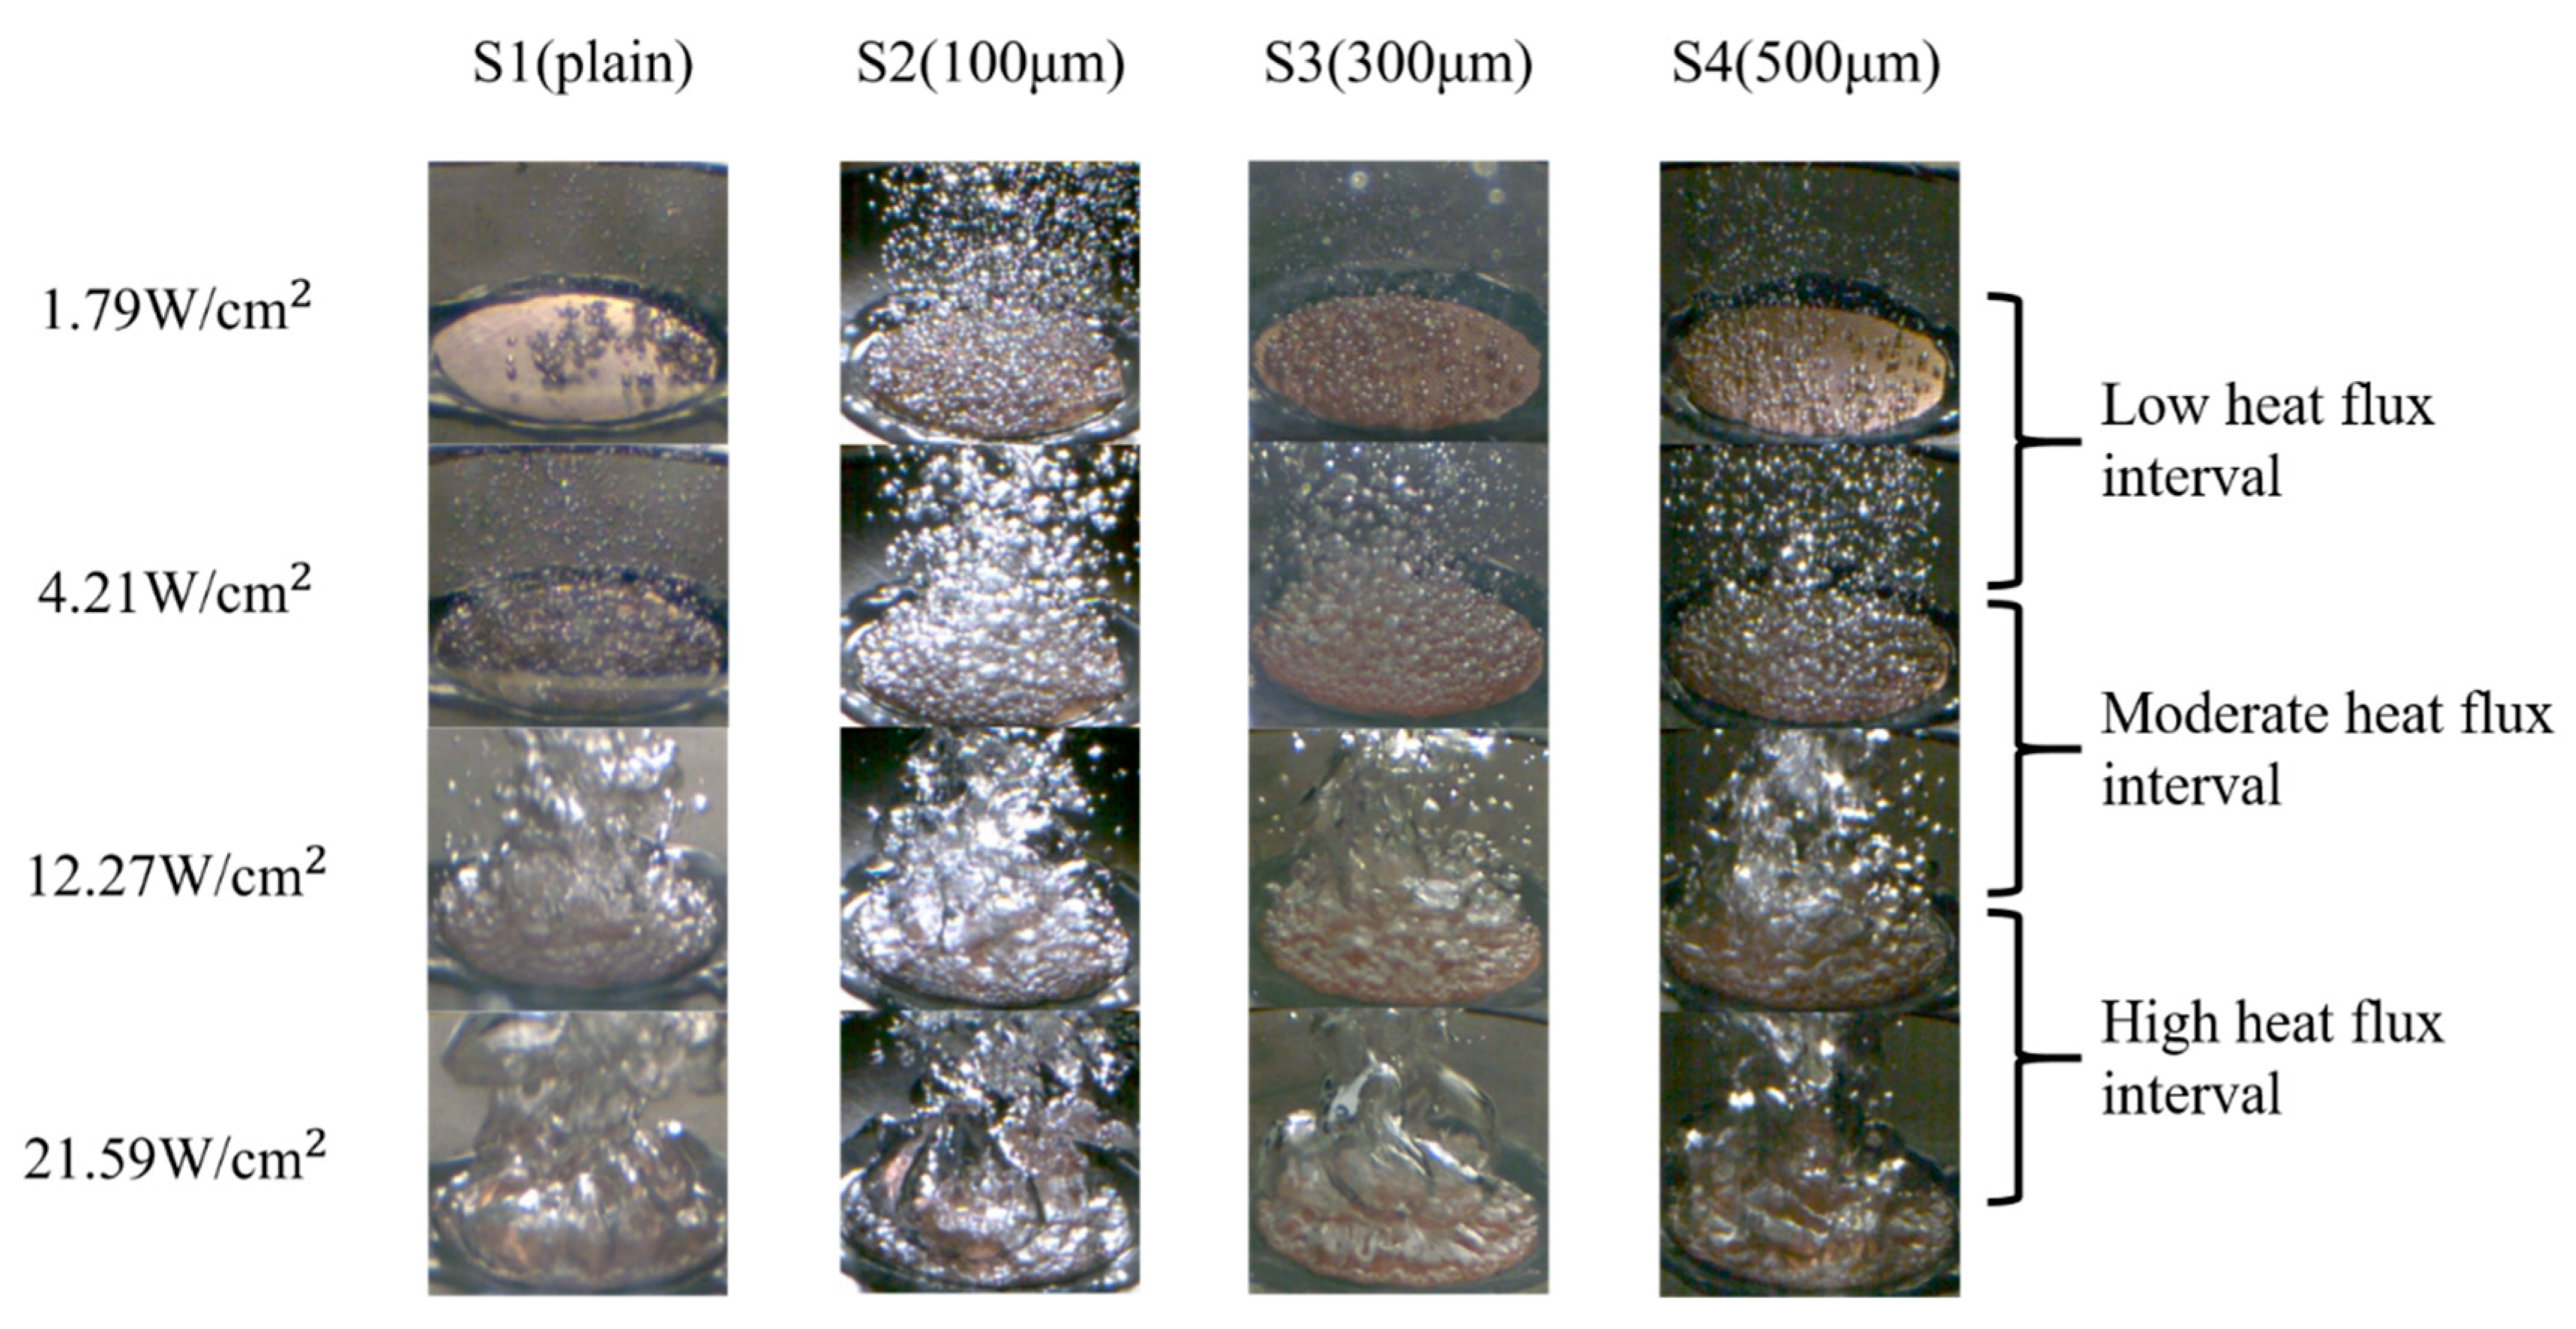
The images of the bubble dynamics at four different heat-flux intervals, as obtained using a high-speed camera, are shown in Figure 14. Owing to the increased surface roughness in the normal direction and the increased CA in the parallel direction, the numbers of bubble nucleation sites on the S2, S3, and S4 surfaces surpassed that of bubble nucleation sites on the S1 surface in the low heat flux regime. Unlike the S1 surface, the S2–S4 surfaces had bubbles that started to nucleate at lower wall superheats (5.56–6.43 K). As shown in the high-speed images in Figure 14, the emerging bubbles were more pronounced on the S2–S4 surfaces compared with those on the S1 surface at a heat flux of ~1.79 W/cm2. The difference in the bubble nucleation abilities can be attributed to the lower wettability in the parallel direction on the S2–S4 surfaces, which was induced by the more significant energy barrier of the microgrooved surfaces in the parallel direction. As stated by Liu et al. [40], this energy barrier prevented liquid droplets from collapsing and penetrating the microgrooves in the normal direction. Therefore, this phenomenon caused a less-wetted condition that lowered the minimum surface energy requirement to activate the bubble nuclei. A preferable bubble nucleation environment was formed with the assistance of a larger directional wettability difference and increased surface roughness in the normal direction. With an earlier onset of nucleate boiling and an increased number of nucleated bubbles, as presented in Figure 14, the S2–S4 surfaces could transfer more heat with the help of the liquid–vapor phase change.
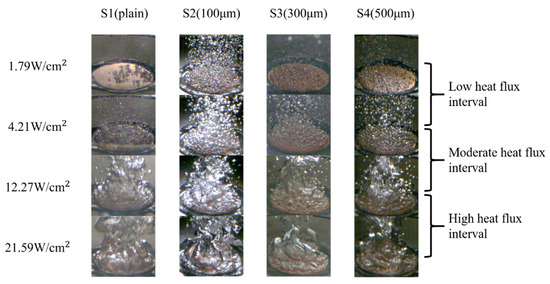
Figure 14.
High-speed images of bubble dynamics on S1–S4 surfaces in different heat flux regimes.
After the ONB, a large number of bubbles emerged and started to dominate the test surface at a low heat-flux interval (1.79–4.21 W/cm2). In this heat flux regime, the bubble departure frequency was noticeably increased, making it challenging to examine the bubble behavior. As the process continued, the interaction between the bubbles intensified, causing smaller bubbles to merge and form larger ones at the moderate heat-flux interval (4.21–12.27 W/cm2). The rapid aggregation and coalescence of bubbles propelled the boiling to the high heat-flux interval (12.27–21.59 W/cm2). When the heat flux reached ~22.44 W/cm2 on the S4 surface, the generated bubbles no longer had sufficient time to depart from the test surface. Consequently, these numerous bubbles coalesced to form a large vapor film that covered the entire surface. As depicted in Figure 14, larger vapor columns rapidly developed on the S1–S4 surfaces in the high heat flux regime because of over-intensified bubble coalescence, resulting in a vapor film. Owing to the low thermal conductivity of the vapor film, effective heat transfer was hindered, leading to the occurrence of film boiling.
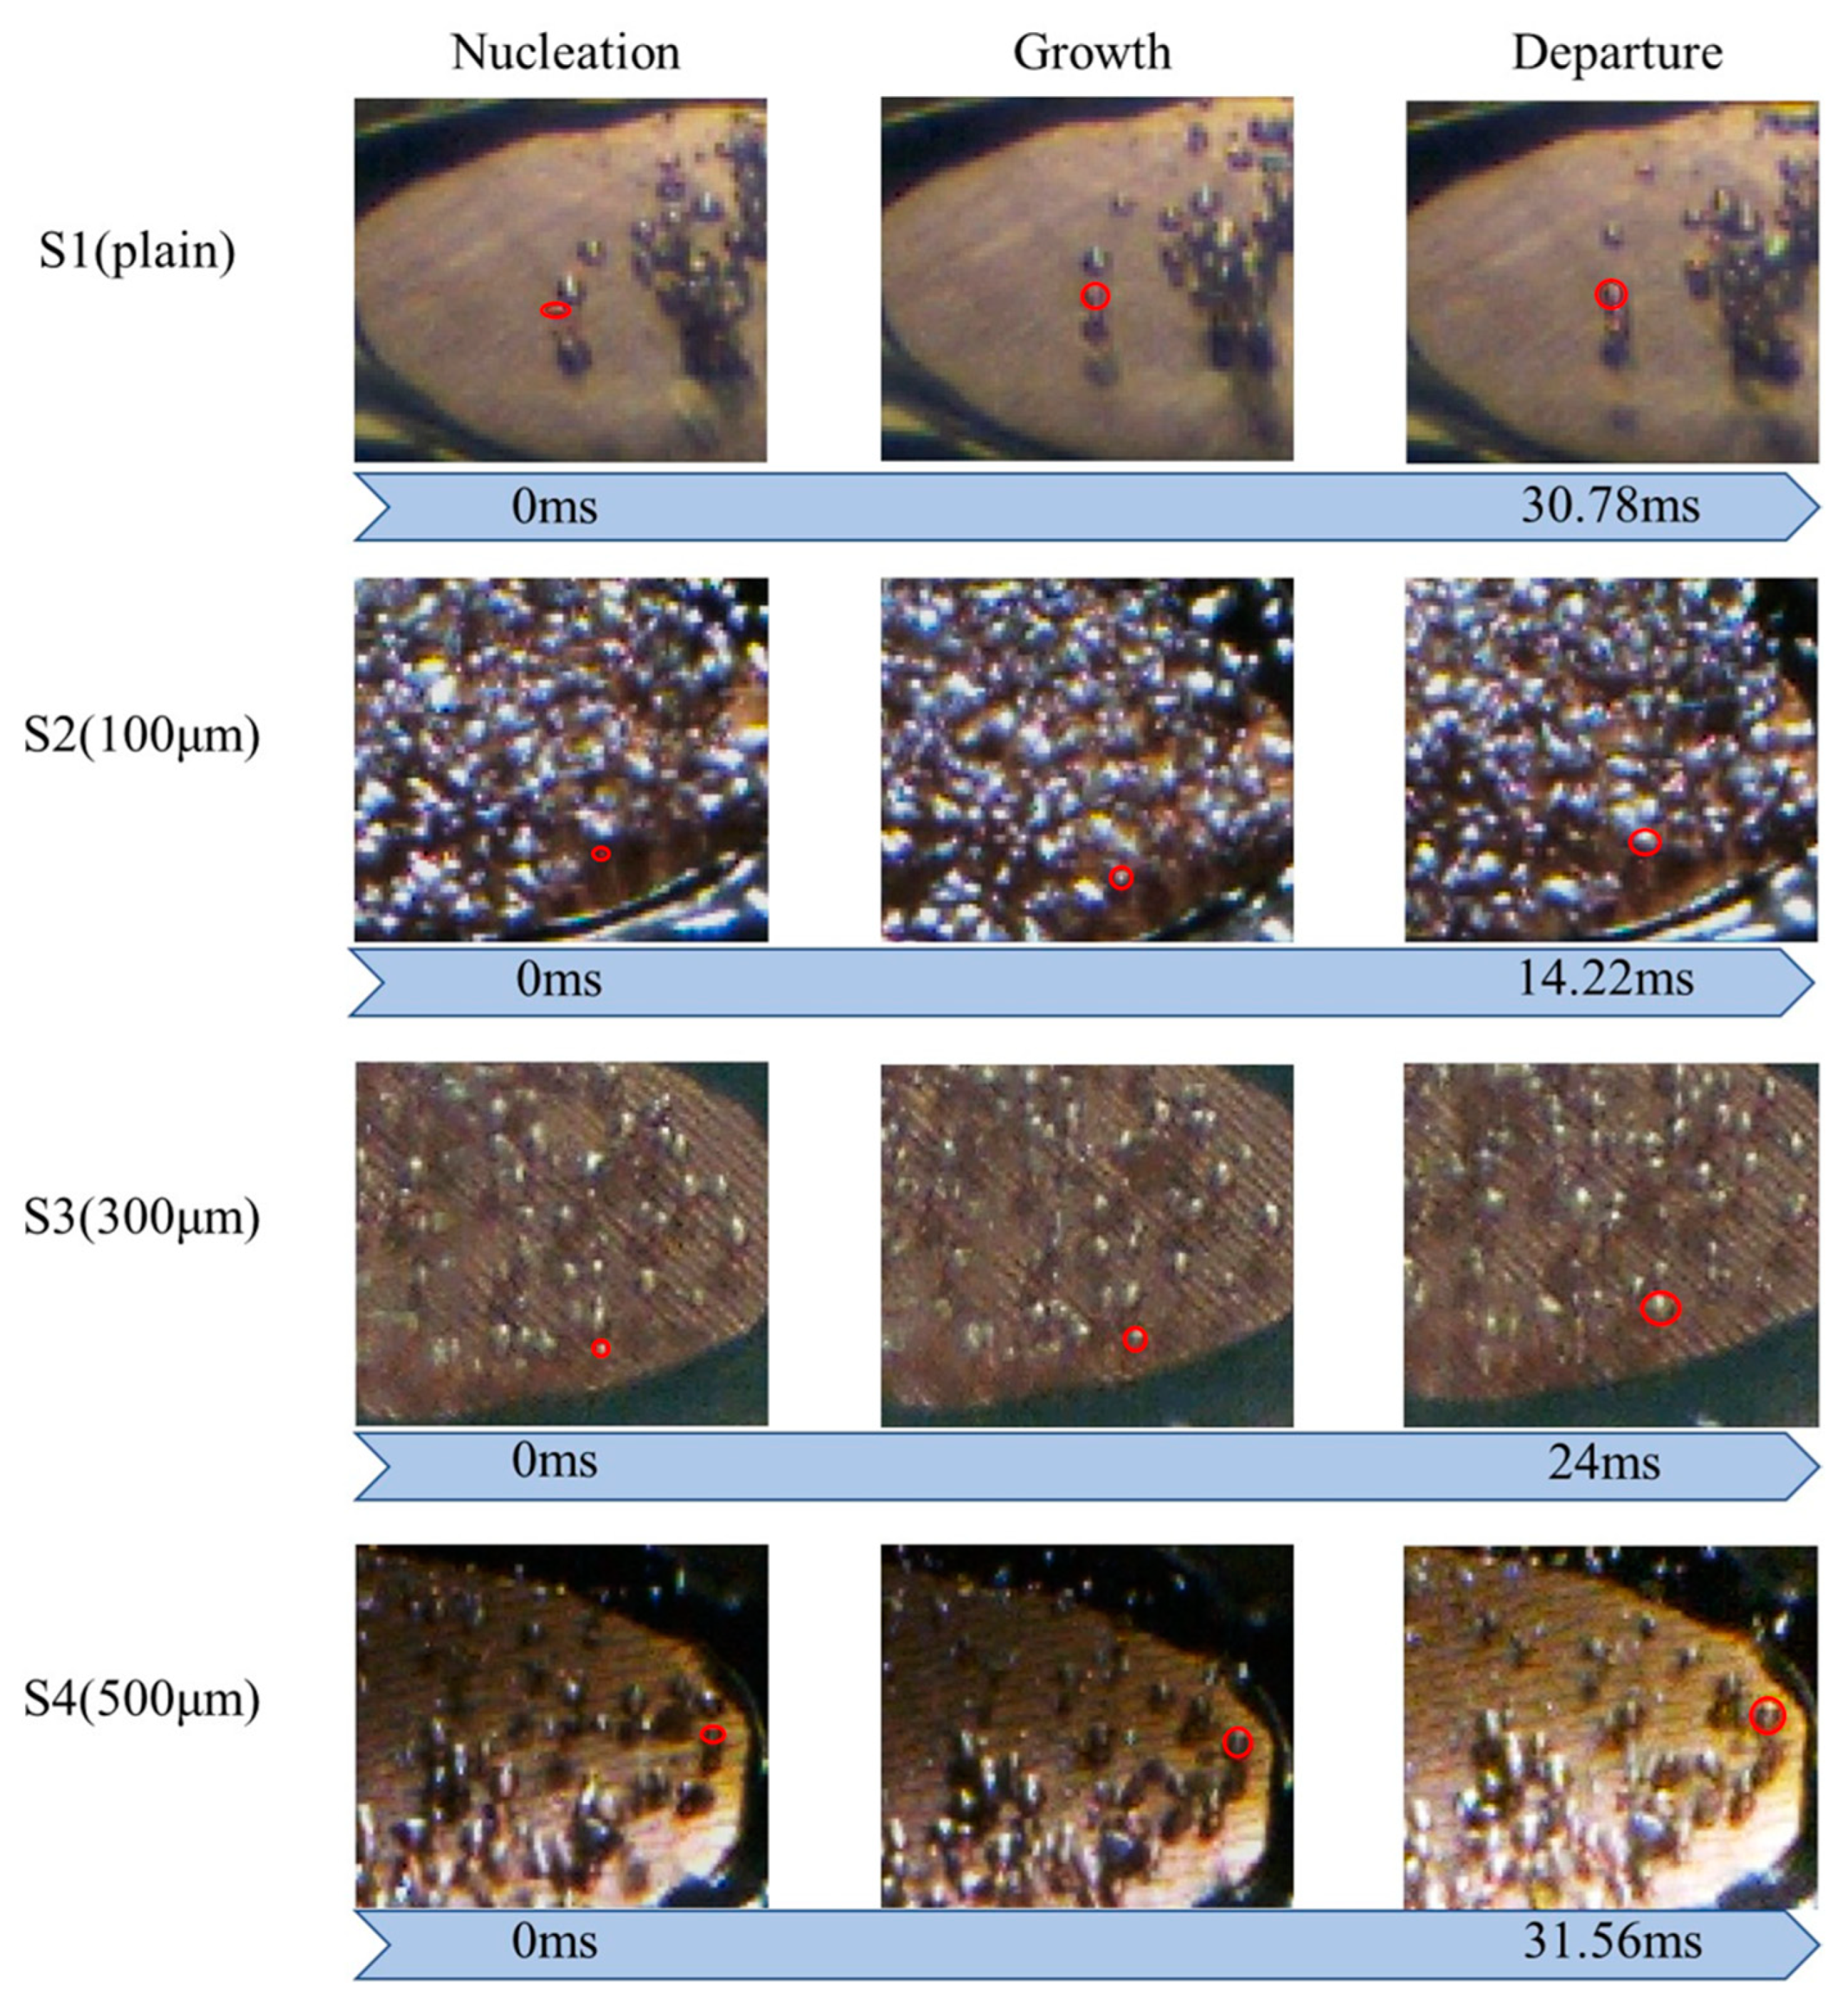
The bubble evolution cycle is another critical factor affecting the boiling heat transfer performance. As shown in Figure 15, the bubble detachment rate of the S2 surface was much faster than those of the S1, S3, and S4 surfaces in the low heat flux regime (~1.79 W/cm2). This is because the wettability in the normal direction for S2 was higher than those in the normal direction for the other test surfaces (Table 4). Enhanced liquid replenishment would accelerate the bubble evolution cycle. This efficient bubble detachment could facilitate heat dissipation. As presented in Figure 15, S3 also exhibited a high bubble departure rate. As a result, the differences in the directional wettability and surface roughness played a crucial role in reducing the surface wall superheat and achieving a higher heat transfer rate for S3 compared with S1. The S2 surface, with more nucleation sites, an earlier ONB, and a faster bubble evolution cycle, exhibited the most significant improvement in the heat transfer performance among all four test conditions.
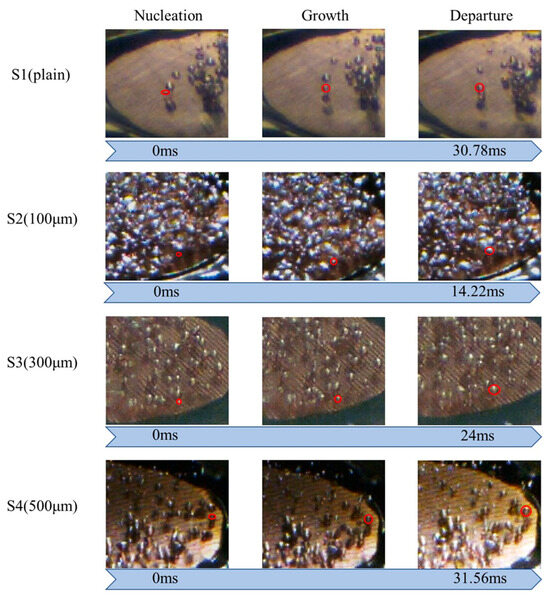
Figure 15.
Analysis of bubble evolution cycle on S1–S4 surfaces at a heat flux of ~1.79 W/cm2. (The red circles represent as indications to the specific bubbles for bubble analysis).
3.6. Discussion of CHF Correlations
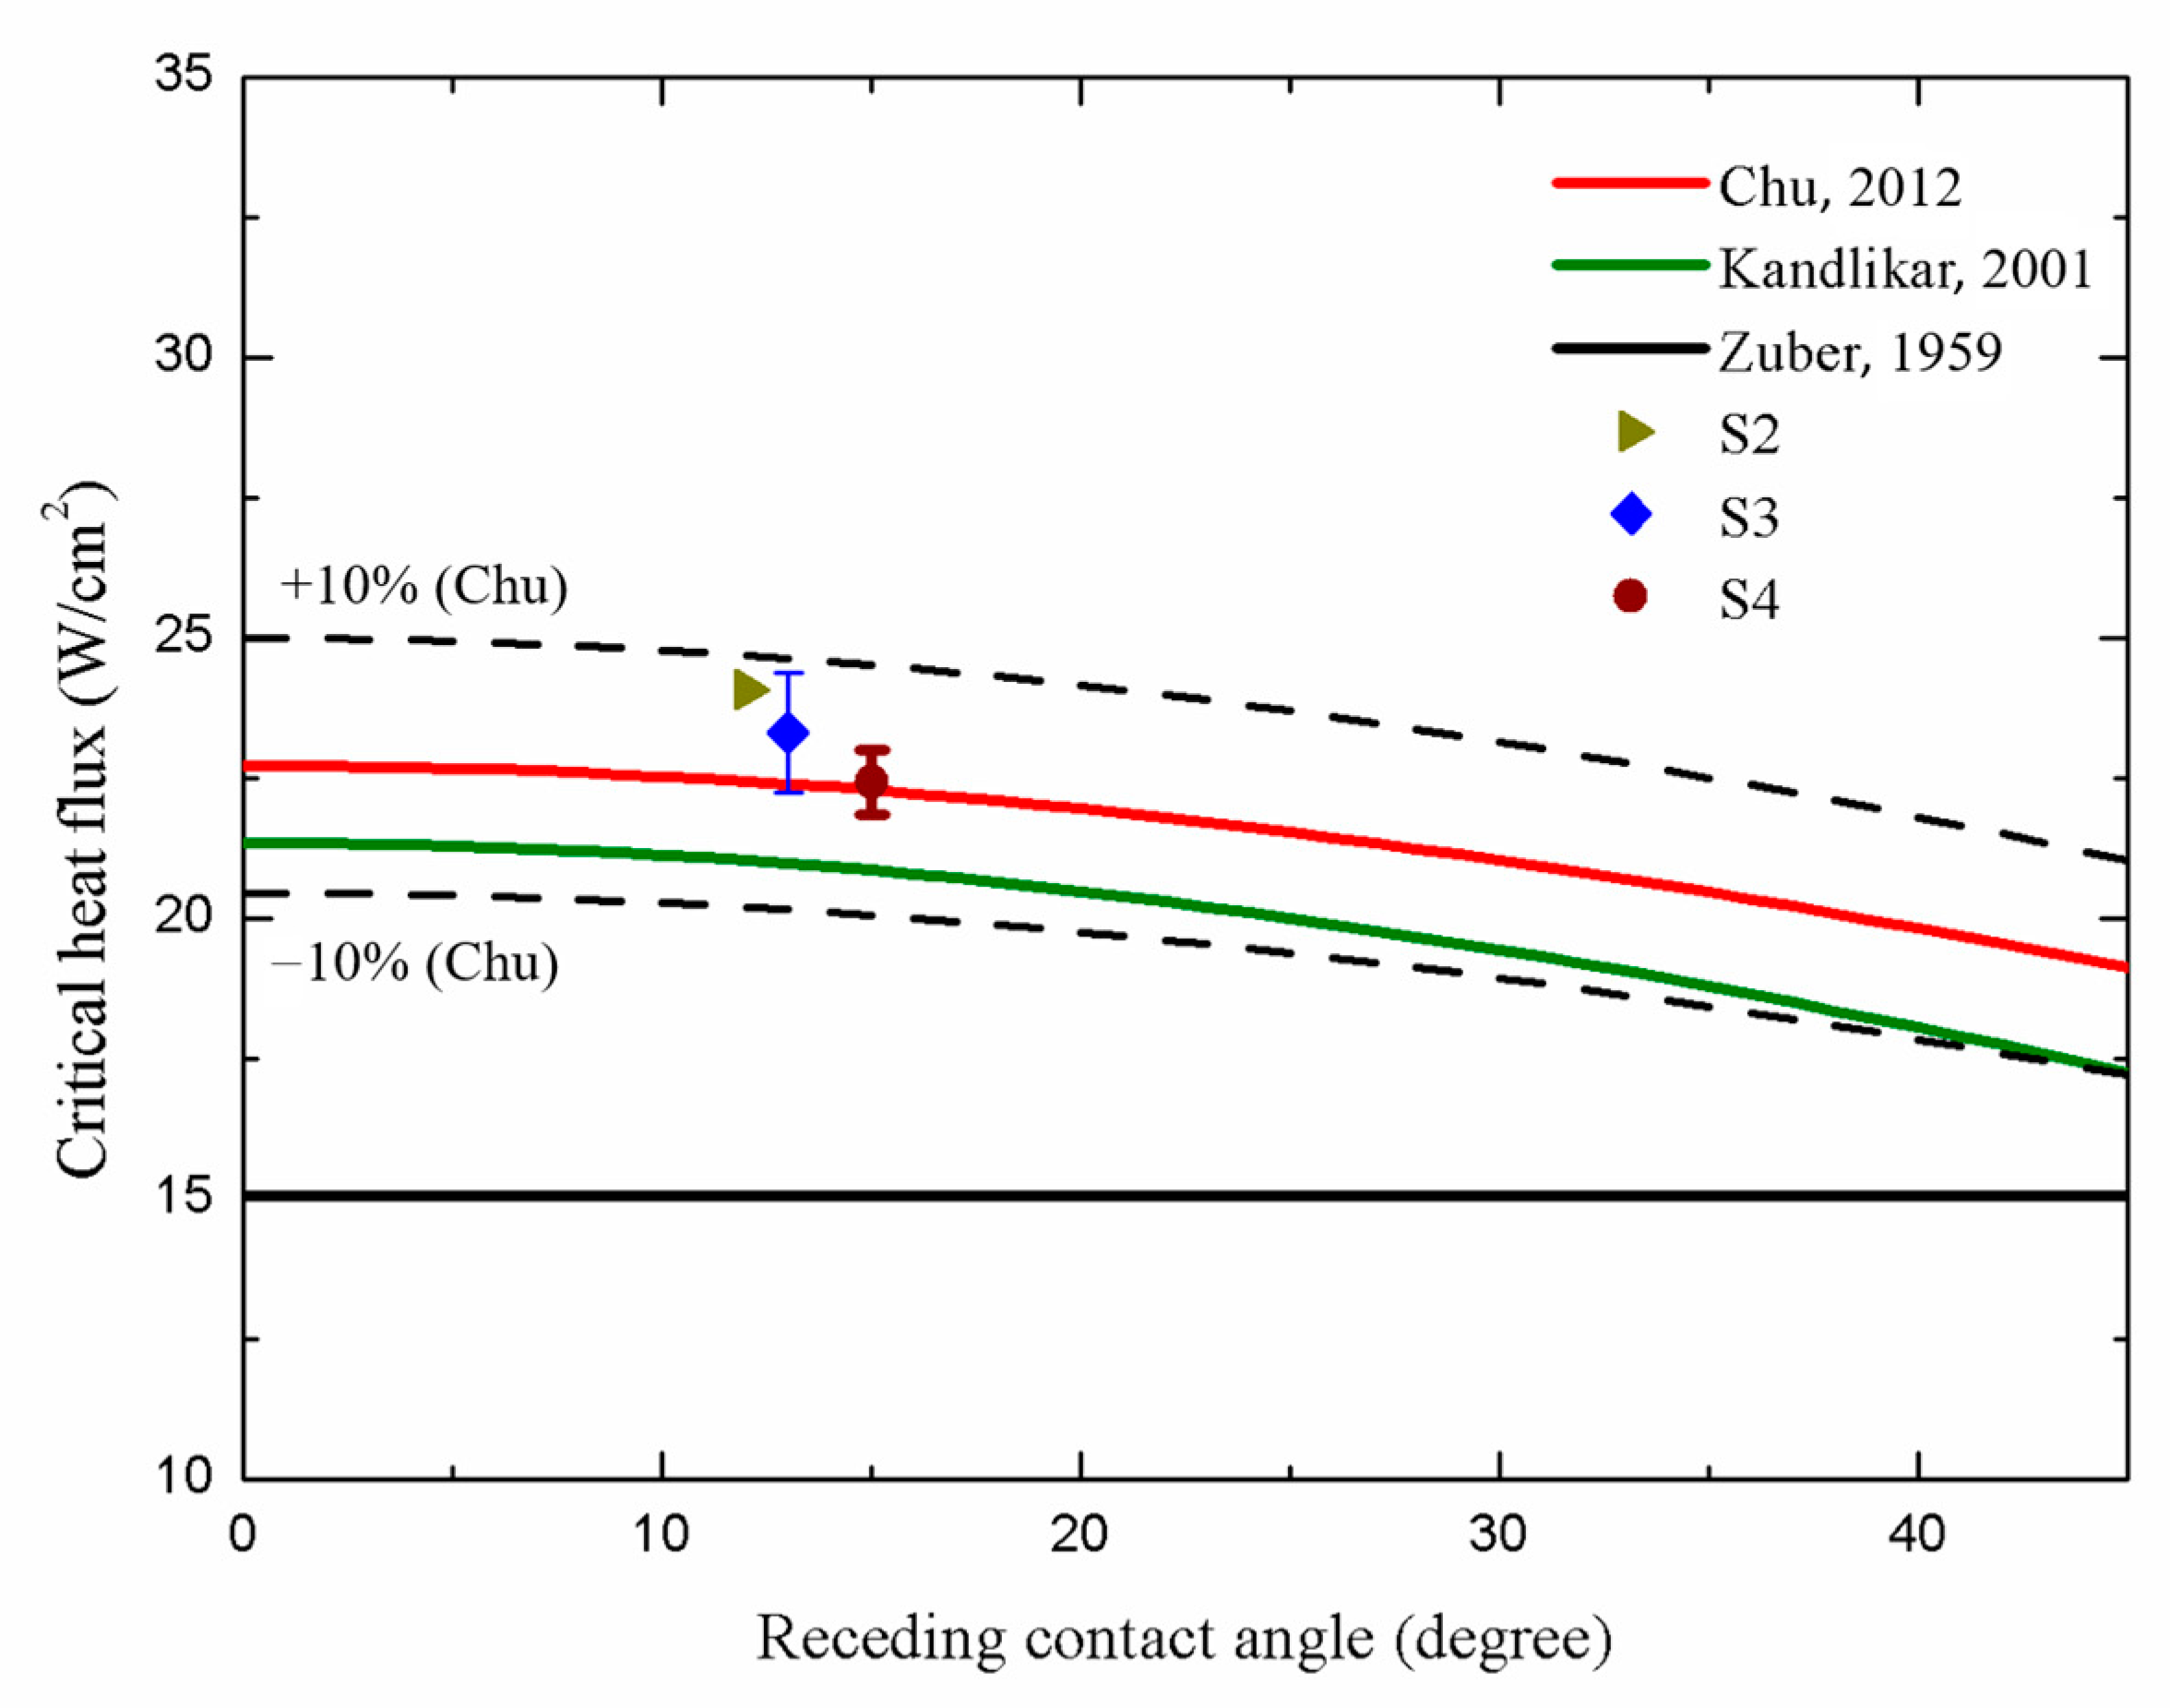
In terms of the CHF performance, the S2, S3, and S4 surfaces exhibited slightly lower CHF values of ~24.09 W/cm2, ~23.32 W/cm2, and ~22.44 W/cm2, respectively, compared with that of the S1 surface (~25.08 W/cm2). This suggested that the higher parallel CA and higher surface roughness of the microgrooved surfaces may cause slightly lower CHF values, primarily owing to the over-intensified interaction of bubbles on these surfaces. Figure 14 illustrates that on the S2–S4 surfaces, large vapor slugs formed at a heat flux of ~21.59 W/cm2, impeding the heat transfer from the test surface to the working fluid. Thus, slightly lower CHFs were achieved compared with that of the plain surface (S1).
A comparison between the CHF values obtained in the present study and those predicted using existing models is presented in Figure 16. One notable model proposed by Zuber [59], as shown in Equation (13), is based on hydrodynamic instability theory as follows:
where K is the dimensionless CHF ratio, which equals 0.131 in Zuber’s model; is the latent heat; is the surface tension of the working fluid; g is the gravitational acceleration constant; and and are the density of the working fluid in the vapor and the liquid phases, respectively. However, this model solely accounts for the effect of pool hydrodynamics during boiling and neglects the influence of test surface characteristics. As expressed in Equation (14), Kandlikar [60] developed an extended model based on Zuber’s and incorporated the effect of the surface wettability as follows:
where is the receding CA, and is the incline angle, which equals 0 on a horizontal surface. In this correlation, the CHF values increased with increasing surface wettability. As depicted in Figure 16, deviations between our CHF results obtained for microgrooved structures and those obtained using Kandlikar’s prediction model emerged owing to insufficient consideration of the effects of the surface morphology. Thus, a modified correlation combining both the surface wettability and roughness factor was introduced by Chu [61]. Chu’s correlation is presented in Equation (15) as follows:
where is the apparent CA; r is the roughness factor, which is defined as the ratio of the real wetted area to the projected base area; and equals r. As a result, in Figure 16, our CHF values match well with those theoretically predicted by Chu owing to the consideration of the effects of the surface wettability and roughness factor induced by the microgrooved structure. As a result, the CHF values of the microgrooved surfaces can be accurately predicted within a 10% error, using Chu’s prediction model.
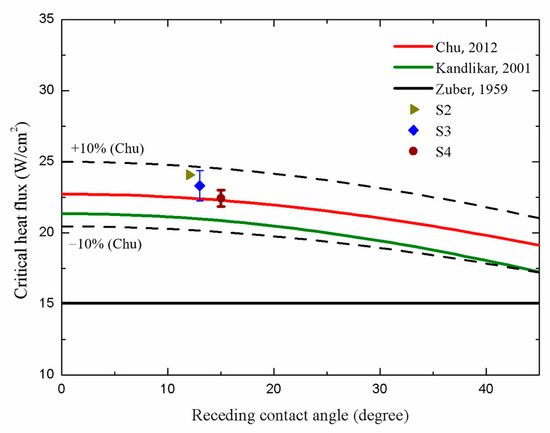
Figure 16.
Comparison of the CHF values in the present work with those in related prediction models [59,60,61]. The references of prediction models are from Zuber [59], Kandlikar [60] and Chu et al. [61]. (The dotted lines represent the ±10% error in Chu’s prediction model).
4. Conclusions
This work experimentally investigated the effects of the anisotropic properties of microgrooved surfaces on the heat transfer during pool boiling. The ultrafast femtosecond-laser texturing technique was employed to create microgrooves on flat copper surfaces. Novec-7100 was used as the working fluid during the experiments. Through the visual study of the bubble dynamics, the nucleation ability and bubble evolution cycle on the surfaces were analyzed and discussed. The mechanisms of the anisotropic wettability and roughness were used to explain the difference in the heat transfer performances for all the test conditions. The conclusions of the present study can be summarized as follows:
- All the microgrooved surfaces exhibited HTCs superior to that of the S1 surface, partially owing to the lower surface wettability in the direction parallel to the grooves. Superior nucleation ability was achieved on these surfaces. Moreover, the S2 surface, with a groove spacing of 100 μm, increased the HTC by a maximum factor of 1.37 compared with that of the plain surface (S1). This is because the S2 surface exhibited the highest anisotropy for all the test conditions;
- The effect of the anisotropic surface roughness facilitated the formation of more bubble nucleation sites on microgrooved surfaces. The roughness of the microgrooved surfaces in the normal direction was much higher than that of the microgrooved surfaces in the parallel direction, suggesting more space for bubble nucleation. As a result, the combination of the higher anisotropy and roughness on microgrooved surfaces resulted in a preferable condition for bubble nucleation and a superior heat transfer performance;
- The CHF values of the microgrooved surfaces were slightly decreased compared with that of the S1 surface. This is because the over-intensified bubble aggregation, due to the exceptional nucleation ability on microgrooved surfaces, deteriorated the heat transfer performance, forming a vapor film on the surfaces. Furthermore, the CHF values in the present work were evaluated using Chu’s empirical correlations, ensuring a good agreement.
In summary, microgrooved surfaces with anisotropic properties facilitated the improvement in the boiling heat transfer performance. These characteristics hold the potential for diverse industrial applications in the future. Further investigation of the effect of the dimensions of microgrooves on the boiling heat transfer will be conducted in future work.
Author Contributions
Conceptualization, P.-H.C.; Methodology, H.-C.C.; Investigation, H.-C.L., C.-H.K., H.-C.C. and T.-L.C.; Resources, T.-L.C.; Data curation, C.-H.K.; Writing—original draft, H.-C.L.; Supervision, P.-H.C.; Project administration, P.-H.C. All authors have read and agreed to the published version of the manuscript.
Funding
This work was supported by the Ministry of Science and Technology, Republic of China (Taiwan) (grants number MOST 109-2221-E-002-200-MY3 and MOST 109-2221-E-002-199-MY3).
Institutional Review Board Statement
Not applicable.
Informed Consent Statement
Not applicable.
Data Availability Statement
The data presented in this study are available on request from the corresponding author. The data are not publicly available due to patent filing.
Acknowledgments
All the procedures, data acquisition, and experimental work were carried out at the MEMS Thermal Control Laboratory, National Taiwan University, Taipei.
Conflicts of Interest
The authors declare no conflict of interest.
Nomenclature
| dCu | distance between T1 thermocouple and upper surface, m |
| dgrease | thickness of applied thermal grease, m |
| G | gravitational acceleration constant, m/s2 |
| hfg | latent heat of vaporization, J/kg |
| hSN/hS1 | heat transfer coefficient ratio |
| kCu | thermal conductivity of copper, W/m·K |
| kgrease | thermal conductivity of thermal grease, W/m·K |
| heat flux over the surface area of the sample, W/cm2 | |
| critical heat flux, W/cm2 | |
| r | roughness factor |
| T1 | temperature of the thermocouple located 14 mm below the test surface, °C |
| T2 | temperature of the thermocouple located 20 mm below the test surface, °C |
| T3 | temperature of the thermocouple located 26 mm below the test surface, °C |
| Tw | surface temperature, °C |
| Tsat | saturation temperature of the working fluid, °C |
| ΔTw | wall superheat, °C |
| Δx | depth difference at the thermocouple’s location, m |
| θ | contact angle |
| θ1 | contact angle measured in the direction parallel to the grooves |
| θ2 | contact angle measured in the direction normal to the grooves |
| Δθ12 | degree of anisotropy |
| θrec | receding contact angle |
| density, kg/m3 | |
| liquid density, kg/m3 | |
| vapor density, kg/m3 | |
| surface tension, N/m | |
| angle relative to horizontal | |
| - | from… to… |
| ~ | approximately |
| Abbreviations | |
| CA | contact angle |
| CAD | computer-aided design |
| CHF | critical heat flux |
| CCTCL | Chuan Chi Trading Co., Ltd. |
| DC | direct current |
| DI | deionized |
| GWP | global warming potential |
| BHTC | boiling heat transfer coefficient |
| ONB | onset of nucleate boiling |
| PUE | power usage effectiveness |
| PEEK | polyetheretherketone |
| Ra | average surface roughness |
| S | surface condition |
References
- Gupta, R.; Moazamigoodarzi, H.; MirhoseiniNejad, S.; Down, D.G.; Puri, I.K. Workload management for air-cooled data centers: An energy and exergy based approach. Energy 2020, 209, 118485. [Google Scholar] [CrossRef]
- Xu, S.J.; Zhang, H.; Wang, Z.L. Thermal Management and Energy Consumption in Air, Liquid, and Free Cooling Systems for Data Centers: A Review. Energies 2023, 16, 1279. [Google Scholar] [CrossRef]
- Endo, T.; Nukada, A.; Matsuoka, S. The Immersion Cooled TSUBAME-KFC: From Exascale Prototype to The Greenest Supercomputer in The World. In Proceedings of the 20th IEEE International Conference on Parallel and Distribution, Rhodes Island, Greece, 25–29 April 2006. [Google Scholar]
- Zhou, G.H.; Zhou, J.Z.; Huai, X.L.; Zhou, F.; Jiang, Y.W. A two-phase liquid immersion cooling strategy utilizing vapor chamber heat spreader for data center servers. Appl. Therm. Eng. 2022, 210, 118289. [Google Scholar] [CrossRef]
- Liu, C.; Yu, H. Evaluation and Optimization of a Two-Phase Liquid-Immersion Cooling System for Data Centers. Energies 2021, 14, 1395. [Google Scholar] [CrossRef]
- Kanbur, B.B.; Wu, C.L.; Fan, S.M.; Duan, F. System-level experimental investigations of the direct immersion cooling data center units with thermodynamic and thermoeconomic assessments. Energy 2021, 217, 119373. [Google Scholar] [CrossRef]
- Han, X.Y.; Guo, Y.J.; Wang, Q.; Phelan, P. Optical characterization and durability of immersion cooling liquids for high concentration III-V photovoltaic systems. Sol. Energy Mater. Sol. Cells 2018, 174, 124–131. [Google Scholar] [CrossRef]
- Sivakumar, B.; Navakrishnan, S.; Cibi, M.R.; Senthil, R. Experimental study on the electrical performance of a solar photovoltaic panel by water immersion. Environ. Sci. Pollut. Res. 2021, 28, 42981–42989. [Google Scholar] [CrossRef]
- Al-Amri, F.; Maatallah, T.S.; Al-Amri, O.F.; Ali, S.; Ali, S.; Ateeq, I.S.; Zachariah, R.; Kayed, T.S. Innovative technique for achieving uniform temperatures across solar panels using heat pipes and liquid immersion cooling in the harsh climate in the Kingdom of Saudi Arabia. Alex. Eng. J. 2022, 61, 1413–1424. [Google Scholar] [CrossRef]
- Patil, M.S.; Seo, J.H.; Lee, M.Y. A novel dielectric fluid immersion cooling technology for Li-ion battery thermal management. Energy Convers. Manag. 2021, 229, 113715. [Google Scholar] [CrossRef]
- Dubey, P.; Pulugundla, G.; Srouji, A.K. Direct Comparison of Immersion and Cold-Plate Based Cooling for Automotive Li-Ion Battery Modules. Energies 2021, 14, 1259. [Google Scholar] [CrossRef]
- Celen, A. Experimental Investigation on Single-Phase Immersion Cooling of a Lithium-Ion Pouch-Type Battery under Various Operating Conditions. Appl. Sci. 2023, 13, 2775. [Google Scholar] [CrossRef]
- Zhang, Y.H.; Zhou, J.; Zhou, W.J.; Qi, B.J.; Wei, J.J. CHF correlation of boiling in FC-72 with micro-pin-fins for electronics cooling. Appl. Therm. Eng. 2018, 138, 494–500. [Google Scholar] [CrossRef]
- Chen, G.; Jia, M.Z.; Zhang, S.W.; Tang, Y.; Wan, Z.P. Pool boiling enhancement of novel interconnected microchannels with reentrant cavities for high-power electronics cooling. Int. J. Heat Mass Transf. 2020, 156, 119836. [Google Scholar] [CrossRef]
- Ma, D.D.; Xia, G.D.; Zong, L.X.; Jia, Y.T.; Tang, Y.X.; Zhi, R.P. Experimental investigation of flow boiling heat transfer performance in zigzag microchannel heat sink for electronic cooling devices. Int. J. Therm. Sci. 2019, 145, 106003. [Google Scholar] [CrossRef]
- Herranz, L.E.; Munoz-Cobo, J.L.; Verdu, G. Heat transfer modeling in the vertical tubes of the passive containment cooling system of the simplified boiling water reactor. Nucl. Eng. Des. 1997, 178, 29–44. [Google Scholar] [CrossRef]
- Bang, I.C.; Jeong, J.H. Nanotechnology for advanced nuclear thermal-hydraulics and safety: Boiling and condensation. Nucl. Eng. Technol. 2011, 43, 217–242. [Google Scholar] [CrossRef]
- Okuyama, K.; Tsukahara, S.; Morita, N.; Iida, Y. Transient behavior of boiling bubbles generated on the small heater of a thermal ink jet printhead. Exp. Therm. Fluid Sci. 2004, 28, 825–834. [Google Scholar] [CrossRef]
- Chen, P.H.; Chen, W.C.; Chang, S.H. Bubble growth and ink ejection process of a thermal ink jet printhead. Int. J. Mech. Sci. 1997, 39, 683–695. [Google Scholar] [CrossRef]
- Chen, P.H.; Chen, W.C.; Ding, P.P.; Chang, S.H. Droplet formation of a thermal sideshooter inkjet printhead. Int. J. Heat Fluid Flow 1998, 19, 382–390. [Google Scholar] [CrossRef]
- Tran, N.; Sajjad, U.; Lin, R.; Wang, C.C. Effects of surface inclination and type of surface roughness on the nucleate boiling heat transfer performance of HFE-7200 dielectric fluid. Int. J. Heat Mass Transf. 2020, 147, 119015. [Google Scholar] [CrossRef]
- Kim, J.; Jun, S.; Laksnarain, R.; You, S.M. Effect of surface roughness on pool boiling heat transfer at a heated surface having moderate wettability. Int. J. Heat Mass Transf. 2016, 101, 992–1002. [Google Scholar] [CrossRef]
- Arenales, M.R.M.; Sujith, K.C.S.; Kuo, L.S.; Chen, P.H. Surface roughness variation effects on copper tubes in pool boiling of water. Int. J. Heat Mass Transf. 2020, 151, 119399. [Google Scholar] [CrossRef]
- Fan, S.M.; Jiao, L.S.; Wang, K.; Duan, F. Pool boiling heat transfer of saturated water on rough surfaces with the effect of roughening techniques. Int. J. Heat Mass Transf. 2020, 159, 120054. [Google Scholar] [CrossRef]
- Kumar, C.S.S.; Chang, Y.W.; Chen, P.H. Effect of heterogeneous wettable structures on pool boiling performance of cylindrical copper surfaces. Appl. Therm. Eng. 2017, 127, 1184–1193. [Google Scholar] [CrossRef]
- Surtaev, A.; Serdyukov, V.; Safonov, A. Characteristics of boiling heat transfer on hydrophobic surface. EPJ Web Conf. 2019, 196, 00054. [Google Scholar] [CrossRef]
- Bourdon, B.; Di Marco, P.; Rioboo, R.; Marengo, M.; De Coninck, J. Enhancing the onset of pool boiling by wettability modification on nanometrically smooth surfaces. Int. Commun. Heat Mass Transf. 2013, 45, 11–15. [Google Scholar] [CrossRef]
- Su, C.Y.; Yang, C.Y.; Jhang, B.W.; Hsieh, Y.L.; Sin, Y.Y.; Huang, C.C. Pool Boiling Heat Transfer Enhanced by Fluorinated Graphene as Atomic Layered Modifiers. ACS Appl. Mater. Interfaces 2020, 12, 10233–10239. [Google Scholar] [CrossRef]
- Hsu, C.C.; Chen, P.H. Surface wettability effects on critical heat flux of boiling heat transfer using nanoparticle coatings. Int. J. Heat Mass Transf. 2012, 55, 3713–3719. [Google Scholar] [CrossRef]
- Wang, X.M.; Fadda, D.; Godinez, J.; Lee, J.; You, S.M. Effect of wettability on pool boiling heat transfer with copper microporous coated surface. Int. J. Heat Mass Transf. 2022, 194, 123059. [Google Scholar] [CrossRef]
- Betz, A.R.; Jenkins, J.; Kim, C.J.; Attinger, D. Boiling heat transfer on superhydrophilic, superhydrophobic, and superbiphilic surfaces. Int. J. Heat Mass Transf. 2013, 57, 733–741. [Google Scholar] [CrossRef]
- Gregorcic, P.; Zupancic, M.; Golobic, I. Scalable Surface Microstructuring by a Fiber Laser for Controlled Nucleate Boiling Performance of High- and Low-Surface-Tension Fluids. Sci. Rep. 2018, 8, 7461. [Google Scholar] [CrossRef] [PubMed]
- Ho, J.Y.; Wong, K.K.; Leong, K.C. Saturated pool boiling of FC-72 from enhanced surfaces produced by Selective Laser Melting. Int. J. Heat Mass Transf. 2016, 99, 107–121. [Google Scholar] [CrossRef]
- Orman, L.J.; Radek, N.; Pietraszek, J.; Szczepaniak, M. Analysis of Enhanced Pool Boiling Heat Transfer on Laser-Textured Surfaces. Energies 2020, 13, 2700. [Google Scholar] [CrossRef]
- Moze, M.; Vajc, V.; Zupancic, M.; Golobic, I. Hydrophilic and Hydrophobic Nanostructured Copper Surfaces for Efficient Pool Boiling Heat Transfer with Water, Water/Butanol Mixtures and Novec 649. Nanomaterials 2021, 11, 3216. [Google Scholar] [CrossRef] [PubMed]
- Betz, A.R.; Xu, J.; Qiu, H.H.; Attinger, D. Do surfaces with mixed hydrophilic and hydrophobic areas enhance pool boiling? Appl. Phys. Lett. 2010, 97, 141909. [Google Scholar] [CrossRef]
- Pontes, P.; Cautela, R.; Teodori, E.; Moita, A.S.; Moreira, A.L.N. Experimental description of bubble dynamics and heat transfer processes occurring on the pool boiling of water on biphilic surfaces. Appl. Therm. Eng. 2020, 178, 115507. [Google Scholar] [CrossRef]
- Motezakker, A.R.; Sadaghiani, A.K.; Çelik, S.; Larsen, T.; Villanueva, L.G.; Kosar, A. Optimum ratio of hydrophobic to hydrophilic areas of biphilic surfaces in thermal fluid systems involving boiling. Int. J. Heat Mass Transf. 2019, 135, 164–174. [Google Scholar] [CrossRef]
- Lee, S.G.; Lim, H.S.; Lee, D.Y.; Kwak, D.; Cho, K. Tunable Anisotropic Wettability of Rice Leaf-Like Wavy Surfaces. Adv. Funct. Mater. 2013, 23, 547–553. [Google Scholar] [CrossRef]
- Liu, S.; Xiao, G.J.; Lin, O.C.; He, Y.; Song, S.Y. A new one-step approach for the fabrication of microgrooves on Inconel 718 surface with microporous structure and nanoparticles having ultrahigh adhesion and anisotropic wettability: Laser belt processing. Appl. Surf. Sci. 2023, 607, 155108. [Google Scholar] [CrossRef]
- Lian, Z.X.; Xu, J.K.; Yu, Z.J.; Yu, P.; Yu, H.D. A simple two-step approach for the fabrication of bio-inspired superhydrophobic and anisotropic wetting surfaces having corrosion resistance. J. Alloys Compd. 2019, 793, 326–335. [Google Scholar] [CrossRef]
- Zhou, X.K.; Xue, W.; Liu, W.W.; Zhu, D.H.; Cao, Y. Quadri-directionally anisotropic droplets sliding surfaces fabricated by selective laser texturing of aluminum alloy plates. Appl. Surf. Sci. 2020, 509, 145406. [Google Scholar] [CrossRef]
- Ma, C.H.; Bai, S.X.; Peng, X.D.; Meng, Y.G. Anisotropic wettability of laser micro-grooved SiC surfaces. Appl. Surf. Sci. 2013, 284, 930–935. [Google Scholar] [CrossRef]
- Wu, X.; Huang, J.; Zhuang, Y.; Liu, Y.; Yang, J.; Ouyang, H.; Han, X. Prediction Models of Saturated Vapor Pressure, Saturated Density, Surface Tension, Viscosity and Thermal Conductivity of Electronic Fluoride Liquids in Two-Phase Liquid Immersion Cooling Systems: A Comprehensive Review. Appl. Sci. 2023, 13, 4200. [Google Scholar] [CrossRef]
- Sajjad, U.; Sadeghianjahromi, A.; Ali, H.M.; Wang, C.C. Enhanced pool boiling of dielectric and highly wetting liquids—A review on enhancement mechanisms. Int. Commun. Heat Mass Transf. 2020, 119, 104950. [Google Scholar] [CrossRef]
- Sajjad, U.; Sadeghianjahromi, A.; Ali, H.M.; Wang, C.C. Enhanced pool boiling of dielectric and highly wetting liquids—A review on surface engineering. Appl. Therm. Eng. 2021, 195, 117074. [Google Scholar] [CrossRef]
- Kim, J.S.; Girard, A.; Jun, S.C.; Lee, J.; You, S.M. Effect of surface roughness on pool boiling heat transfer of water on hydrophobic surfaces. Int. J. Heat Mass Transf. 2018, 118, 802–811. [Google Scholar] [CrossRef]
- Taylor, J.R. An introduction to error analysis—The study of uncertainties in physical measurements. J. Chem. Soc. Faraday Trans. I 1983, 79, 2269. [Google Scholar] [CrossRef]
- Rohsenow, W.M. A method of correlating heat-transfer data for surface boiling of liquids. Trans. Am. Soc. Mech. Eng. 1952, 74, 969–975. [Google Scholar] [CrossRef]
- Thiagarajan, S.J.; Yang, R.G.; King, C.; Narumanchi, S. Bubble dynamics and nucleate pool boiling heat transfer on microporous copper surfaces. Int. J. Heat Mass Transf. 2015, 89, 1297–1315. [Google Scholar] [CrossRef]
- El-Genk, M.S.; Parker, J.L. Enhanced boiling of HFE-7100 dielectric liquid on porous graphite. Energy Convers. Manag. 2005, 46, 2455–2481. [Google Scholar] [CrossRef]
- Fan, S.M.; Tong, W.; Duan, F. Nucleate pool boiling heat transfer enhancement in saturated Novec 7100 using titanium dioxide nanotube arrays. Int. Commun. Heat Mass Transf. 2021, 122, 105166. [Google Scholar] [CrossRef]
- Jiang, Y.W.; Zhou, G.H.; Zhou, J.Z.; Zhou, F.; Huai, X.L. Saturated pool boiling heat transfer of HFE-7100 on sintered copper powder and wire mesh microporous surfaces: A comparison study. Appl. Therm. Eng. 2022, 216, 119067. [Google Scholar] [CrossRef]
- Kwon, D.; Lee, S.; Yeom, E. Experimental investigation on water repellency and anisotropic wettability of microgrooved polymer surfaces. Exp. Fluids 2019, 60, 1–12. [Google Scholar] [CrossRef]
- Gui, N.; Xu, W.; Tian, J.; Rosengarten, G.; Brandt, M.; Qian, M. Fabrication and anisotropic wettability of titanium-coated microgrooves. J. Appl. Phys. 2018, 123, 095306. [Google Scholar] [CrossRef]
- Wenzel, R.N. Resistance of solid surfaces to wetting by water. Ind. Eng. Chem. 1936, 28, 988–994. [Google Scholar] [CrossRef]
- Cassie, A.; Baxter, S. Wettability of porous surfaces. Trans. Faraday Soc. 1944, 40, 546–551. [Google Scholar] [CrossRef]
- El-Genk, M.S.; Pourghasemi, M. Experimental investigation of saturation boiling of HFE-7000 dielectric liquid on rough copper surfaces. Therm. Sci. Eng. Prog. 2020, 15, 100428. [Google Scholar] [CrossRef]
- Zuber, N. Hydrodynamic Aspects of Boiling Heat Transfer. Thesis, Los Angeles and Ramo-Wooldridge Corporation, University of California, Los Angeles, CA, USA, 1959. [Google Scholar]
- Kandlikar, S.G. A theoretical model to predict pool boiling CHF incorporating effects of contact angle and orientation. J. Heat Transf. Trans. Asme 2001, 123, 1071–1079. [Google Scholar] [CrossRef]
- Chu, K.H.; Enright, R.; Wang, E.N. Structured surfaces for enhanced pool boiling heat transfer. Appl. Phys. Lett. 2012, 100, 241603. [Google Scholar] [CrossRef]

Disclaimer/Publisher’s Note: The statements, opinions and data contained in all publications are solely those of the individual author(s) and contributor(s) and not of MDPI and/or the editor(s). MDPI and/or the editor(s) disclaim responsibility for any injury to people or property resulting from any ideas, methods, instructions or products referred to in the content. |
© 2024 by the authors. Licensee MDPI, Basel, Switzerland. This article is an open access article distributed under the terms and conditions of the Creative Commons Attribution (CC BY) license (https://creativecommons.org/licenses/by/4.0/).