Abstract
The stability of global economies relies heavily on power systems (PS) that have sufficient operating reserves. When these reserves are insufficient, power systems become vulnerable to issues such as load shedding or complete blackouts. Maintaining grid stability becomes even more challenging with a high penetration of renewable energy sources (RES). However, RES, connected through power electronic devices, offer significant potential as ancillary service (AS) sources. Renewable energy-based microgrids (MG), which aggregate various RES resources and have substantial load control potential, further enhance the capability of AS provision from RES. The presence of diverse AS resources raises the question of how to dispatch ancillary service signals optimally to all resources. Most of the previous research work related to AS allocation relied on single-bus MG models. This paper proposes a detailed MG model for the optimal dispatching of ASs among the resources using Virtual Load, along with an optimization procedure to achieve the best results. The model incorporates voltage profiles and power losses for AS dispatching, and a comparative analysis is conducted to quantify the significance of grid modeling. The model and proposed procedure are tested using the CIGRE microgrid benchmark model. The results indicate that detailed modeling of MG can impact the results by 11%, compared to single-bus modeling, which qualifies detailed MG modeling for all future research work and shows the impact that modeling can have on technical and economic indicators of MG operation.
1. Introduction
In modern power systems, the penetration of renewable energy sources (RES) and Distributed Energy Resources (DERs) has experienced rapid growth. The introduction of flexible loads, Energy Storage Systems (ESS), rooftop solar photovoltaic (PV), electric vehicles (EVs), and Demand Response (DR) providers has contributed significantly to this trend [1]. Consequently, the power system is evolving rapidly, necessitating enhanced flexibility for the coordinated operations of system operators [2]. This evolution also facilitates the active involvement of new entities in AS provision [1,3]. ASs, managed by the grid operators (transmission system operators (TSOs) and distribution system operators (DSOs)), ensure the proper operation of the power grid. To ensure a reliable power supply, it is necessary that frequency, voltage, and power quality remain within certain limits, which becomes more difficult with increased participation of RES and DER [4,5].
TSOs leverage aggregated services from DERs for grid balancing and managing congestion at the transmission level. Simultaneously, DSOs harness the flexibility of DERs for local services, including balancing, voltage control, and congestion management [2]. A high degree of observability, interoperability, and operational coordination among DERs is crucial for the efficiency of the overall operation and their joint participation in ASs. Additionally, it is important to ensure that DERs adhere to required technical performance standards and network constraints [2,6].
Recent studies have explored the various aspects of DER integration and their participation and possibilities in being involved in the provision of ASs. For instance, coordinated voltage management in systems with a high interconnection of PVs is investigated in [7]. A day-ahead congestion management framework based on congestion prices, utilizing DR from the consumer end, is proposed in [8]. In [9], the authors investigate decentralized congestion management strategies from different DER types. Methodologies for voltage control and reactive power implications under high DER penetration are explored in [10]. Ref. [11] examines power system restoration in a RES-dominant decentralized grid system, while [12] details harmonic mitigation strategies and control using power electronic devices in RES-based systems. In [13], the authors aim to determine a range of ASs achievable through converter-interfaced DERs and propose methodologies for the measurement and quantification of ASs. The newly explored ASs encompass the following: (1) Inertial response; (2) Primary frequency response; (3) Active power smoothing (ramp-rate limitation); (4) Exchange of reactive power for voltage regulation; (5) Fault-ride-through and contribution to fault clearing; (6) Voltage harmonic mitigation.
In the dynamic development of modern PSs, the efficient operation of MGs has become increasingly crucial. MGs consist of various energy resources, including photovoltaic (PV) panels, wind turbines, battery storage systems, controllable loads, and more. Optimal operation of these resources has always been the goal of MGs, especially from an economic point of view. However, having all these aggregated DERs, MGs represent a valuable resource for the provision of ASs. Therefore, this important aspect of providing ASs has to be added to the optimization procedure of MGs. One of the important aspects that contribute to the optimization of MG performance is the dispatching of AS signals among the available resources. The strategic allocation and management of AS signals within an MG is given in [14,15,16].
The control mechanisms in MGs are broadly categorized as centralized, decentralized, or distributed controls, each serving a range of control functions analogous to those employed in the larger power grid. These functions encompass droop control, voltage and frequency regulation, active and reactive power sharing, energy management, and participation in energy markets [17,18,19].
Furthermore, specific control functions within MGs are derived from generic control methodologies, such as closed-loop controls, open-loop controls, logic-based controls, or optimization techniques, as shown in Table 1. Notably, optimization techniques are gaining increasing attention in research, with sub-fields like linear programming, non-linear programming, and metaheuristic optimization (e.g., genetic algorithms) emerging as focal points. This diversification reflects the ongoing exploration and refinement of control methodologies in the domain of electric PSs and MGs [20,21].
This paper investigates the problem of ancillary service allocation among all available resources within an MG. As most of the previous work related to this topic rely on single-bus models of MG (Table 1), meaning that power losses, power flows, voltage profiles, and their limitations are all neglected, this paper proposes a detailed MG modeling and quantifies the importance of having a detailed model by conducting a comparative analysis. Even though voltage profiles have not been explicitly analyzed in this research paper, voltages are calculated at each step of the optimization and have a direct impact on power losses in the grid, which in turn affects the optimization results—something that cannot be captured in a single-bus model. In short, even though the considered ancillary service requirement primarily involves power changes, the allocation of this requirement among different resources is significantly influenced by voltage profiles.
In addition, the proposed model introduces Virtual Load at the point of common coupling between the power grid and MG as a way of including ancillary service signals coming from the system operator into power flow analysis. The proposed methodology is validated using the CIGRE medium voltage (MV) microgrid benchmark model [22]. Findings suggest that the inclusion of detailed MG modeling can influence the outcomes by 11%. In addition, Virtual Load has been successfully incorporated into load flow analysis, providing optimal results with the inclusion of ancillary services.

Table 1.
Overview of previous works.
Table 1.
Overview of previous works.
| Objective | Model Type | Method |
|---|---|---|
| Minimizing MG operation costs while scheduling resources optimally and meeting utility grid variability constraints [23]. | Single-bus model | A mixed integer linear programming (MILP) model is used to formulate the microgrid optimal scheduling problem subject to prevailing operational and added flexibility constraints. MIP models are solved using CPLEX 12.6. |
| Optimize MG dispatch for participation in real-time ancillary service markets using MPC [7]. | Single-bus model | Logic-based controls, Model Predictive Control (MPC) without ancillary services, and MPC with ancillary services. |
| Minimizes operational costs by optimizing the mix of resources for regulation reserves [24]. | Detailed model | Conditional value-at-risk (CVaR) theory is adopted to effectively measure and mitigate potential risks of the PS. The optimization model is a MILP model, which is solved in MATLAB by calling the YALMIP toolbox in the CPLEX solver. |
| The objective function minimizes operation costs by coordinating LS-BESS and conventional units for multi-type active power regulation services [25]. | Detailed model | Calling commercial software CPLEX based on YALMIP toolbox in CPLEX solver. |
| A two-stage dispatching model for a hybrid renewable energy system combining wind, PV, and thermal power [16]. | Single-bus model | Lingo17.0 Software. (Using mixed-integer linear programming (MILP) for the optimization process). |
| Minimize the total cost of energy and reserves by co-optimizing energy and ramping reserves during both normal and contingency conditions [26]. | Detailed model | Probability-weighted scenarios (PWS) and Probability transition matrices (PTM). Markovian structure. |
| Optimize the scheduling of Virtual Power Plants for participation in AS markets, focusing on enhancing PS flexibility and reducing net operating costs [27]. | Single-bus model | Using the CPLEX solver |
| Maximize the total operation profit of integrated energy service providers with respect to operation strategy and product portfolio providing ASs of frequency regulation services and other reserve services [28]. | Single-bus model | Mixed-Integer Optimization |
| Optimize the total cost. The study aims to achieve this optimization through Lyapunov Optimization Technique (LOT) for real-time energy management without requiring any prior system parameter estimation [29]. | Single-bus model | MILP model |
| Minimize the total cost of operation and construction of these power stations by integrating both fixed and variable costs and considering the AS costs [30]. | Single-bus model | MATLAB-Cplex-Yalmip. (Cooperative Game Method can be solved by Shapley value method). |
| Maximize self-consumption within a renewable energy community and minimize energy procurement costs while simultaneously providing ASs to the PS [31]. | Single-bus model | MILP model |
| This research paper quantifies the importance of detailed modeling and proposes Virtual Load for the inclusion of ASs into load flow. | Detailed modeling VS Single-bus model | MATLAB modeling and Genetic Algorithm optimization |
2. Existing ASs and the Related Market Design
ASs encompass activities associated with ensuring the security of distribution systems. These services include tasks such as maintaining frequency response stability, offering backup, supplying reactive power, facilitating system restoration, and initiating black start procedures. In traditional electric PSs, where power primarily flows from transmission systems to distribution systems, ASs are typically delivered by power plants connected to the transmission system [32]. The primary actor in defining and managing AS is often identified as the TSO. Within this framework, the European Network of TSOs characterizes an AS as the implementation of diverse functions aimed at maintaining the TSO’s system security [33].
2.1. Categories of ASs
Maintaining a commitment to established standards and regulations is imperative in managing the quality of electrical energy from its production to end-user consumption. As mentioned before, in traditional systems characterized by unidirectional power flow, ASs are provided by production facilities under the supervision of TSOs, aiming to regulate voltage and frequency parameters, ensuring they remain within predefined limits. A general classification of these ASs is depicted in Figure 1 [34].
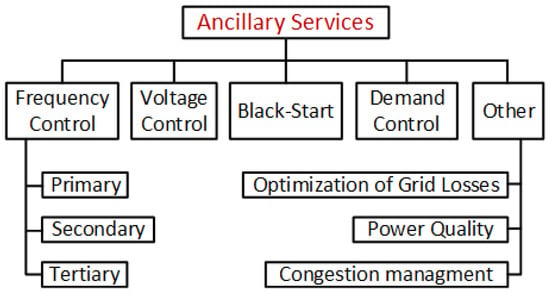
Figure 1.
Classification of ASs [34].
2.1.1. Frequency Control
TSOs oversee the regulation of frequency and are tasked with keeping an equilibrium between electricity production and consumption, which is crucial for the operation of the grid. This entails managing the active power produced and/or consumed to maintain the supply-demand equilibrium within the electrical power system’s 200 mHz bands. A designated portion of the active power reserve is allocated for precise frequency regulation. In instances where the system frequency falls below the specified threshold, frequency control backup mechanisms come into play. Frequency control is further categorized into three distinct classifications:
- Primary frequency control,
- Secondary frequency control,
- Tertiary frequency control.
In response to fluctuations in power system frequency, the initial action involves the activation of primary frequency controls. These controls, situated within the ±200 mHz band, actively address and sustain the frequency oscillations. Subsequently, secondary frequency control is engaged to restore the system frequency to its nominal value. Tertiary frequency control, in turn, is instrumental in maintaining a balance between production and consumption. Complementary to secondary control, tertiary frequency control reinforces secondary reserves and indirectly enhances the suitability of primary control reserves [32,35].
The system frequency resource response times, critical for the restoration efforts in European countries, are outlined as follows:
- The coordination of primary frequency control sources is required within a 30-s timeframe, ensuring stability for a minimum of 15 min.
- The activation of secondary frequency control reserves must occur within 30 s; the aim is to restore the frequency to its nominal level within 15 min.
- Tertiary frequency reserves are likewise anticipated to reach their maximum power output within the 15 min timeframe.
2.1.2. Voltage Control
Essential for maintaining the power system’s voltage within specified operating limits, voltage control is a mandatory service. The management of voltage in the electrical PS predominantly relies on reactive power control. To facilitate the transmission of reactive power demanded by the grid over extensive distances, strategic placement of reactive power generation resources and compensatory investments at suitable locations is imperative. The comprehensive regulation of voltage across the entire electrical PS is executed through a three-level hierarchical system:
- Primary voltage control;
- Secondary voltage control;
- Tertiary voltage control.
Primary voltage control relies on controllable devices like Automatic Voltage Regulators (AVR) and Static VAR compensators. This aspect of control involves automatic, localized adjustments made by these devices to bring the voltage within a specific feeder to its designated value. On the secondary side, a centralized automatic control system, often employed by regulatory agencies, manages local reactive power flows. Tertiary voltage control takes a manual approach to optimize reactive power flow across the grid. In this phase, equipment capable of generating and consuming reactive power is incorporated based on the relationship between voltage and reactive power.
The reactive power required for voltage control is locally supplied at the points of need. Reactive power from generators with dynamic sources, such as synchronous compensators (STATCOM), fulfills this requirement. Additionally, static sources like capacitor banks from static voltage controllers and Flexible Alternating Current Transmission Systems (FACTS) contribute to the provision of reactive power [18].
2.1.3. Black Start
Black start denotes the re-energization procedures implemented when the PS experiences a widespread or complete collapse due to disruptive events. Following the restoration of system stability, the re-energization process involves supplying customers with production facilities that can be activated independently without relying on an external energy source. This entails energizing the power system and commissioning additional production facilities. The restoration of the PS, signifying re-energization from a system collapse, unfolds through stages of frequency stabilization and re-synchronization [36].
2.1.4. Demand Control
The foundation of agreements between the SO and consumers lies in active participation in frequency control, achieved through a reduction in electricity demand. This involves alleviating some of the burdens placed on the grid by consumers.
Instant demand control is facilitated through low-frequency relays, with the relay’s setting value designed to automatically reduce demand by 10% to 20% if the system frequency drops to 49.0 Hz. This method is particularly suitable for the immediate demand control needs of industries like cement and iron–steel. Consumers can choose to either defer their demand for electrical energy to a later period or source the required energy from on-site generators or embedded production facilities behind the measurement point.
Looking ahead, and as the integration of renewable-based distributed resources increases in electrical power systems, we can see that demand control is poised to play a more significant role. Reports from the European Power Exchange (EPEX) highlight instances of negative prices for electrical energy units in Germany on specific dates in 2017, indicating the likelihood of excess production, especially during extended periods like nights, weekends, and holidays [37].
2.1.5. Other Types of ASs
The preceding sections have outlined the prevalent types of ASs adopted across various energy markets. However, various other AS categories find application in different global contexts, including:
Optimization of Grid Losses
Within electrical PSs, energy losses occur as a result of conductor and transformer winding heating. In countries such as Austria and Belgium, compensating for these losses is anticipated by the SO. Consequently, dedicated market mechanisms have been established to address and manage these associated losses.
Power Quality
The PS encounters various disturbances affecting power quality. Issues arise from deviations in the fundamental parameters of the power system, current, voltage, and frequency beyond acceptable limits, resulting in failures or breakdowns of consumer electronics. Enhancing power quality attributes within electrical PSs involves the provision of reactive power services, frequency control, voltage control, and adherence to limit values set by voltage and frequency standards, all falling under the domain of ASs [34].
Congestion Management
As RES become increasingly prevalent, the provision of ASs is expected to extend from the distribution level to grid-connected production in the long term. To implement ASs at the distribution level, projects have been initiated on a case-by-case basis due to the absence of a defined framework for coordinating between TSO and DSO. Establishing a legislative infrastructure that facilitates collaboration between TSO and DSO is crucial to leveraging the flexibility offered by generation facilities within the PS. This collaboration, fostering strong communication and cooperation between System SOs, becomes instrumental in overcoming congestion scenarios and maximizing the utilization of system flexibility [34].
2.2. AS Resources in Distribution Grid
The roles of transmission and distribution systems, along with the operators responsible for them, the TSO, and DSO, are undergoing constant evolution.
The integration of renewable production sources employing inverter systems, such as solar and wind, connected to the distribution grid, with storage systems, electric vehicles, smart meter systems, and other emerging technologies, which leads to change the architecture and operation of the PS.
The rise of renewable-based distributed production facilities integrated into the distribution network has brought attention to the application of ASs in the distribution grid. The growing prevalence of distributed generation facilities within the distribution grid has significant implications for the operation, control, protection, and reliability of existing PSs. Active and reactive power flows are no longer strictly unidirectional.
Due to factors like cloud transitions and sudden changes in wind speed, the intermittent nature of energy sources, such as wind and solar, introduces abrupt fluctuations in PSs. Moreover, the operation of distributed generation facilities with a consistent power factor, regardless of the grid’s operating conditions, leads to a voltage increase at the connection point. When there are variations in the demand for electrical energy, maintaining a constant active power supply to the distribution system results in elevated line losses and reverse power flows from the distribution system to the transmission.
To address these challenges, efforts are being made to reshape AS markets and facilitate the provision of ASs from both transmission and distribution system operators. Ongoing studies are focused on determining pre-qualification, procurement, activation, and settlement processes, as well as ensuring effective coordination between TSO and DSO [3,38,39].
2.2.1. Distributed Energy Resources
Despite the advantages of traditional electrical energy systems, the shift toward distributed production resources is on the rise for the following reasons:
- To address the growing demand for electrical energy, an increasing reliance on fossil fuels is required within conventional energy systems.
- The adoption of the “consume where you produce” concept (prosumer) is becoming imperative to meet the rising demand. This shift is prompted by issues such as existing systems lacking desired reliability and causing technical and economic losses during the transmission of produced energy to the consumption region.
- Many nations are opting for RES to reduce reliance on fossil fuels, which contribute to environmental pollution, in alignment with the Kyoto Protocol. The aim is to mitigate climate change and tackle global warming issues by decreasing greenhouse gas emissions.
RES, including wind, hydro, solar, biomass, geothermal, and cogeneration energy systems, are favored over conventional production systems due to the latter’s associated problems. It is anticipated that in the upcoming period, the prevalence of distributed generation plants, specifically those based on renewable sources like solar, river hydro, geothermal, and wind, will significantly increase.
Moreover, as technologies advance, there is an anticipation for the development of MG systems utilizing storage systems. Microgrids can play a crucial role in supplying rural areas, especially those with long feeders in distribution regions, by:
- Enhancing resistance to long-term interruptions (improving energy supply continuity).
- Offering benefits in terms of reducing distribution grid investment and operating costs within the region.
Additionally, storage systems, as well as solar inverters, solar power plants, and certain wind power plants, can provide reactive power support. The growing integration of renewable production sources into the grid has the potential to offer ASs to the grid. In contrast to synchronous generators and voltage regulators, inverters associated with distributed generation systems and rooftop solar systems could potentially provide various services, such as harmonic reduction, voltage regulation, flicker control, reactive power compensation, and active power filtering. Wind turbines and variable-speed generators possess the capability to contribute significantly to the grid.
2.2.2. Energy Storage Systems
ESSs play a crucial role in enhancing flexibility and supporting the integration of renewable energy within the energy system. They serve to balance both central and distributed electricity production, thereby contributing to the overall security of the energy supply. The impact of energy storage extends to complementing other aspects, including demand-side management, flexible production, and grid development. Furthermore, ESSs can actively participate in the decarbonization of various economic sectors, fostering the increased incorporation of variable renewable energy in transportation, buildings, and industries [32,36].
3. Modeling
The proposed model is used to optimally operate an MG, while considering operational costs, AS reserves, and resource allocation to minimize MG losses. AS constraints are driven by the utility target limits. The model can be used for the provision of ancillary services with different time resolutions. In comparison to other research papers covering this topic, the novelty of the model is in modeling power losses of the MG, as well as in modeling the AS request at the Point of Common Coupling (PCC) of MG to the distribution grid as a virtual load (VL). In other words, if a request for balancing of active power appears, as shown in Figure 2, where the MG has to increase its power exchange with the distribution grid, a VL is added to the node of PCC with the constraint to supply the VL using only MG assets (generating, discharging batteries or reducing MG controllable load). The VL has a load curve that corresponds to the balancing request.
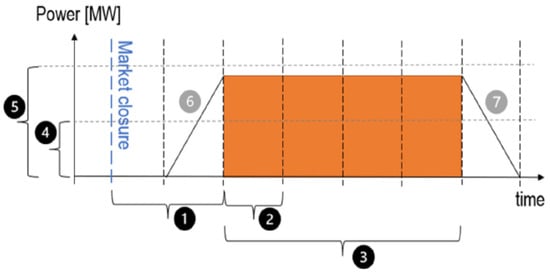
Figure 2.
Balancing requirements: (1) Time to delivery; (2) and (3) minimum and maximum time; (4) and (5) minimum and maximum power; (6) and (7) ramping and de-ramping rates [40].
The objective of the problem is to minimize MG operational costs considering MG power exchange with the utility grid:
It should be mentioned that the load cost function is defined for the controllable part of the load. The objective is subject to technical constraints, including MG power losses and AS requirements.
The power balance in Equation (3) ensures that the sum of the power generated from the DERs () and the power exchanged with the utility grid () matches to the load side (i.e., virtual load (, load (), power flows into the storage unit () and loses (). The power flows of ESSs can be positive (discharging), negative (charging), or zero. The power of the utility grid can be negative (export), positive (import), or zero. In Equations (4)–(7), the minimum and maximum constraints for the output power limits from the generators (), power load () limits, power charging limits, and power discharging limits respectively. Limits for ramp up and down rate in Equations (8)–(13), and represents the previous time step.
The dynamics of storage unit charging over time takes into account charging and discharging activities and adjusting the efficiency of the storage process. It ensures that the SoC is accurately updated based on the energy flow in the charging and discharging of the storage unit during each time step (Equation (14)), as well as the minimum and maximum limits (Equation (15)). Minimum charging and discharging time (Equations (16) and (17)): these limits ensure that storage units are charged and discharged for a sufficient duration to meet operational requirements or avoid damage to the unit from charging and discharging periods that are too short. In Equation (18), the minimum energy required when the load is energized is considered. The constraint that the VL is supplied only by MG assets is given in Equation (19). Finally, the voltage constraint and power flow constraint have to be respected at all times throughout the MG (Equations (20) and (21)).
4. Case Study
The proposed model is tested on Sub-network 1 of the CIGRE MV microgrid benchmark, proposed by [22], given in Figure 3. Neglecting the parameters of the transformer 110/20, defined as TR1 in Figure 3, node 1 becomes PCC between the external power grid and the MG. The grid parameters are given in the Appendix A of this paper (Table A3). The grid supplies households as well as industrial load. In addition, it utilizes solar and wind DG, CHP units, fuel cells, and battery storage, as per tables in Appendix A (Table A2). Daily household load, industrial load, as well as wind and solar profiles are given in Figure 4, while the power of each individual resource is defined in Appendix A (Table A1). For the sake of a more realistic approach, each individual load and generation is randomly varied within the range of ±10% from the typical curves, using a 5 min resolution.
The MG has 2 CHP units, which are also capable of providing ASs. Detailed information for these generators is given in Table 2. Nodes 5 and 10 utilize battery and fuel cells, with parameters defined in Table 3. For this case study, only battery storage is considered as fuel cell units, which are of much lower power and are connected in the same nodes as battery storage units. In addition, it is considered that industry load can be controllable to some extent in order to provide ASs, as defined in Table 4. Finally, the hourly market price of electricity for energy exchange between the grid and the microgrid is shown in Figure 5, while the price of delivered balancing energy is 50 EUR/MWh downwards and 250 EUR/MWh upwards, averaged from the ENTSO-E report [41]. These values of the balancing prices are not selected for any specific country but are average values of the prices from the ENTSO-E report.

Table 2.
Characteristics of CHP units.

Table 3.
Characteristics of battery storage.

Table 4.
Characteristics of adjustable industry load.
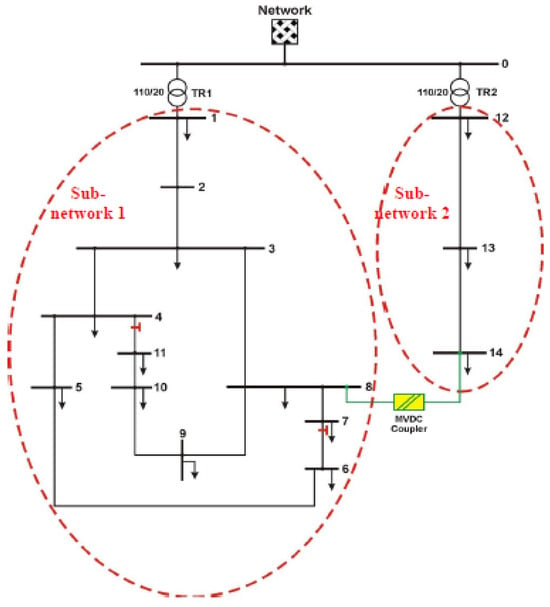
Figure 3.
CIGRE MV benchmark MG model [22].
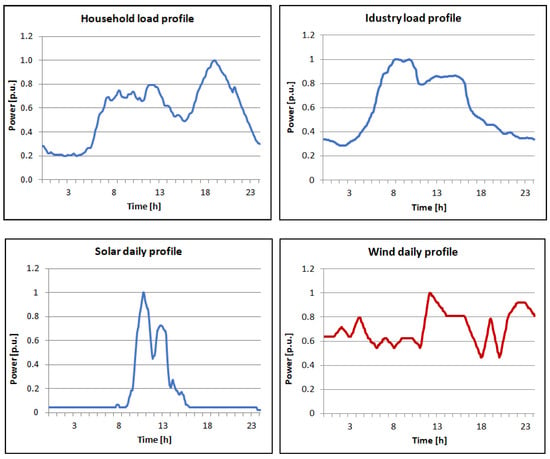
Figure 4.
Daily load and production curves [42].
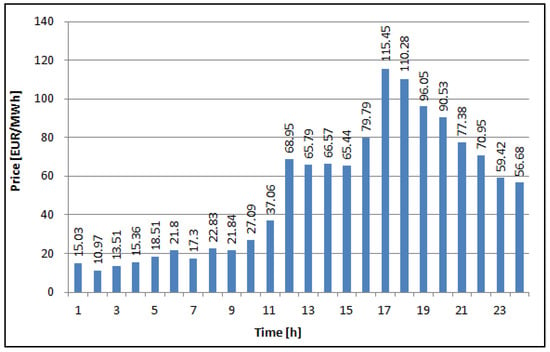
Figure 5.
Hourly market electricity price.
The proposed model from Chapter 3 is coded in MATLAB and optimized using Genetic Algorithm (GA) and penalization functions to address the constraints. GA is capable of obtaining the optimal solution in this case within less than 3 min, making it suitable for this type of power-balancing AS provision. Further improvement of GA performance is possible by using powerful real-time simulators that are compatible with MATLAB.
The base case simulation is performed just to show how all the microgrid’s resources operate under “normal” conditions. This provides a baseline understanding of the participation levels of wind, solar, batteries, and CHP in optimal, routine grid operations. The AS provision case is conducted in two scenarios: (a) Detailed grid modeling; (b) Single-bus modeling. The following is a comparative analysis of these two cases, which indicates and quantifyies the significance of detailed grid modeling in MG operation optimization.
4.1. The Base Case
As the base case, a study without ASs is considered, optimizing the operation of the MG considering only DG operating costs and electricity market price. In this case, the industry load is not controllable. After running the simulation, the results shown in Figure 6 are obtained for all distributed assets, with nodes indicated in the legend of the diagram. The MG operation is dominated by wind, battery, and CHP units, so to present the operation more clearly, per unit representation is given in Figure 7.
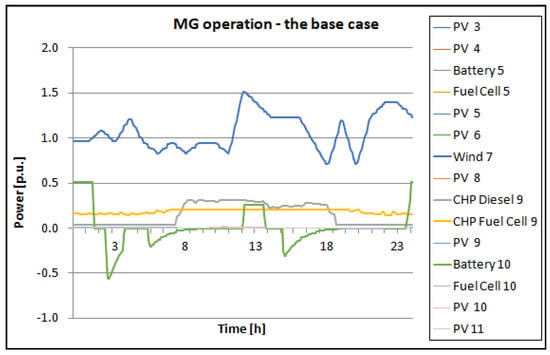
Figure 6.
The base case MG operation.
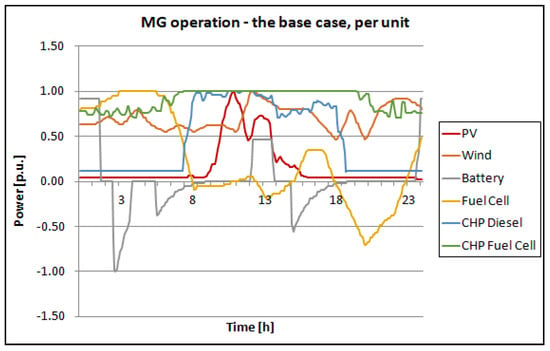
Figure 7.
The base case MG operation per unit.
4.2. The AS Provision Case
In the AS provision case, CHP units, battery storage, and industrial load control are considered as ancillary service assets, with the parameters previously defined in Table 2, Table 3 and Table 4. In addition, two different sub-cases are considered: (a) The case with grid modeling, where all voltage profiles and MG power losses are considered; (b) The case without grid modeling, where MG is considered to have all assets connected to a single bus. The latter case was usually the case study of previous research papers. The goal of this paper is to show the importance of grid modeling by comparing the results of sub-cases (a) and (b). The AS request is modeled by Virtual Load in the point of connection, as shown in Figure 8. It represents three requests for AS provision, with different amounts of power requested in both the upward and downward directions. After running the optimization procedure for the model represented in Chapter 2, using Genetic Algorithm (GA), the obtained results are shown in Figure 9 for sub-case (a) and in Figure 10 for sub-case (b), as well as in Table 5 for both cases.
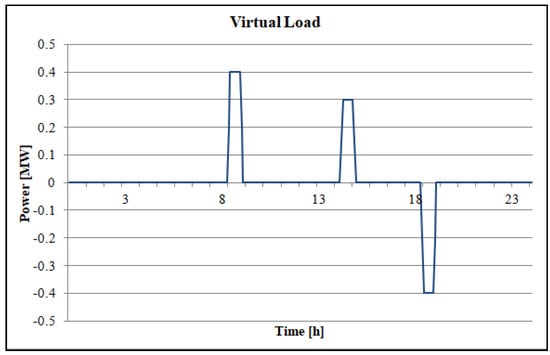
Figure 8.
Virtual load for AS representation.
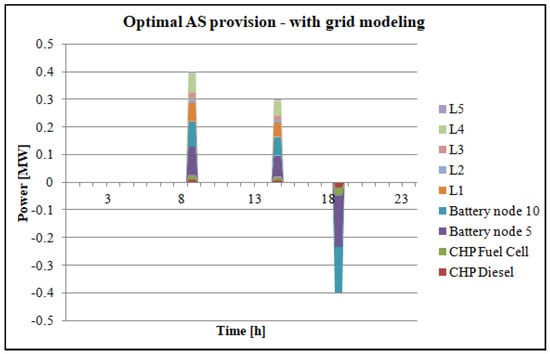
Figure 9.
Optimal AS provision with grid modeling (sub-case (a)).
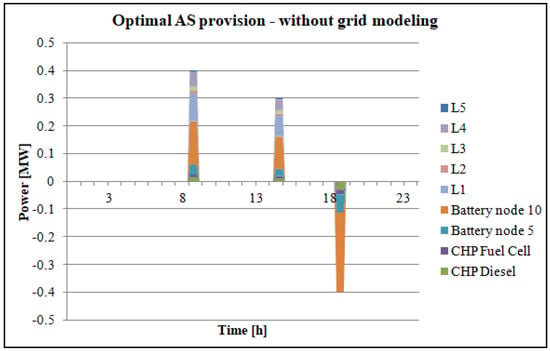
Figure 10.
Optimal AS provision without grid modeling (sub-case (b)).

Table 5.
Optimal AS provision.
To avoid confusion, it should be noted that in single-bus modeling (sub-case (b)), the names of the assets are kept the same, so “Battery node 10” and “Battery node 5” can be seen. These are only their names, while all the assets are connected to the same bus. Therefore, nodes 5 and 10 do not exist in this case. Additionally, L1–L5 in Figure 9 and Figure 10 refer to controllable loads, as defined in Table 4.
Fitness values are metrics proportional to the objective functions, a term specific to genetic algorithms. Fitness values indicate how good a solution is, with lower values being better in the context of our minimization problem, as defined by Equation (1). By comparing the fitness values of both solutions, with sub-case (a) having the fitness value of 178.37 and sub-case (b) having the fitness value of 178.8, it can be wrongly concluded that the case without modeling the grid is the same for MG operation. However, it must not be forgotten that this fitness value does not consider power losses that actually exist in real MG. For this reason, another load flow procedure is conducted using the solution of sub-case (b). After obtaining the load flow results, the fitness value is recalculated, and a value of 197.99 is obtained. This procedure of comparative analysis and fitness value recalculation is shown in Figure 11.
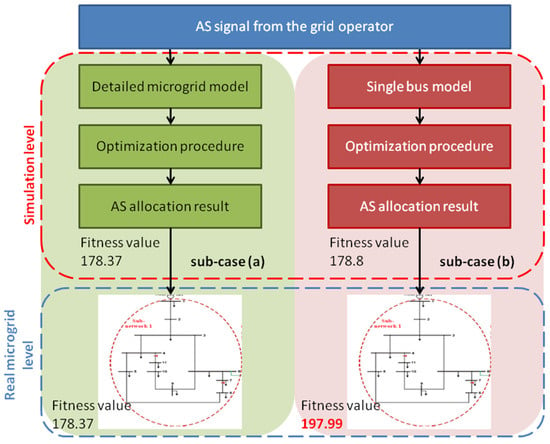
Figure 11.
The procedure of comparative analysis between sub-cases (a) and (b).
Finally, the obtained results can be used to evaluate the improvement of the objective function, which also indicates technical and economic improvement of MG operation. Technically, the detailed grid modeling in sub-case (a) enhances accuracy by accounting for power losses and ensuring voltage profiles stay within safe limits. Economically, this approach leads to a more precise assessment of operational costs, reducing unnecessary energy expenditure and optimizing asset use. To evaluate the Improvement Factor (IF), the fitness values of both sub-cases (Fitnessa and Fitnessb) are compared as per Equation (22). It must be noted that fitness values are compared at the real microgrid level from Figure 11.
5. Conclusions
The reliability of PS networks with enough operating reserves is critical to the stability of world economies. PSs are susceptible to problems like load shedding and total blackouts when these reserves are inadequate. A large proportion of RES makes maintaining grid stability even more difficult. However, there is a lot of promise for RES as AS sources when they are connected by power electronic devices.
AS provisions from RES can be further enhanced via MGs based on renewable energy, which can aggregate resources from several RES and offer significant potential for load control. The issue of how to distribute ancillary service signals to all resources as efficiently as possible is brought up by the diversity of AS resources.
This paper presents a comprehensive approach to optimizing AS provisions in renewable energy-based MGs. The proposed model integrates a detailed MG model, thus including voltage profiles and power losses and highlighting their critical role in accurate AS allocation. Through a detailed case study using the CIGRE MV MG benchmark, the paper illustrates how these factors influence the operational efficiency of realistic MGs. The paper underscores that simple MG models using a single-bus representation fail to capture the true behavior of MG operations, leading to suboptimal resource utilization.
The case study incorporates wind and solar generation units, as well as CHP units, battery storage, and industrial load control as AS assets. Two sub-cases are analyzed: (1) One with grid modeling that accounts for voltage profiles and power losses, using the CIGRE MV benchmark model; (2) One without grid modeling, treating the MG as a single-bus system. The findings reveal that ignoring grid modeling leads to a misrepresentation of the MG’s capabilities. Specifically, the fitness value, which initially seemed comparable between the two sub-cases, diverged significantly after accounting for actual power losses and voltage profiles. The results indicate that detailed modeling of microgrids can impact the results by 11%. Even though not explicitly quantified in this paper, considering that the objective function is a financial indicator of MG operation, the results consequently suggest that a well-modeled MG also maximizes financial returns from AS participation, particularly in markets with variable electricity prices.
Future work should focus on refining these models further, exploring their applicability in diverse MG configurations, and integrating additional AS assets to enhance the robustness and scalability of the proposed approach.
Author Contributions
Conceptualization, A.A. and G.D.; methodology, A.A.; software, A.A.; validation, A.A. and G.D.; formal analysis, G.D.; investigation, A.A.; resources, A.A.; data curation, A.A.; writing—original draft preparation, A.A.; writing—review and editing, G.D.; visualization, A.A.; supervision, G.D. All authors have read and agreed to the published version of the manuscript.
Funding
This research received no external funding.
Data Availability Statement
The raw data supporting the conclusions of this article will be made available by the authors on request.
Conflicts of Interest
The authors declare no conflict of interest.
Nomenclature
| Operational costs of MG | |
| Power of generation units in MG | |
| Power of load in MG | |
| Power of storage in MG | |
| Cost functions of individual generation, load, and storage assets, respectively | |
| Price of electricity exchange with the utility grid | |
| Power exchange with the utility grid | |
| Price of AS | |
| Change of power exchange with the utility grid due to AS requirement | |
| Total generation power of the MG | |
| Total storage discharging power | |
| Total demand of the MG | |
| Total storage charging power | |
| Total losses of the MG | |
| SOCsk | State of charge of battery storage k |
| and | Battery charging and discharging time |
| Vn | Voltage of node n |
Appendix A

Table A1.
Parameters of loads at each node [22].
Table A1.
Parameters of loads at each node [22].
| Node | Load Type | PMAX [MW] | QMAX [Mvar] |
|---|---|---|---|
| 1 | Household | 13.758 | 8.527 |
| 1 | Industry | 4.984 | 1.012 |
| 3 | Household | 0.253 | 0.157 |
| 3 | Industry | 0.239 | 0.049 |
| 4 | Household | 0.396 | 0.246 |
| 5 | Household | 0.665 | 0.412 |
| 6 | Household | 0.504 | 0.313 |
| 7 | Industry | 0.077 | 0.016 |
| 8 | Household | 0.539 | 0.334 |
| 9 | Industry | 0.572 | 0.116 |
| 10 | Industry | 0.068 | 0.014 |
| 10 | Household | 0.438 | 0.271 |
| 11 | Household | 0.304 | 0.188 |
| 12 | Household | 13.75 | 8.527 |
| 12 | Industry | 4.984 | 1.012 |
| 13 | Industry | 0.032 | 0.006 |
| 14 | Industry | 0.329 | 0.067 |
| 14 | Household | 0.190 | 0.118 |

Table A2.
Parameters of DG units [22].
Table A2.
Parameters of DG units [22].
| Node | DG Type | PMAX [kW] |
|---|---|---|
| 3 | Photovoltaic | 20 |
| 4 | Photovoltaic | 20 |
| 5 | Photovoltaic | 30 |
| 5 | Battery | 600 |
| 5 | Fuel cell | 33 |
| 6 | Photovoltaic | 30 |
| 7 | Wind turbine | 1500 |
| 8 | Photovoltaic | 30 |
| 9 | Photovoltaic | 30 |
| 9 | CHP diesel | 310 |
| 9 | CHP fuel cell | 212 |
| 10 | Photovoltaic | 40 |
| 10 | Battery | 600 |
| 10 | Fuel cell | 14 |
| 11 | Photovoltaic | 10 |

Table A3.
CIGRE MV benchmark model parameters [22].
Table A3.
CIGRE MV benchmark model parameters [22].
| Node From | Node To | R’ [Ω/km] | X’ [Ω/km] | C’ [nF/km] | L [km] | |
|---|---|---|---|---|---|---|
| Sub-network (SN 1) | 0 | 1 | --- | --- | --- | --- |
| 1 | 2 | 0.579 | 0.367 | 158.88 | 2.82 | |
| 2 | 3 | 0.164 | 0.113 | 6608 | 4.42 | |
| 3 | 4 | 0.262 | 0.121 | 6480 | 0.61 | |
| 4 | 5 | 0.354 | 0.129 | 4560 | 0.56 | |
| 5 | 6 | 0.336 | 0.126 | 5488 | 1.54 | |
| 6 | 7 | 0.256 | 0.13 | 3760 | 0.24 | |
| 7 | 8 | 0.294 | 0.123 | 5600 | 0.67 | |
| 8 | 9 | 0.339 | 0.13 | 4368 | 0.32 | |
| 9 | 10 | 0.399 | 0.133 | 4832 | 0.77 | |
| 10 | 11 | 0.367 | 0.133 | 4560 | 0.33 | |
| 11 | 4 | 0.423 | 0.134 | 4960 | 0.49 | |
| 3 | 8 | 0.172 | 0.115 | 6576 | 1.3 | |
| SN 2 | 0 | 12 | --- | --- | --- | --- |
| 12 | 13 | 0.337 | 0.358 | 162.88 | 4.89 | |
| 13 | 14 | 0.202 | 0.122 | 4784 | 2.99 |
References
- Wegkamp, C.; Hadlak, M.; Wagner, H.; Kohlhepp, J.; Engel, B. Optimized provision of local ancillary services with sensitivity factors using prosumer flexibility. In Proceedings of the 27th International Conference on Electricity Distribution (CIRED 2023), Rome, Italy, 12–15 June 2023; pp. 317–321. [Google Scholar]
- Ganesh, K.B.; Vijay, R.; Mathuria, P. Ancillary Services from DERs for Transmission and Distribution System Operators. In Proceedings of the 2022 22nd National Power Systems Conference (NPSC), New Delhi, India, 17–19 December 2022; pp. 482–487. [Google Scholar]
- Oureilidis, K.; Malamaki, K.-N.; Gallos, K.; Tsitsimelis, A.; Dikaiakos, C.; Gkavanoudis, S.; Cvetkovic, M.; Mauricio, J.M.; Maza Ortega, J.M.; Ramos, J.L.M. Ancillary services market design in distribution networks: Review and identification of barriers. Energies 2020, 13, 917. [Google Scholar] [CrossRef]
- Migliavacca, G. TSO-DSO Interactions and Ancillary Services in Electricity Transmission and Distribution Networks: Modeling, Analysis and Case-Studies; Springer: Berlin/Heidelberg, Germany, 2019. [Google Scholar]
- Koroglu, H.; Safak, M.E.; Bayer, M.; Altun, B.; Altun, H.O. Providing Ancillary Services from Distributed Energy Resources to Electricity Distribution Grid. Current Studies in Basic Sciences, Engineering and Technology. p. 129. Available online: https://www.researchgate.net/profile/Hakan-Oecal/publication/371799236_Use_of_IoT_and_Wearable_Technology_Design_Fundamentals_in_Healthcare_Industry/links/649590ca8de7ed28ba4cd9f0/Use-of-IoT-and-Wearable-Technology-Design-Fundamentals-in-Healthcare-Industry.pdf#page=142 (accessed on 27 August 2024).
- Silva, R.; Alves, E.; Ferreira, R.; Villar, J.; Gouveia, C. Characterization of TSO and DSO grid system services and TSO-DSO basic coordination mechanisms in the current decarbonization context. Energies 2021, 14, 4451. [Google Scholar] [CrossRef]
- Nelson, J.R.; Johnson, N.G. Model predictive control of microgrids for real-time ancillary service market participation. Appl. Energy 2020, 269, 114963. [Google Scholar] [CrossRef]
- Marneris, I.; Ntomaris, A.; Biskas, P.; Baslis, C.; Chatzigiannis, D.; Demoulias, C.; Oureilidis, K.; Bakirtzis, A. Optimal Participation of RES aggregators in energy and ancillary services markets. IEEE Trans. Ind. Appl. 2022, 59, 232–243. [Google Scholar] [CrossRef]
- Hadush, S.Y.; Meeus, L. DSO-TSO cooperation issues and solutions for distribution grid congestion management. Energy Policy 2018, 120, 610–621. [Google Scholar] [CrossRef]
- Alizadeh, M.I.; Usman, M.; Capitanescu, F.; Madureira, A.G. A Novel TSO-DSO Ancillary Service Procurement Coordination Approach for Congestion Management. In Proceedings of the 2022 IEEE Power & Energy Society General Meeting (PESGM), Denver, CO, USA, 17–21 July 2022; pp. 1–5. [Google Scholar]
- Sprooten, J.; Gunst, T.; Mestdag, C.; Bronckart, O. Power system restoration with high penetration level of renewable generation—New challenges and strategies. In Proceedings of the 2014 Saudi Arabia Smart Grid Conference (SASG), Jeddah, Saudi Arabia, 14–17 December 2014; pp. 1–8. [Google Scholar]
- Ahmed, M.; Aziz, T. An approach of incorporating harmonic mitigation units in an industrial distribution network with renewable penetration. Energy Rep. 2021, 7, 6273–6291. [Google Scholar] [CrossRef]
- Demoulias, C.S.; Malamaki, K.-N.D.; Gkavanoudis, S.; Mauricio, J.M.; Kryonidis, G.C.; Oureilidis, K.O.; Kontis, E.O.; Martinez Ramos, J.L. Ancillary services offered by distributed renewable energy sources at the distribution grid level: An attempt at proper definition and quantification. Appl. Sci. 2020, 10, 7106. [Google Scholar] [CrossRef]
- Lin, Y.; Zhang, X.; Yin, S.; Wang, J.; Shi, D. Real-time economic dispatch for integrated energy microgrid considering ancillary services. In Proceedings of the 2020 IEEE Power & Energy Society General Meeting (PESGM), Montreal, QC, Canada, 2–6 August 2020; pp. 1–5. [Google Scholar]
- Jain, R.; Mahajan, V. Energy Management of Multi-Microgrids in Joint Energy and Ancillary Service Market Considering Uncertainties of Renewables. J. Renew. Energy Environ. 2023, 10, 95–107. [Google Scholar]
- Ding, Y.; Tan, Q.; Shan, Z.; Han, J.; Zhang, Y. A two-stage dispatching optimization strategy for hybrid renewable energy system with low-carbon and sustainability in ancillary service market. Renew. Energy 2023, 207, 647–659. [Google Scholar] [CrossRef]
- Villanueva-Rosario, J.A.; Santos-García, F.; Aybar-Mejía, M.E.; Mendoza-Araya, P.; Molina-García, A. Coordinated ancillary services, market participation and communication of multi-microgrids: A review. Appl. Energy 2022, 308, 118332. [Google Scholar] [CrossRef]
- Kumar, G.B.; Palanisamy, K. A review of energy storage participation for ancillary services in a microgrid environment. Inventions 2020, 5, 63. [Google Scholar] [CrossRef]
- Gu, J.-C.; Lin, J.-L.; Yang, M.-T. Automatic Frequency Control Ancillary Service and Virtual Inertia from BESS in Microgrid. In Proceedings of the 2023 IEEE Industry Applications Society Annual Meeting (IAS), Nashville, TN, USA, 29 October–2 November 2023; pp. 1–6. [Google Scholar]
- Agupugo, C.P.; Kehinde, H.M.; Manuel, H.N.N. Optimization of microgrid operations using renewable energy sources. Eng. Sci. Technol. J. 2024, 5, 2379–2401. [Google Scholar] [CrossRef]
- Fernández-Muñoz, D.; Pérez-Díaz, J.I.; Guisández, I.; Chazarra, M.; Fernández-Espina, A. Fast frequency control ancillary services: An international review. Renew. Sustain. Energy Rev. 2020, 120, 109662. [Google Scholar] [CrossRef]
- Rudion, K.; Orths, A.; Styczynski, Z.A.; Strunz, K. Design of benchmark of medium voltage distribution network for investigation of DG integration. In Proceedings of the 2006 IEEE Power Engineering Society General Meeting, Montreal, QC, Canada, 18–22 June 2006; p. 6. [Google Scholar]
- Majzoobi, A.; Khodaei, A. Application of microgrids in providing ancillary services to the utility grid. Energy 2017, 123, 555–563. [Google Scholar] [CrossRef]
- Zhang, M.; Li, W.; Yu, S.S.; Wang, H.; Ba, Y. Optimal day-ahead large-scale battery dispatch model for multi-regulation participation considering full timescale uncertainties. Renew. Sustain. Energy Rev. 2024, 189, 113963. [Google Scholar] [CrossRef]
- Zhang, M.; Li, W.; Yu, S.S.; Wen, K.; Muyeen, S. Day-ahead optimization dispatch strategy for large-scale battery energy storage considering multiple regulation and prediction failures. Energy 2023, 270, 126945. [Google Scholar] [CrossRef]
- Kurundkar, K.M.; Vaidya, G.A. Stochastic Security-Constrained Economic Dispatch of Load-Following and Contingency Reserves Ancillary Service Using a Grid-Connected Microgrid during Uncertainty. Energies 2023, 16, 2607. [Google Scholar] [CrossRef]
- Wang, Y.; Li, G.; Zhou, B.; Ma, H.; Li, Z. Optimal Dispatch Strategy for Virtual Power Plants with Adjustable Capacity Assessment of High-Energy-Consuming Industrial Loads Participating in Ancillary Service Markets. Sustainability 2023, 15, 10479. [Google Scholar] [CrossRef]
- Lai, X.; Xie, Z.; Xu, D.; Ying, S.; Zeng, Y.; Jiang, C.; Wang, F.; Wen, F.; Palu, I. Operation Optimization of an Integrated Energy Service Provider with Ancillary Service Provision. Energies 2022, 15, 4376. [Google Scholar] [CrossRef]
- Alzahrani, A.; Sajjad, K.; Hafeez, G.; Murawwat, S.; Khan, S.; Khan, F.A. Real-time energy optimization and scheduling of buildings integrated with renewable microgrid. Appl. Energy 2023, 335, 120640. [Google Scholar] [CrossRef]
- Zhao, J.; He, Y.; Fang, Y.; Weng, Y.; Ma, W.; Xiao, S.; Liang, Y. Multi-source optimal dispatch considering ancillary service cost of pumped storage power station based on cooperative game. Energy Rep. 2021, 7, 173–186. [Google Scholar] [CrossRef]
- Brusco, G.; Menniti, D.; Pinnarelli, A.; Sorrentino, N. Renewable Energy Community with distributed storage optimization to provide energy sharing and additional ancillary services. Sustain. Energy Grids Netw. 2023, 36, 101173. [Google Scholar] [CrossRef]
- Prakash, K.; Ali, M.; Siddique, M.N.I.; Chand, A.A.; Kumar, N.M.; Dong, D.; Pota, H.R. A review of battery energy storage systems for ancillary services in distribution grids: Current status, challenges and future directions. Front. Energy Res. 2022, 10, 971704. [Google Scholar] [CrossRef]
- van der Welle, A.; Morales-España, G.; Sijm, J.; Serna, R.H.; Kochems, J.; Couto, A.; Algarvio, H.; Kiviluoma, J.; Vries, L.D.; Estanqueiro, A. Design of Ancillary Service Markets and Products: Challenges and Recommendations for EU Renewable Power Systems: Deliverable D3. 3. 2021. Available online: https://repositorio.lneg.pt/handle/10400.9/3710 (accessed on 27 August 2024).
- Kocer, S. Current Studies in Basic Sciences, Engineering and Technology; Necmettin Erbakan University: Konya, Turkey, 2022. [Google Scholar]
- Banshwar, A.; Sharma, N.K.; Sood, Y.R.; Shrivastava, R. Renewable energy sources as a new participant in ancillary service markets. Energy Strategy Rev. 2017, 18, 106–120. [Google Scholar] [CrossRef]
- Zhao, Y.; Zhang, T.; Sun, L.; Zhao, X.; Tong, L.; Wang, L.; Ding, J.; Ding, Y. Energy storage for black start services: A review. Int. J. Miner. Metall. Mater. 2022, 29, 691–704. [Google Scholar] [CrossRef]
- Ribó-Pérez, D.; Larrosa-López, L.; Pecondón-Tricas, D.; Alcázar-Ortega, M. A critical review of demand response products as resource for ancillary services: International experience and policy recommendations. Energies 2021, 14, 846. [Google Scholar] [CrossRef]
- Gulotta, F.; Daccò, E.; Bosisio, A.; Falabretti, D. Opening of ancillary service markets to distributed energy resources: A review. Energies 2023, 16, 2814. [Google Scholar] [CrossRef]
- Bahramara, S.; Sheikhahmadi, P.; Mazza, A.; Chicco, G. Day-ahead self-scheduling from risk-averse microgrid operators to provide reserves and flexible ramping ancillary services. Int. J. Electr. Power Energy Syst. 2022, 142, 108381. [Google Scholar] [CrossRef]
- Rancilio, G.; Rossi, A.; Falabretti, D.; Galliani, A.; Merlo, M. Ancillary services markets in europe: Evolution and regulatory trade-offs. Renew. Sustain. Energy Rev. 2022, 154, 111850. [Google Scholar] [CrossRef]
- ENTSO-E Balancing Report 2024. ENTSO-E AISBL. Available online: https://www.entsoe.eu/news/2024/06/28/entso-e-publishes-the-market-report-2024-the-balancing-report-2024-and-the-electricity-balancing-eb-cost-report-2024/ (accessed on 30 June 2024).
- GitHub. CarlosGS20/Typical-load-profile-MV-CIGRE-benchmark. Available online: https://github.com/CarlosGS20/Typical-load-profile-MV-CIGRE-benchmark (accessed on 28 June 2024).
Disclaimer/Publisher’s Note: The statements, opinions and data contained in all publications are solely those of the individual author(s) and contributor(s) and not of MDPI and/or the editor(s). MDPI and/or the editor(s) disclaim responsibility for any injury to people or property resulting from any ideas, methods, instructions or products referred to in the content. |
© 2024 by the authors. Licensee MDPI, Basel, Switzerland. This article is an open access article distributed under the terms and conditions of the Creative Commons Attribution (CC BY) license (https://creativecommons.org/licenses/by/4.0/).