Abstract
In recent years, the role of the atmosphere in the formation of the chemical composition of water in Lake Baikal and its tributaries has been increasing. In this regard, the study of equivalent black carbon (eBC) in the air above the lake and its coast has an important practical application. This paper presents the results of the mass concentration of eBC and submicron aerosol in the air above the water area of Lake Baikal, which were obtained during expeditions onboard research vessels in the summer of 2019 and 2023. We analyzed the data from the coastal monitoring station Listvyanka. To measure eBC, an MDA-02 aethalometer was used in the water area of the lake, and a BAC-10 aethalometer at the Listvyanka station. The background level of the eBC concentration in the air at different areas of the lake ranged between 0.15 and 0.3 µg m−3. The results of the two expeditions revealed the influence of the coastal settlements and the air mass transport along the valleys of the lake’s large tributaries on the five- to twentyfold growth of the eBC concentration in the near-water atmosphere. In the diurnal dynamics of eBC near settlements, we recorded high values in the evening and at night. In background areas, the diurnal dynamics were poorly manifested. In the summer of 2019, there were smoke plumes in the water area of Lake Baikal from distant wildfires and a local fire site on the east coast of the lake. The eBC concentration increased to 5–6 µg m−3, which was 10 to 40 times higher than the background. The long-range transport of plumes from coal-fired thermal power plants in large cities of the region made the major contribution to the eBC concentration at «Listvyanka» in winter, which data on aerosol, gas impurities, and meteorological parameters confirmed.
1. Introduction
Intensive economic growth in Eastern Siberia requires constant environmental monitoring and protection. There are both high-capacity industrial centers and unique natural objects, such as Lake Baikal, large rivers, and extensive forests. The Baikal region is located in the central part of Eastern Siberia and has direct access to the Mongolian borders. Its area of 315 thou km2 covers the watershed basin of Lake Baikal and includes three subjects of the Russian Federation (Irkutsk Region, Trans-Baikal Territory, and Republic of Buryatia). The total amount of pollutants entering the atmosphere of the Baikal region consists of about 100 items. According to Maysyuk, the main release of pollutants into the atmosphere of the Baikal region comes from thermal power plants burning solid organic fuels (coal). Sulfur dioxide, nitrogen oxides, carbon monoxide, solid particles, and black carbon predominate in the emissions of these facilities [1]. Enterprises of the fuel and energy industry, chemistry and petrochemistry, metallurgy, woodworking, and pulp and paper manufacturing play an important role in the industrial structure of the Irkutsk Region, which is the most developed in the Baikal region [2].
Lake Baikal is the most important strategical resource of the Baikal region. It is the world’s deepest (1642 m) and oldest (~25 million years) lake and the largest repository of the world freshwater reserves (20%), the ecosystem of which concentrates about 70% of endemics. In 1996, Lake Baikal was included on the UNESCO World Heritage List. Currently, the economic activities of the Baikal region, which are carried out within the watershed of Lake Baikal, have a significant impact on its ecological state.
Research concerning the physical characteristics of the chemical composition of air in the Baikal region and above the water area of Lake Baikal, which began at the end of the 20th century, mainly confirmed the background parameters of the continental atmospheric aerosol over this area. Forests, the largest source of natural aerosols responsible for the stable composition of air, cover 70% of the area in the Baikal region [3].
In recent decades, the composition of air, precipitation, and ice, as well as surface water temperature in Lake Baikal, have been changing in the Baikal region due to climate change. In this area, the climate warming trend, with the annual air temperature trend of +1.3 °C, is twice the global temperature trend of +0.6 °C over 100 years. Over 20 years, the surface water in the lake has warmed by 2 °C. The lake also showed physical and biological changes associated with warming and eutrophication [4,5,6,7,8].
Man-made emissions from industrial centers of the Baikal region also influence the composition of aerosol, precipitation, and other natural environments in some areas of the lake’s watershed basin. For example, the transport of sulfur and nitrogen oxides over distances of <70–100 km from large coal-fired power plants in the Irkutsk Region has a significant impact on the composition of precipitation and, hence, acidification of river waters in the coastal areas of the southern basin of Lake Baikal [9].
Wildfires are one of the major sources of climate-sensitive substances released into the atmosphere [10,11,12]. In Russia, Siberia particularly suffers from wildfires where the climate warming trend is more widespread. From 2017 to 2022, the total area of wildfires amounted to 45.2 mln ha. Large-scale wildfires between 2017 and 2022 covered from 70 to 90% of Siberia and the Far East [13,14]. Overall, the total carbon emissions resulted from wildfires are estimated for the past decades at 180–200 TgC yr [15] In recent years, the environmental impact of wildfires in the Baikal region has also increased [16,17].
Combustion is regarded as an important source of radiatively and chemically active aerosols containing both black carbon (BC) and organic carbon that directly or indirectly interact with the Earth’s radiation energy balance and cloudiness, subsequently influencing regional and global climate [18,19]. BC is directly released into the air in the form of small particles with a radius of >2.5 µm. This is one of the short-lived air pollutants (days or weeks), but, due to small particle size, it can be transported over long distances [20]. BC emissions create serious problems for the environment and human health. Moreover, due to the strong light radiation absorption, it is one of the global warming factors [21,22]. BC varies widely from background concentrations in the Arctic regions [23,24,25] to extremely high values in large cities around the world [26,27,28,29].
The first studies to measure the concentration of equivalent black carbon (eBC) were carried out at Lake Baikal in 2018 using a portable three-length device, “Portaethalometer A1” [30]. The highest eBC was observed near large coastal settlements, for removals with air masses along the valleys of large tributaries of the lake, in zones of intense navigation, and during wildfires.
In this paper, we present the results on the spatial and temporal distribution of eBC and its sources in the air above the water area of Lake Baikal during the most fire-hazardous summer seasons of 2019 and 2023 as well as its temporal dynamics at the international coastal station for atmosphere monitoring «Listvyanka» located on the southwest coast of Lake Baikal.
2. Methods
2.1. Equipment and Expedition Route for Analyzing Black Carbon in the Air above Lake Baikal
Optical methods currently determine the concentrations of eBC particles at the permanent stations and in the water areas of seas and oceans [31,32]. Most models of aethalometers (AAE31 and AAE33, Magee Scientific, Berkeley, CA, USA) measure light absorption at seven wavelengths, from 370 to 950 nm in the visible range. Detection limit (1 h): <0.005 µg m−3; range: <0.01 to >100 µg m−3; resolution: 0.001 µg m−3 or 1 ng m−3. Light-absorbing carbonaceous aerosols (LACs) with a wavelength of 880 nm are designated as eBC.
An MDA-02 aethalometer, an analogue of that developed by Hansen et al. [33], is used at the V.E. Zuev Institute of Atmospheric Optics Siberian Branch of the Russian Academy of Science (IAO SB RAS) in the study of eBC on ships in the Arctic basin, Siberian and Baikal regions. The operation of the device is based on the continuous measurements via aethalometric filter method for diffuse light attenuation by a layer of aerosol particles during their deposition onto the filter from the pumped air. The air intake rate in the device was 2 L min−1; hose length was 2.5 m with an internal diameter of 8 mm. The concentration limit of the MDA-02 photometer is ~10 ng m−3 when pumping 30 L of air through the device. This measures the mass concentration of an absorbent substance (eBC, MeBC µg m−3), in submicron atmospheric aerosol, which is equivalent to the BC concentration in the air, eBC (µg/m3). Absolute calibration of the device is carried out in the laboratory using a soot generator and comparison of data from synchronous optical and gravimetric measurements [34,35]. Simultaneous intercalibration measurements of the eBC mass concentration in the atmospheric aerosol are periodically conducted with a MAAP-5012 photometer (Thermoscientific Co., Franklin, TN, USA).
In the summer of 2019 and 2023, we carried out comprehensive experiments to study the air composition above Lake Baikal using remote sensing and local monitoring tools that were installed onboard the research vessels (RV) “Akademik V.A. Koptyug” (2019) and “G.Yu. Vereshchagin” (2023) owned by Limnological Institute Siberian Branch of the Russian Academy of Science (LIN SB RAS) (Figure 1). Expeditions onboard the RV were carried out in the form of online recording of eBC, gas impurities, aerosol particles of different size fractions, and meteorological conditions. Automatic chemiluminescent gas analyzers of sulfur dioxide, nitrogen oxides, and ground-level ozone (OPTEC LLC, St. Petersburg, Russia), a DAS2702M diffusion aerosol spectrometer (AeroNanoTech, Moscow, Russia), and a DUSTTAK 8533 spectrometer (TSI Incorporated, Shoreview, MN, USA) to determine number concentration and mass concentration of aerosol particles, as well as an MDA-02 aethalometer to identify eBC, were installed on the upper deck of the RVs. Sampling with an MDA-02 aethalometer was carried out within 24 h in an automatic mode for 10 min: once every half hour in 2019 and once every 15 min in 2023. The values averaged over the sampling period were entered into the computer. Taking into account the weather conditions, measurements influenced by the ship exhaust pipe were excluded from the general dataset. The 2019 measurements were mainly conducted under anticyclonic weather conditions. Aerosol fields were probed with a LOZA-A2 aerosol Raman lidar [36].
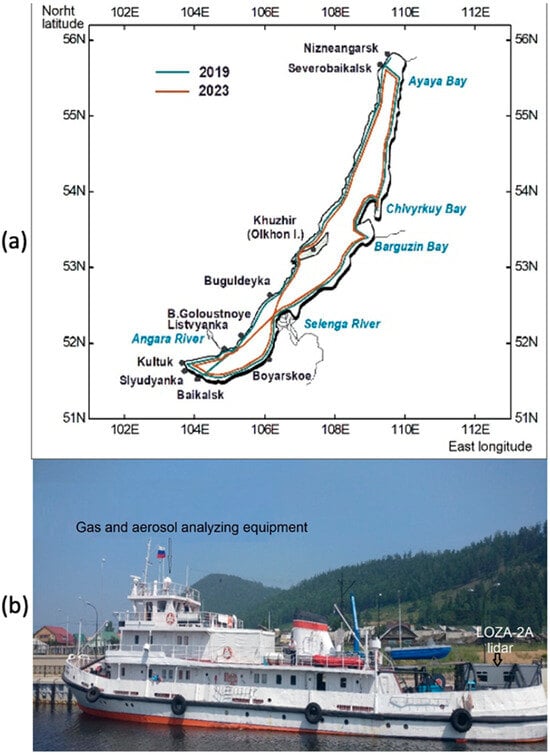
Figure 1.
Routes of comprehensive scientific expeditions in the water area of Lake Baikal, 2019 and 2023 (a); RV “Akademik V.A. Koptyug” and location of measuring equipment on the upper deck, 2019 (b).
The route of the RV began and ended at its home port in the Listvyanka settlement (Listvennichny Bay, southern basin of Lake Baikal) and passed through longitudinal sections along the coastline of the entire perimeter of Lake Baikal, with periodical cross-sections, as well as with some temporary stops at pre-designated observation sites. The total length of the route was ~1700 km. During the first two days of the expedition, measurements were carried out in the southern basin, along the coastline of its east and west coasts, at a distance of 0.5 to 3.0 km from the shore, and in the central part. The west and east coasts in this area include large settlements, such as Listvyanka, Kultuk, Slyudyanka, Baikalsk, and Babushkin, and there are major highways and railways connecting the European part of Russia with Siberia and the Far East. The RV moved from the southern basin to the central basin towards the estuary of the Selenga River, the lake’s largest tributary. Thereafter, after crossing the section through the lake from the east coast to the west coast, the route passed along the west coast from the central basin to the northern basin, towards its northernmost extremity in the towns of Nizhneangarsk and Severobaikalsk. Then, the RV moved from the west coast to the east coast towards Ayaya Bay, which hosts the national park and is one of the background sites of the lake. After passing the northern part of the lake, the RV moved along the east coast towards the central basin, entering the largest bays (Chivyrkuy and Barguzin), and finally returned to the southern basin (Figure 1).
An MDA-02 aethalometer was used to study eBC in the air above Lake Baikal in 2019 and 2023. Sampling was carried out for 24 h in an automatic mode for 10 min: once every half hour in 2019 and once every 15 min in 2023. The values averaged over the sampling period were entered into the computer. Taking into account the weather conditions, measurements influenced by the RV (ship exhaust pipe) were excluded from the general dataset. The 2019 measurements were primarily conducted under anticyclonic weather conditions.
Data from space observation tools (MODIS, NOAA, and CALIPSO), the Hybrid Single-Particle Lagrangian Integrated Trajectory (HYSPLIT) and Navy Aerosol Analysis and Prediction System (NAAPS) models, meteorological parameters of the Ust-Barguzin station, and the Arctic and Antarctic Research Institute (AARI) charts of synoptic situation above the Northern Hemisphere (http://www.aari.ru, accessed on 6 June 2024) were taken into account during the route expeditions at Lake Baikal for an objective and complete analysis of the transport of air pollutants to Lake Baikal.
2.2. Listvyanka Monitoring Station
A rural station for atmospheric monitoring «Listvyanka» (51.8467 N, 104.8930 E, and 670 m a.s.l.) was established at Lake Baikal to monitor the high-altitude transport of air pollutants from industrial centers of the Baikal region. The Listvyanka station is situated on the top of the coastal hill (~210 m above lake level) near the source of the Angara River on the southwestern border of the Central Ecological Zone, on the territory of the Baikal Astrophysical Observatory (BAO) (Figure 2). The station is more than 1 km away from the local anthropogenic sources (roads, boiler hoses, and stove heating) of the large tourist settlement of Listvyanka. Its location on the top of the hill facilitates research into the long-range transport of pollutants, including eBC, from large regional sources along the route of the most likely entry of air masses to Lake Baikal proximal to large cities of the Baikal region. The nearest large industrial centers are Irkutsk and Angarsk (70 and 100 km to the NNW from the station, respectively) [37]. Continuous 24-h measurements of gas and aerosol air pollutants, precipitation, and meteorological conditions are organized at this station, recording anthropogenic pollutions in the southern basin in real time under certain synoptic and meteorological conditions (Figure 2). Figure 2 demonstrates the major emissions of pollutants from stationary heat source facilities in the cities of the region and on the lake’s coast. The station has been operating since 2000 as part of the Asian Network for Acid Deposition, EANET (www.eanet.asia). Since 2011, the station participates in the Global Mercury Observation System (Former www.gmos.eu/, recently: www.gos4m.org).
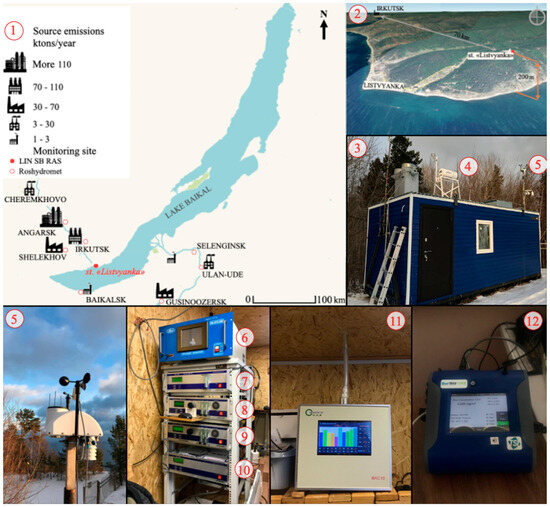
Figure 2.
Location and equipment of the atmospheric monitoring station “Listvyanka”: (1) layout of the Listvyanka reference station with the largest air pollution sources at Lake Baikal; (2) station location on the hilltop; (3) the main module of the reference station; (4) MTP-5 temperature profiler; (5) Sokol-M1 meteorological complex; (6) RA-915AM spectrometer; gas analyzer; (7) Hg; gas analyzer; (8) K-100 (CO); (9) R-310A gas analyzer (NO2 and NO); (10) CV-320 gas analyzer (SO2); (11) BAC-10 aethalometer analyzer eBC; (12) DUSTTRAK 8533 dust analyzer (PM10, PM2,5, and PM1.0).
A 10-wave light absorption analyzer (BAC-10, Shenyang Chemetech Co., Ltd., Shenyang, China) was installed in 2023 at the Listvyanka station. It was used to determine eBC. The BAC-10 multispectral monitor analyzer is based on an optical attenuation method that uses the absorption characteristics of soot adsorbed on banded quartz filter paper in various optical ranges to monitor the total amount of soot aerosols. This device measures light absorption at ten wavelengths, from 370 to 950 nm, and calculates concentration in µg m−3 for each of 10 channels (waves), all in the automatic mode. The 880 nm absorption band is considered the most applicable for BC analysis. The measuring device was installed inside the station. The analyzed air was taken from the outside, through the roof, using a standard PM10 sampler and a PM2.5 cyclone, because the aerodynamic diameter of soot particles is predominantly <2.5 µm. Measurement data is stored in the monitor’s memory and then can be copied to a flash drive, transmitted over the Internet, via a COM port, or in other ways. The options include the ability to diagnose device components and calibrate readings. The calibration interval of the device is one year. SO2 and NO2 gas impurities and aerosol mass concentration (PM10, PM2.5, and PM1.0) were measured simultaneously, and meteorological parameters were recorded (Figure 2).
3. Results and Discussion
3.1. Black Carbon in the Air Basin of Lake Baikal
Nowadays, freshwater ecosystems are experiencing stresses associated with both climate changes and anthropogenic impact [38]. Lake Baikal, a unique ecosystem of a global scale, is of great interest in terms of its comprehensive study. The atmosphere above the lake occupies a vast area (31,500 km2) and significantly differs in the composition and variability of gaseous and aerosol components in the air compared to continental regions. It still remains a poorly studied object. Large industrial centers and settlements in the Baikal and Transbaikal regions are distributed unevenly across different areas of this territory. The physical and geographical position of some Lake Baikal areas, the heterogenous orography of the coastal zone, the distribution of pollution sources in the lake’s basin, and the prevailing circulation of air masses in a certain area largely determine the spatiotemporal variability of gas and aerosol air pollutants above Lake Baikal. Atmospheric circulation plays an important role in the turbulence and concentration of pollutants in the air [39]. Previous assessments of atmospheric circulation characteristics in the Baikal region indicated the highest frequency of the air mass transport from large stationary air pollution sources in the Irkutsk Region to the southern and central basins of the lake. The air mass transport to the water area from the industrial centers of the Republic of Buryatia mainly occurs in the Selenga River delta (20%) [40]. Despite the general pattern, the air mass transport frequency can vary significantly throughout the year, from 42% in summer to 85% in winter [41]. This, together with other meteorological conditions, also influences the number of pollutants released in the air above the lake during regional transport. In recent years, impact on the ecosystem of Lake Baikal has been increasing due to the infrastructure expansion of tourist and recreational areas in the lake’s coastal zone, and the higher frequency of wildfires. In 2015–2016, wildfires on the coast of Lake Baikal completely destroyed the forests on the mountain slopes in some areas, which could affect the restructuring of the biota in the littoral zone of the lake [42].
The influence of eBC on the aerosol composition and ecology of the Lake Baikal air basin, especially during wildfires, determines the importance of studying the temporal and spatial variability of BC mass concentration and fluxes onto the water surface in the fire-hazardous summer seasons. In the summer of 2019, Siberia experienced extreme fire-hazardous weather conditions, with the largest wildfires over the past 20 years, which lasted from June to September. The area of fires at that time was ~5 mln ha. The prevailing easterly wind caused air smoke in Western and Eastern Siberia, Kazakhstan, and the Arctic. During the 2019 expedition, there were smoke plumes from extensive wildfires in the Irkutsk Region, Krasnoyarsk Territory, and Yakutia.
From 22 to 27 July 2019, when the RV moved along the west coast northwards, the concentrations of eBC and gas impurities, as well as the mass concentration of particles with different size aerosol fractions in the air, showed background values. According to the AARI data, the cyclone came to the region from the northwest, with low clouds and intermittent rains that cleared the atmosphere. Figure 3 and Table 1 demonstrate four episodes with different degrees of increase in the eBC concentrations and two episodes with background values of eBC mass concentration in the air above the water area of the lake in 2019. The first growth of the eBC concentration was recorded in the southern basin near the large settlements, such as Listvyanka, Baikalsk, and Slyudyanka. The Listvyanka settlement is the large tourist center on the west coast of the southern basin where tourist camps, private houses, and a high-traffic highway are located in the limited area along the coast. Furthermore, ships operating on diesel fuel moor in Listvennichny Bay bordering the settlement, also increasing the eBC concentration in the air above the lake. On the east coast of the southern basin, the towns of Slyudyanka and Baikalsk allocate large coal-fired heat sources, highways and railways. In these areas, the eBC concentration increased on average from 0.59 µg m−3 in Listvennichny Bay to 0.93 µg m−3 in Baikalsk and 1.08 µg m−3 in Slyudyanka.
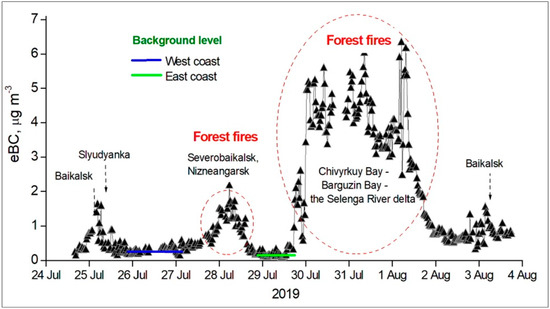
Figure 3.
Spatiotemporal variability of the eBC mass concentration in the coastal zone of Lake Baikal during the 2019.

Table 1.
Statistical analysis of different types of eBC emissions into the water area of Lake Baikal in the summer of 2019.
The first lidar responses from wildfire smoke above the water area of the lake occurred on the night of 27 July 2019 in the area of the northern basin. On 28 July 2019, measurements near the Severobaikalsk and Nizhneangarsk towns were carried out under the influence of smoke plumes from wildfires, which came to the water area of the lake from the north of the Irkutsk Region. Then, the smoke aerosol began to descend, filling the atmosphere down to the lake’s surface. From 28 to 29 July 2019, satellite monitoring (http://fires-dv.kosmosnimki.ru, accessed on 1 June 2024) recorded many wildfire sites north of Lake Baikal (Figure 4a). A backward trajectory analysis (Figure 4b) revealed that smoke aerosol was transported to the lake from the north. At the same time, based on the data on the general synoptic situation above the Northern Hemisphere on 29 July 2019, the anticyclone shifted to the southeast. The elevated eBC concentrations in the northern part of Lake Baikal on 28 and 29 July near the Severobaikalsk and Nizhneangarsk towns were associated both with the activities of these large settlements and with an increase in the smog from wildfires in the northern areas of the Irkutsk Region. In these areas, the mean BC concentrations increased to 1.09 µg m−3, with the maximum eBC concentration of 2.16 µg m−3 (Figure 3, Table 1).
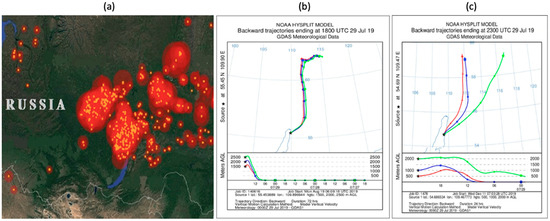
Figure 4.
Satellite image of the territory near Lake Baikal: (a) with wildfire sites in the north (28–29 July 2019); (b,c) backward trajectories calculated using the HYSPLIT models for 29 July 2019 (GMT) (http://fires-dv.kosmosnimki.ru, accessed on 1 June 2024).
On 29 and 30 July 2019, smoke aerosol descended to the lake’s surface, which remote sensing and local monitoring devices recorded. From the evening of 29 July to 1 August 2019, along the northern basin–Chivyrkuy Bay–Selenga delta route, the RV moved through a vast area of thick smoke plumes. From 30 July to 1 August 2019, relative aerosol concentration in the atmospheric layer up to 1000 m above the water area of the lake was approximately three times higher than the background values. At the same time, in addition to distant wildfire sites, when the RV navigated in the central basin, local measuring instruments (gas analyzers) recorded a dramatic increase in eBC in the near-water atmospheric layer, up to 5.0–6.0 µg m−3 with background values of 0.1 ÷ 0.2 µg m−3. The concentration of sulfur dioxide increased to 47 µg m−3, with background values of 5–8 µg m−3. The mean particle size (110 ÷ 160 nm) was higher than the background values above the lake (30 ÷ 70 nm). There is also a sharp increase in the concentration of submicron aerosol (SMA) from 60 cm−3 to 300 cm−3. The eBC mass concentrations in smoke plumes from wildfires above the water area of Lake Baikal were on average 25 times higher than the background level and, for single measurements, they were more than 100 times higher. By the evening of 1 August 2019, the air began to clear, reaching 0.2 ÷ 0.4 µg m−3 on 3 and 4 August 2019 in the southern part of the lake (Figure 3).
Analysis of air mass transport backward trajectories (HYSPLIT) for this period indicated that local wildfire near Sosnovka Bay on the northeast coast of Lake Baikal made an additional contribution to the increase in the concentrations of BC and sulfur dioxide, as well as to the amount of submicron fraction of particles. Satellite monitoring data on 26 July 2019 confirmed the hypothesis of the appearance of smoke plumes from nearby sources. It recorded a wildfire on the east coast of Lake Baikal near Sosnovka Bay (Figure 5a). Analysis of backward trajectories calculated using the HYSPLIT model (Figure 5b) revealed that smoke from the wildfire on the east coast was spreading above the lake to the northwest.
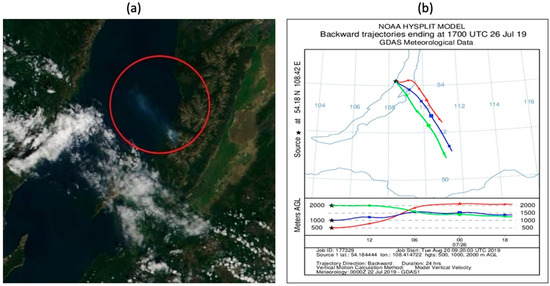
Figure 5.
Satellite image of the central basin of Lake Baikal: (a) with smoke plume from a wildfire near Sosnovka Bay (red circle); (b) backward trajectories calculated using the HYSPLIT model for 26 July 2019 (GMT).
In the summer of 2023, from 5 to 15 August, we continued our studies of the air composition above Lake Baikal onboard the RV G.Yu. Vereshchagin. A cyclone northwest of Lake Baikal, with its center over the Krasnoyarsk Territory, determined the general synoptic situation during the expedition. The weather was mostly cloudy and rainy, with low clouds and occasional clearing. The principal difference between the 2023 expedition and the 2019 was the absence of wildfires in the Baikal region, allowing us to more clearly identify the contribution of local regional sources to air pollution above the lake and trace the transport of regional and long-distance transboundary pollutants. During the expedition, we recorded 849 series of eBC measurements, excluding measurements associated with pollution from the RV during moorings (emissions from exhaust pipe). We determined mean daily eBC mass concentration under background conditions and near settlements (Figure 6, Table 2).
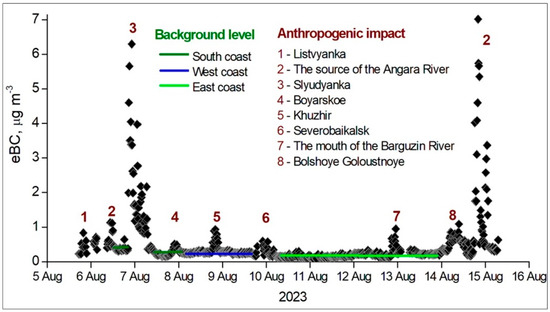
Figure 6.
Spatiotemporal variability of the eBC mass concentration in the coastal water area of Lake Baikal during the expedition in the summer of 2023.

Table 2.
Statistical analysis of different types of BC emissions (eBC) into the water area of Lake Baikal, 2023.
Like in 2019, in 2023, there were episodes with high eBC concentrations during works near large settlements, especially in the south of the lake, both at the beginning of the expedition, on 5–7 August 2023, and at the end, on 14–15 August 2023. Breeze circulations, such as those observed during the 13-h mooring of the RV on 6 August 2023 near the Slyudyanka town, are an important mechanism for the transport of anthropogenic air pollutants onto the water area of Lake Baikal. During the RV moorings near settlements, particularly in the southern part of the lake, the eBC concentrations increased with varying intensity, which is a consequence of the anthropogenic activity: the operation of industrial enterprises and engine exhausts from vehicles and ships, the amount of which has increased to 500 units in recent years. The highest eBC concentrations (6.3 µg m−3) were recorded in the evening and at night during breeze circulation of wind from the coastal zone (Figure 6, Table 2). A similar situation was observed on 14 August 2023 at the Angara River source (west coast of the southern basin). Many hours of research in this area revealed that, due to the transport of air pollutants from local anthropogenic sources (Listvyanka settlement and Baikal port), the bulk of the aerosol was concentrated in the lower 1000 m layer and significantly affected the near-water atmosphere in this area. For example, in the evening, under coastal breeze conditions, the concentrations of eBC (7 µg m−3), nitrogen oxides (30 µg m−3), and submicron and highly dispersed particles (800 cm−3) dramatically increased. Additionally, intense navigation in Listvennichny Bay also influenced the eBC measurements. Analysis of backward trajectories calculated from the HYSPLIT model for this day indicated in this area a northwesterly transport of air masses along the Angara River valley from the industrial centers of the region: the cities of Irkutsk and Angarsk, etc. This could also affect the eBC concentration growth in the near-water atmosphere.
During stationary measurements near the settlements in other areas of the lake, the highest eBC concentrations were also recorded in the evening and at night with breeze circulation of wind from the coastal zone to the lake. For example, in the evening hours on 9 August 2023, near the Severobaikalsk town, we recorded elevated eBC concentrations of up to 0.59 μg m−3. Moreover, its mean concentration during the entire period of this mooring lasting for 17 h was 0.22 μg m−3 (Table 2). High eBC concentrations were observed near the Barguzin River mouth in the largest Barguzin Bay. In the evening and night hours, with the formation of breeze from the coastal zone, the eBC concentration increased to 0.95 μg m−3 near the Ust-Barguzin settlement.
The atmosphere far from settlements showed low eBC concentrations that were regarded as background values. Based on the results of two years of expeditions, the mean eBC concentration at such sites in the southern basin was 0.27 ± 0.09 μg m−3 (Table 1 and Table 2). In the central and northern basins, along the west coast from the Buguldeika settlement to the Severobaikalsk town, the mean eBC concentration varied from ~0.28 to ± 0.09 μg m−3. On the east coast of the northern basin, from Ayaya Bay to the central basin, this was 0.17 ± 0.08 μg m−3 in 2023. The northeast coast of Lake Baikal, Ayaya Bay, and Khakusy Bay, demonstrated the lowest eBC concentrations (0.15 ± 0.07 μg m−3). Figure 7a,b shows the mean daily eBC concentration under background conditions and near populated areas, which was obtained during the 2023 expedition. Under background conditions, the diurnal eBC variability in the air above the lake was poorly manifested. At the same time, under anthropogenic load near large local sources, its concentration, as well as submicron fraction aerosol particles, increased in the evening and at night with breeze circulation.
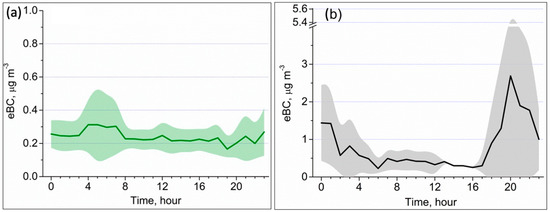
Figure 7.
Diurnal variation of the eBC mass concentration under background conditions (a) and near populated areas. (b) RMSD areas are highlighted in color.
The evening and morning maximum values resulted from the weakening of convective mixing, temperature inversion in the early morning hours, and the lowest depth of the atmospheric boundary layer, deteriorating the dispersion of impurities coming from air pollution sources located on the coast. The maximum value of 2.67 µg m−3 was recorded at 20:00, with a minimum concentration during daylight hours (0.25 µg m−3).
3.2. Black Carbon in the Air near the Listvyanka Station: Seasonal Variability and Main Air Pollution Sources
Local and regional scale meteorological factors have a significant impact on the transport and spatiotemporal variability in concentrations of air pollutants, including eBC to the coast and Lake Baikal. The eBC sources in the Baikal region can be conditionally divided into low (road and water transport, stove heating), emissions of which are mainly local, and regional (primarily coal-fired thermal power plants in large urban agglomerations). Atmospheric processes of regional and synoptic scales can carry emissions of the latter, owing to high pipes (150–200 m or more), over long distances in the boundary layer. In particular, the rural atmosphere monitoring station «Listvyanka» also periodically experiences the influence of such regional transport, mostly in winter and rarely in summer. Automatic air pollution monitoring techniques applied at the Listvyanka station assess mutual correlations of eBC concentrations and gas impurities of sulfur and nitrogen in real time.
Table 3 shows variability statistics of eBC concentrations at the Listvyanka station for 2023 and early 2024. In the summer months, the variability of eBC concentrations was low; arithmetic means and medians were ~ 0.1 μg m−3, and the maximum values were > 0.8 μg m−3. With the onset of the winter season, arithmetic means of eBC concentrations and their medians increased twofold to threefold, and the maximum values by up to sevenfold. At the same time, the medians appeared to be lower than the arithmetic means, indicating the periodic influence of strong eBC sources. Sulfur dioxide also demonstrated a similar seasonal variation, indicating a common source of this gas and eBC in the air of the study area.

Table 3.
Mean monthly characteristics of hourly concentrations of eBC, particulate matter (PM ≤ 2.5 μm), and SO2 based on the automatic measurements at the Listvyanka station from May 2023 to February 2024, μg m−3.
This also allows us to assume that the winter maximum was primarily due to the increased operation of thermal power plants, which depends on temperature [43]. Therefore, there is a strong inverse linear relationship between the mean monthly air temperature and the concentration of sulfur dioxide, particulate matter, and black carbon during the winter months in the atmosphere at the Listvyanka station (Table 3 and Figure 8).
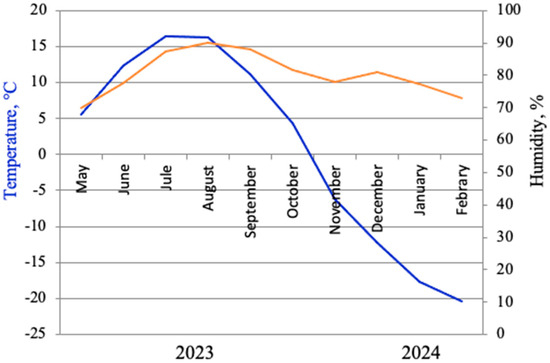
Figure 8.
Dynamics of mean monthly temperature and humidity at the Listvyanka station in 2023–2024.
Large coal-fired thermal power plants of the Baikal region are the main common source of eBC and SO2. Figure 9 shows mean hourly concentrations of these components at the Listvyanka station in January 2024, the coldest period of the year, clearly indicating the direct connection between these pollutants in the air. The concentration dynamics of eBC and sulfur dioxide at the monitoring station strongly depended on the variability of wind direction given in Table 4 for the summer and winter seasons. The maximum concentrations of these pollutants in the air were associated with northwesterly (310 = 340°) air mass transport from the Irkutsk–Angarsk industrial complex located 70 to 100 km from the Listvyanka station.
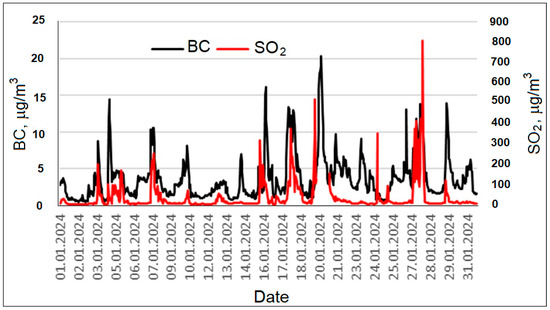
Figure 9.
Mean hourly concentrations of eBC and SO2 at the Listvyanka station, January 2024.

Table 4.
Mean eBC concentrations (μg m−3) for different wind directions at the Listvyanka station in August 2023 and January 2024.
The lowest eBC concentrations were recorded with northeasterly (0–90°) winds blowing from the sparsely populated taiga areas in the northern part of the lake, and the highest from the northwestern (270–360°) land areas allocating large cities of the Baikal region. Of special interest was the northwesterly direction (330–350°), with winds blowing along the Angara River valley (Table 4), where the concentrations were also the highest. In addition to the directions of air mass transport, the precipitation intensity also influenced the eBC concentration. For instance, its relatively high concentrations were determined during a long absence of rains, from 14 to 21 September 2023, with a short-term decrease in the eBC concentrations on 19–10 September 2023 due to the change in the wind direction from NW to SE (from the lake). At the same time, during heavy precipitation on 25–26 September 2023, despite the predominance of the NW transport on these days, the eBC concentrations decreased significantly (Figure 10).
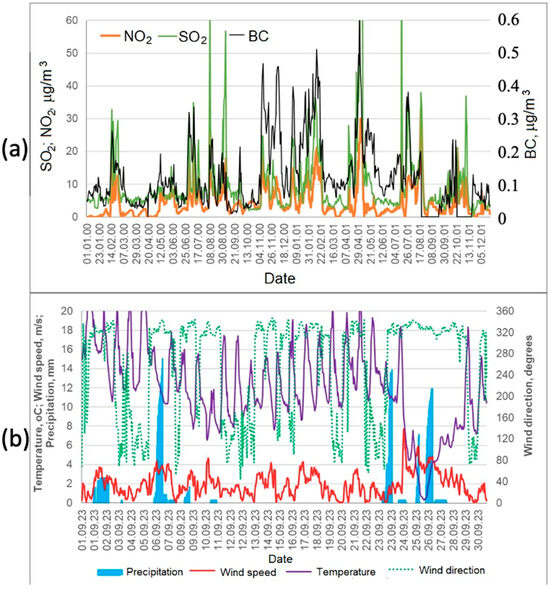
Figure 10.
Mean hourly concentrations of BC, nitrogen oxide, and sulfur dioxide (a) and meteorological parameters at the Listvyanka station (b), September 2023.
3.3. Relative Black Carbon Concentration in Submicron Aerosol Based on the Results of the Shipborne and Listvyanka Station Measurements
We analyzed the results of joint measurements of the concentrations eBC and submicron aerosol particles (PM ≤ 2.5 μm, PM2,5) at the Listvyanka station and above the water area of Lake Baikal during the summer expeditions onboard the RV (Table 1, Table 2 and Table 3). To study the total concentration and distribution of particles, we used DUSTTRAK 8533 spectrometer (TSI Incorporated, Shoreview, MN, USA) dust analyzer (PM10, PM2,5, and PM1.0) display cumulative and differential data on the number of particles [40]. Analysis of the Table 1, Table 2 and Table 3 revealed that the relative concentration of eBC in the submicron aerosol recorded in the air above the water area of Lake Baikal in the summer of 2019 changed from 2–4% in the northern background areas of the lake to 9–13% in the areas with the local air pollution sources near the large coastal settlements. In 2023, this ratio was higher both in background areas (8–9%) and near the local air pollution sources (14–18%). That year, we recorded a particularly high relative concentration (eBC/PM2.5) in the water area of the lake, near the Slyudyanka town (29%) during a local fire on the lake’s coast and at the Angara River source (28%) where air pollution from local coastal sources was observed and intense navigation in Listvennichny Bay strongly affected.
At the «Listvyanka» monitoring station during the cold season (from November to January 2024), with a change in mesoscale atmospheric circulation, an increase in the emissions from anthropogenic sources, and a decrease in the height of the atmospheric boundary layer, the eBC relative concentration ranged from 8 to 13%, and from 11 to 14% in the warm season. The eBC/PM2.5 ratio, that we recorded at the Listvyanka station was well correlated with the results obtained by other researchers at the atmosphere monitoring station near Tomsk and in other areas of Western Siberia and world [44,45].
4. Conclusions
The investigations conducted in 2019 and 2023 to study the mass concentration of eBC and submicron aerosol above the water area of Lake Baikal and the west coast of its southern basin (Listvyanka station) revealed their main sources and spatiotemporal variability. The background level of the eBC mass concentration in the air above the water area of Lake Baikal ranged from 0.2 to 0.3 μg m−3, with minimum values of 0.7–0.15 μg m−3 recorded in the northern basin of Lake Baikal (Ayaya Bay). During the air mass transport along the valleys of the lake’s large tributaries, the Selenga and Barguzin rivers, as well as at the Angara River source and near the towns of Slyudyanka, Baikalsk, and Severobaikalsk located on the coast, the eBC concentrations were elevated in the water area of the lake. Here, the eBC concentrations rose to an average of 0.9–1.8 μg m−3. Thick smoke plumes from intense wildfires in 2019 covering the Irkutsk Region, Krasnoyarsk Territory, and Yakutia, as well as the local fire on the east coast of the lake, led to an increase in the eBC concentration to 5–6 μg m−3 in the near-water layer of the atmosphere in the central basin.
We determined the diurnal dynamics of eBC in different areas of the lake. The diurnal variability was poorly manifested under background conditions. We recorded the highest values during the evening and night hours during breeze circulation from the coastal zone near the large settlements in the southern basin and with the air mass transport along the valleys of the lake’s tributaries (the Selenga, the Barguzin and in the source of the Angara River). The evening maximum was up to 10 times higher than the daytime maximum.
During the summer of 2019, the proportion of eBC in the total mass of submicron aerosol in the air above the water are of Lake Baikal ranged, depending on the direction of air mass flows, weather conditions, and smoke emission transport, from 2–4% at the background sites of the lake to 9–13% near the large settlements on the coast. In 2023, this proportion was higher both at the background sites (8–9%) and near the local air pollution sources (14–18%).
At the air monitoring station near the Listvyanka settlement (west coast of the southern basin), we analyzed the seasonal dynamics of the eBC concentrations, mass particle (≤2.5 µm) and gas impurity (sulfur and nitrogen dioxides) concentrations. Long-range transport of emission plumes from regional coal-fired thermal power plants situated in the large cities of the Baikal region mostly contributed to the eBC concentration in the air of this area in winter. In summer, the air near the Listvynka station was relatively clean when the pollutants were removed by precipitation. The proportion of eBC in the total mass of submicron aerosol in this area ranged from 8 to 13% in the cold season and increased to 11–14% in the warm season.
The study of eBC in the air of the Baikal region continues. We take samples and analyze the chemical composition of organic compounds (soot and PAHs) of aerosol particles with such size fractions as 10, 5, 2.5, and 1.0 µm. Under the electron scanning microscope, we examine morphology and elemental composition of carbon-bearing and other aerosol particles at the Listvyanka station in different seasons of the year, and above the water area of Lake Baikal in the summer.
Author Contributions
Conceptualization, original design and methodology, T.V.K.; data collection and analysis, software and visualization, E.P.Y., M.Y.S., G.S.Z., A.S.Z. and L.P.G.; writing and editing the manuscript T.V.K., M.Y.S. and L.P.G. All authors have read and agreed to the published version of the manuscript.
Funding
This research was supported by the project of the Russian Science Foundation (RSF) No. 19–77–20058 P.
Institutional Review Board Statement
Not applicable.
Informed Consent Statement
Not applicable.
Data Availability Statement
The raw data supporting the conclusions of this article will be made available by the corresponding author on request.
Conflicts of Interest
The authors declare no conflicts of interest.
References
- Maysyuk, E.P. The role of energy in the ecological state of the Baikal natural territory. Geogr. Nat. Resour. 2017, 1, 100–107. [Google Scholar] [CrossRef]
- On the State and Protection of the Environment of the Irkutsk Region Region in 2022; State Report; Maxima LLC: Irkutsk, Russia, 2023. (In Russian)
- Van Malderen, H.; Van Grieken, R.; Khodzher, T.; Obolkin, V.; Potemkin, V. Composition of individual aerosol particles above Lake Baikal, Siberia. Atmos. Environ. 1996, 30, 1453–1465. [Google Scholar] [CrossRef]
- Shimaraev, M.; Starygina, L. Zonal circulation of the atmosphere, climate and hydrological processes at lake Baikal (1968–2007). Geogr. Nat. Resour. 2010, 31, 245–250. [Google Scholar] [CrossRef]
- Shimaraev, M.N.; Troitskaya, E.S. Current Trends in Upper Water Layer Temperature in Coastal Zones of Baikal. Geogr. Nat. Resour. 2018, 39, 349–357. [Google Scholar] [CrossRef]
- Izmest’eva, L.R.; Moore, M.V.; Hampton, S.E.; Ferwerda, C.J.; Gray, D.K.; Woo, K.H.; Pislegina, H.V.; Krashchuk, L.S.; Shimaraeva, S.V.; Silow, E.A. Lake-wide physical and biological trends associated with warming in Lake Baikal. J. Great Lakes Res. 2016, 42, 17. [Google Scholar] [CrossRef]
- Kravtsova, L.S.; Izhboldina, L.A.; Khanaev, I.V.; Pomazkina, G.V.; Rodionova, E.V.; Domysheva, V.M.; Sakirko, M.V.; Tomberg, I.V.; Kostornova, T.Y.; Kravchenko, O.S.; et al. Nearshore benthic blooms of filamentous green algae in Lake Baikal. J. Great Lakes Res. 2014, 40, 441–448. [Google Scholar] [CrossRef]
- Timoshkin, O.A.; Samsonov, D.P.; Yamamuro, M.; Moore, M.V.; Belykh, O.I.; Malnik, V.V.; Sakirko, M.V.; Shirokaya, A.A.; Bondarenko, N.A.; Domysheva, V.M.; et al. Rapid ecological change in the coastal zone of Lake Baikal (East Siberia): Is the site of the world’s greatest freshwater biodiversity in danger? J. Great Lakes Res. 2016, 42, 487–497. [Google Scholar] [CrossRef]
- Malnik, V.; Masumi, Y.; Tomberg, I.; Molozhnikova, E.; Bukin, Y.; Timoshkin, O. Lacustrine, wastewater, interstitial and fluvial water quality in the Southern Lake Baikal region. J. Water Health 2022, 20, 23–40. [Google Scholar] [CrossRef]
- Flannigan, M.D.; Amiro, B.D.; Logan, K.A.; Stocks, B.J.; Wotton, B.M. Forest fires and climate change in the 21st century. Mitig. Adapt. Strateg. Glob. Chang. 2005, 11, 847–859. [Google Scholar] [CrossRef]
- Zong, X.Z.; Tian, X.R.; Yin, Y.H. Impacts of Climate Change on Wildfires in Central Asia. Forests 2020, 11, 802. [Google Scholar] [CrossRef]
- Lee, J.E.; Gorkowski, K.; Meyer, A.G.; Benedict, K.B.; Aiken, A.C.; Dubey, M.K. Wildfire smoke demonstrates significant and predictable black carbon light absorption enhancements. Geophys. Res. Lett. 2022, 49, e2022GL099334. [Google Scholar] [CrossRef]
- RIA Novosti “Large Wildfires in Russia in 2017–2022”. Available online: https://ria.ru/20220823/pozhary-1811555622.html (accessed on 10 May 2024).
- Kharuk, V.I.; Ponomarev, E.I.; Ivanova, G.A.; Dvinskaya, M.L.; Coogan, S.C.; Flannigan, M.D. Wildfires in the Siberian taiga. Ambio 2021, 50, 1953–1974. [Google Scholar] [CrossRef] [PubMed]
- Ponomarev, E.; Yakimov, N.; Ponomareva, T.; Yakubailik, O.; Conard, S.G. Current Trend of Carbon Emissions from Wildfires in Siberia. Atmosphere 2021, 12, 559. [Google Scholar] [CrossRef]
- Khodzher, T.V.; Zagaynov, V.A.; Lushnikov, A.A.; Chausov, V.D.; Zhamsueva, G.S.; Zayakhanov, A.S.; Tsydypov, V.V.; Potemkin, V.L.; Marinaite, I.I.; Maksimenko, V.V.; et al. Study of Aerosol Nano and Submicron Particle Compositions in the Atmosphere of Lake Baikal during Natural Fire Events and Their Interaction with Water Surface. Water Air Soil Pollut. 2021, 232, 266. [Google Scholar] [CrossRef]
- Vashukevich, N.V.; Timoshkin, O.A.; Samsonov, D.P.; Kulikova, N.N.; Levasheva, M.V.; Lukhnev, A.G. Taiga fire on Bolshoy Ushkany Island as a model case of forest soil transformation and potential source of eutrophication in Lake Baikal coastal zone. Limnol. Freshw. Biol. 2023, 6, 48–54. [Google Scholar] [CrossRef]
- Bond, T.C.; Doherty, S.J.; Fahey, D.W.; Forster, P.M.; Berntsen, T.; De Angelo, B.J.; Flanner, M.G.; Ghan, S.; Kärcher, B.; Koch, D.; et al. Bounding the role of black carbon in the climate system: A scientific assessment. J. Geophys. Res. Atmos. 2013, 118, 5380–5552. [Google Scholar] [CrossRef]
- Wang, R.; Tao, S.; Shen, H.; Huang, Y.; Chen, H.; Balkanski, Y.; Boucher, O.; Ciais, P.; Shen, G.; Li, W.; et al. Trend in global black carbon emissions from 1960 to 2007. Environ. Sci. Technol. 2014, 48, 6780–6787. [Google Scholar] [CrossRef]
- Waggoner, D.C.; Chen, H.; Willoughby, A.S.; Hatcher, P.G. Formation of black carbonlike and alicyclic aliphatic compounds by hydroxyl radical initiated degradation of lignin. Org. Geochem. 2015, 82, 69–76. [Google Scholar] [CrossRef]
- Anenberg, S.C.; Belova, A.; Brandt, J.; Fann, N.; Greco, S.; Guttikunda, S.; Heroux, M.-E.; Hurley, F.; Krzyzanowski, M.; Medina, S.; et al. Survey of Ambient Air Pollution Health Risk Assessment Tools. Risk Anal. 2016, 36, 1718–1736. [Google Scholar] [CrossRef]
- Menon, S.; Hansen, J.; Nazarenko, L.; Luo, Y. Climate Effects of Black Carbon Aerosols in China and India. Science 2002, 297, 2250–22539. [Google Scholar] [CrossRef]
- Popovicheva, O.B.; Evangeliou, N.; Eleftheriadis, K.; Kalogridis, A.C.; Sitnikov, N.; Eckhardt, S.; Stohl, A. Black carbon sources constrained by observations in the Russian high arctic. Environ. Sci. Tech. 2017, 51, 3871–3879. [Google Scholar] [CrossRef] [PubMed]
- Vinogradova, A.A.; Ivanova, Y.A. Atmospheric Transport of Black Carbon to the Russian Arctic from Different Sources: Winter and Summer 2000–2016. Atmos. Ocean. Opt. 2023, 3, 758–766. (In Russian) [Google Scholar] [CrossRef]
- Zenkova, P.N.; Chernov, D.G.; Shmargunov, V.P.; Panchenko, M.V.; Belan, B.D. Submicron Aerosol and Absorbing Substance in the Troposphere of the Russian Sector of the Arctic According to Measurements Onboard the Tu-134 Optik Aircraft Laboratory in 2020. Atmos. Ocean. Opt. 2022, 35, 43–51. [Google Scholar] [CrossRef]
- Liu, Y.; Yan, C.; Zheng, M. Source apportionment of black carbon during winter in Beijing. Sci. Total Environ. 2018, 618, 531–541. [Google Scholar] [CrossRef]
- Jaffe, D.A.; O’Neill, S.M.; Larkin, N.K.; Holder, A.L.; Peterson, D.L.; Halofsky, J.E.; Rappold, A.G. Wildfire and prescribed burning impacts on air quality in the United States. J. Air Waste Manag. Assoc. Critical Rev. 2020, 70, 583–615. [Google Scholar] [CrossRef]
- Mousavi, A.; Sowlat, M.H.; Hasheminassab, S.; Polidori, A.; Sioutas, C. Spatio-Temporal Trends and Source Apportionment of Fossil Fuel and Biomass Burning Black Carbon (BC) in the Los Angeles Basin. Sci. Total Environ. 2018, 640, 1231–1240. [Google Scholar] [CrossRef] [PubMed]
- Popovicheva, O.; Chichaeva, M.; Kovach, R.; Zhdanova, E.; Kasimov, N. Seasonal, weekly, and diurnal black carbon in Moscow megacity background under impact of urban and regional sources. Atmosphere 2022, 13, 563. [Google Scholar] [CrossRef]
- Popovicheva, O.; Molozhnikova, E.; Nasonov, S.; Potemkin, V.; Penner, I.; Klemasheva, M.; Marinaite, I.; Golobokova, L.; Vratolis, S.; Eleftheriadis, K.; et al. Industrial and wildfire aerosol pollution over world heritage Lake Baikal. J. Environ. Sci. 2021, 107, 49–64. [Google Scholar] [CrossRef]
- Sandradewi, J.; Prev’ot, A.S.H.; Alfarra, M.R.; Szidat, S.; Wehrli, M.N.; Ruff, M.; Weimer, S.; Lanz, V.A.; Weingartner, E.; Perron, N.; et al. Comparison of several wood smoke markers and source apportionment methods for wood burning particulate mass. Atmos. Chem. Phys. 2008, 8, 8091–8118. [Google Scholar]
- Kozlov, V.S.; Shmargunov, V.P.; Panchenko, M.V. Modified aethalometer for monitoring of black carbon concentration in atmospheric aerosol and technique for correction of the spot loading effect. Proc. SPIE 2016, 10035, 1003530. [Google Scholar] [CrossRef]
- Hansen, A.D.A.; Rosen, H.; Novakov, T. The aethalometer-an instrument for the real-time measurement of optical absorption by aerosol particles. Sci. Total Environ. 1984, 36, 191–196. [Google Scholar] [CrossRef]
- Kabanov, D.M.; Maslovsky, A.S.; Radionov, V.F.; Sakerin, S.M.; Chernov, D.G.; Sidorova, O.R. Seasonal and Interannual Variability of Aerosol Characteristics According to the Data of Long-Term (2011–2021) Measurements at the Russian Scientific Center on the Spitzbergen Archipelago. Atmos. Ocean. Opt. 2023, 36, 645–654. (In Russian) [Google Scholar] [CrossRef]
- Sakerin, S.M.; Kabanov, D.M.; Kalashnikova, D.A.; Kravchishina, M.D.; Kruglinsky, I.A.; Makarov, V.I.; Popova, S.A.; Pochufarov, A.O.; Simonova, G.V.; Turchinovich, Y.S.; et al. Spatiotemporal variations in atmospheric aerosol characteristics over the Kara, Barents, Norwegian, and Greenland Seas (2018–2021 expeditions). Atmos. Ocean. Opt. 2022, 35, 651–660. (In Russian) [Google Scholar] [CrossRef]
- Nasonov, S.; Balin, Y.; Klemasheva, M.; Kokhanenko, G.; Novoselov, M.; Penner, I. Study of Atmospheric Aerosol in the Baikal Mountain Basin with Shipborne and Ground-Based. Lidars Remote Sens. 2020, 15, 3816. [Google Scholar] [CrossRef]
- IPCC. Climate Change 2014: Synthesis Report. Contribution of Working Groups I, II and III to the Fifth Assessment Report of the Intergovernmental Panel on Climate Change; IPCC: Geneva, Switzerland, 2014. [Google Scholar]
- Molozhnikova, Y.V.; Shikhovtsev, M.Y.; Netsvetaeva, O.G.; Khodzher, T.V. Ecological Zoning of the Baikal Basin Based on the Results of Chemical Analysis of the Composition of Atmospheric Precipitation Accumulated in the Snow Cover. Appl. Sci. 2023, 13, 8171. [Google Scholar] [CrossRef]
- Kovadlo, P.G.; Shikhovtsev, A.Y. Energy structure of optical atmospheric turbulence at different air flow parameters. Bull. Irkutsk. State Univ. Ser. Earth Sci. 2014, 8, 42–55. (In Russian) [Google Scholar]
- Shikhovtsev, M.Y.; Obolkin, V.A.; Khodzher, T.V.; Molozhnikova, Y.V. Variability of the Ground Concentration of Particulate Matter PM1-PM10 in the Air Basin of the Southern Baikal Region. Atmos. Ocean. Opt. 2023, 36, 655–662. [Google Scholar] [CrossRef]
- Gorshkov, A.G.; Izosimova, O.N.; Kustova, O.V.; Marinaite, I.I.; Galachyants, Y.P.; Sinyukovich, V.N.; Khodzher, T.V. Wildfires as a Source of PAHs in Surface Waters of Background Areas (Lake Baikal, Russia). Water 2021, 13, 2636. [Google Scholar] [CrossRef]
- Kozlov, V.S.; Panchenko, M.V.; Yausheva, E.P. Relative soot content in submicron aerosol as an indicator of the influence of smoke from long range wildfires. Atmos. Ocean. Opt. 2006, 19, 484–491. (In Russian) [Google Scholar]
- Molozhnikova, E.V. Accounting for Environmental Pollution by Aerosols in Problems of Energy Systems Development. Doctoral Dissertation, L.A. Melentyev Energy Systems Institute, Siberian Branch of the Russian Academy of Sciences, Novosibirsk, Russia, 2003. [Google Scholar]
- Panchenko, M.; Yausheva, E.; Chernov, D.; Kozlov, V.; Makarov, V.; Popova, S.; Shmargunov, V. Submicron Aerosol and Black Carbon in the Troposphere of Southwestern Siberia (1997–2018). Atmosphere 2021, 12, 351. [Google Scholar] [CrossRef]
- Sandeep, P.; Saradhi, I.V.; Pandit, G.G. Seasonal variation of black carbon in fine particulate matter (PM 2.5) at the tropical coastal city of Mumbai, India. Bull. Environ. Contam. Toxicol. 2013, 91, 605–610. [Google Scholar] [CrossRef] [PubMed]
Disclaimer/Publisher’s Note: The statements, opinions and data contained in all publications are solely those of the individual author(s) and contributor(s) and not of MDPI and/or the editor(s). MDPI and/or the editor(s) disclaim responsibility for any injury to people or property resulting from any ideas, methods, instructions or products referred to in the content. |
© 2024 by the authors. Licensee MDPI, Basel, Switzerland. This article is an open access article distributed under the terms and conditions of the Creative Commons Attribution (CC BY) license (https://creativecommons.org/licenses/by/4.0/).