
Design and Experimental Study of a Down-Drive Piezoelectric High-Frequency Fatigue Testing Machine

Abstract
1. Introduction
2. Materials and Methods
2.1. Structural Design
2.2. Working Principle
2.3. Material Parameters
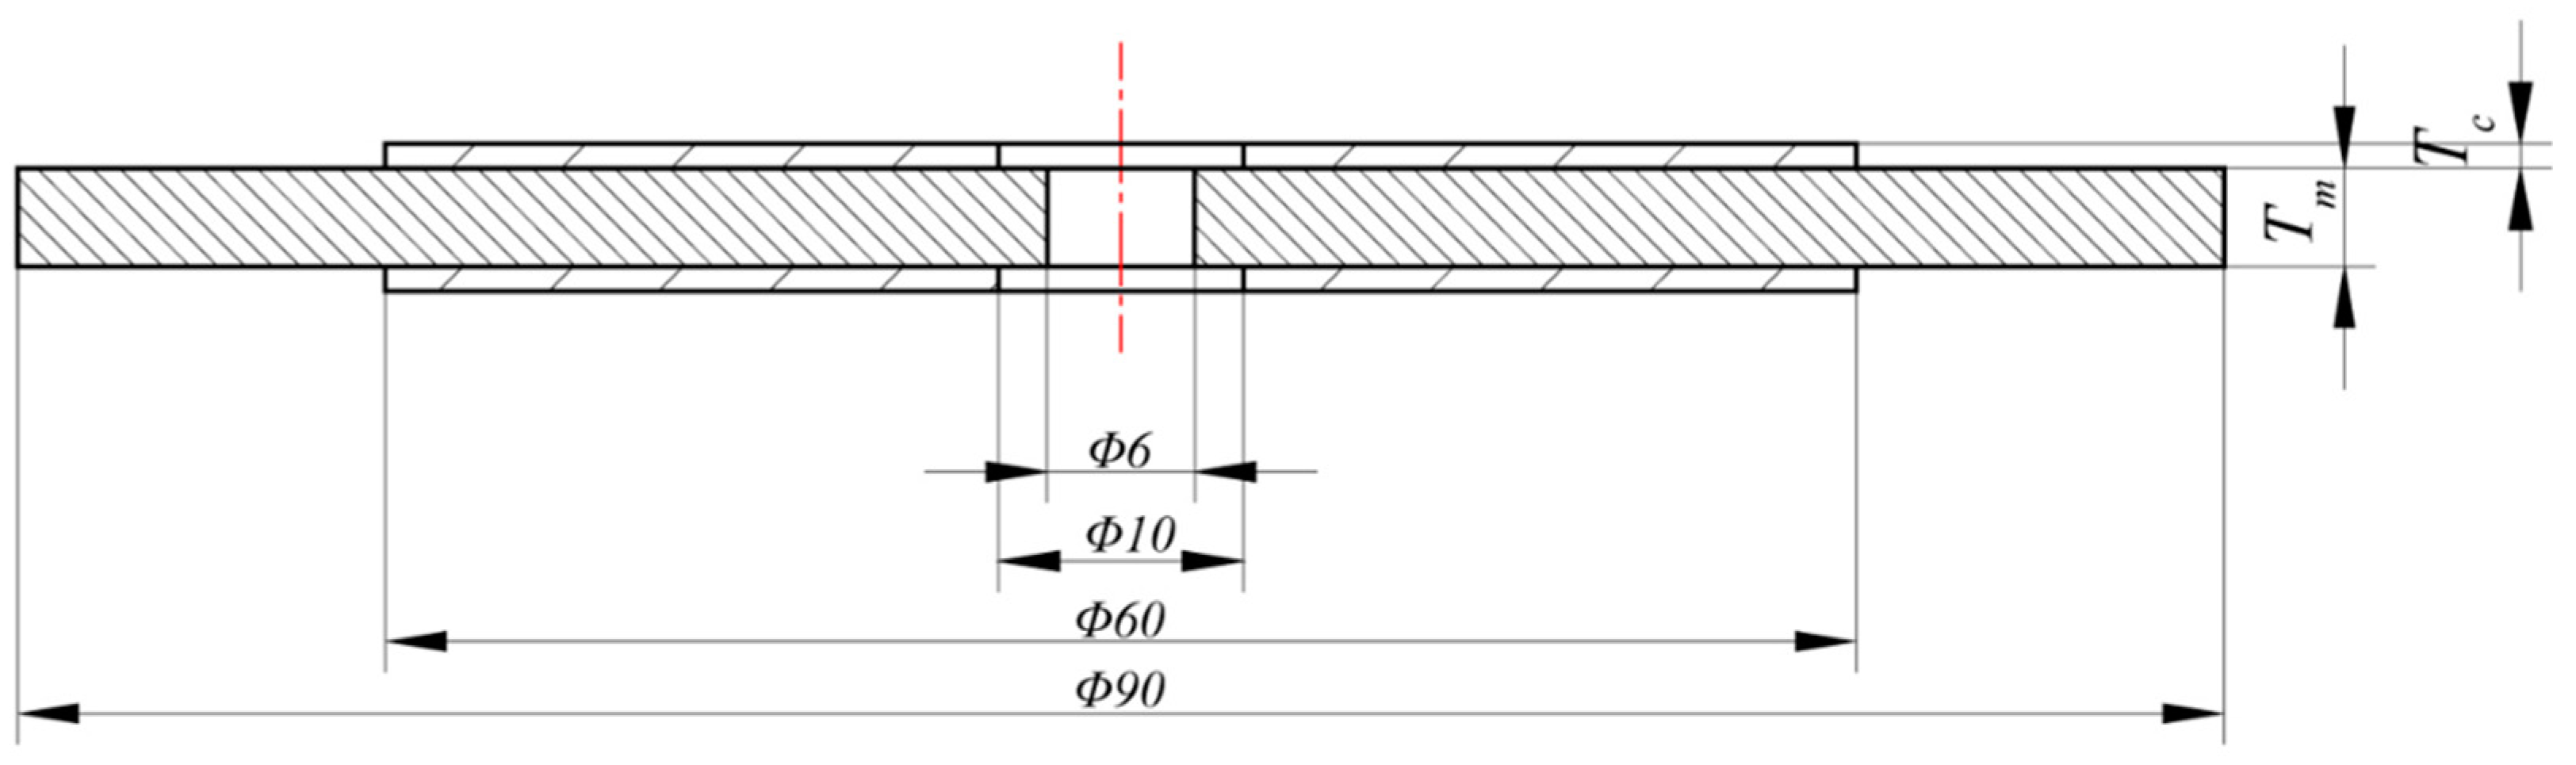
2.3.1. Piezoelectric Vibrator
2.3.2. Mass Block
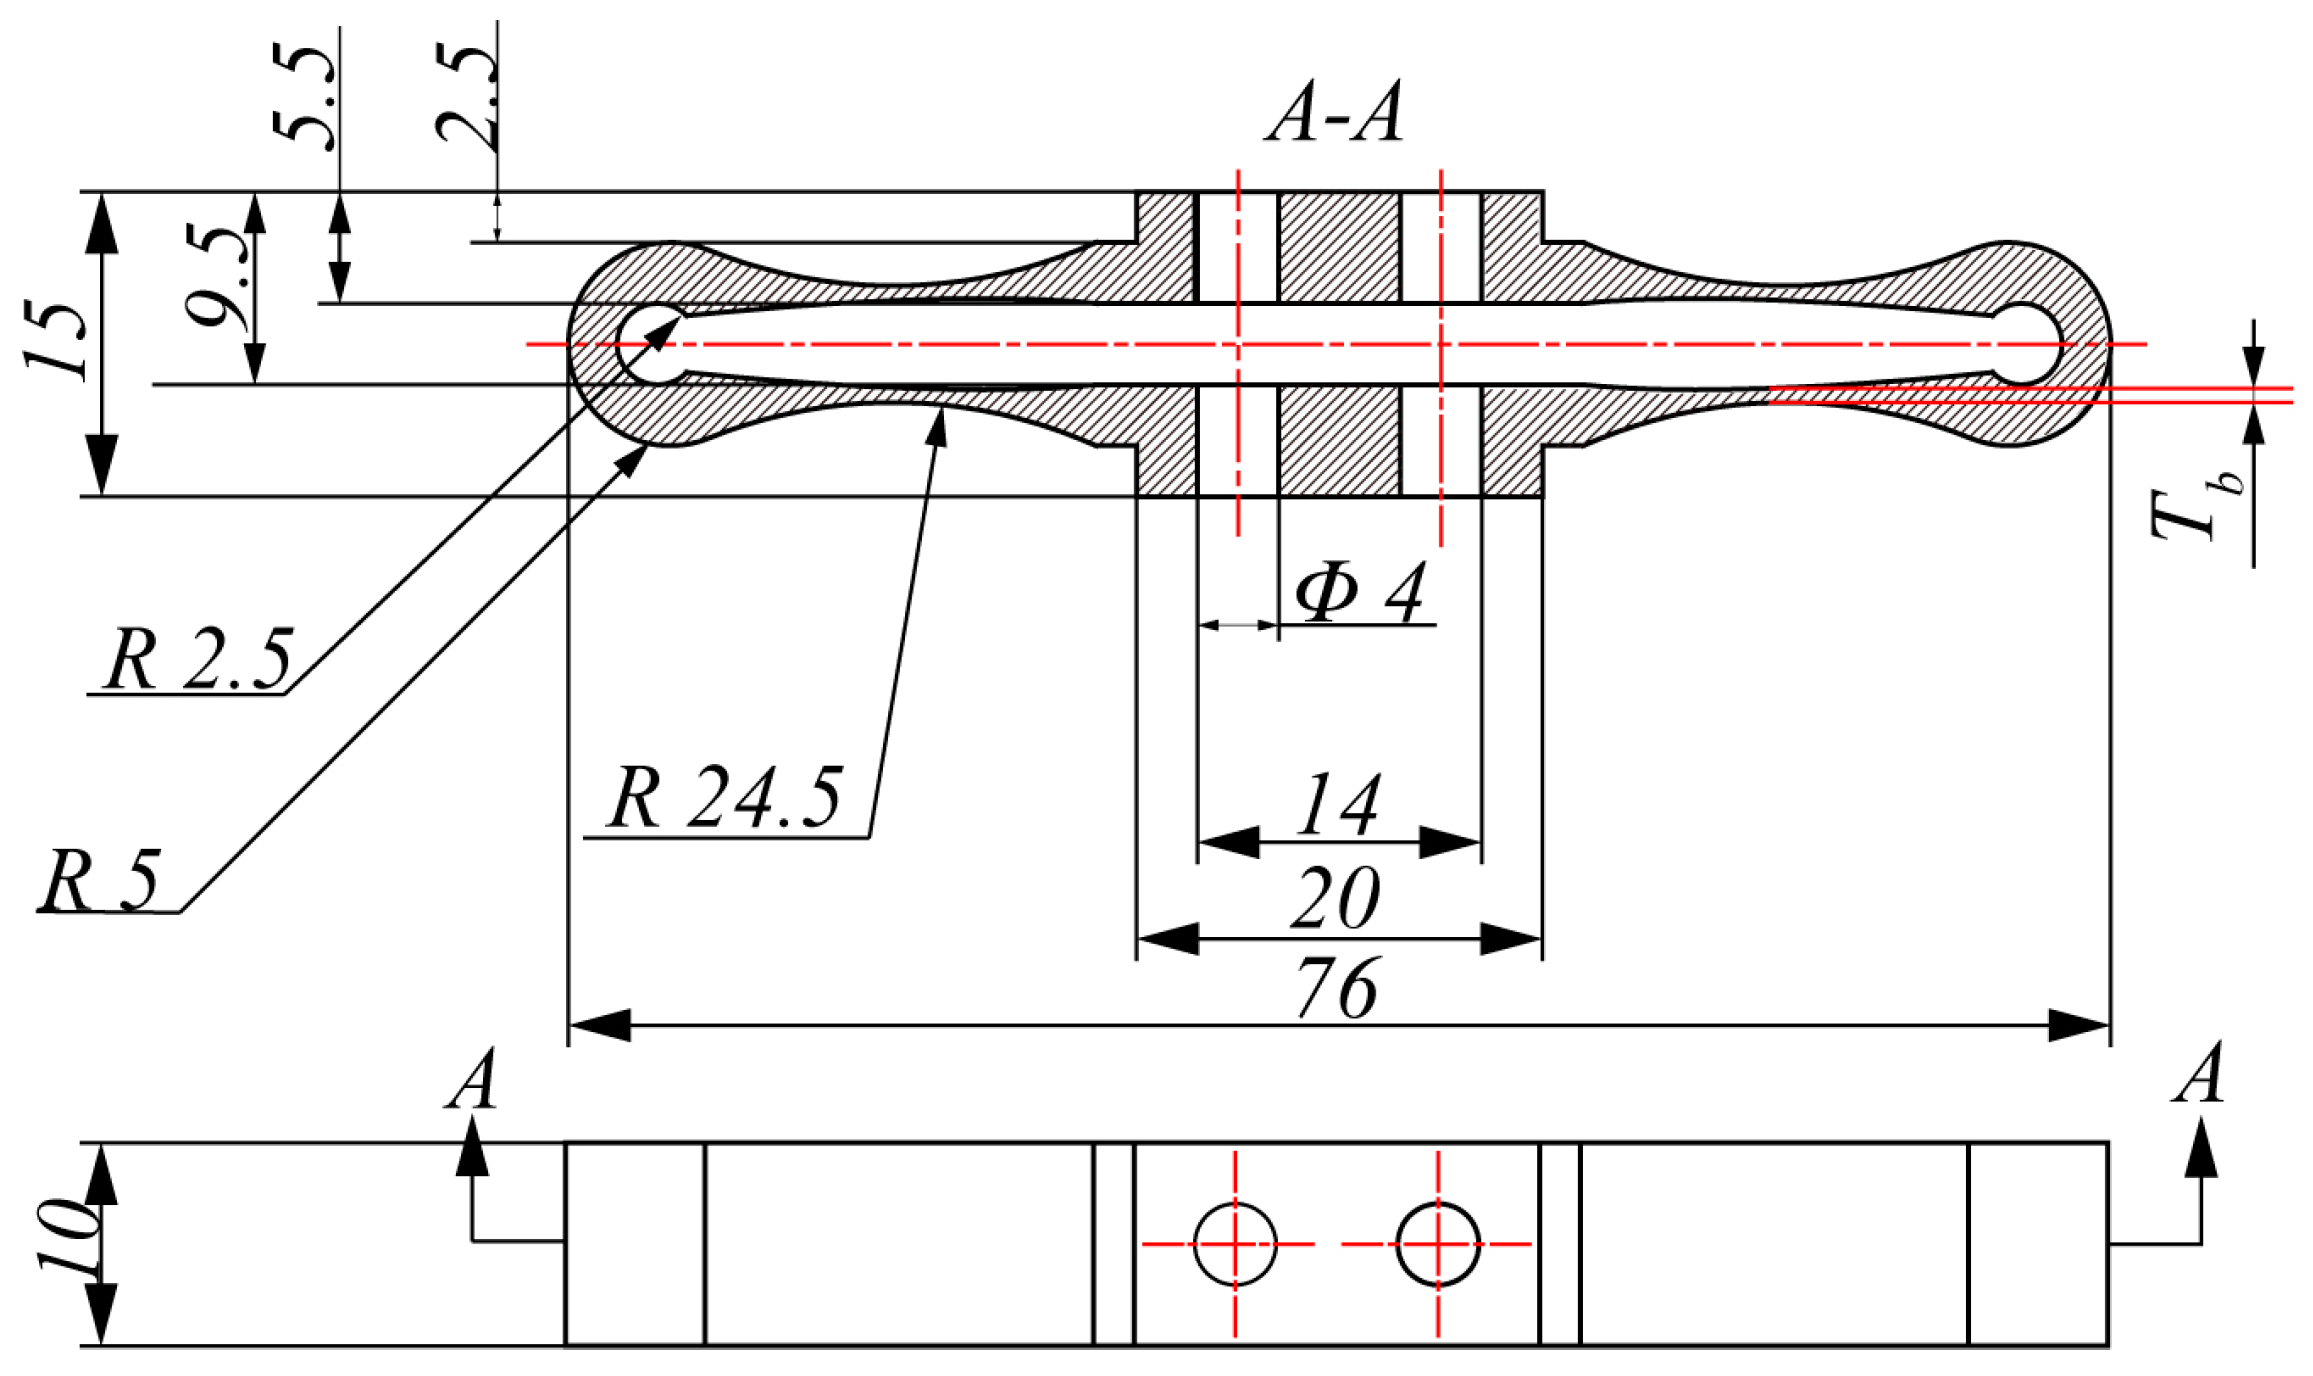
2.3.3. Elastic Ring
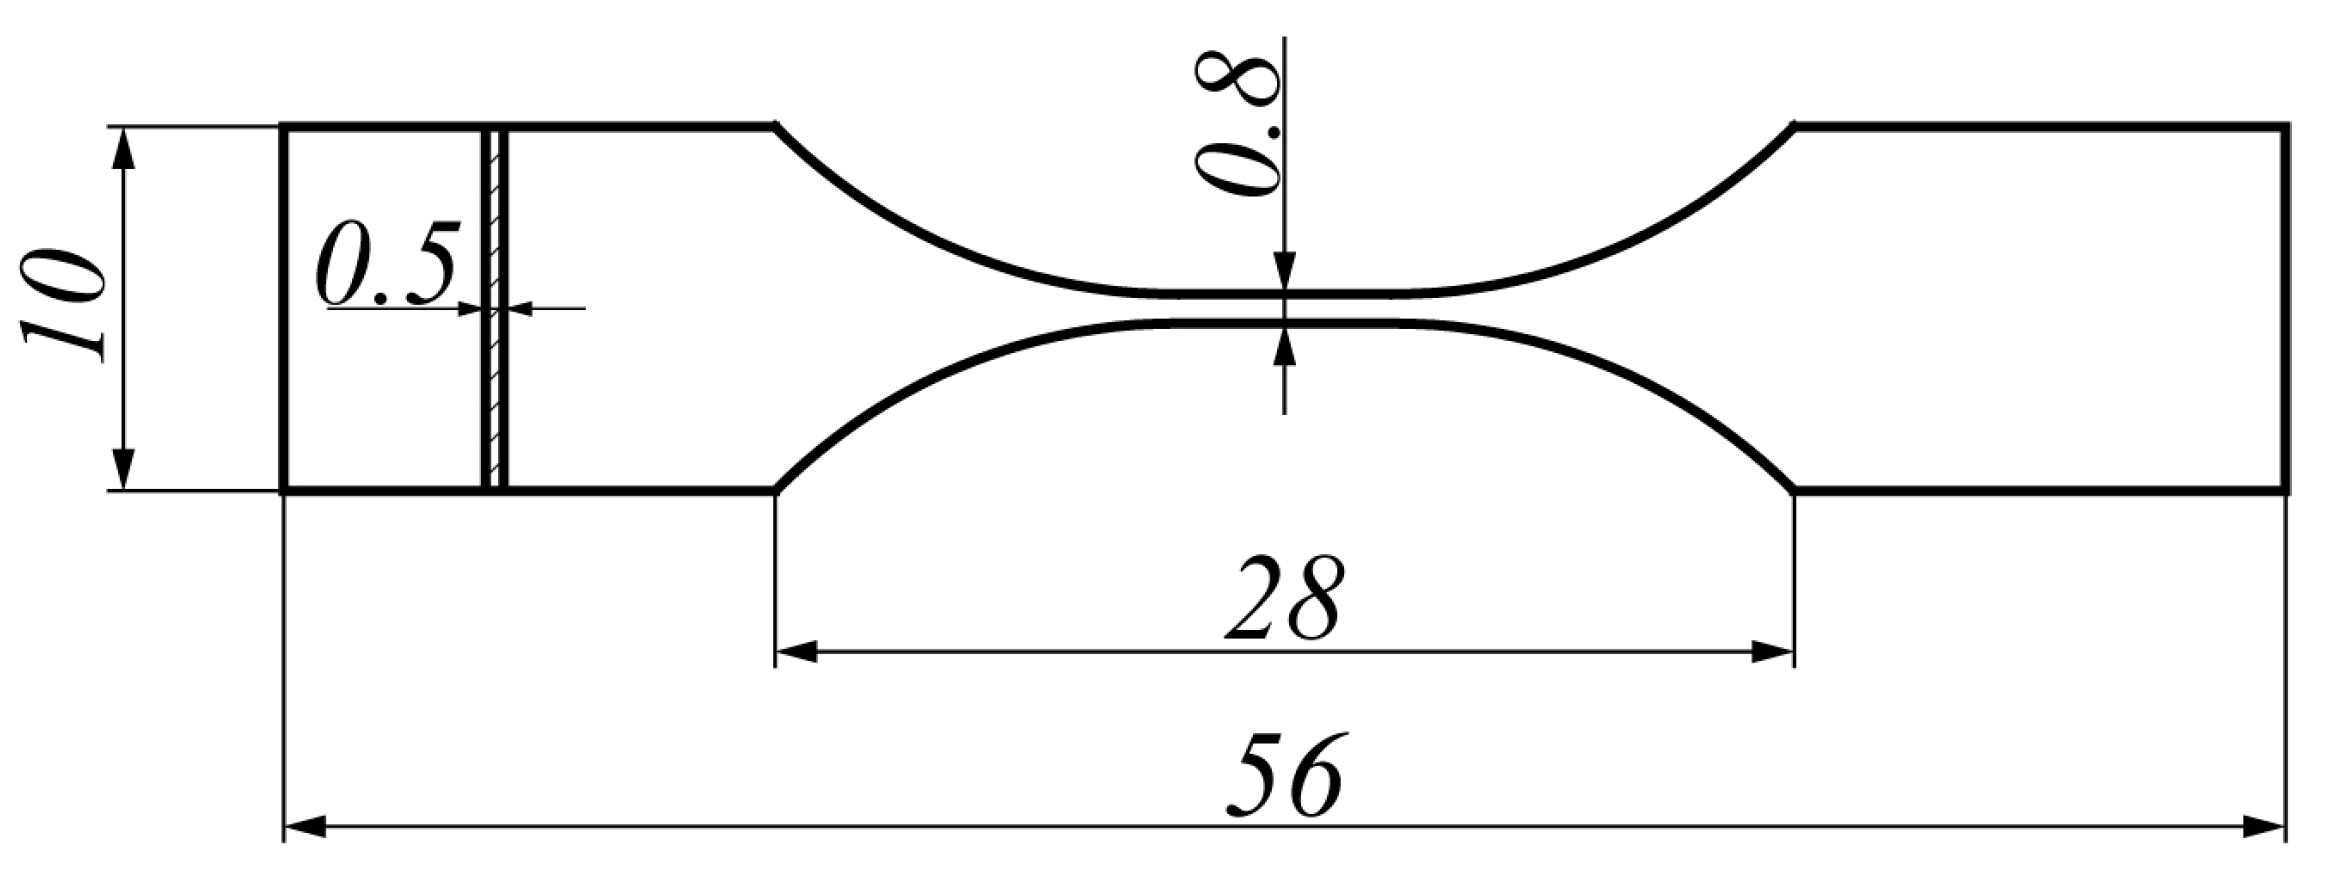
2.3.4. Dog-Bone Steel Specimens
3. System Dynamics Modelling and Simulation Analysis
3.1. Structural Design
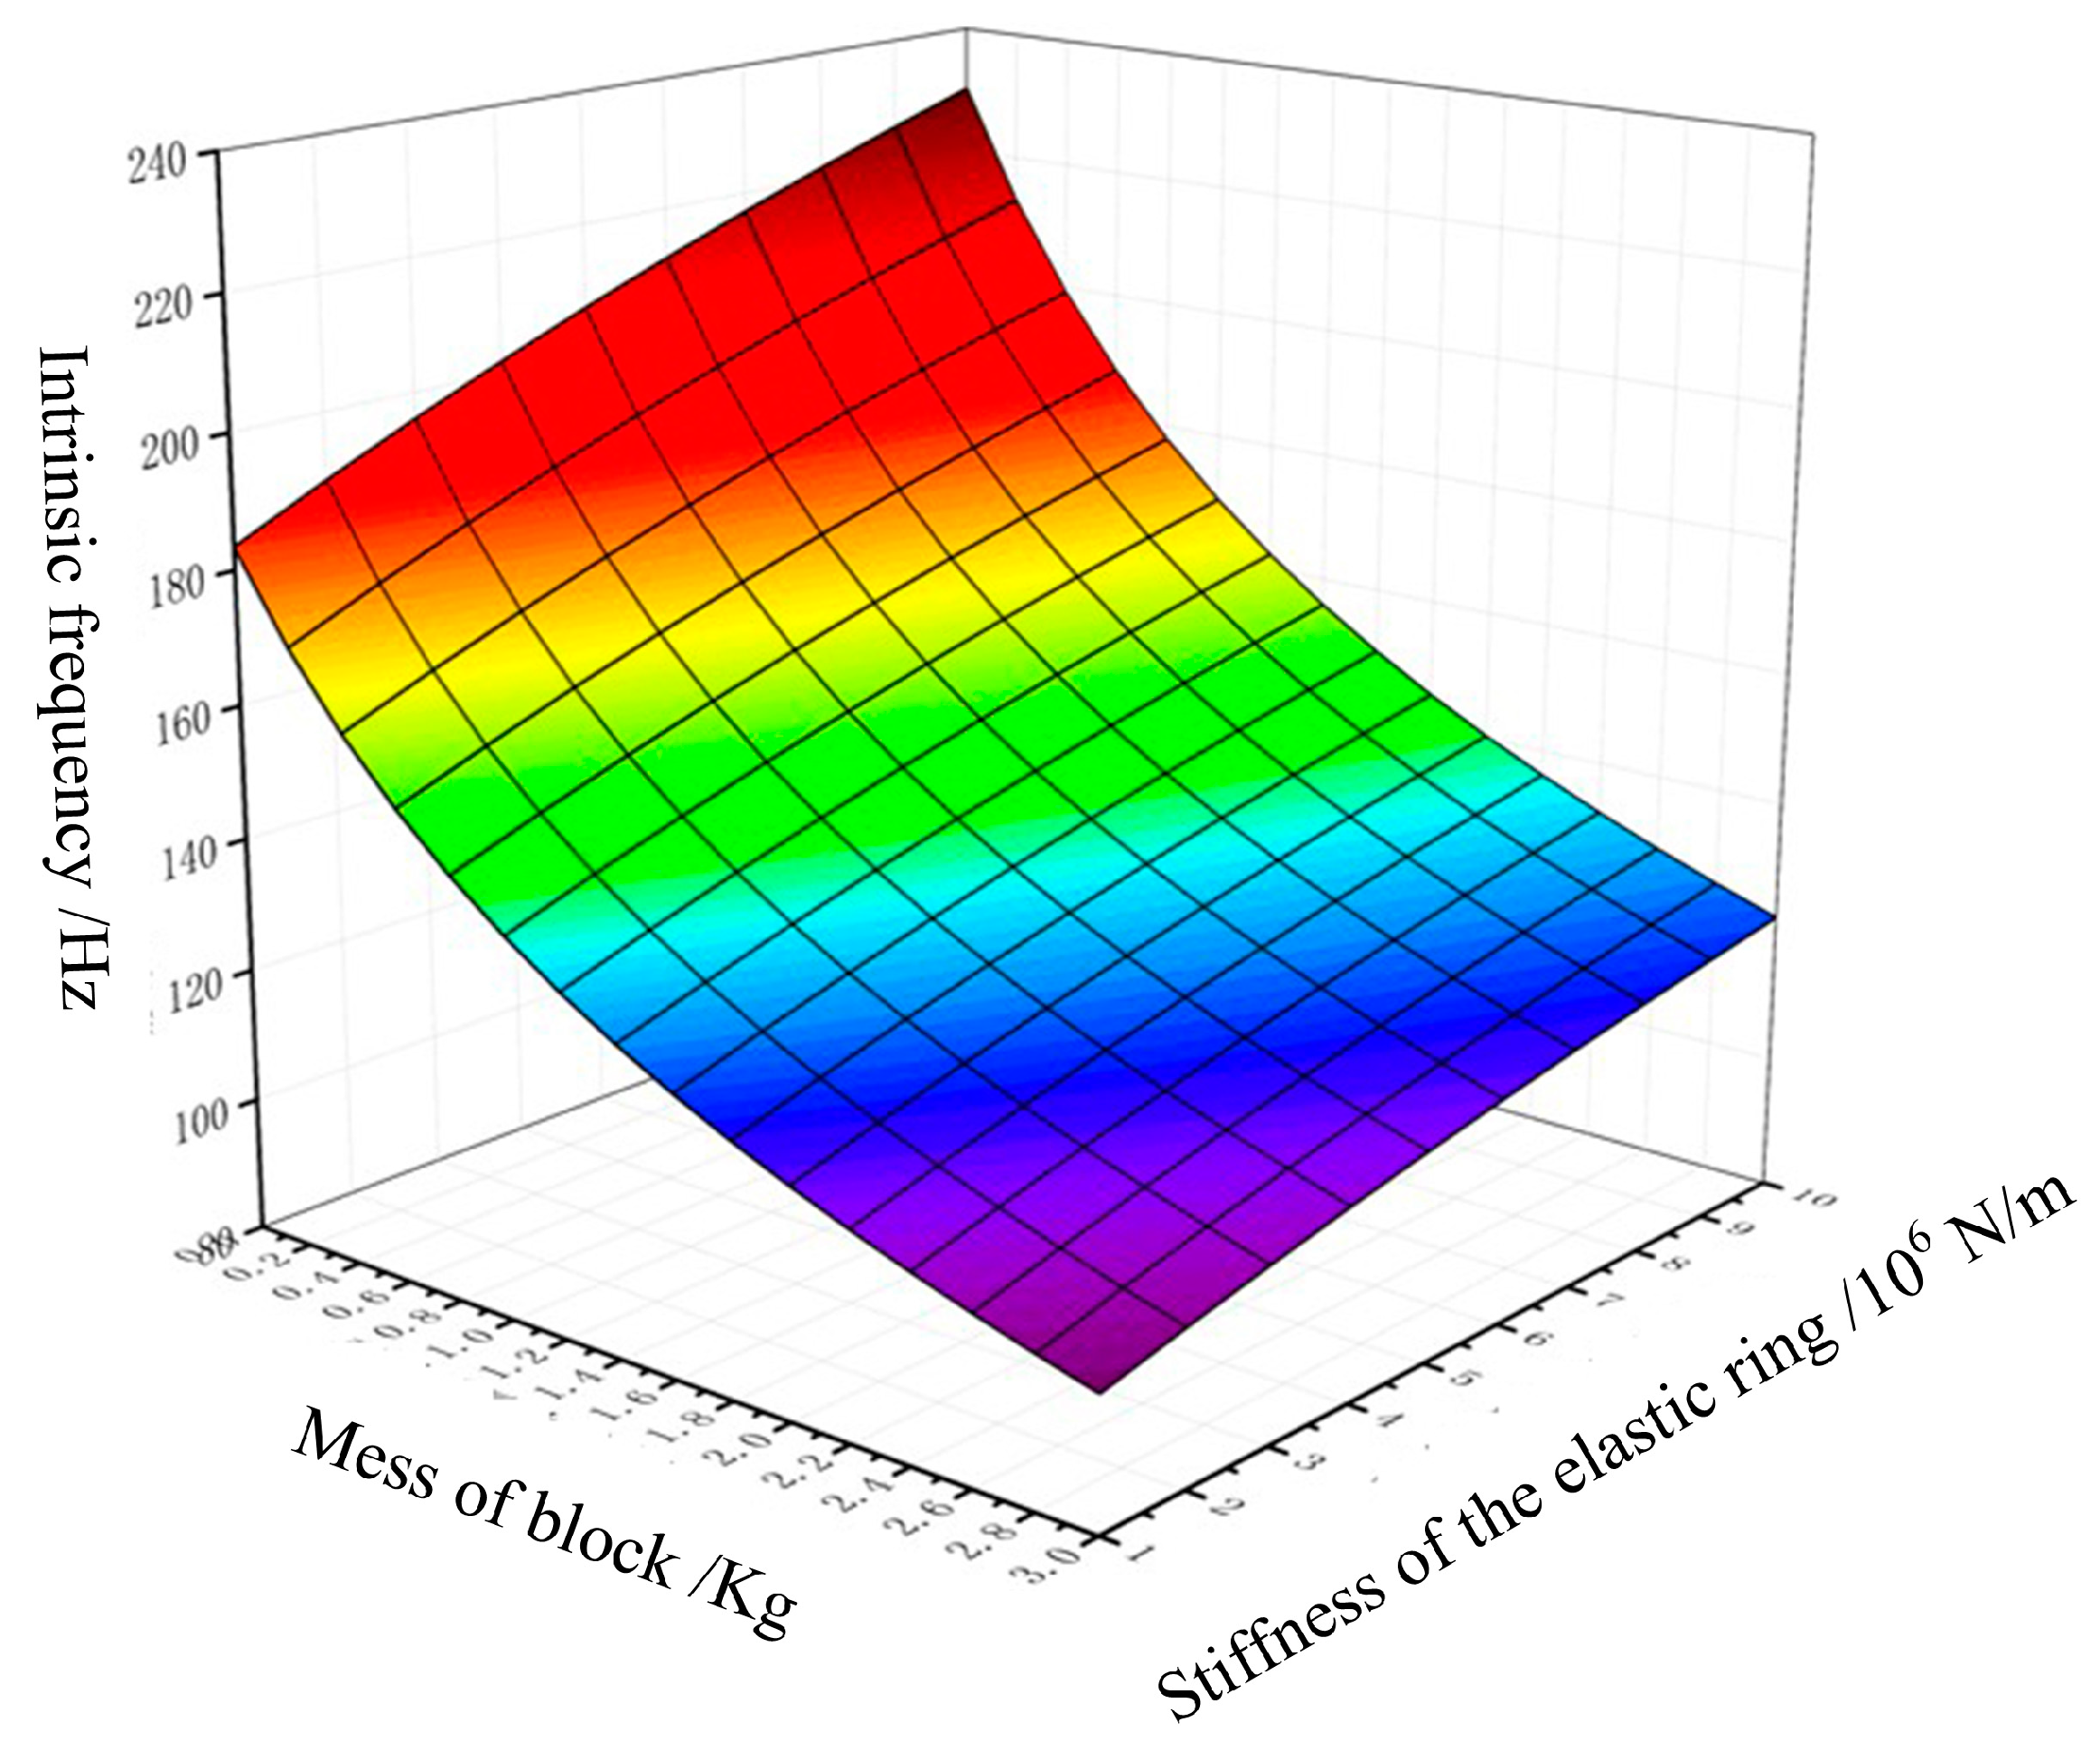
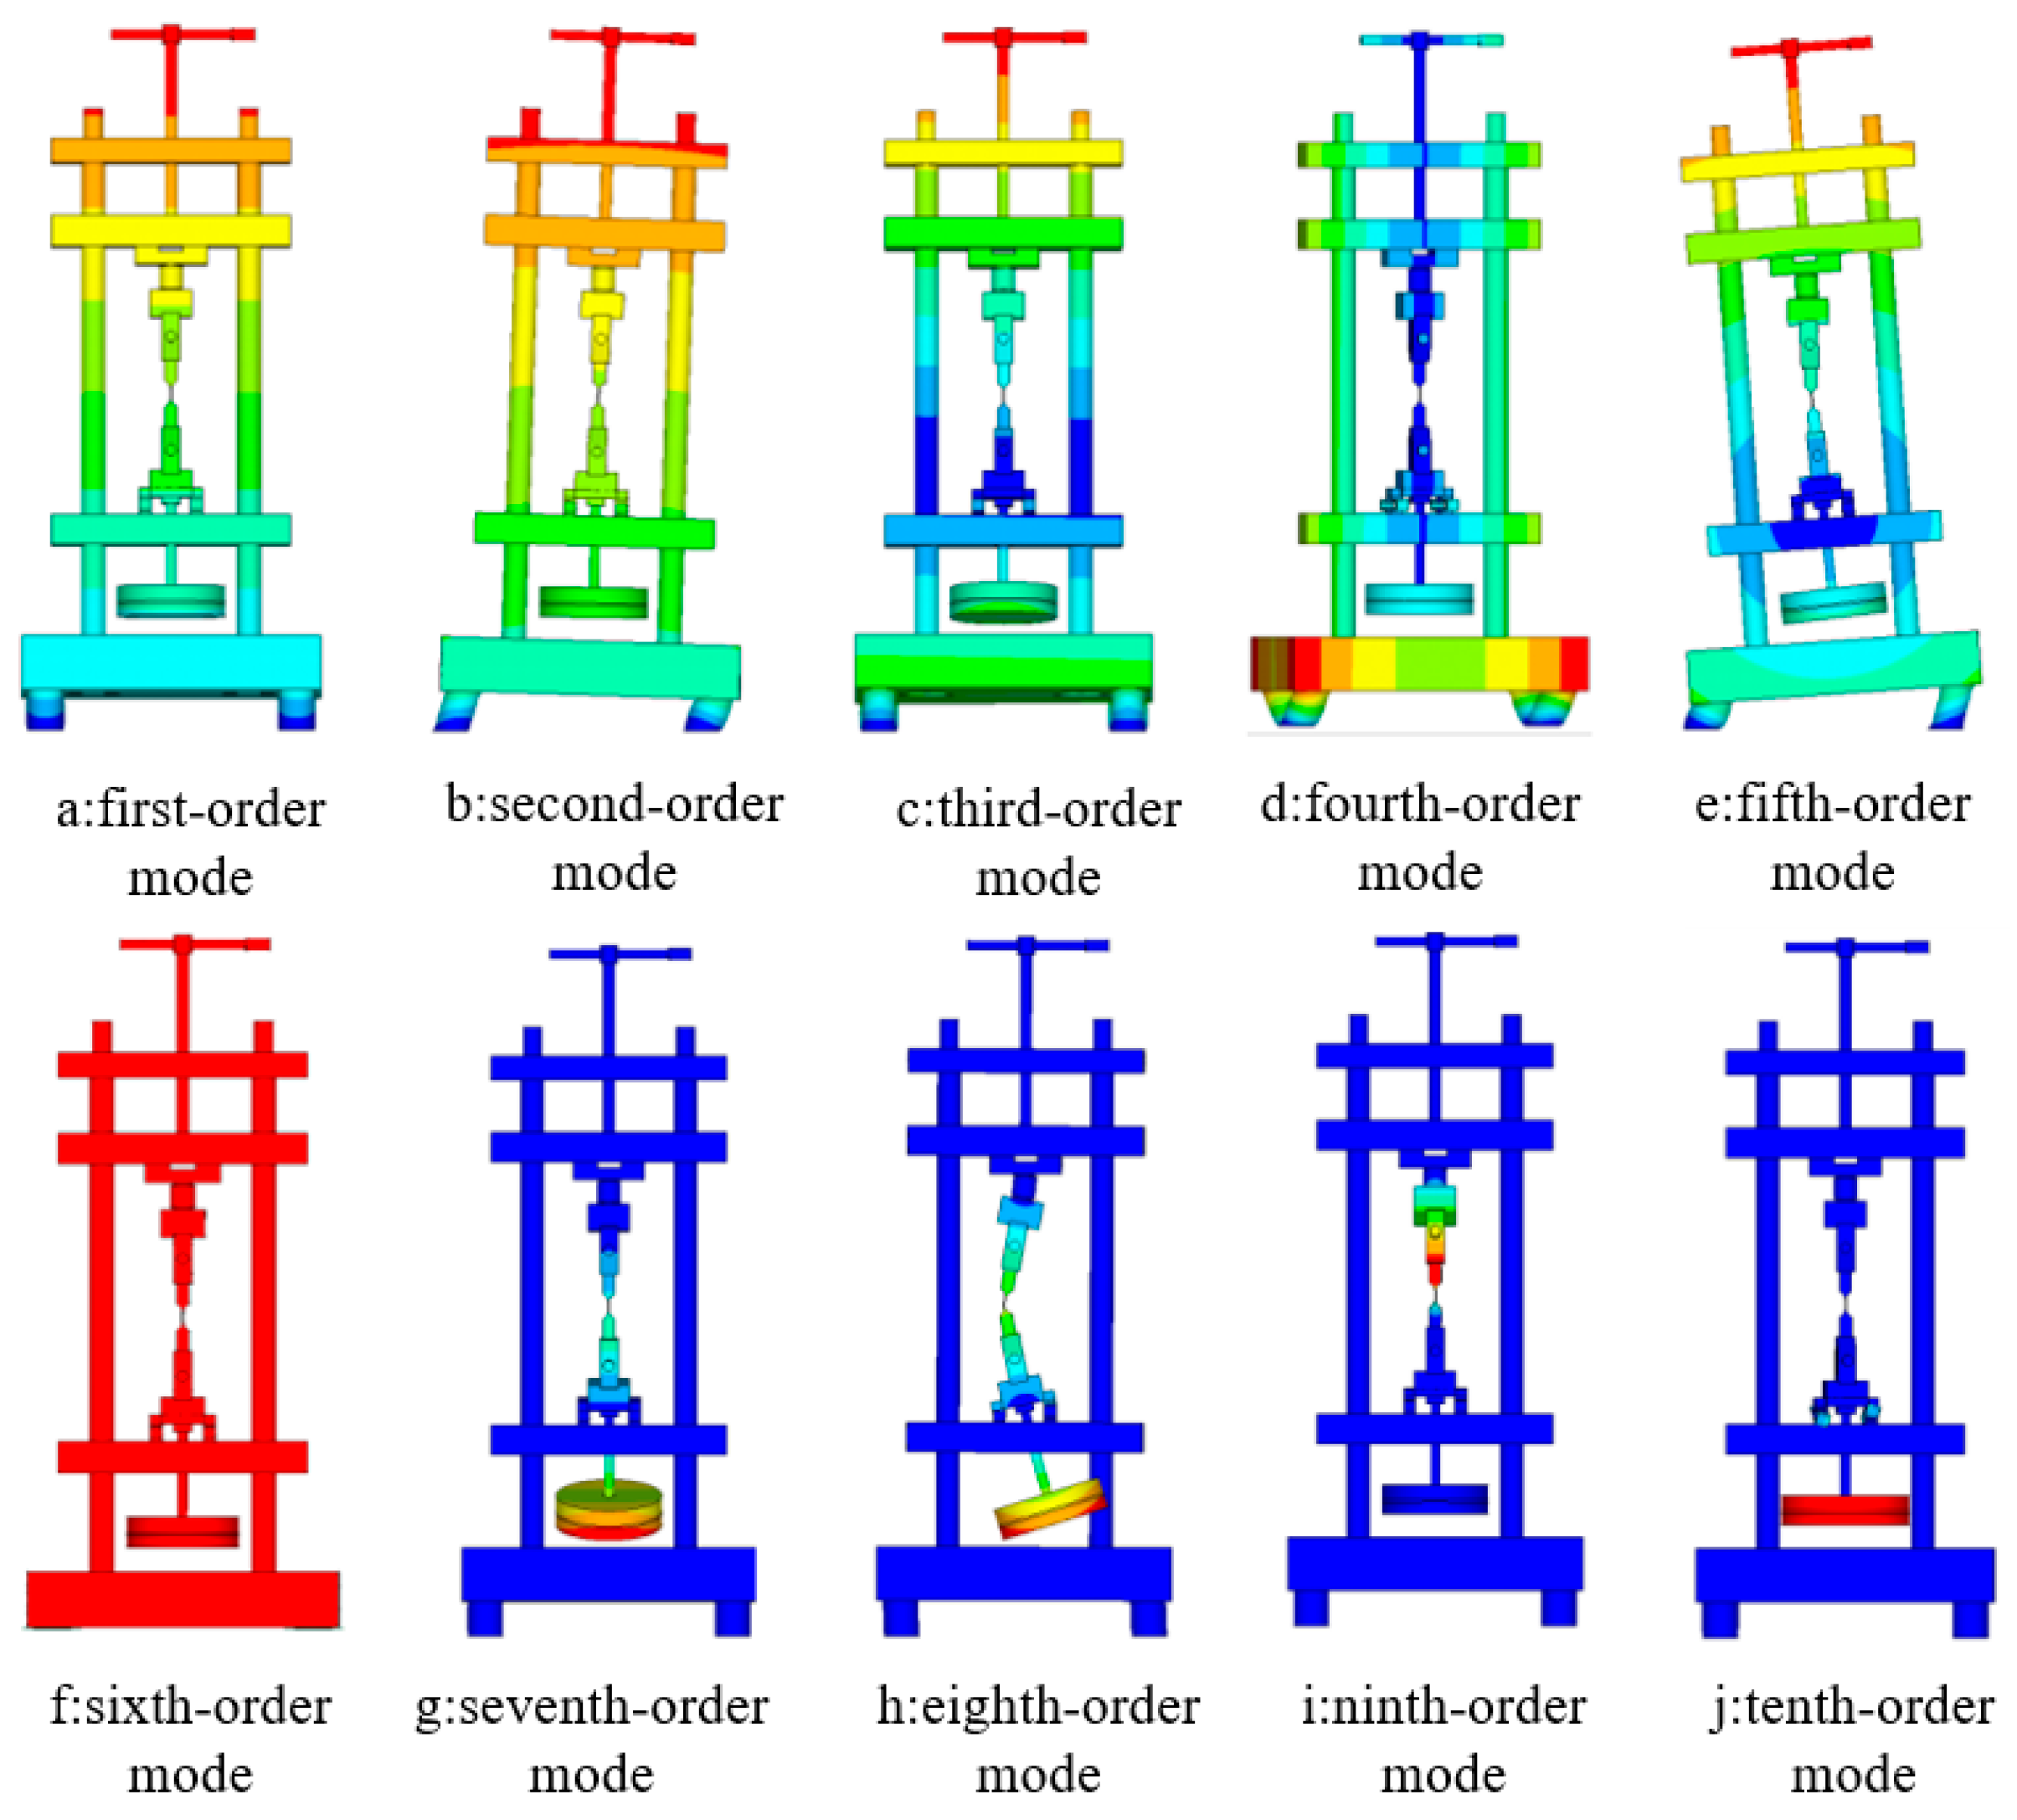
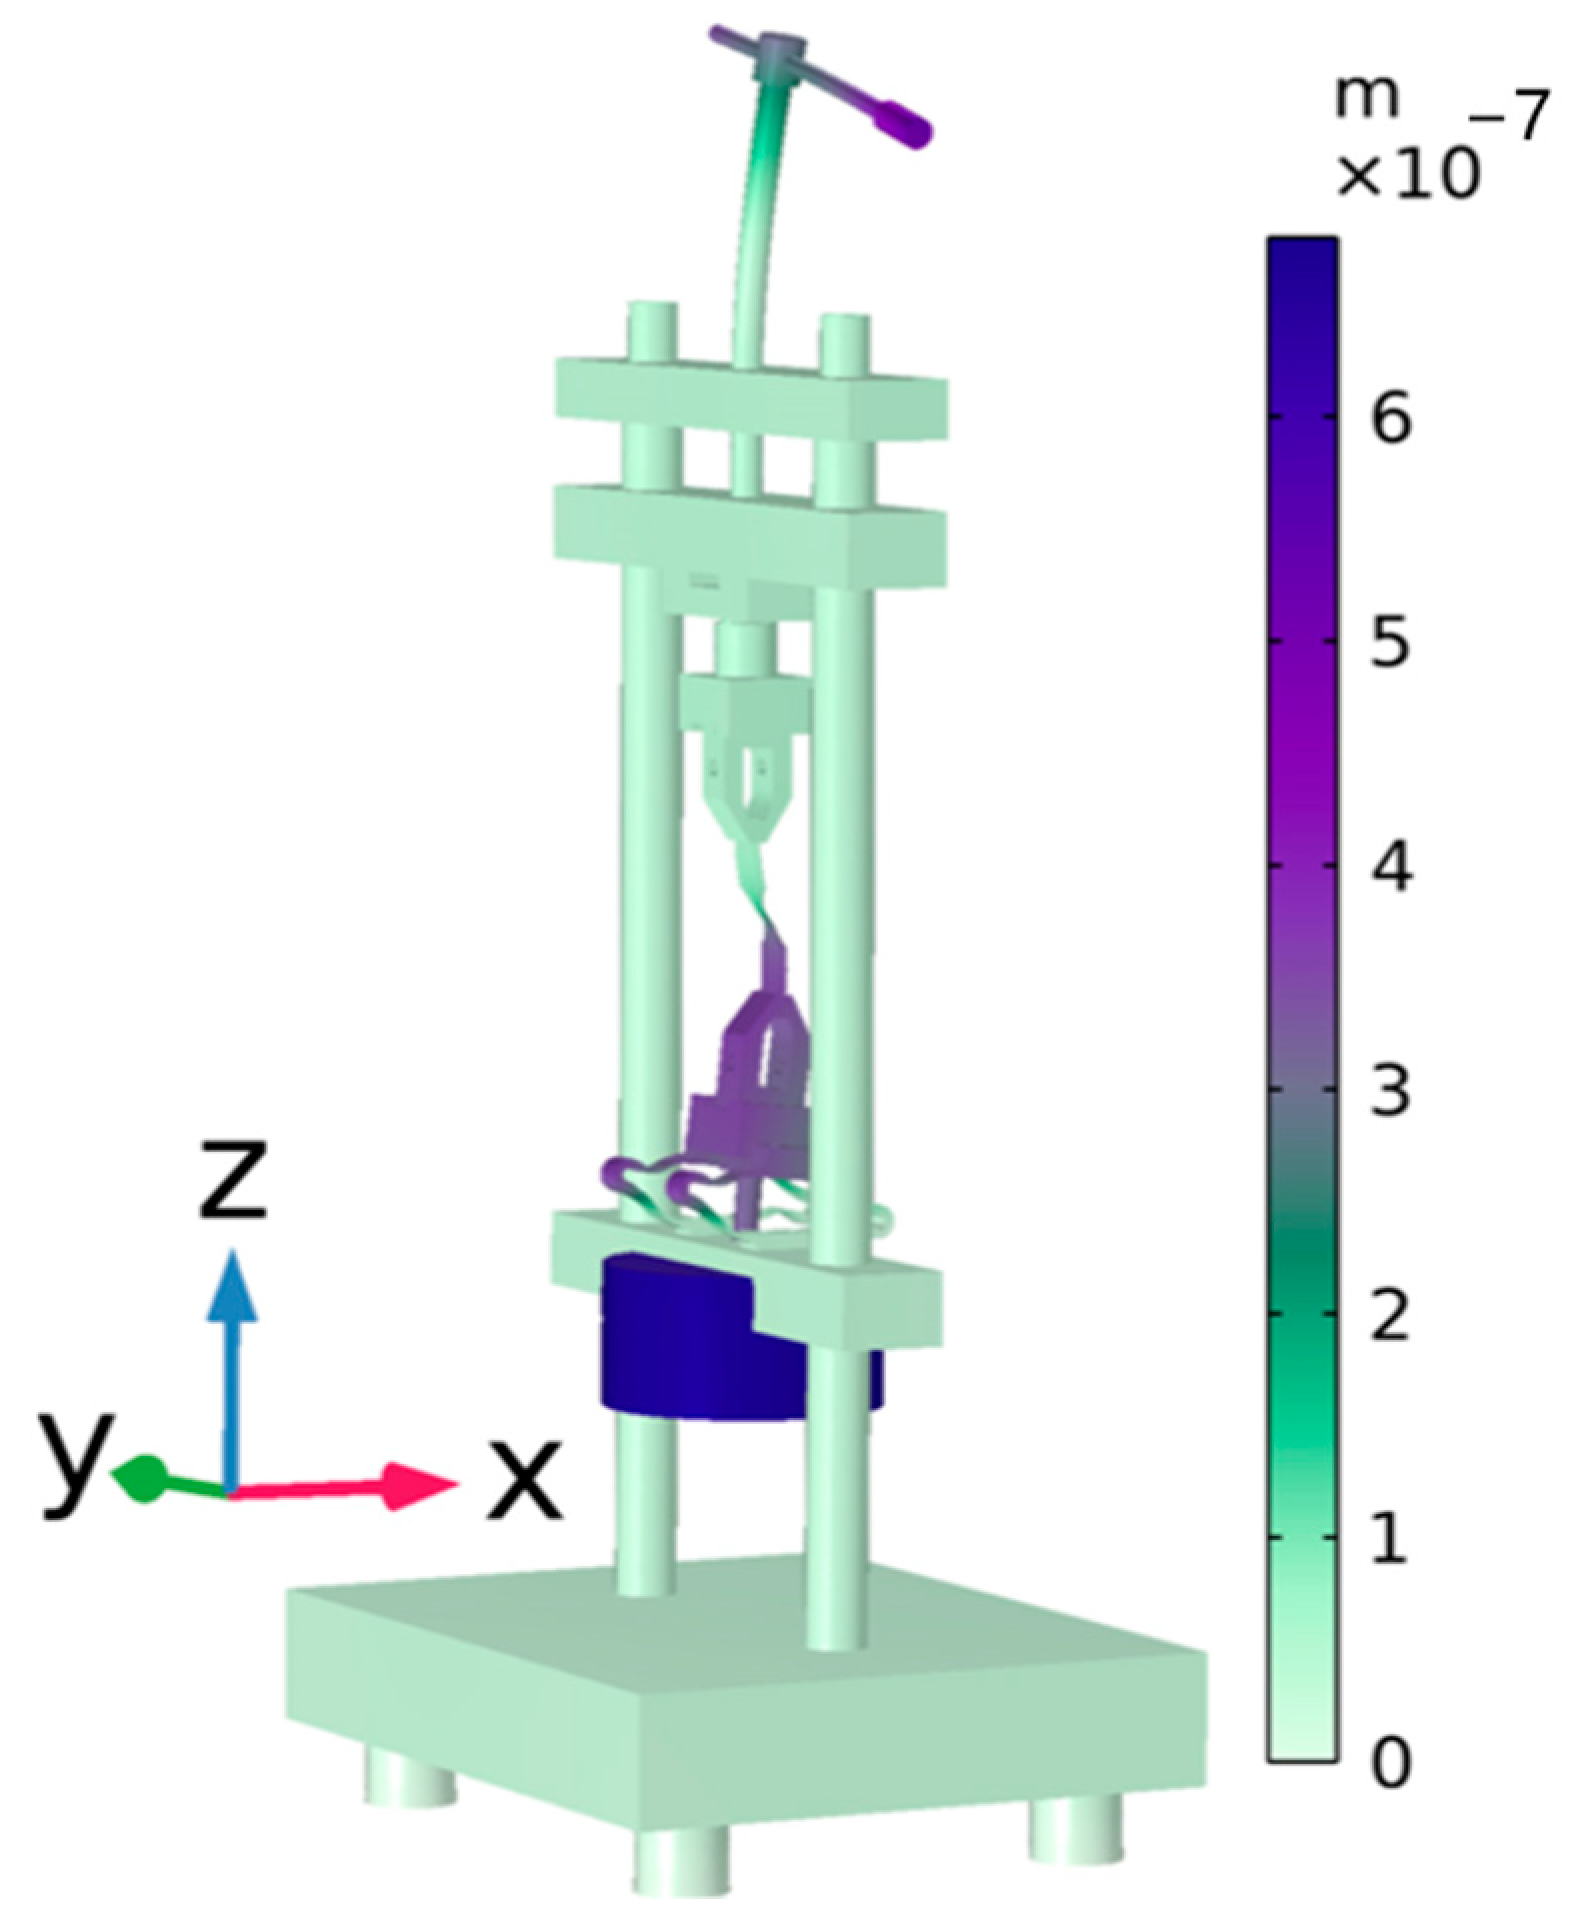
3.2. Simulation Analysis
4. Trial Tests
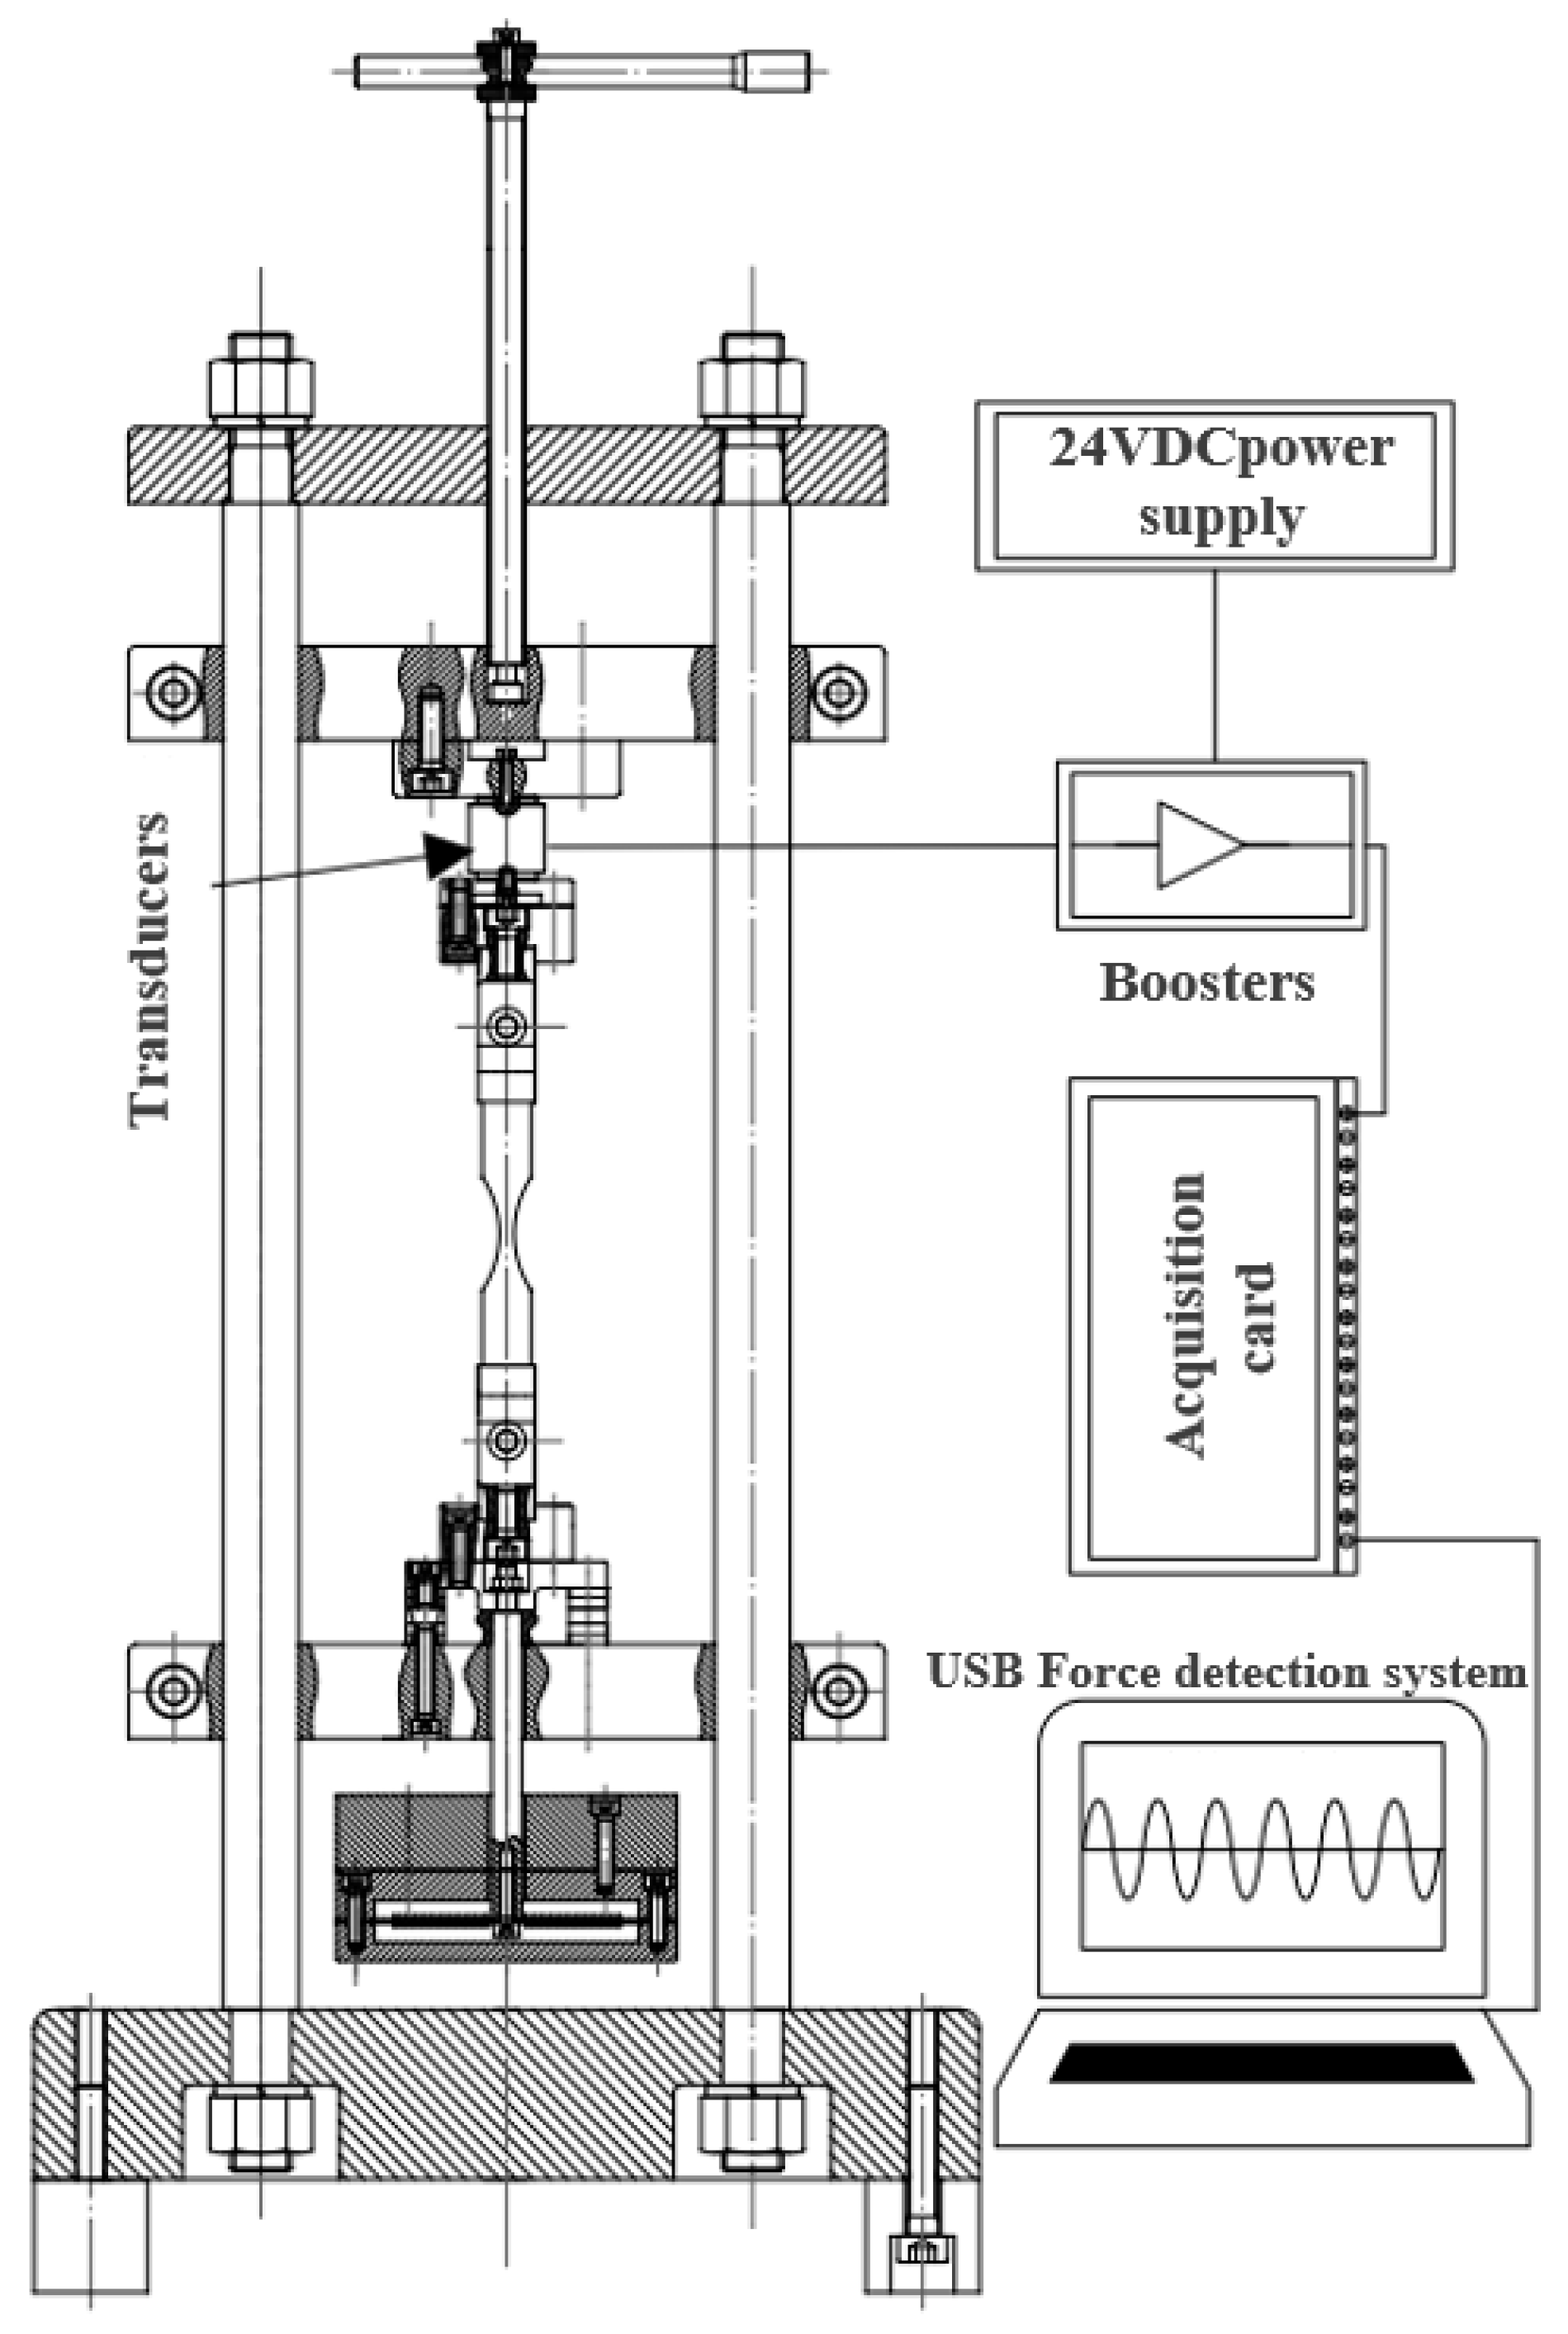
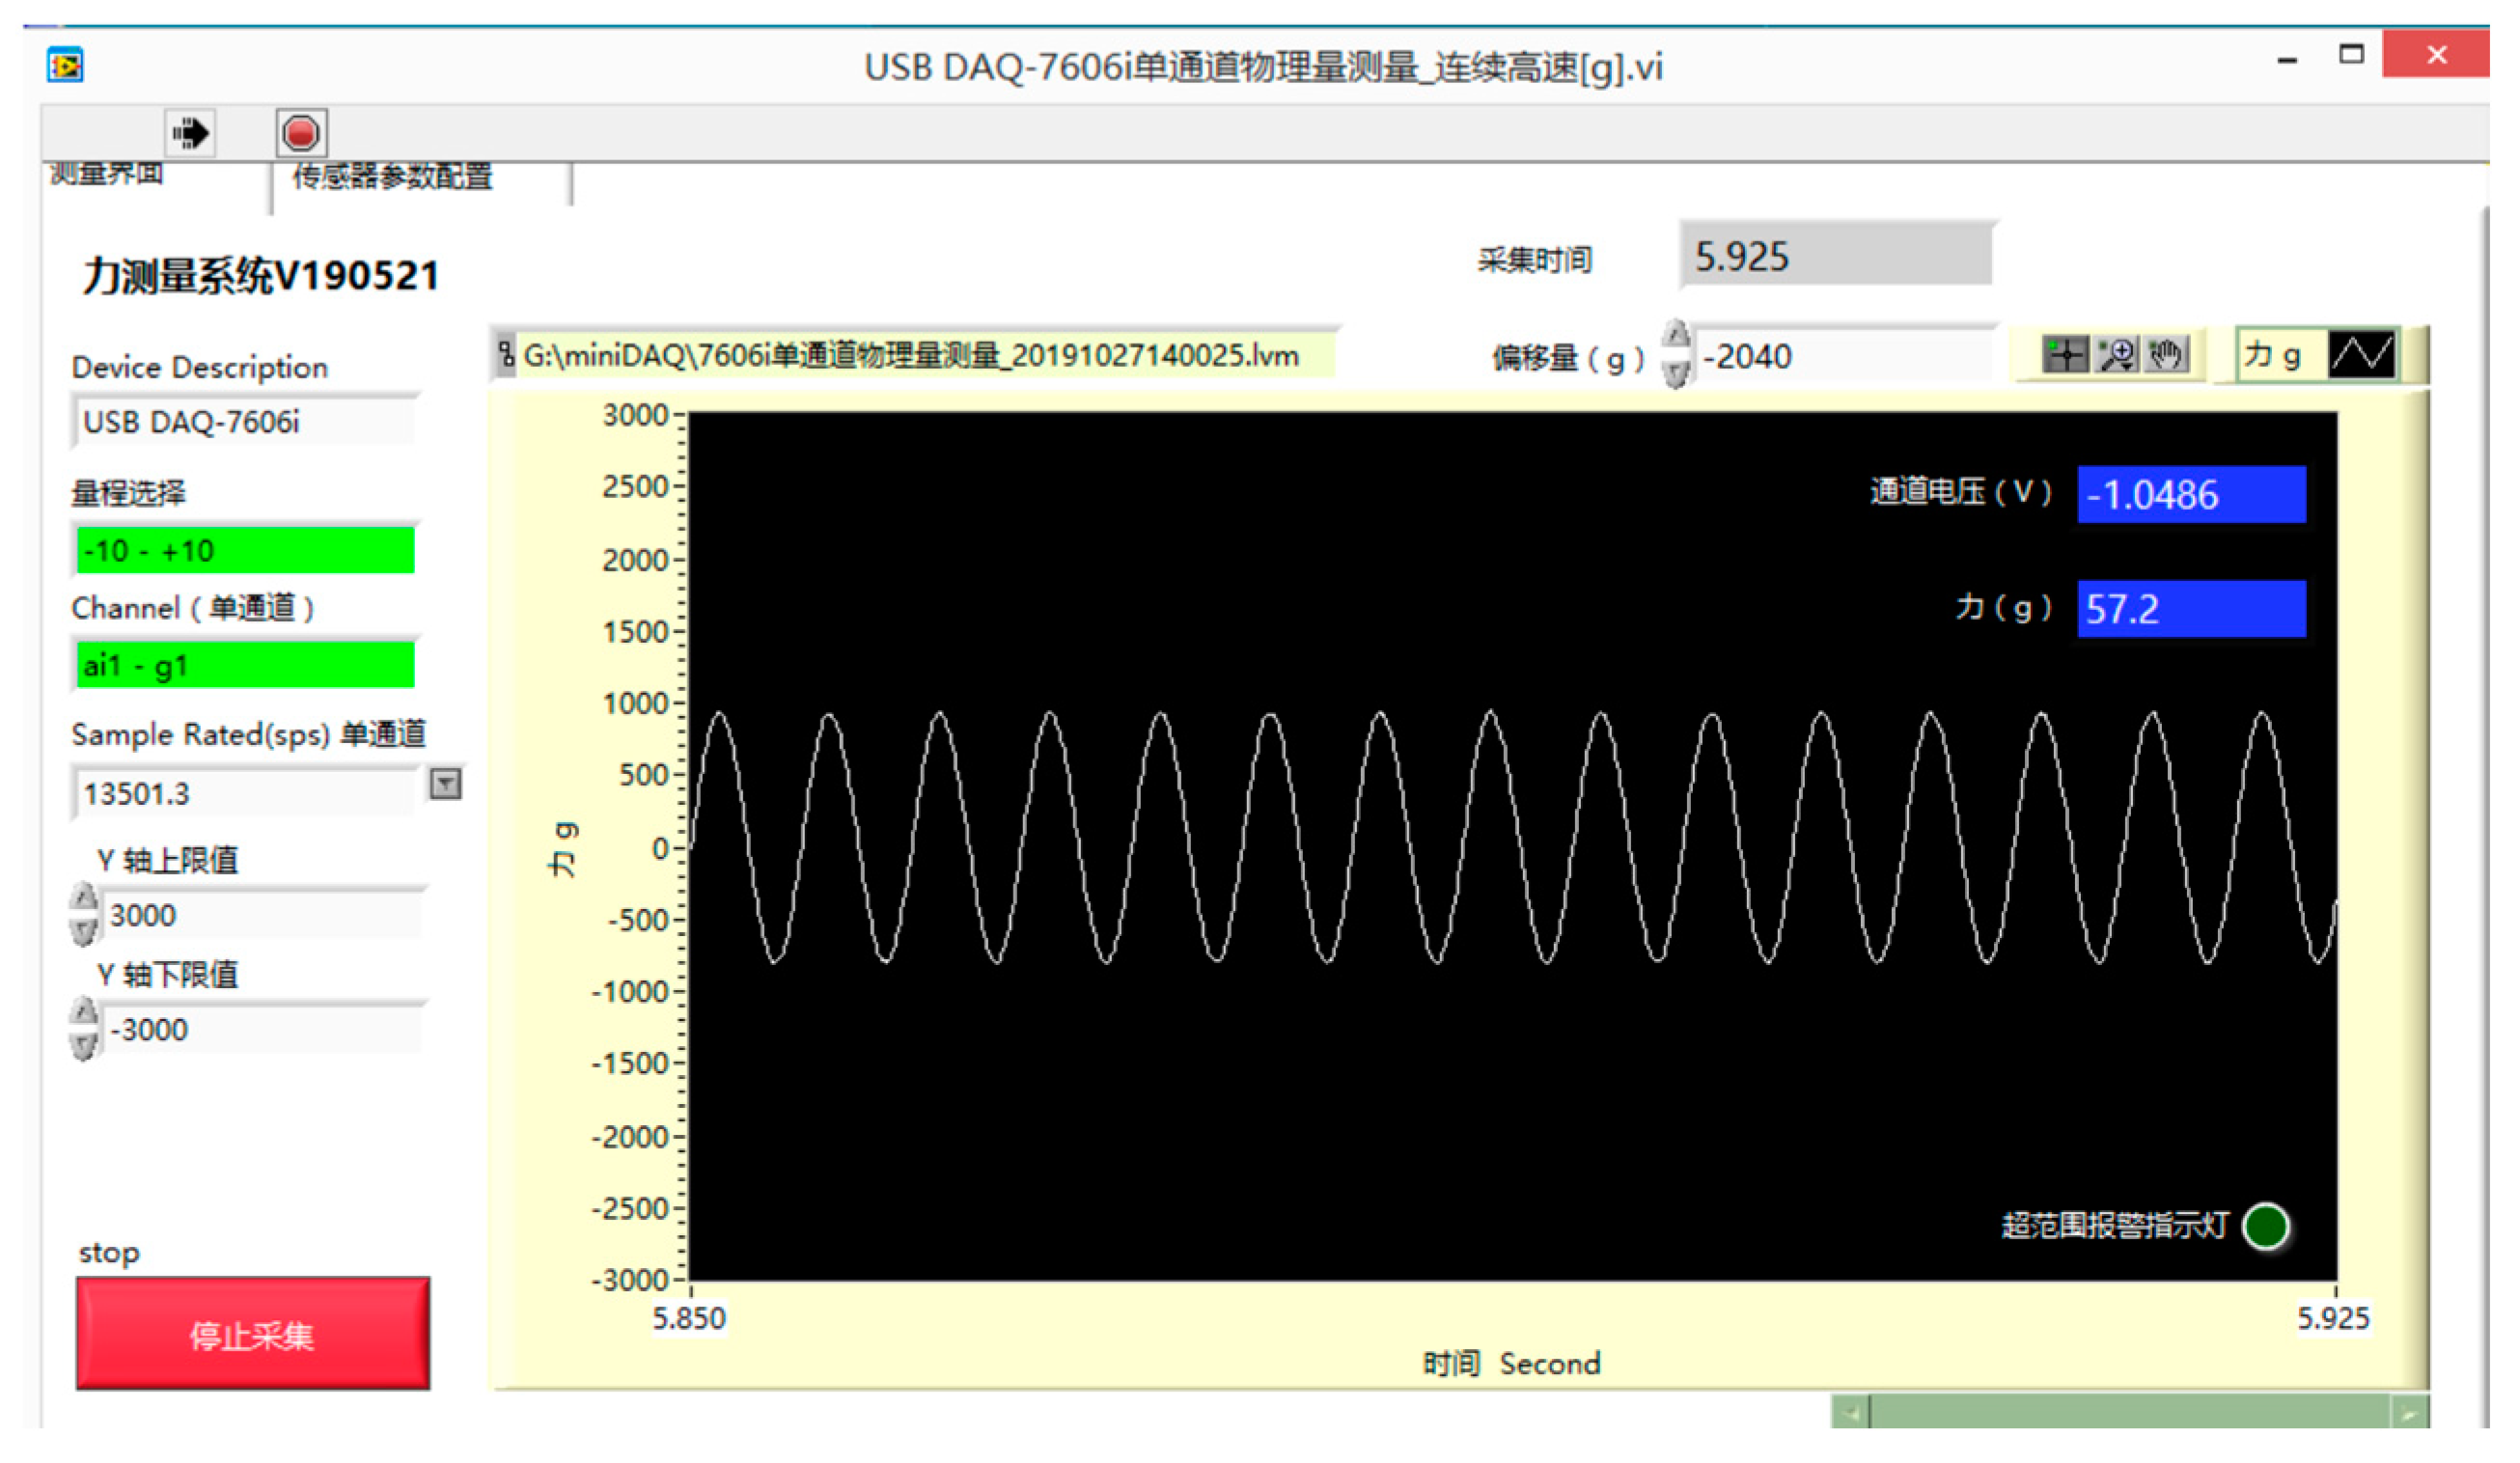
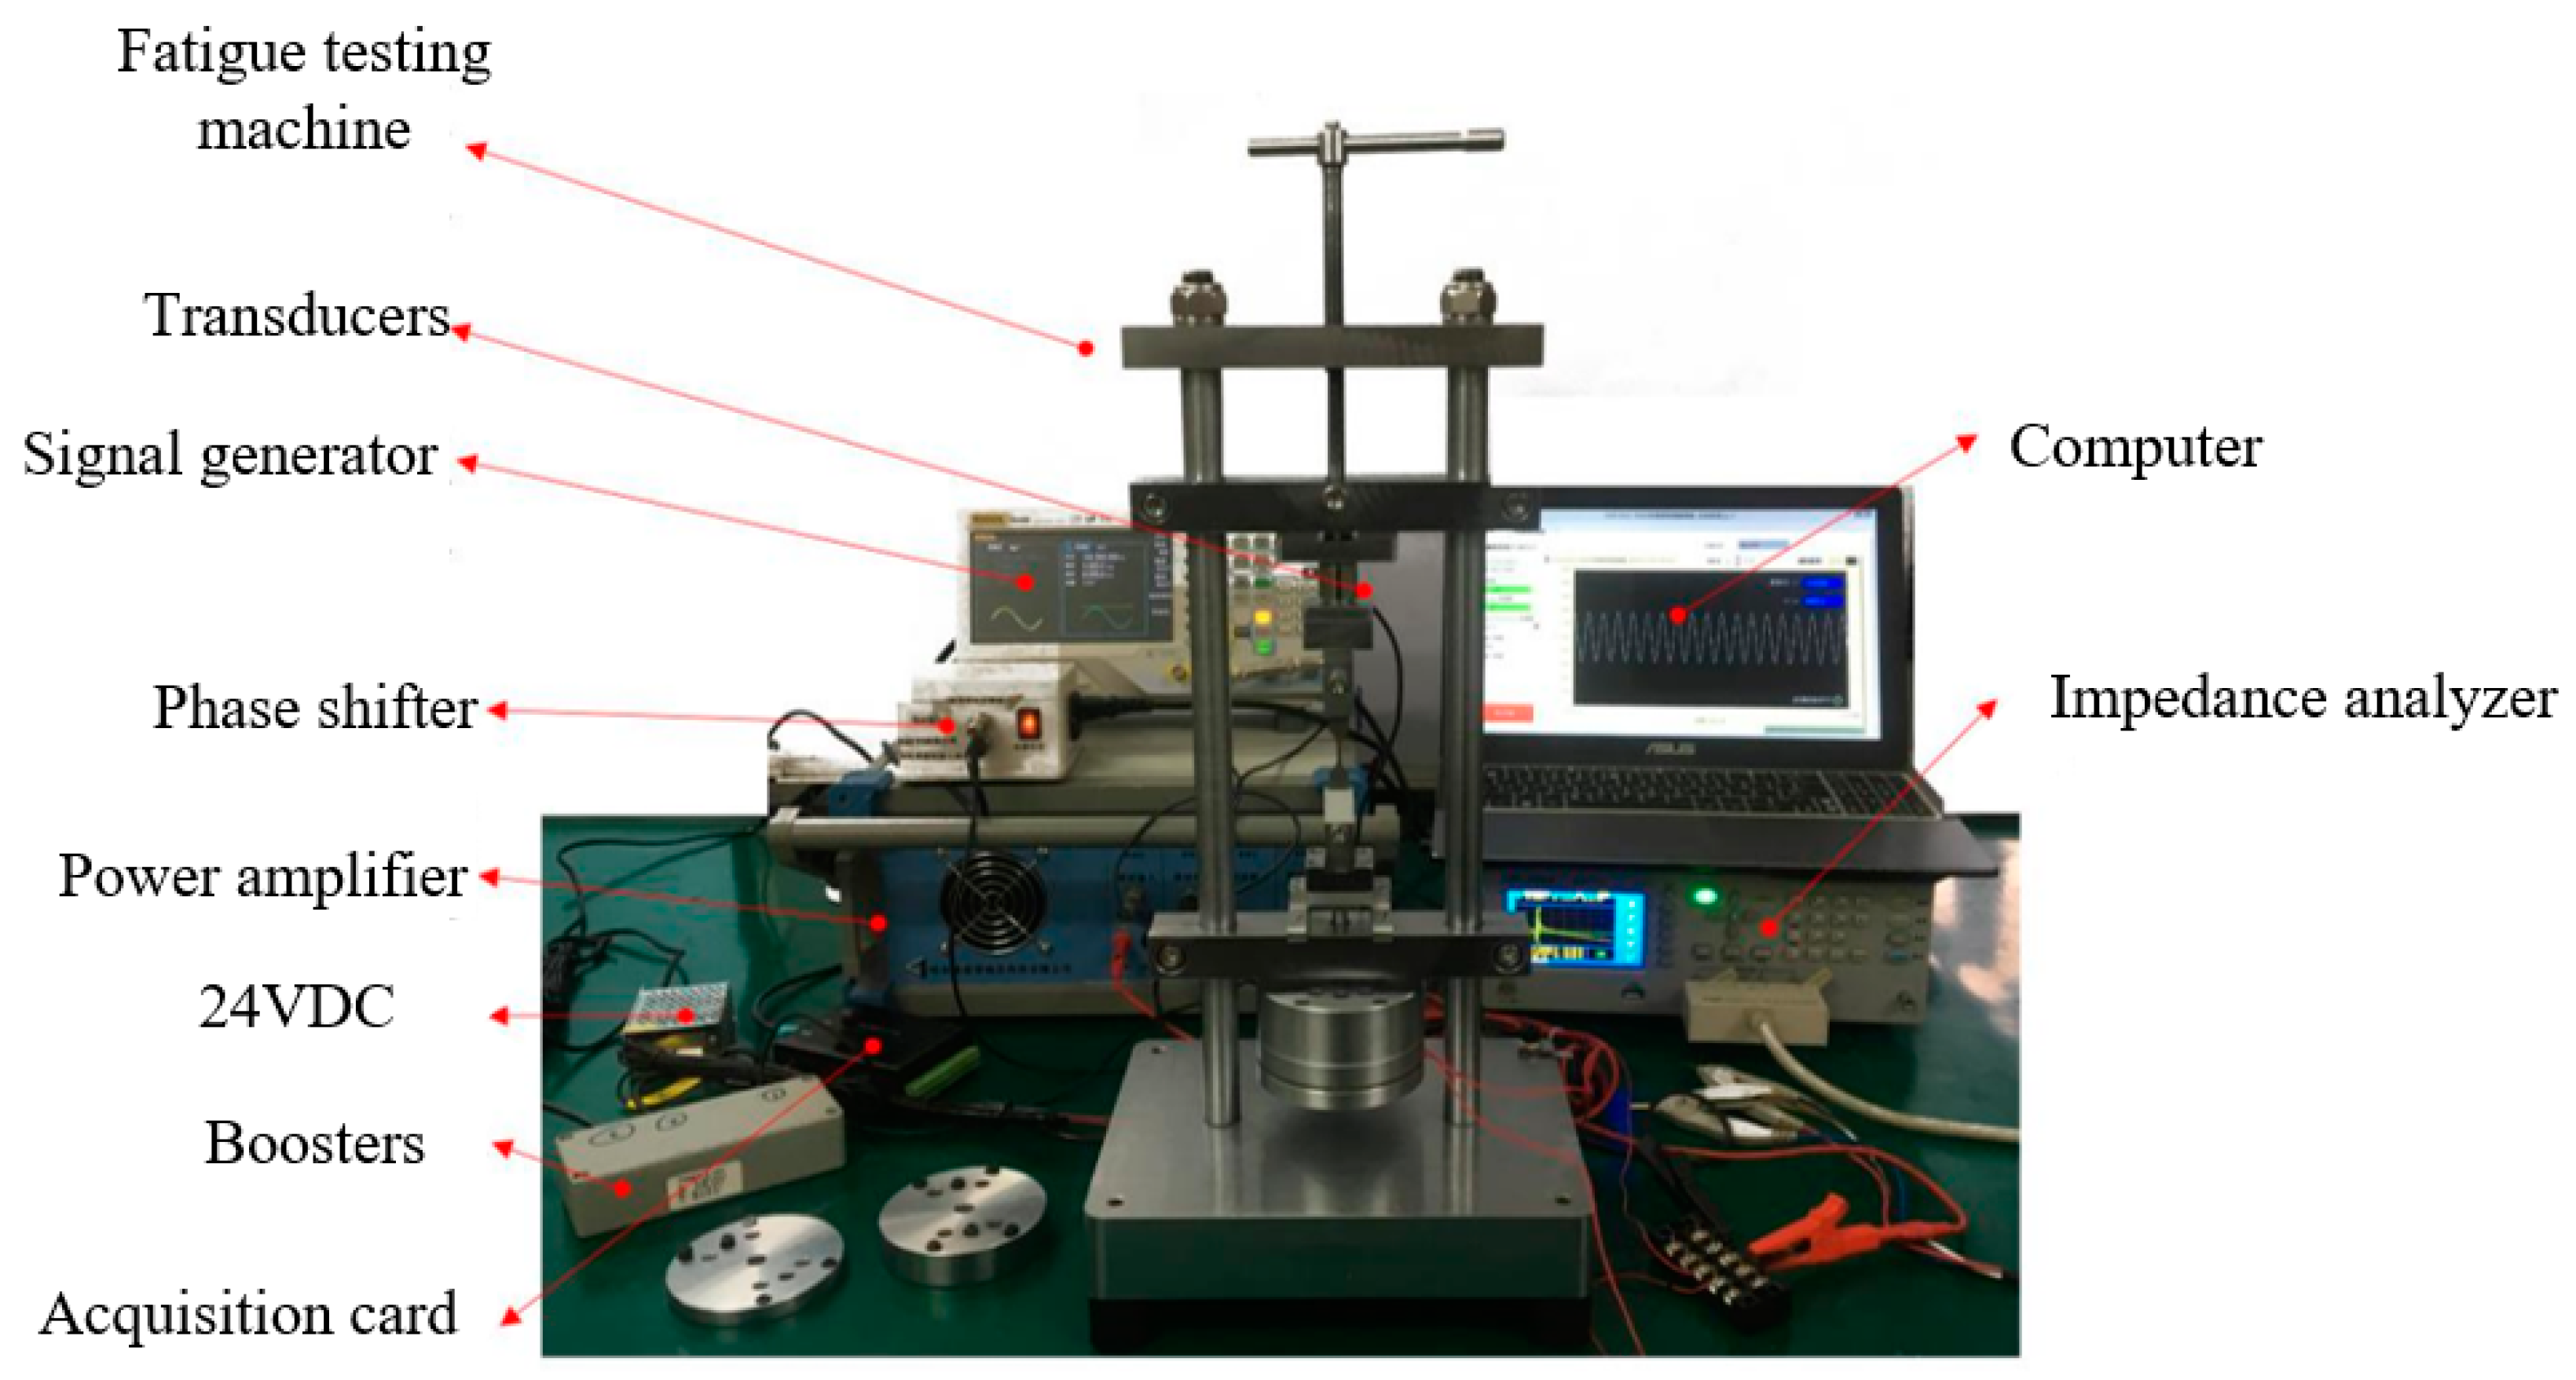
4.1. Test System Construction and Test Methods
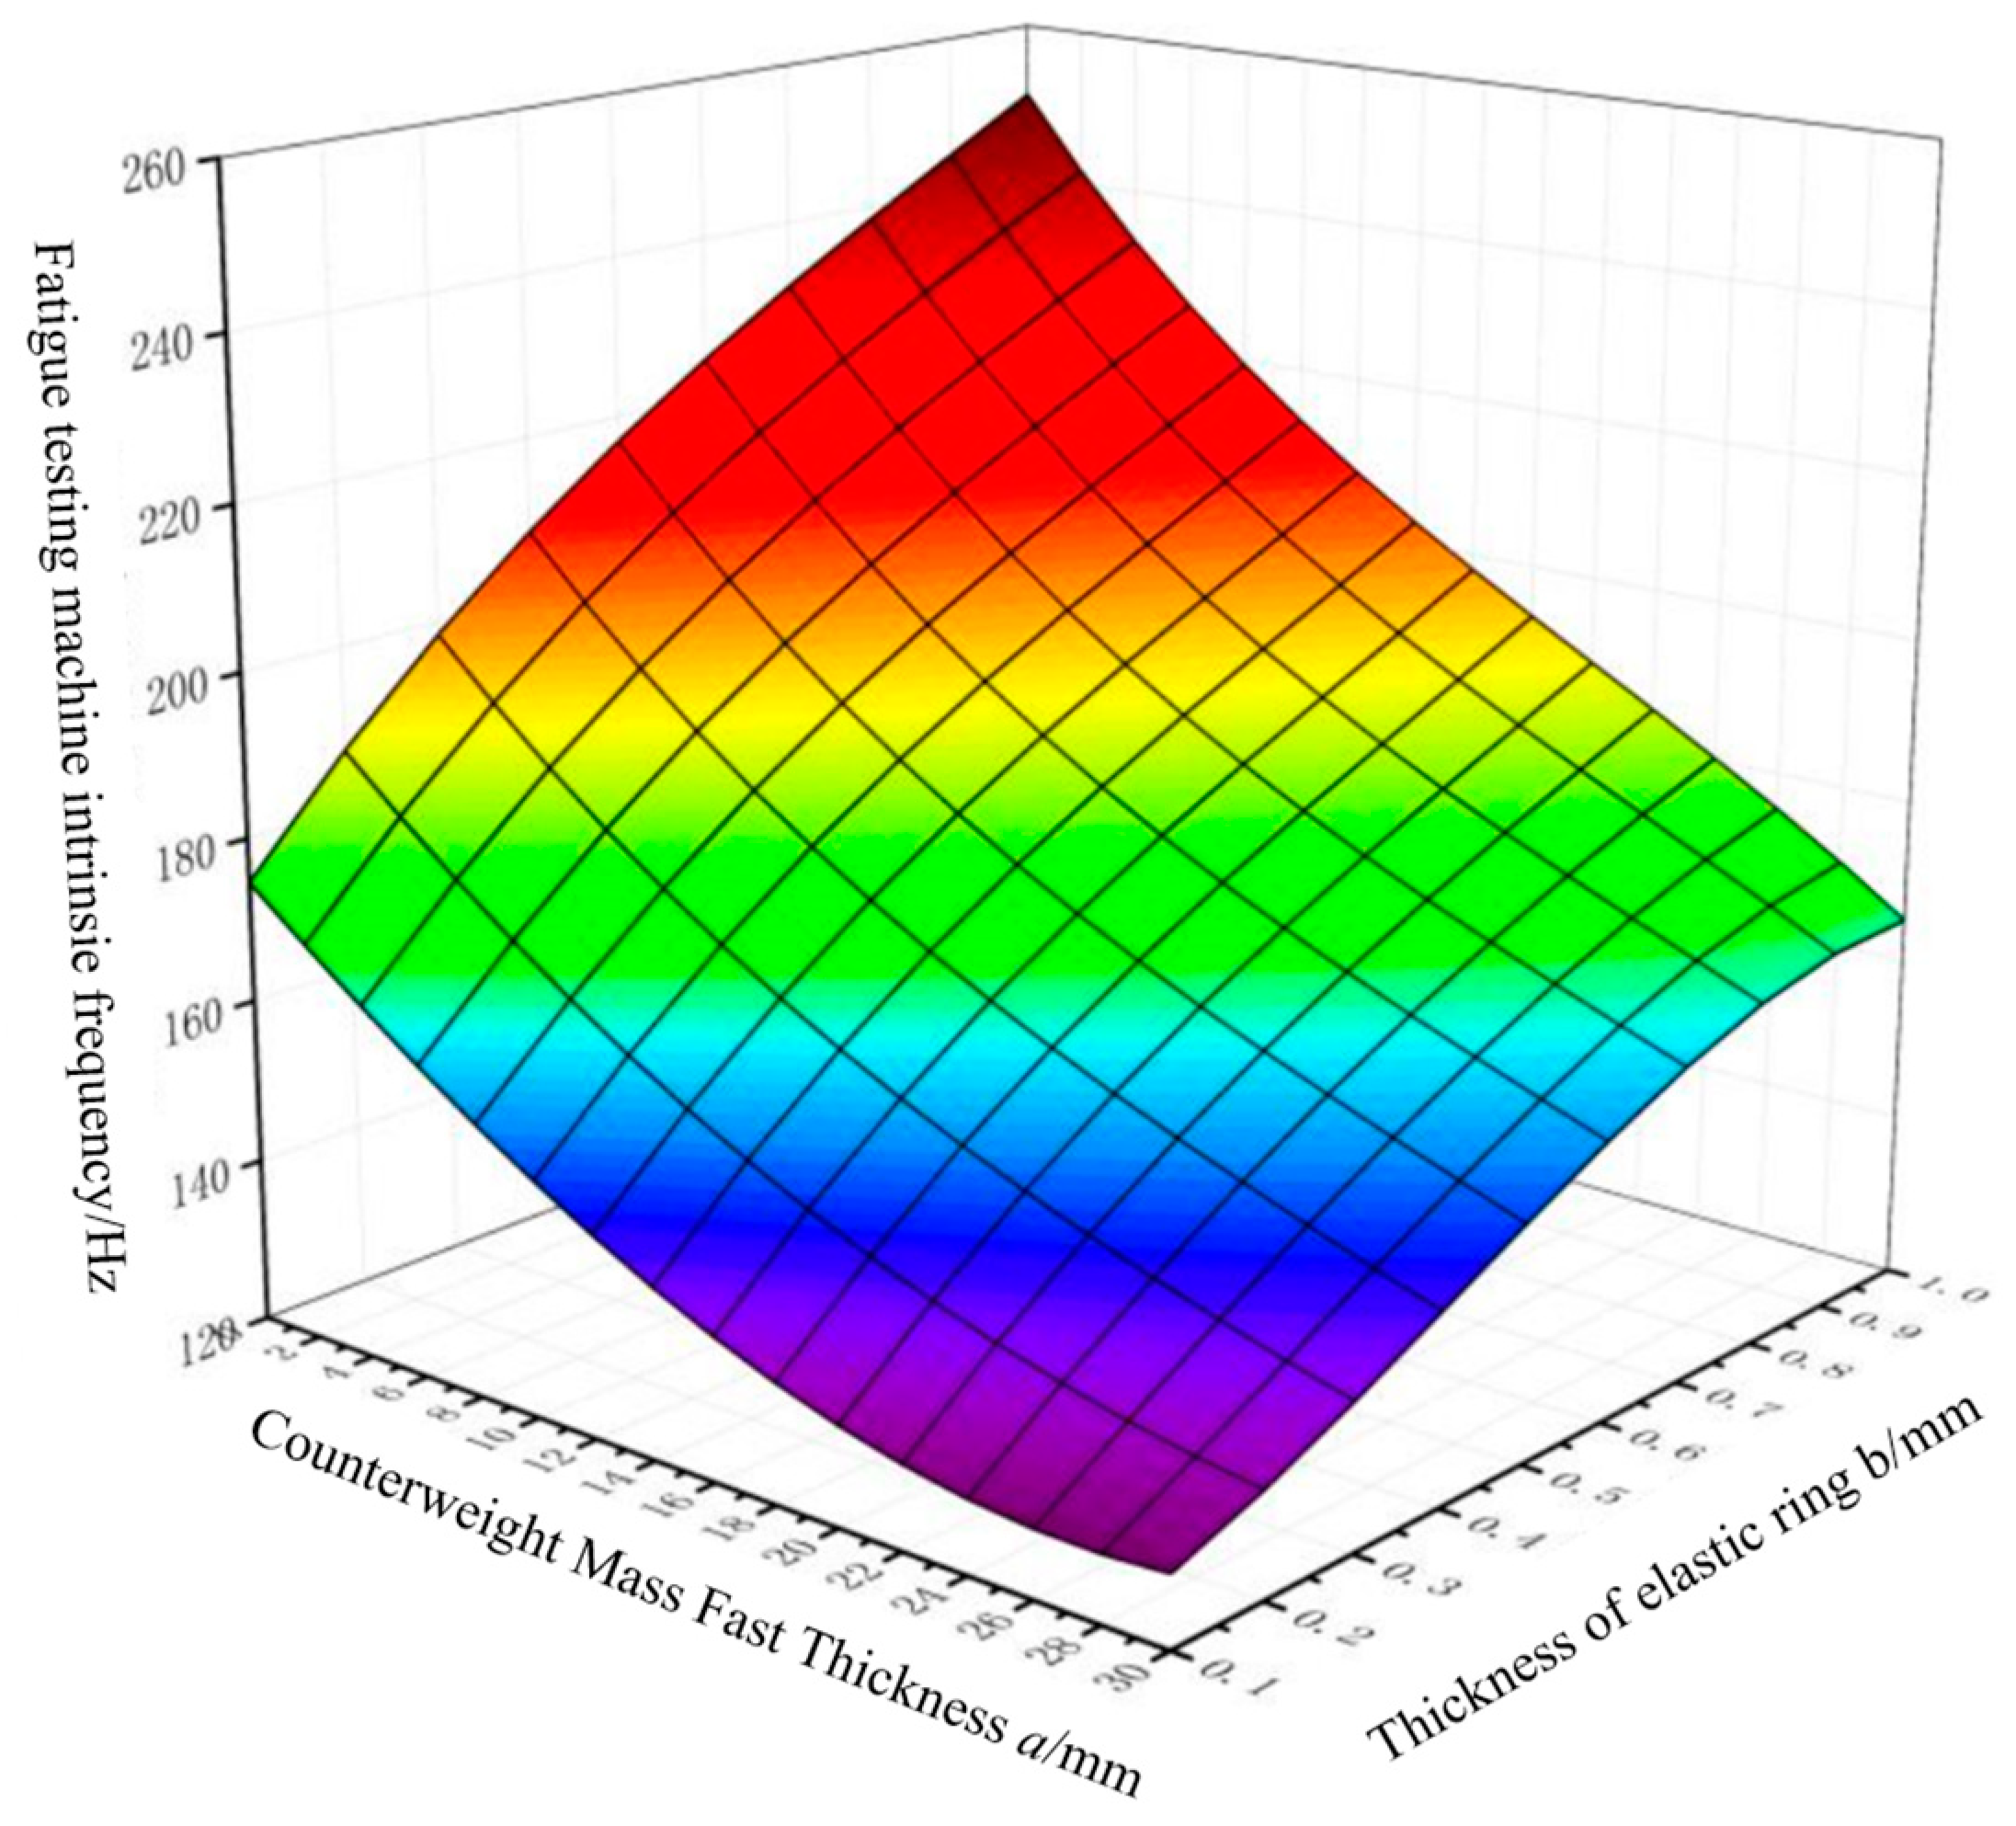
4.2. System Intrinsic Frequency Impact Factor Testing
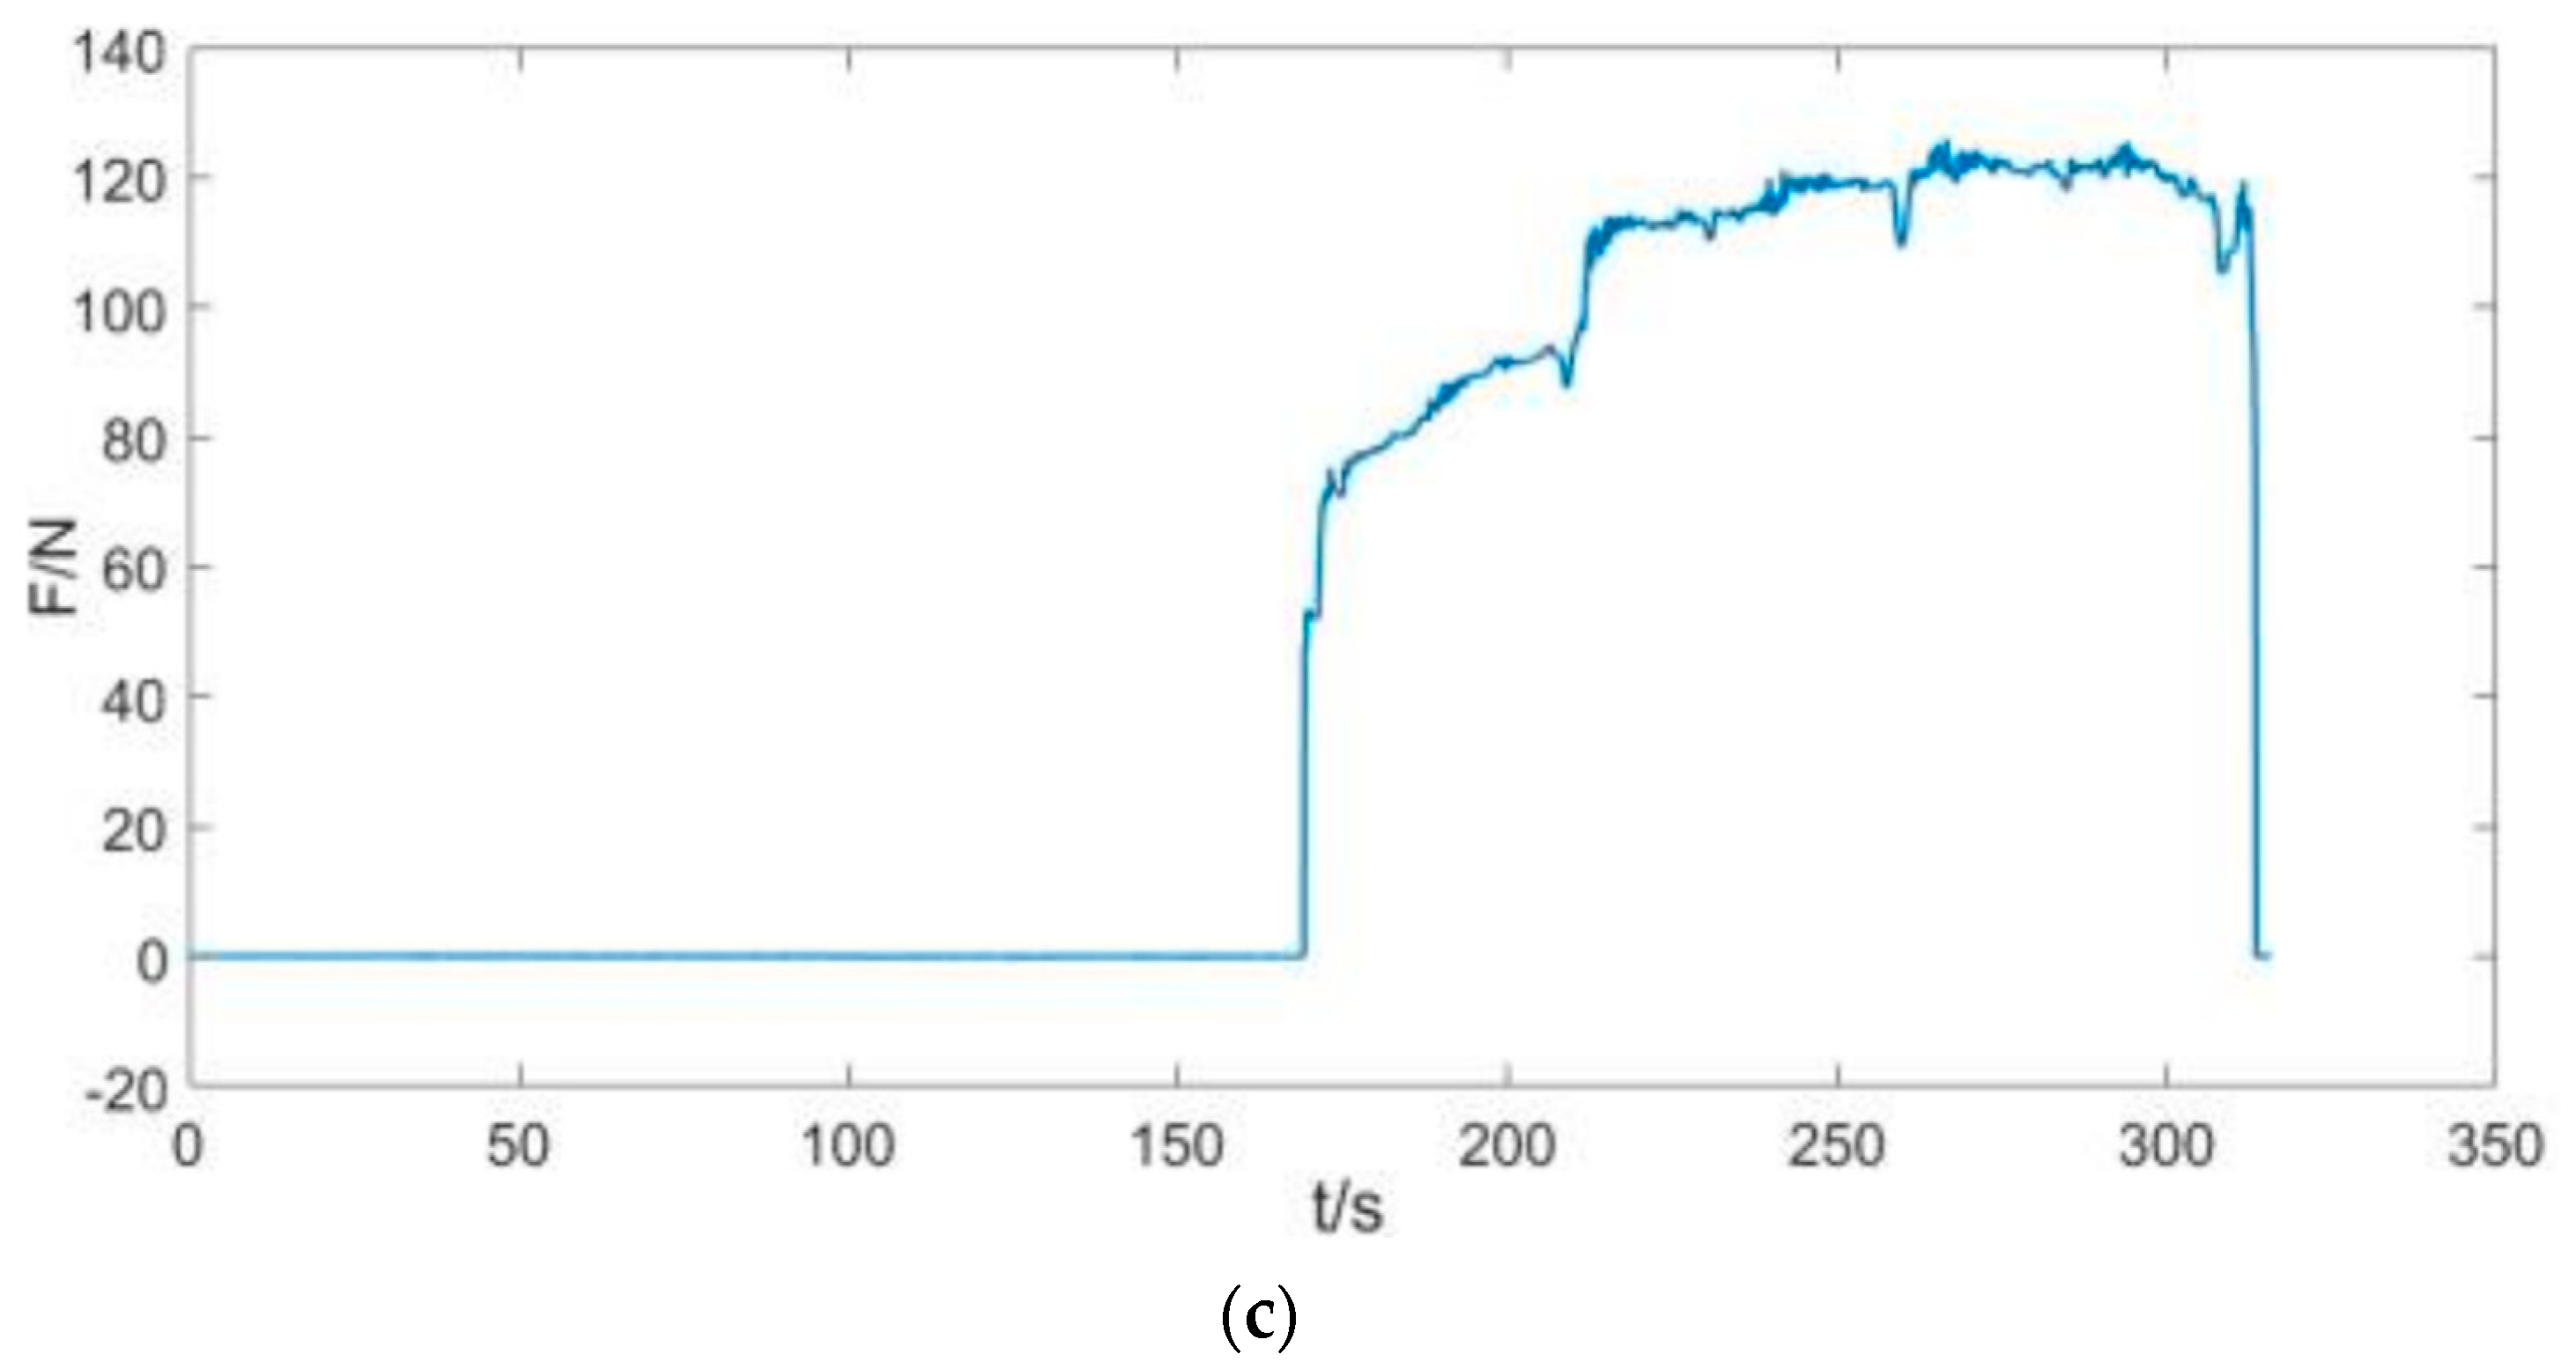
4.3. Specimen Force Impact Test
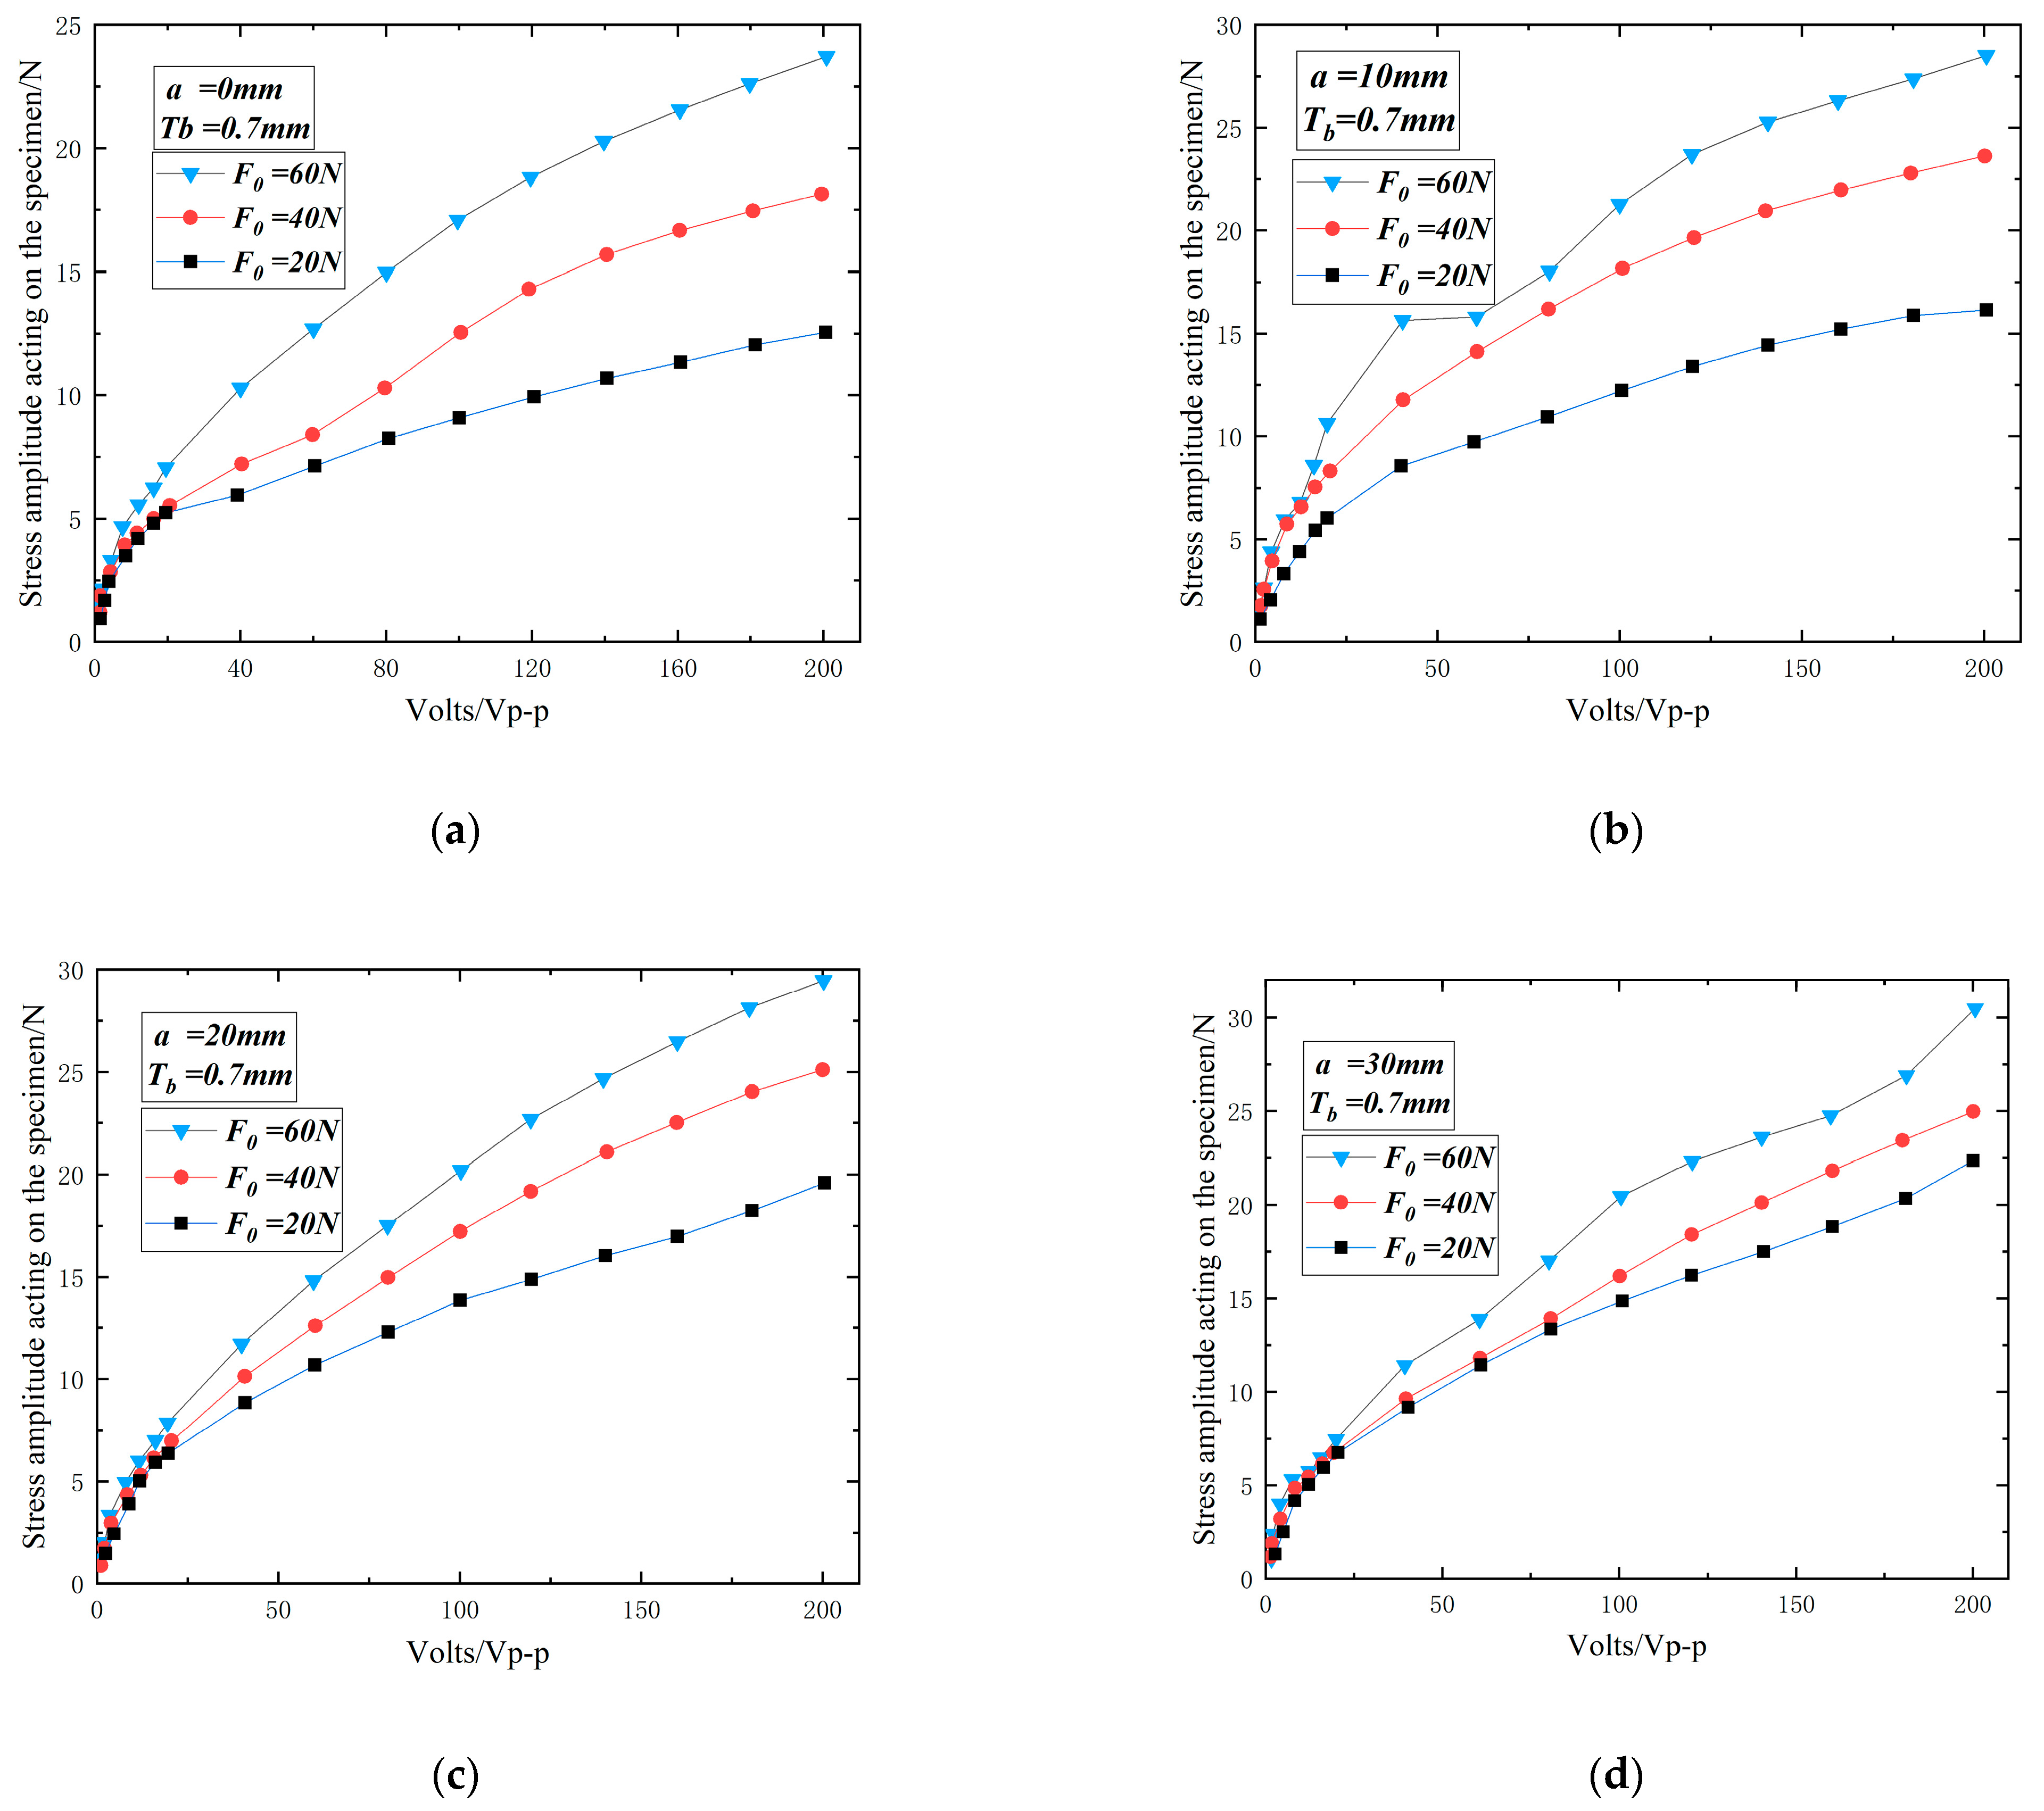
4.4. Tests of the Effect of Preset Loads on Specimen Forces
4.5. Fatigue Testing Machine Fatigue Testing Performance Verification
5. Conclusions
Author Contributions
Funding
Institutional Review Board Statement
Informed Consent Statement
Data Availability Statement
Conflicts of Interest
References
- Wu, B.; Chu, W.; Xia, B.; Zhou, Y. Construction of Spring-Shaped UHMWPE Fiber-Based Soft Actuators with Stable/Fast Actuating Response and Large Actuating Stroke. ACS Appl. Polym. Mater. 2024, 6, 5216–5225. [Google Scholar] [CrossRef]
- Tian, X.; Sun, Y.; Li, Z.; Wang, H.; Wang, Z.; Wang, H.; Zhu, J.; Yang, Z. Design and Experiment Using Flexible Bumps for Piezoelectric-Driven Hydraulically Amplified Braille Dot Display. Micromachines 2021, 12, 795. [Google Scholar] [CrossRef] [PubMed]
- Tian, X.; Liu, J.; Hou, J.; Gai, H.; Yang, J.; Sun, Z. Study of the Power Generation Performance of Impact Piezoelectric Energy Capture Devices. Micromachines 2023, 14, 1013. [Google Scholar] [CrossRef] [PubMed]
- Cha, Y.; Chae, W.; Kim, H.; Walcott, H.; Peterson, S.D.; Porfiri, M. Energy harvesting from a piezoelectric biomimetic fish tail. Renew. Energy 2016, 86, 449–458. [Google Scholar] [CrossRef]
- Kattimani, M.A.; Khatib, M.I.; Ghori, M.M.; Sajjad, M.; Jahangir, S.; Baqtaiyan, H.; Sadiq, M. Design and fabrication of fatigue testing machine. Int. J. Sci. Res. Sci. Eng. Technol. 2020, 7, 295–304. [Google Scholar] [CrossRef]
- Huňady, R.; Sivák, P.; Delyová, I.; Bocko, J.; Vavro, J.; Hroncová, D. Upgrade of the Universal Testing Machine for the Possibilities of Fatigue Tests in a Limited Mode. Appl. Sci. 2024, 14, 3973. [Google Scholar] [CrossRef]
- Zhang, K.; Collette, M. Experimental investigation of structural system capacity with multiple fatigue cracks. Mar. Struct. 2021, 78, 102943. [Google Scholar] [CrossRef]
- Khemaleelakul, T.; Kanjantra, P.; Sirimongkolwattana, S.; Thongngarm, W.; Mamanee, T.; Sirikulrat, N. Comparative Three-Point Bending Flexural Test of Dental Ceramics Using Standard and Self-Adjustable Specimen Support Fixtures. Mater. Trans. 2020, 61, 685–690. [Google Scholar] [CrossRef]
- Mishra, A.K.; Lambai, A.; Jayaram, V.; Jaya, B.N. The edge-notched clamped beam bend specimen as a fracture toughness test geometry. Theor. Appl. Fract. Mech. 2020, 105, 102409. [Google Scholar] [CrossRef]
- Goanță, V.; Morăraș, C.; Blanari, I. Device for testing at combined cyclic fatigue loading by tensile and torsion, attachable to the universal testing machine. Exp. Tech. 2022, 46, 179–186. [Google Scholar] [CrossRef]
- Samiezadeh, S.; Schemitsch, E.H.; Zdero, R.; Bougherara, H. Biomechanical response under stress-controlled tension-tension fatigue of a novel carbon fiber/epoxy intramedullary nail for femur fractures. Med. Eng. Phys. 2020, 80, 26–32. [Google Scholar] [CrossRef] [PubMed]
- Chen, G.; Wu, H.; Gao, J.; Lin, Q. Development of a high-frequency and large-stroke fatigue testing system for rubber. Rev. Sci. Instrum. 2017, 88, 045113. [Google Scholar] [CrossRef] [PubMed]
- Duarte, L.M.T.; Almaraz, G.M.D.; Pacheco, C.J.T.; Tello, I.F.Z. Device to measure fatigue life of membranes under biaxial loading fatigue: Tension and torsion. Measurement 2020, 152, 107382. [Google Scholar] [CrossRef]
- Kong, B.S.; Shin, J.H.; Jang, C.; Kim, H.C. Measurement of fracture toughness of pure tungsten using a small-sized compact tension specimen. Materials 2020, 13, 244. [Google Scholar] [CrossRef]
- Le, X. A Probabilistic Fatigue Damage Model for Aluminum 6061-T6 10-Gauge Sheet-Type Material. ASCE-ASME J. Risk Uncertain. Eng. Syst. Part B Mech. Eng. 2021, 7, 034501. [Google Scholar] [CrossRef]
- Marques, J.M.E.; Benasciutti, D.; Niesłony, A.; Slavič, J. An overview of fatigue testing systems for metals under uniaxial and multiaxial random loadings. Metals 2021, 11, 447. [Google Scholar] [CrossRef]
- Zeng, X.; Wu, Y.; Yang, Z.; Shen, Y.; Ma, L. Research on high-frequency small-load fatigue testing device driven by piezoelectric actuator. Rev. Sci. Instrum. 2019, 90, 076102. [Google Scholar] [CrossRef] [PubMed]
- Deng, J.; Liu, Y.X.; Zhang, S.J.; Liu, J. Modeling and experiments of a nano-positioning and high frequency scanning piezoelectric platform based on function module actuator. Sci. China Technol. Sci. 2020, 63, 2541–2552. [Google Scholar] [CrossRef]
- Costa, P.; Nwawe, R.; Soares, H.; Reis, L.; Freitas, M.; Chen, Y.; Montalvão, D. Review of multiaxial testing for very high cycle fatigue: From ‘conventional’ to ultrasonic machines. Machines 2020, 8, 25. [Google Scholar] [CrossRef]
- Saghaeian, F.; Lederer, M.; Hofer, A.; Todt, J.; Keckes, J.; Khatibi, G. Investigation of high cyclic fatigue behaviour of thin copper films using MEMS structure. Int. J. Fatigue 2019, 128, 105179. [Google Scholar] [CrossRef]
- Ma, Z.; Zhao, H.; Li, Q.; Wang, K.; Zhou, X.; Hu, X.; Cheng, H.; Lu, S. Novel in situ device for investigating the tensile and fatigue behaviors of bulk materials. Rev. Sci. Instrum. 2013, 84, 045104. [Google Scholar] [CrossRef] [PubMed]
- Andreades, C.; Meo, M.; Ciampa, F. Tensile and fatigue testing of impacted smart CFRP composites with embedded PZT transducers for nonlinear ultrasonic monitoring of damage evolution. Smart Mater. Struct. 2020, 29, 055034. [Google Scholar] [CrossRef]
- Li, K. Design and Research of High Frequency Horizontal Small Load Fatigue Testing Machine Drived by Piezoelectric Actuator; Jilin University: Changchun, China, 2017. [Google Scholar]
- Ma, L. Research on Piezoelectric High-Frequency Micro Load Fatigue Testing Machine; Jilin Uinversity: Changchun, China, 2018. [Google Scholar]
- Ogawa, F.; Shimizu, Y.; Bressan, S.; Morishita, T.; Itoh, T. Bending and torsion fatigue-testing machine developed for multiaxial non-proportional loading. Metals 2019, 9, 1115. [Google Scholar] [CrossRef]
- Xuan, J.; Wang, S. Development of hydraulically driven fatigue testing machine for insulators. IEEE Access 2017, 6, 980–988. [Google Scholar] [CrossRef]
- Xu, P.; Liu, H.Y.; Men, Y.T.; Xu, B.S.; Lu, J.; Zhang, C.Q. A new type fatigue machine design with high frequency large stroke. Appl. Mech. Mater. 2014, 496, 1522–1525. [Google Scholar] [CrossRef]


| Materials | Densities (kg·m) | Modulus of Elasticity (Pa) | Poisson’s Ratio | Thicknesses (mm) |
|---|---|---|---|---|
| PZT-8 | 7600 | — | — | Tc |
| Spring steel | 7810 | 2.1 × 10¹¹ | 0.288 | Tm |
| Chemical Composition of Dog-Bone Specimen (Q235b) (wt%) | ||||
|---|---|---|---|---|
| C | Si | Mn | S | P |
| 0.12 | 0.03 | 0.45 | ≤0.0045 | ≤0.0045 |
| Yield Strength (MPa) | Tensile Strength (MPa) | Elongation min (%) | Density (Kg/m3) |
|---|---|---|---|
| 235 | 375~460 | 26 | 7850 |
| Mass Unit | Mass Unit Subunit | Structural Schematic |
|---|---|---|
| M1 | M1.1 Force sensor |  |
| M1.2 Force sensor substrates | ||
| M1.3 Transfer plate | ||
| M1.4 Upper fixture | ||
| M2 | M2.1 Specimens |  |
| M2.2 Bottom fixture | ||
| M2.3 Lower fixed support plate | ||
| M2.4 Vibration plate | ||
| M2.5 Elastic ring | ||
| M3 | M3.1 Connection shaft |  |
| M3.2 Mass block | ||
| M3.3 Circling overhead | ||
| M3.4 Piezoelectric vibrator | ||
| M3.5 Sump |
| Mass Unit | Parameter Value/kg | Rigidity Parameter | Damping Parameters | Parameter Value | |
|---|---|---|---|---|---|
| 0.2954 | 3.33 | 16.8568 | |||
| 5.43 | 15.0000 | ||||
| 0.3159 | 0.1: 0.1: 1 | 17.2519 | |||
| 6.21 | 20.8610 |
| Part Number | Part Name | Dimensional Parameters | Parameter Value (mm) |
|---|---|---|---|
| 1 | Footing | Calibre | 30 |
| High degree | 30 | ||
| 2 | Foundation | Length | 250 |
| Width | 200 | ||
| Thickness | 45 | ||
| Centre distance between two holes in the middle | 130 | ||
| 3 | Guide bar | Centre Diameter | 20 |
| Diameter on both sides | 16 | ||
| High degree | 488 | ||
| 4 | Lower support plate | Length | 200 |
| Width | 35 | ||
| Thickness | 25 | ||
| 5 | Load board | Length | 200 |
| Width | 35 | ||
| Thickness | 25 | ||
| 6 | Backbone | Length | 200 |
| Width | 35 | ||
| Thickness | 20 | ||
| 7 | Screw | Large diameter | M10 |
| 8 | Load handle | Outer diameter | 8 |
| 9 | Sensor fixing plate | Length | 60 |
| Width | 30 | ||
| Thickness | 15 | ||
| 10 | Transducers | Middle diameter | 20 |
| Diameter on both sides | 16 | ||
| High degree | 22 | ||
| 11 | Transducer lower connection plate | Length | 35 |
| Width | 30 | ||
| Thickness | 7 | ||
| 12 | Fixture fixing plate | Length | 35 |
| Width | 30 | ||
| Thickness | 15 | ||
| 13 | Fixture | Width | 15 |
| Specimen clamping range | ≤4 | ||
| 14 | Specimen | Length | 55 |
| Width on both sides | 10 | ||
| Middle width | 0.8 | ||
| Thickness | 0.5 | ||
| 15 | Vibration plate | Length | 53 |
| Width | 30 | ||
| Thickness on both sides | 7 | ||
| Thickness in the middle | 13 | ||
| 16 | Elastic ring | Length | 76 |
| Width | 10 | ||
| Thickness | 15 | ||
| Flex thickness | 0.4/0.5/0.6/0.7 | ||
| 17 | Telegraph rod | Length | 94 |
| Calibre | 8 | ||
| Head diameter | 5 | ||
| 18 | Mass of counterweights | Outer diameter | 90 |
| Inside diameter | 10 | ||
| Thickness | 10/20/30 | ||
| 19 | Counterweight | Outer diameter | 90 |
| Inside diameter | 70 | ||
| Thickness on all sides | 13 | ||
| Thickness in the middle | 8 | ||
| 20 | Piezoelectric oscillator | Outer diameter of substrate | 90 |
| Substrate inner diameter | 6 | ||
| Substrate thickness | 2 | ||
| Outer diameter of ceramic disc | 60 | ||
| Ceramic disc inner diameter | 10 | ||
| Thickness of ceramic disc | 1 | ||
| 21 | Circling in midstream | Outer diameter | 90 |
| Inside diameter | 70 | ||
| Thickness on all sides | 10 | ||
| Thickness at centre | 5 |
Disclaimer/Publisher’s Note: The statements, opinions and data contained in all publications are solely those of the individual author(s) and contributor(s) and not of MDPI and/or the editor(s). MDPI and/or the editor(s) disclaim responsibility for any injury to people or property resulting from any ideas, methods, instructions or products referred to in the content. |
© 2024 by the authors. Licensee MDPI, Basel, Switzerland. This article is an open access article distributed under the terms and conditions of the Creative Commons Attribution (CC BY) license (https://creativecommons.org/licenses/by/4.0/).
Share and Cite
Zhang, S.; Yang, Z.; Liu, J. Design and Experimental Study of a Down-Drive Piezoelectric High-Frequency Fatigue Testing Machine. Appl. Sci. 2024, 14, 6961. https://doi.org/10.3390/app14166961
Zhang S, Yang Z, Liu J. Design and Experimental Study of a Down-Drive Piezoelectric High-Frequency Fatigue Testing Machine. Applied Sciences. 2024; 14(16):6961. https://doi.org/10.3390/app14166961
Chicago/Turabian StyleZhang, Sida, Zhigang Yang, and Jiangwei Liu. 2024. "Design and Experimental Study of a Down-Drive Piezoelectric High-Frequency Fatigue Testing Machine" Applied Sciences 14, no. 16: 6961. https://doi.org/10.3390/app14166961
APA StyleZhang, S., Yang, Z., & Liu, J. (2024). Design and Experimental Study of a Down-Drive Piezoelectric High-Frequency Fatigue Testing Machine. Applied Sciences, 14(16), 6961. https://doi.org/10.3390/app14166961