
A Hybrid Group-Based Food Recommender Framework for Handling Overlapping Memberships


Abstract
1. Introduction
- We introduced ITGR, a group-based recipe recommendation system employing deep neural networks to effectively incorporate both explicit user ratings and implicit recipe features, thereby facilitating personalized recommendations.
- To address the challenge of intragroup similarity in group-based recipe recommendations, we employed FCM clustering and collaborative filtering, enabling users to belong to multiple groups.
- We proposed a method for generating the top-k recommendations for a group, utilizing an advanced aggregation approach. This method enhances generalization by allowing users to be part of multiple groups.
- We addressed the issue of data sparsity by leveraging latent factors of both users and recipes, thus improving prediction accuracy.
- We demonstrated the effectiveness of our model through simulations, showing that it outperforms existing methods in generating the top-k recommendations.
2. Related Work
2.1. Group Formation
2.2. Single-User-Based Recommendation
2.3. Group-Based Recommendation
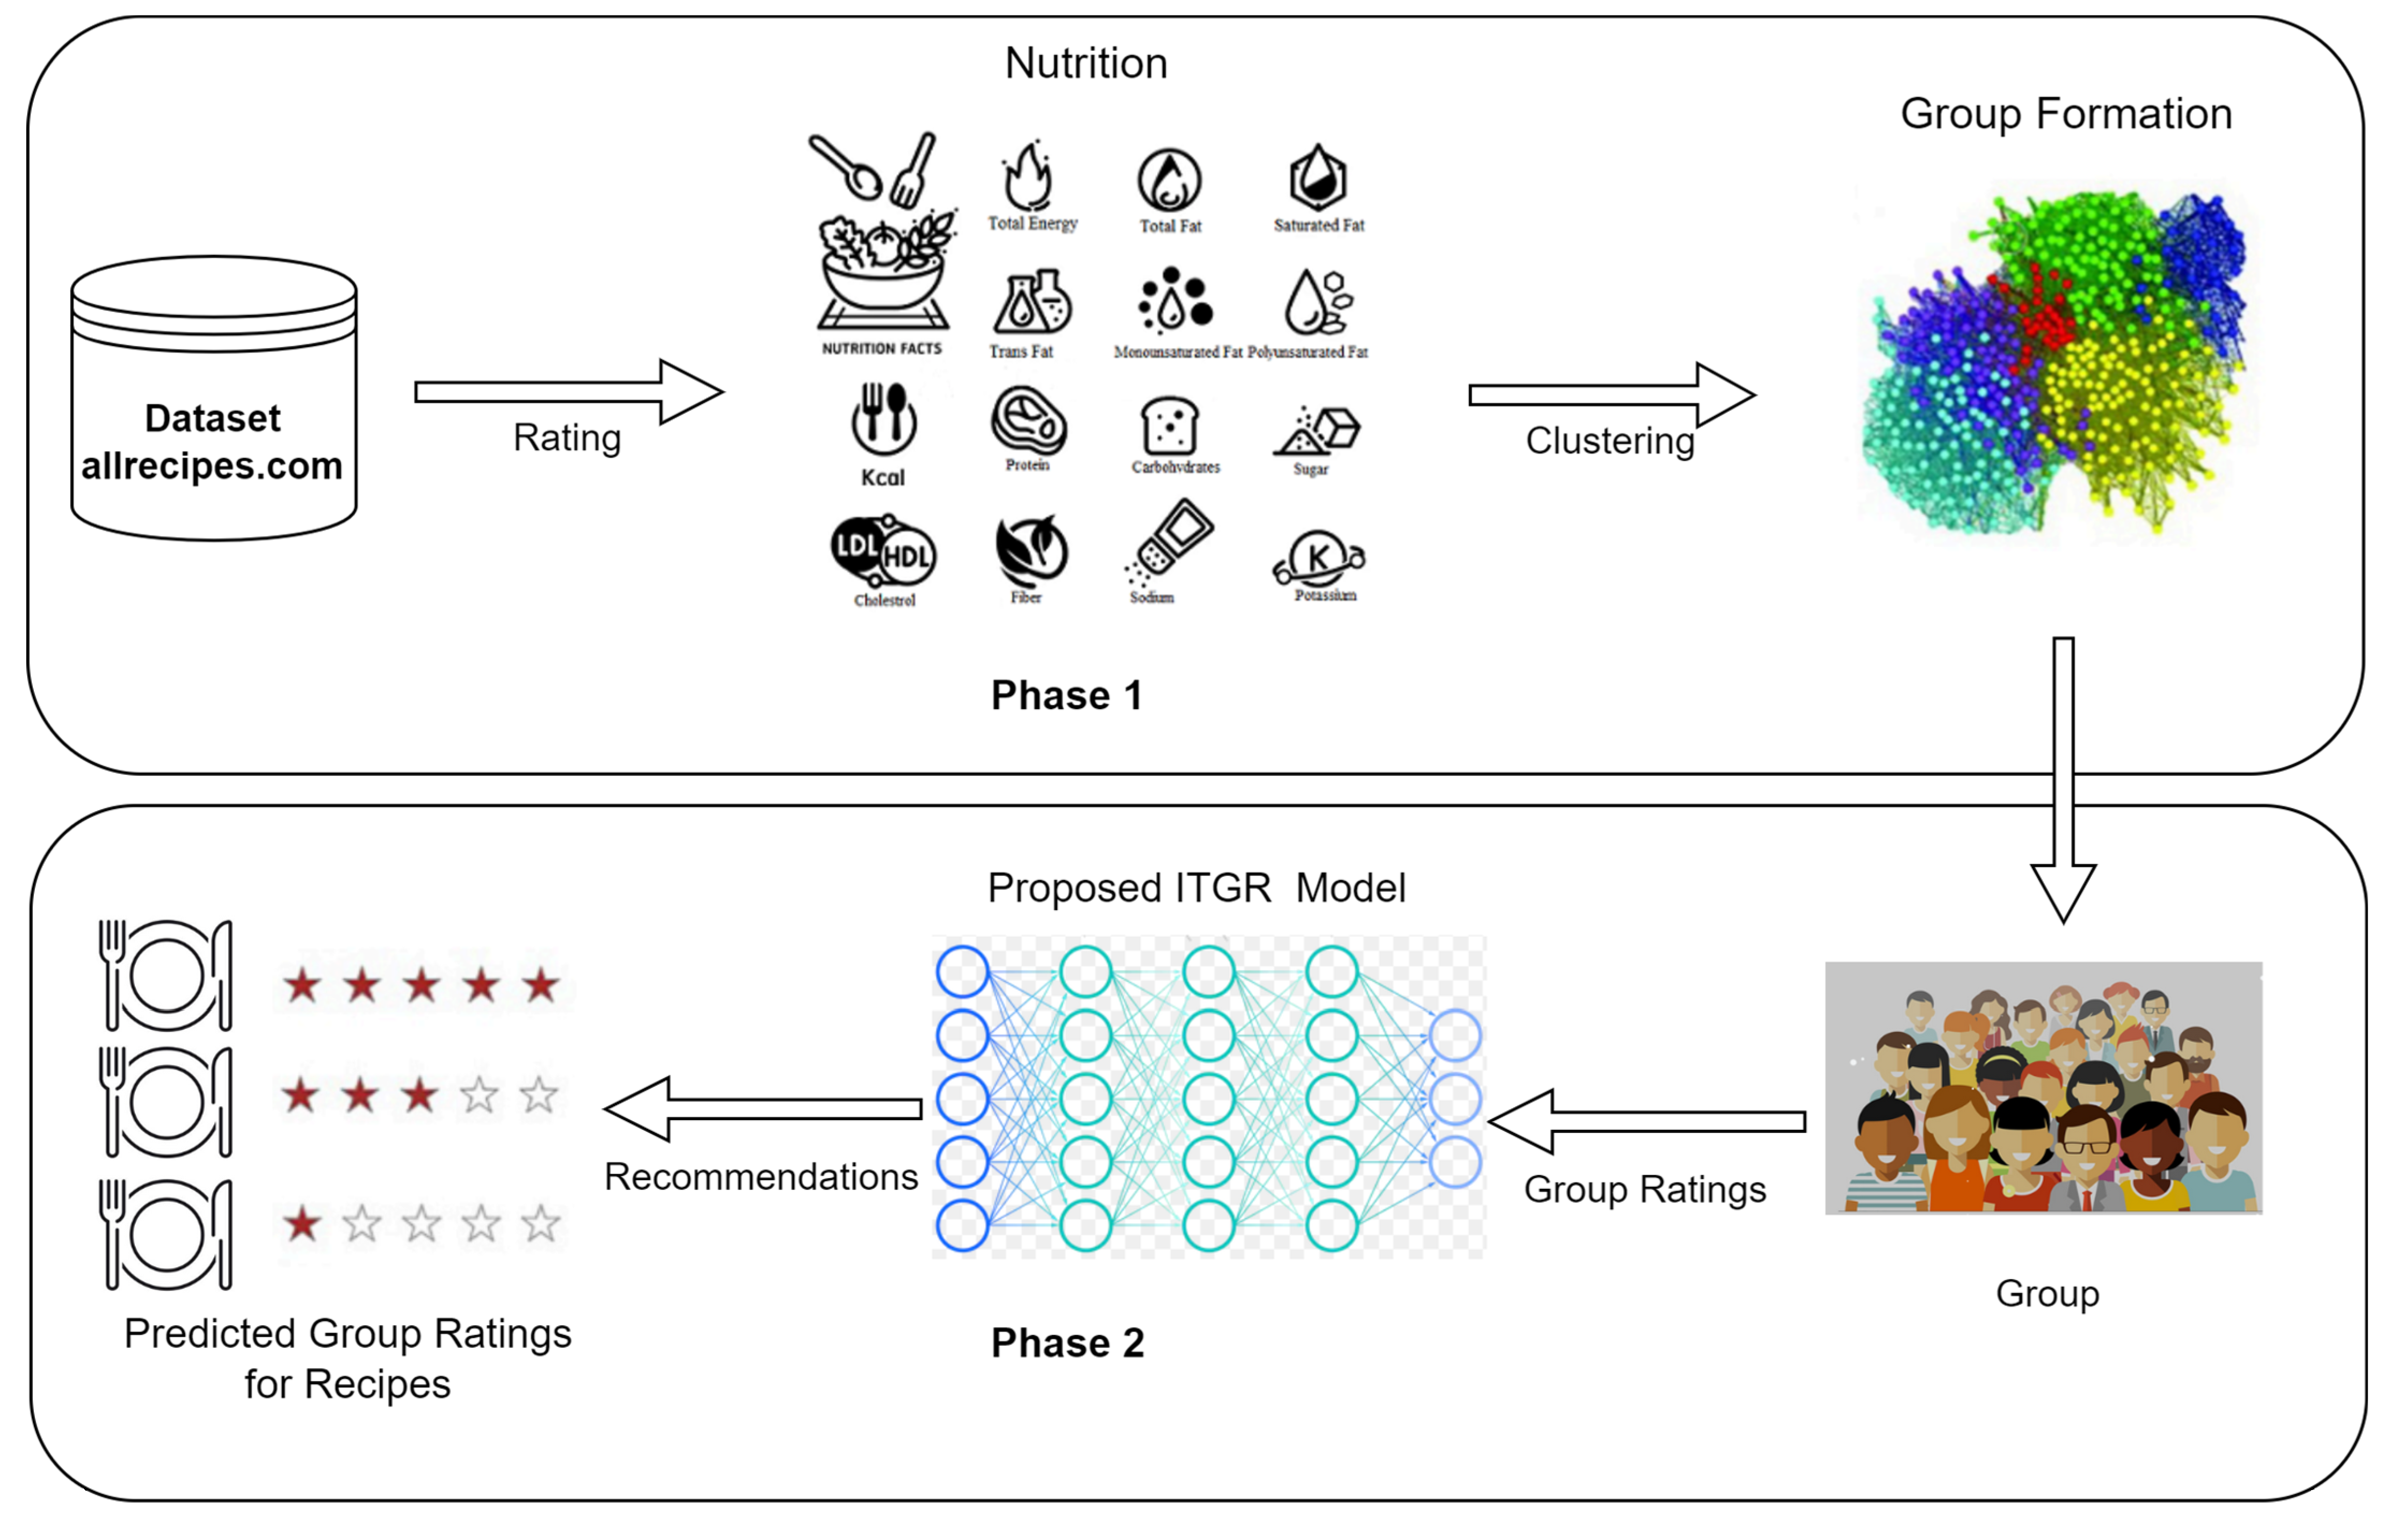
3. ITGR Framework
- Phase 1: Group Formation
- Step 1: Dataset Collection: The process began with collecting a dataset from allrecipes.com (accessed on 1 June 2024), which contained user ratings for various recipes.
- Step 2: Rating Extraction: The collected dataset included user ratings for different recipes. These ratings were extracted for further processing.
- Step 3: Nutrition Analysis: The dataset was analyzed for nutritional information, which helped in understanding the ingredients and nutritional value of each recipe.
- Step 4: Group Formation: The clustering results were utilized to form cohesive user groups with similar dietary preferences. Unlike existing food-based group recommender systems, the model exhibited a degree of generalization by allowing a user to be part of multiple groups.
- Phase 2: Group Recommendation
- Step 5: Group Ratings: The formed user groups provided collective ratings for different recipes, reflecting the preferences of the entire group.
- Step 6: ITGR Model Processing: The proposed ITGR model processed the group ratings to generate personalized recommendations for each group.
- Step 7: Recommendation Generation: The ITGR model predicted group ratings for various recipes and recommended the top-k recipes that best matched the group’s preferences.
- Step 8: Predicted Group Ratings for Recipes: The final output consisted of the predicted group ratings for recipes, which were then presented as recommendations to the user groups.
| Algorithm 1: Group Creation |
| Input: ratings (R), items (I), k-users. Output: Groups 1: 2: 3: 4: 5: 6: 7: 8: 9: 10: end if 11: end for 12: 13: end for 14: end for 15: 16: 17: 18: end for 19: end for 20: 21: 22: 23: 24: end if 25: end for 26: end for 27: 28: 29: 30: 31: 32: end for 33: end for 34: end for 35: 36: 37: 38: end for 39: end for 40: return G |
4. Performance Evaluation
4.1. Performance Metrics
4.1.1. RMSE
4.1.2. MAE
4.1.3. Precision
4.1.4. Recall
4.1.5. F1-Score
4.1.6. Group Satisfaction
4.1.7. NDCG
4.2. Parameter Settings
4.3. Results and Discussions
5. Conclusions
Author Contributions
Funding
Institutional Review Board Statement
Informed Consent Statement
Data Availability Statement
Conflicts of Interest
References
- Rehman, F.; Khalid, O.; Bilal, K.; Madani, S.A. Diet-right: A smart food recommendation system. KSII Trans. Internet Inf. Syst. (TIIS) 2017, 11, 2910–2925. [Google Scholar] [CrossRef]
- Toledo, R.Y.; Alzahrani, A.A.; Martinez, L. A Food Recommender System Considering Nutritional Information and User Preferences. IEEE Access 2019, 7, 96695–96711. [Google Scholar] [CrossRef]
- Princy, J.; Senith, S.; Kirubaraj, A.A.; Kumar, P.V. A Personalized Food Recommender System For Women Considering Nutritional Information. Int. J. Pharm. Res. 2022, 13, 1884–1887. [Google Scholar]
- Rostami, M.; Oussalah, M.; Farrahi, V. A Novel Time-aware Food recommender-system based on Deep Learning and Graph Clustering. IEEE Access 2022, 10, 52508–52524. [Google Scholar] [CrossRef]
- Wenjie, W.; Jiang, H.; Ji, P.; Song, X.; Nie, L.; Duan, L.Y.; Recommendation, H.-A.F. Market2Dish: Health-aware Food Recommendation. ACM Trans. Multimed. Comput. Commun. Appl. (TOMM) 2021, 17, 1–19. [Google Scholar] [CrossRef]
- Gao, X.; Feng, F.; Huang, H.; Ma, X.-L.; Lan, T.; Chi, Z. Food recommendation with graph convolutional network. Inf. Sci. 2022, 584, 170–183. [Google Scholar] [CrossRef]
- Bai, L.; Hu, M.; Ma, Y.; Liu, M. A Hybrid Two-Phase Recommendation for Group-Buying E-commerce Applications. Appl. Sci. 2019, 9, 3141. [Google Scholar] [CrossRef]
- Ali, Y.; Khalid, O.; Rehman, F.; Siraj, S.; Nawaz, R.; Khan, I.A.; Hussain, S.S. A hybrid group-based movie recommendation framework with overlapping memberships. PLoS ONE 2022, 17, e0266103. [Google Scholar] [CrossRef]
- Engelstad, P.; Herrera, E.; Abolghasemi, R.; Viedma, E.H.; Yazidi, A. A personality-aware group recommendation system based on pairwise preferences. Inf. Sci. 2022, 595, 1–17. [Google Scholar] [CrossRef]
- Romadhon, Z.; Sediyono, E.; Wido, C.E. Various implementation of collaborative filtering-based approach on recommendation systems using similarity. Game Technol. Inf. Syst. Comput. Netw. Comput. Electron. Control 2020, 5, 179–186. [Google Scholar] [CrossRef]
- Gao, X.; Feng, F.; He, X.; Huang, H.; Guan, X.; Feng, C.; Ming, Z.; Chua, T.-S. Hierarchical Attention Network for Visually-Aware Food Recommendation. IEEE Trans. Multimed. 2019, 22, 1647–1659. [Google Scholar] [CrossRef]
- Pawar, R.; Lardkhan, S.; Jani, S.; Lakh, K. NutriCure: A Disease-Based Food Recommender System. Int. J. Innov. Sci. Res. Technol. 2021, 6. Available online: https://ijisrt.com/nutricure-a-diseasebased-food-recommender-system (accessed on 30 June 2024).
- Gulzar, Y.; Alwan, A.A.; Abdullah, R.M.; Abualkishik, A.; Oumrani, M. Ordered Clustering-based Algorithm for E-Commerce Recommendation System. IEEE Access 2022, 6, 31–45. [Google Scholar] [CrossRef]
- Mirzaei, A.; Rahmati, M. A Novel Hierarchical-Clustering-Combination Scheme Based on Fuzzy-Similarity Relations. IEEE Trans. Fuzzy Syst. 2010, 18, 27–39. [Google Scholar] [CrossRef]
- Asani, E.; Vahdat-Nejad, H.; Sadri, J. Restaurant recommender system based on sentiment analysis. Mach. Learn. Appl. 2021, 6, 100114. [Google Scholar] [CrossRef]
- Samuel, M. Patient Diet Recommendation System Using K Clique and Deep learning Classifiers. J. Artif. Intell. Capsul. Netw. 2020, 2, 121–130. [Google Scholar] [CrossRef]
- Irteza, S.; Rozaida, G.; Irfan, J.; Zahid, M.; Hassan, A.A.A. Deep transfer learning with multimodal embedding to tackle cold-start and sparsity issues in recommendation system. PLoS ONE 2022, 8, 1–18. [Google Scholar] [CrossRef]
- Phanich, M.; Pholkul, P.; Phimoltares, S. Food Recommendation System Using Clustering Analysis for Diabetic Patients. In Proceedings of the International Conference on Information Science and Applications, Seoul, Republic of Korea, 21–23 April 2010. [Google Scholar] [CrossRef]
- Iwendi, C.; Khan, S.; Anajemba, J.H.; Bashir, A.K.; Noor, F. Realizing an Efficient IoMT-Assisted Patient Diet Recommendation System Through Machine Learning Model. IEEE Access 2020, 8, 2169–3536. [Google Scholar] [CrossRef]
- Chen, C.-H.; Karvela, M.; Sohbati, M.; Shinawatra, T.; Toumazou, C. PERSON—Personalized Expert Recommendation System for Optimized Nutrition. IEEE Trans. Biomed. Circuits Syst. 2018, 12, 151–160. [Google Scholar] [CrossRef]
- Martínez-Gorospe, A.; Sánchez-Lucero, E.; Pedroza-Méndez, B.E.; Quintero-Flores, P.M.; Hernández-Hernández, J.C.; Sánchez-Navarro, J.C. Food recommender system based on weighted ingredients, body mass index and allergies; using the Random Forest algorithm. In Proceedings of the 2021 Mexican International Conference on Computer Science (ENC), Morelia, Mexico, 9–11 August 2021. [Google Scholar] [CrossRef]
- Jun, Z.; Gao, C.; Jin, D.; Li, Y. Group-buying recommendation for social e-commerce. In Proceedings of the IEEE 37th International Conference on Data Engineering (ICDE), Chania, Greece, 19–22 April 2021. [Google Scholar] [CrossRef]
- Bilge, A.; Yalcin, E. A personality-based aggregation technique for group recommendation. Eskiseh. Tech. Univ. J. Sci. Technol. A-Appl. Sci. Eng. 2020, 21, 486–498. [Google Scholar] [CrossRef]
- Rostami, M.; Berahmand, K.; Forouzandeh, S.; Ahmadian, S.; Farrahi, V.; Oussalah, M. A novel healthy food recommendation to user groups based on a deep social community detection approach. Neurocomputing 2024, 576, 127326. [Google Scholar] [CrossRef]
- Seo, Y.-D.; Kim, Y.-G.; Lee, E.; Kim, H. Group recommender system based on genre preference focusing on reducing the clustering cost. Expert Syst. Appl. 2021, 183, 115396. [Google Scholar] [CrossRef]
- Viktoratos, I.; Tsadiras, A.; Bassiliades, N. Combining Community-Based Knowledge with Association Rule Mining to Alleviate the Cold Start Problem in Context-Aware Recommender Systems. Expert Syst. Appl. 2018, 101, 278–290. [Google Scholar] [CrossRef]
- Majdi, A.; Beiki, M. Applying evolutionary optimization algorithms for improving fuzzy C-mean clustering performance to predict the deformation modulus of rock mass. Int. J. Rock Mech. Min. Sci. 2019, 113, 172–182. [Google Scholar] [CrossRef]
- He, X.; Liao, L.; Xhang, H.; Nie, L.; Hu, X.; Chua, T.-S.; Filtering, N.C. In Proceedings of the 26th International Conference on World Wide Web, Perth, Australia, 3–7 April 2017. [CrossRef]
- Portugal, I.; Alencar, P.; Cowan, D. The use of machine learning algorithms in recommender systems: A systematic review. Expert Syst. Appl. 2018, 97, 205–227. [Google Scholar] [CrossRef]
- Nozari, R.B.; Koohi, H. A novel group recommender system based on members’ influence and leader impact. Knowl.-Based Syst. 2020, 205, 106296. [Google Scholar] [CrossRef]
- Koohi, H.; Kiani, K. User Based Collaborative Filtering using Fuzzy C-Means. Measurement 2016, 91, 134–139. [Google Scholar] [CrossRef]
- Nawi, R.M.; Noah, S.A.M.; Zakaria, L.Q. Evaluation of Group Modelling Strategy in Model-Based Collaborative Filtering Recommendation. Int. J. Mach. Learn. Comput. 2020, 10, 343–365. [Google Scholar] [CrossRef]
- Zhang, Q.; Lu, J.; Wu, D.; Zhang, G. A Cross-Domain Recommender System With Kernel-Induced Knowledge Transfer for Overlapping Entities. IEEE Trans. Neural Netw. Learn. Syst. 2019, 30, 1998–2012. [Google Scholar] [CrossRef]
- Herlocker, L.; Konstan, J.A.; Terveen, L.; Riedl, J. Evaluating collaborative filtering recommender systems. ACM Trans. Inf. Syst. 2004, 22, 35–53. [Google Scholar] [CrossRef]
- Carvalho, L.A.M.C.; Macedo, H.T. Users Satisfaction in Recommendation Systems for Groups: An Approach Based on Noncooperative Games. In Proceedings of the WWW ‘13 Companion: 22nd International Conference on World Wide Web, New York, NY, USA, 13–17 May 2013. [Google Scholar] [CrossRef]


| Refs. | Considerations | Group Formation | Model | Limitations |
|---|---|---|---|---|
| [4] | Food ingredients, time stamp, and user community-based food recommendation | Graph clustering | Bidirectional encoder | Interaction is limited to single group only |
| [5] | Explicit behavior of user, user health profiling, recipe information | RNN, CNN, BI-RNN | WIRCNN | Only consider users explicit feedback |
| [6] | Similarity-based approach for food recommendation while considering ingredient–ingredient, ingredient–recipe and recipe–user relationships | Bayesian personalized ranking for pairwise learning | Graph convolutional network-based food recommendation | Interaction is limited to single user only |
| [7] | Group-based purchasing | KNN, PCC | Collaborative filtering | User considered to be part of single group |
| [11] | Visual aided food recommendation | Hierarchical attention module | Neural network-based hierarchical attention network | Lacks consideration of users’ preferences regarding recipe ingredients |
| [16] | Personalized food recommendation | Cosine similarity | Gated recurrent network | Only spherical clusters can be formed |
| Notation | Meaning |
|---|---|
| DNCF | Deep neural collaborative filtering |
| PS | Peason similarity |
| PCC | Pearson correlation coefficient |
| FCM | Fuzzy C-means |
| Set of users | |
| Set of items | |
| Rating matrix | |
| Set of genres | |
| Set of clusters | |
| Set of groups | |
| Mean genre ratings | |
| Membership matrix | |
| Rating of user on item | |
| Ratings of user | |
| User ’s mean nutrition ratings | |
| Group of users |
| Recipes | |||||||
|---|---|---|---|---|---|---|---|
| Users | i1 | i2 | i3 | i4 | i5 | i6 | i7 |
| u1 | 5 | 4 | − | 5 | 3 | 4 | − |
| u2 | − | 4 | 5 | 4 | − | 5 | 2 |
| u3 | 4 | 3 | 3 | 5 | 3 | 5 | − |
| u4 | 4 | 5 | − | 3 | 3 | − | − |
| u5 | 5 | 3 | − | 5 | 3 | 4 | 2 |
| u6 | 4 | 2 | 2 | − | 2 | 5 | 3 |
| u7 | − | 5 | 3 | 4 | 4 | − | 3 |
| u8 | 3 | − | − | 4 | 3 | 3 | − |
| u9 | 4 | 5 | 4 | − | 5 | 4 | − |
| u10 | 4 | 5 | − | 4 | 3 | − | 4 |
| Nutrition | |||||||
|---|---|---|---|---|---|---|---|
| Recipes | Calories | Fat | Carbohydrates | Protein | Cholesterol | Sodium | Fiber |
| i1 | 6 | 13 | 3 | 5 | 1 | 3 | 1 |
| i2 | 16 | 24 | 11 | 20 | 29 | 25 | 10 |
| i3 | 5 | 5 | 5 | 5 | 3 | 7 | 2 |
| i4 | 15 | 21 | 14 | 7 | 10 | 7 | 6 |
| i5 | 10 | 6 | 11 | 11 | 3 | 4 | 5 |
| i6 | 7 | 4 | 8 | 9 | 6 | 4 | 3 |
| i7 | 11 | 11 | 9 | 15 | 5 | 8 | 4 |
| Users | ||||||||||
|---|---|---|---|---|---|---|---|---|---|---|
| Users | u1 | u2 | u3 | u4 | u5 | u6 | u7 | u8 | u9 | u10 |
| u1 | 0 | −0.14 | 0.76 | 0.69 | 0.91 | 0 | −0.19 | 0.73 | 0.17 | 0.34 |
| u2 | −0.14 | 0 | 0.28 | −0.38 | −0.29 | −0.11 | 0.1 | −0.26 | −0.09 | −0.49 |
| u3 | 0.76 | 0.28 | 0 | 0.26 | 0.59 | −0.00 | −0.31 | 0.73 | 0.25 | −0.27 |
| u4 | 0.69 | −0.38 | 0.26 | 0 | 0.52 | −0.31 | 0.33 | 0.22 | 0.31 | 0.74 |
| u5 | 0.91 | −0.29 | 0.59 | 0.52 | 0 | 0.08 | −0.31 | 0.8 | −0.13 | 0.42 |
| u6 | 0 | −0.11 | −0.00 | −0.31 | 0.08 | 0 | −0.82 | −0.02 | 0.34 | −0.37 |
| u7 | −0.19 | 0.1 | −0.31 | 0.33 | −0.31 | −0.82 | 0 | −0.34 | −0.10 | 0.44 |
| u8 | 0.73 | −0.26 | 0.73 | 0.22 | 0.8 | −0.02 | −0.34 | 0 | −0.07 | −0.00 |
| u9 | 0.17 | −0.09 | 0.25 | 0.31 | −0.13 | 0.34 | −0.10 | −0.07 | 0 | −0.25 |
| u10 | 0.34 | −0.49 | −0.27 | 0.74 | 0.42 | −0.37 | 0.44 | −0.00 | −0.25 | 0 |
| Clusters | ||
|---|---|---|
| Users | c1 | c2 |
| u1 | 0.612458 | 0.387542 |
| u2 | 0.422801 | 0.577199 |
| u3 | 0.575912 | 0.424088 |
| u4 | 0.556497 | 0.443503 |
| u5 | 0.724817 | 0.275183 |
| u6 | 0.516828 | 0.483172 |
| u7 | 0.392983 | 0.607017 |
| u8 | 0.471901 | 0.528099 |
| u9 | 0.418408 | 0.581592 |
| u10 | 0.425203 | 0.574797 |
| Users | ||||||||||
|---|---|---|---|---|---|---|---|---|---|---|
| Users | u1 | u2 | u3 | u4 | u5 | u6 | u7 | u8 | u9 | u10 |
| u1 | 0 | 0.06 | 0.28 | 0.14 | 0.17 | 0.29 | 0.30 | 0.10 | 0.19 | 0.15 |
| u2 | 0.06 | 0 | 0.04 | 0.06 | 0.09 | 0.06 | 0.03 | 0.02 | 0.015 | 0.11 |
| u3 | 0.28 | 0.036 | 0 | 0.13 | 0.027 | 0.21 | 0.20 | 0.095 | 0.11 | 0.17 |
| u4 | 0.14 | 0.06 | 0.13 | 0 | 0.23 | 0.38 | 0.19 | 0.066 | 0.05 | 0.06 |
| u5 | 0.17 | 0.094 | 0.03 | 0.23 | 0 | 0.17 | 0.19 | 0.070 | 0.02 | 0.004 |
| u6 | 0.29 | 0.06 | 0.21 | 0.38 | 0.17 | 0 | 0.22 | 0.10 | 0.16 | 0.11 |
| u7 | 0.30 | 0.03 | 0.20 | 0.19 | 0.19 | 0.22 | 0 | 0.08 | 0.18 | 0.16 |
| u8 | 0.10 | 0.024 | 0.09 | 0.07 | 0.07 | 0.10 | 0.08 | 0 | 0.072 | 0.082 |
| u9 | 0.19 | 0.015 | 0.11 | 0.05 | 0.02 | 0.16 | 0.18 | 0.072 | 0 | 0.017 |
| u10 | 0.15 | 0.11 | 0.17 | 0.06 | 0.004 | 0.11 | 0.16 | 0.08 | 0.017 | 0 |
| Users | ||||||||||
|---|---|---|---|---|---|---|---|---|---|---|
| Users | u1 | u2 | u3 | u4 | u5 | u6 | u7 | u8 | u9 | u10 |
| u1 | 0 | 0.003 | 0.115 | 0.077 | 0.036 | 0.015 | 0.054 | 0.090 | 0.023 | 0.006 |
| u2 | 0.003 | 0 | 0.052 | 0.156 | −0.005 | 0.082 | 0.110 | 0.069 | 0.083 | 0.089 |
| u3 | 0.115 | 0.052 | 0 | 0.044 | −0.018 | −0.013 | 0.022 | −0.023 | 0.203 | −0.011 |
| u4 | 0.077 | 0.156 | 0.044 | 0 | 0.068 | 0.025 | 0.156 | 0.203 | 0.089 | 0.081 |
| u5 | 0.036 | −0.005 | −0.018 | 0.068 | 0 | 0.025 | 0.182 | 0.020 | 0.034 | 0.034 |
| u6 | 0.015 | 0.082 | −0.013 | 0.025 | 0.025 | 0 | 0.142 | 0.118 | 0.009 | 0.009 |
| u7 | 0.054 | 0.110 | 0.022 | 0.156 | 0.182 | 0.142 | 0 | 0.007 | 0.053 | 0.037 |
| u8 | 0.090 | 0.069 | −0.023 | 0.203 | 0.020 | 0.118 | 0.007 | 0 | −0.007 | 0.111 |
| u9 | 0.023 | 0.083 | 0.203 | 0.089 | 0.034 | 0.009 | 0.053 | −0.007 | 0 | −0.001 |
| u10 | 0.006 | 0.089 | −0.011 | 0.081 | 0.034 | 0.009 | 0.037 | 0.111 | −0.001 | 0 |
| Recipes | |||||||
|---|---|---|---|---|---|---|---|
| Users | i1 | i2 | i3 | i4 | i5 | i6 | i7 |
| u1 | 5 | 4 | - | 5 | 3 | 4 | - |
| u3 | 4 | - | 3 | 4 | 3 | 2 | - |
| u4 | 4 | 5 | - | 3 | 3 | - | - |
| u5 | 2 | 3 | - | - | 3 | 4 | 2 |
| u8 | 3 | - | - | 4 | 3 | 3 | - |
| Recipes | |||||||
|---|---|---|---|---|---|---|---|
| Users | i1 | i2 | i3 | i4 | i5 | i6 | i7 |
| u1 | 5 | 4 | 3 | 5 | 3 | 4 | 3 |
| u3 | 4 | 5 | 3 | 4 | 3 | 2 | 3 |
| u4 | 4 | 5 | 3 | 3 | 3 | 4 | 4 |
| u5 | 2 | 3 | 2 | 5 | 3 | 4 | 2 |
| u8 | 3 | 4 | 2 | 4 | 3 | 3 | 2 |
| Parameter | Value |
|---|---|
| Epoch size | 20 |
| Batch size | 64 |
| Learning rate | Adjusted to 0.001 |
| Optimizer | RMSprop |
| Activation function | Sigmoid |
| Loss function | Binary cross entropy |
| Group size | (5, 10, 15, 20, 25, 30) |
| Top-k recommendations | 10 |
| Models | RMSE@10 | MAE@10 | Precision@10 | Recall@10 | F1@10 | NDCG@10 |
|---|---|---|---|---|---|---|
| ITGR | 0.2562 | 0.0656 | 0.6001 | 0.0793 | 0.1402 | 0.78 |
| MX | 0.2569 | 0.0699 | 0.4399 | 0.022 | 0.0419 | 0.7296 |
| TDLGC | 0.2900 | 0.0850 | 0.0721 | 0.0691 | 0.0705 | 0.0497 |
Disclaimer/Publisher’s Note: The statements, opinions and data contained in all publications are solely those of the individual author(s) and contributor(s) and not of MDPI and/or the editor(s). MDPI and/or the editor(s) disclaim responsibility for any injury to people or property resulting from any ideas, methods, instructions or products referred to in the content. |
© 2024 by the authors. Licensee MDPI, Basel, Switzerland. This article is an open access article distributed under the terms and conditions of the Creative Commons Attribution (CC BY) license (https://creativecommons.org/licenses/by/4.0/).
Share and Cite
Rais, R.N.B.; Noman, M.; Khalid, O.; Khan, I.A. A Hybrid Group-Based Food Recommender Framework for Handling Overlapping Memberships. Appl. Sci. 2024, 14, 5843. https://doi.org/10.3390/app14135843
Rais RNB, Noman M, Khalid O, Khan IA. A Hybrid Group-Based Food Recommender Framework for Handling Overlapping Memberships. Applied Sciences. 2024; 14(13):5843. https://doi.org/10.3390/app14135843
Chicago/Turabian StyleRais, Rao Naveed Bin, Muhammad Noman, Osman Khalid, and Imran A. Khan. 2024. "A Hybrid Group-Based Food Recommender Framework for Handling Overlapping Memberships" Applied Sciences 14, no. 13: 5843. https://doi.org/10.3390/app14135843
APA StyleRais, R. N. B., Noman, M., Khalid, O., & Khan, I. A. (2024). A Hybrid Group-Based Food Recommender Framework for Handling Overlapping Memberships. Applied Sciences, 14(13), 5843. https://doi.org/10.3390/app14135843