Abstract
In recent years, the application prospect of urban logistics unmanned aerial vehicles has attracted extensive attention. The high-density operation of UAVs requires autonomous separation maintenance capability. To achieve autonomous separation maintenance, it is necessary to conduct autonomous track prediction and formulate the required separation accordingly. Based on the target level of safety requirements for UAV operation, aiming at the autonomous separation maintenance ability of UAVs and considering the accuracy of track prediction, a method to calculate the required separation between UAVs is proposed. This study consists of two parts. Firstly, based on historical data, the position prediction error of the flight track is investigated. Using a machine learning model, a two-stage track prediction method, which involves classification followed by prediction, is proposed for urban logistics UAV track data. Subsequently, based on the track prediction error distribution, by designing a gas model and a position error probability model, a separation-formulating model for urban logistics UAVs in free flight is proposed in which UAV maneuverability is considered. By applying this model, the required separation is formulated for UAVs. When the required separation is set to 48.5 m, the overall collision risk meets the TLS requirements. The research provides a feasible method for establishing autonomous separation for urban logistics UAVs.
1. Introduction
Historical statistical data indicate that compared to the past few decades, the proportion of mid-air collisions in aviation accidents is much smaller. This reduction can be attributed not only to significant improvements in display technologies, radar performance, and data processing, but also to the implementation of new safety defense systems, such as the traffic collision avoidance system (TCAS) and the short-term conflict alert (STCA). However, as mid-air collision is among the most serious incidents in air traffic, the study of collision risk becomes a primary focus in air traffic management systems. The main task of air traffic management is to control risk and ensure safety. Essentially, safety is regarded as reducing risk and maintaining it at an acceptable level. The International Civil Aviation Organization (ICAO) introduced the concept of a target level of safety (TLS) for flight safety. Focusing on collision prevention goals within air traffic management system and based on analyses of aircraft proximity events, Brooker [1] summarized the safety protection layers or risk sources of air traffic management systems into three aspects: (1) air traffic control regimes, management rules and procedures, and airspace structure, (2) an airborne collision avoidance system and a ground conflict alert system, and (3) controllers’ and pilots’ monitoring of traffic situations and timely intervention in case of danger. Vulnerabilities in each link of the safety protection layers can become causes of accident. Focusing on urban logistics UAVs in free flight, to ensure the safety of operation, it is urgent to strengthen UAV conflict management and to have autonomous separation maintenance capability.
To achieve autonomous separation maintenance, it is necessary to undertake track prediction and formulate the required separation. The core task is to determine the necessary separation based on track prediction error, air traffic service capability, conflict detection and resolution mechanisms, and other maneuverability performance parameters. Research has been conducted on two aspects.
In the field of track prediction, current studies have applied machine learning models to address short-term track prediction issues. Alligier et al. [2] successfully used a machine learning model to improve climb prediction based on ground applications, demonstrating the feasibility of altitude prediction. Zeng et al. [3] proposed a sequence-to-sequence deep long short-term memory network for track prediction. Ma et al. [4] introduced a new hybrid architecture for 4D track prediction based on deep learning, combining convolutional neural networks (CNNs) and long short-term memory (LSTM). Zhang et al. [5] proposed a hybrid model combining deep feed-forward neural networks with LSTM for track prediction, where the uncertainty of model predictions is addressed using Bayesian methods to enhance in-flight safety. Zhang et al. [6] developed a 4D track prediction method based on aircraft performance data and aircraft intentions. Wang et al. [7] improved the Kalman filtering algorithm to enhance prediction accuracy by adjusting current position data in real time. Lv et al. [8] constructed a multi-information extended Kalman filtering prediction system to achieve 4D track predictions that are more consistent with actual aircraft movements and provide higher precision. Shi et al. [9] proposed a short-term 4D track prediction algorithm based on online updating of LSTM networks to enable real-time model parameter updates, making the model robust. Hesam et al. [10] used a hybrid deep learning approach for track prediction based on ADS-B data. Zeng [11] conducted a review of existing track prediction issues. Zhao et al. [12] used LSTM to predict aircraft climb and descent phases in track prediction.
In the field of required separation research, focusing on UAV separation maintenance and collision avoidance, achievements have concentrated on gas models and Monte Carlo simulation methods. The gas model was initially proposed in the 1970s. Graham et al. [13] estimated the collision risk for manned aircraft by simplifying assumptions about aircraft behavior, ideally setting and quantifying the collision risk among uniformly distributed aircraft within a region. This model was later expanded by Endoh et al. [14], who determined the collision rate at the intersection of two flight paths. Webel [15] and Anders et al. [16] introduced an expanded version of the gas model to assess the collision risk between UAVs and manned aircraft. Christopher et al. [17] evaluated the collision risk within a UAV swarm. Joint Authorities for Rulemaking on Unmanned Systems (JARUS) released a revised specific operations risk assessment (SORA) guide [18] in 2019, guiding operators in the qualitative assessment of UAV risk. Nikodem [19] from DLR compared the traditional civil aviation qualitative risk assessment methods with the SORA method proposed by JARUS. In 2019, Pérez-Castán et al. [20] conducted a collision risk comparison before and after introducing UAVs into manned aircraft airspace in assumed operational scenarios without considering certain factors, such as controller and pilot operation. Valtteri et al. [21] reviewed typical collision risk models in the UAV collision risk assessment field, looking forward to these models’ application and extension in setting UAV operational lateral separations. Li et al. [22] improved the classic EVENT model, proposing a collision risk model suitable for UAVs. In 2021, SESAR’s [23] European Horizon BUBBLES project conducted separation assessments based on the SORA risk model and Monte Carlo simulation. Yao et al. [24], based on the EVENT model, assessed the lateral collision risk between military and civilian aircraft and military UAVs and civilian aircraft. Wang et al. [25], considering the potential safety conflicts caused by multiple logistics UAVs’ flying routes in the future, proposed planning safe separations between UAVs to avoid operational risk and, based on the TLS, calculated the minimum safe separation for some logistics routes.
It is known that using machine learning models for track prediction based on historical aircraft tracks has become the mainstream approach. Existing research focuses on similar track data or specific flight phases to construct track prediction models, where balancing prediction length and accuracy is challenging and mostly used for short-term predictions. For air collision risk assessment and separation settings for urban logistics UAV flight activities, existing studies can mostly be divided into two schemes. One uses gas models and Monte Carlo methods for collision risk assessment and separation setting, and the other introduces manned aircraft collision risk assessment and separation formulating methods, thus decomposing UAV movement into longitudinal, lateral, and vertical dimensions for formulating separation individually. Neither scheme fully reflects the free flight mode or inherent capability of UAVs.
This study is divided into two parts. Firstly, based on historical data, the issue of track prediction is studied. Using a machine learning model, a two-stage track prediction method of classification followed by prediction is proposed for urban logistics UAV track data in a certain area. First, K-means is applied for track identification and categorizing tracks based on UAV speed, flight altitude, latitude, and longitude. Then, the Adam–LSTM deep learning model is designed for detailed prediction of each type of track. Through a large number of predictions, the distribution function of prediction errors can be organized. Afterwards, based on track prediction error distribution, by designing the gas model and position error probability model, a separation calculation model for urban logistics UAVs is proposed. First, the gas model is used to calculate the UAV conflict frequency; then, considering position prediction errors, dynamics performance, the conflict detection and resolution mechanism, route structure, and air traffic service capability, the collision probability in conflict is calculated. Finally, by comparing the overall collision risk and the TLS, the required separation for urban logistics UAVs in free flight is calculated. The separation research lays a theoretical foundation for the development of UAV autonomous separation maintenance ability.
2. Separation Formulation Method
This paper aims to develop the required separation for urban logistics UAVs in free flight. The main research methods include the track prediction method and the separation formulation method.
2.1. Track Prediction Method
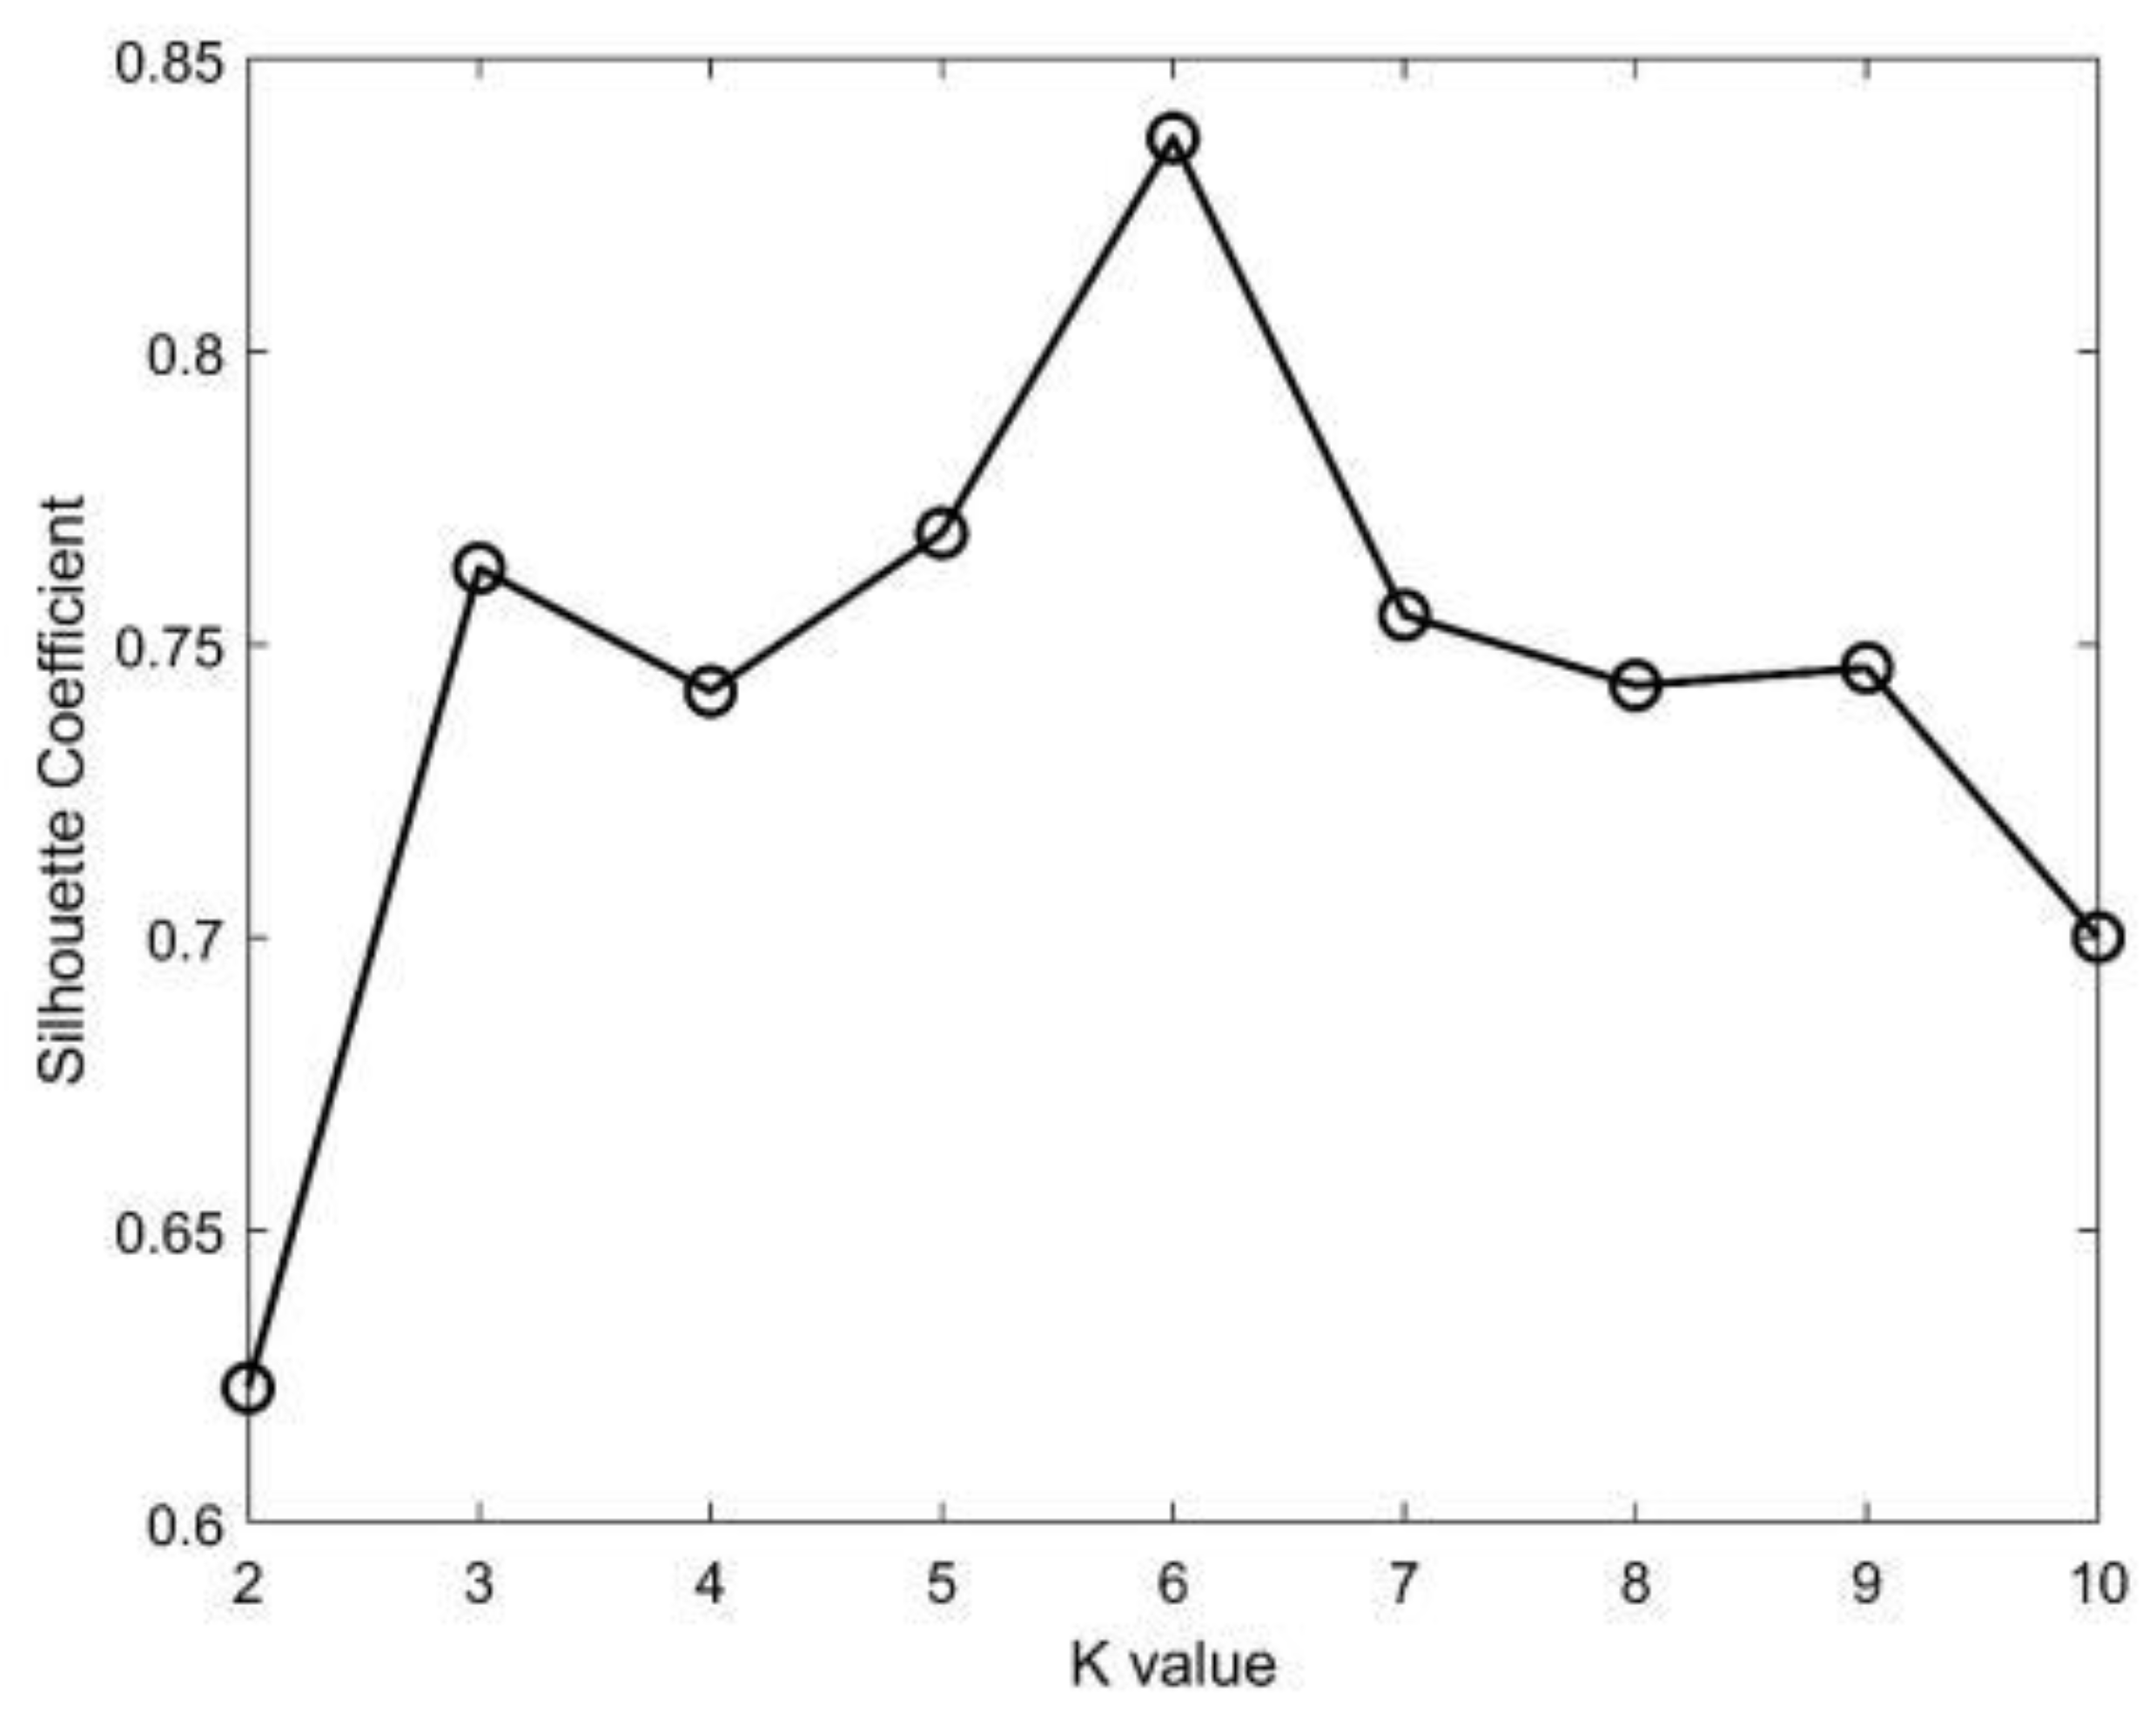
2.1.1. Clustering and Classification
The clustering and classification of track data are fundamental to achieving refined track prediction. In this study, after comparing various methods, the K-means algorithm is utilized for clustering historical UAV data. The K-means algorithm is particularly suitable for handling large datasets due to its low computational complexity. An advantage of the K-means algorithm is its minimal parameter requirement, needing only the number of clusters to be set, which significantly reduces the difficulty of parameter selection. In contrast, the DBSCAN algorithm requires setting the neighborhood radius and minimum number of samples, making its parameter selection more complex. Especially in dealing with high-dimensional data, estimating the distance threshold for the DBSCAN algorithm can be challenging and may affect the algorithm’s effectiveness. Therefore, the K-means algorithm is a better choice for this study.
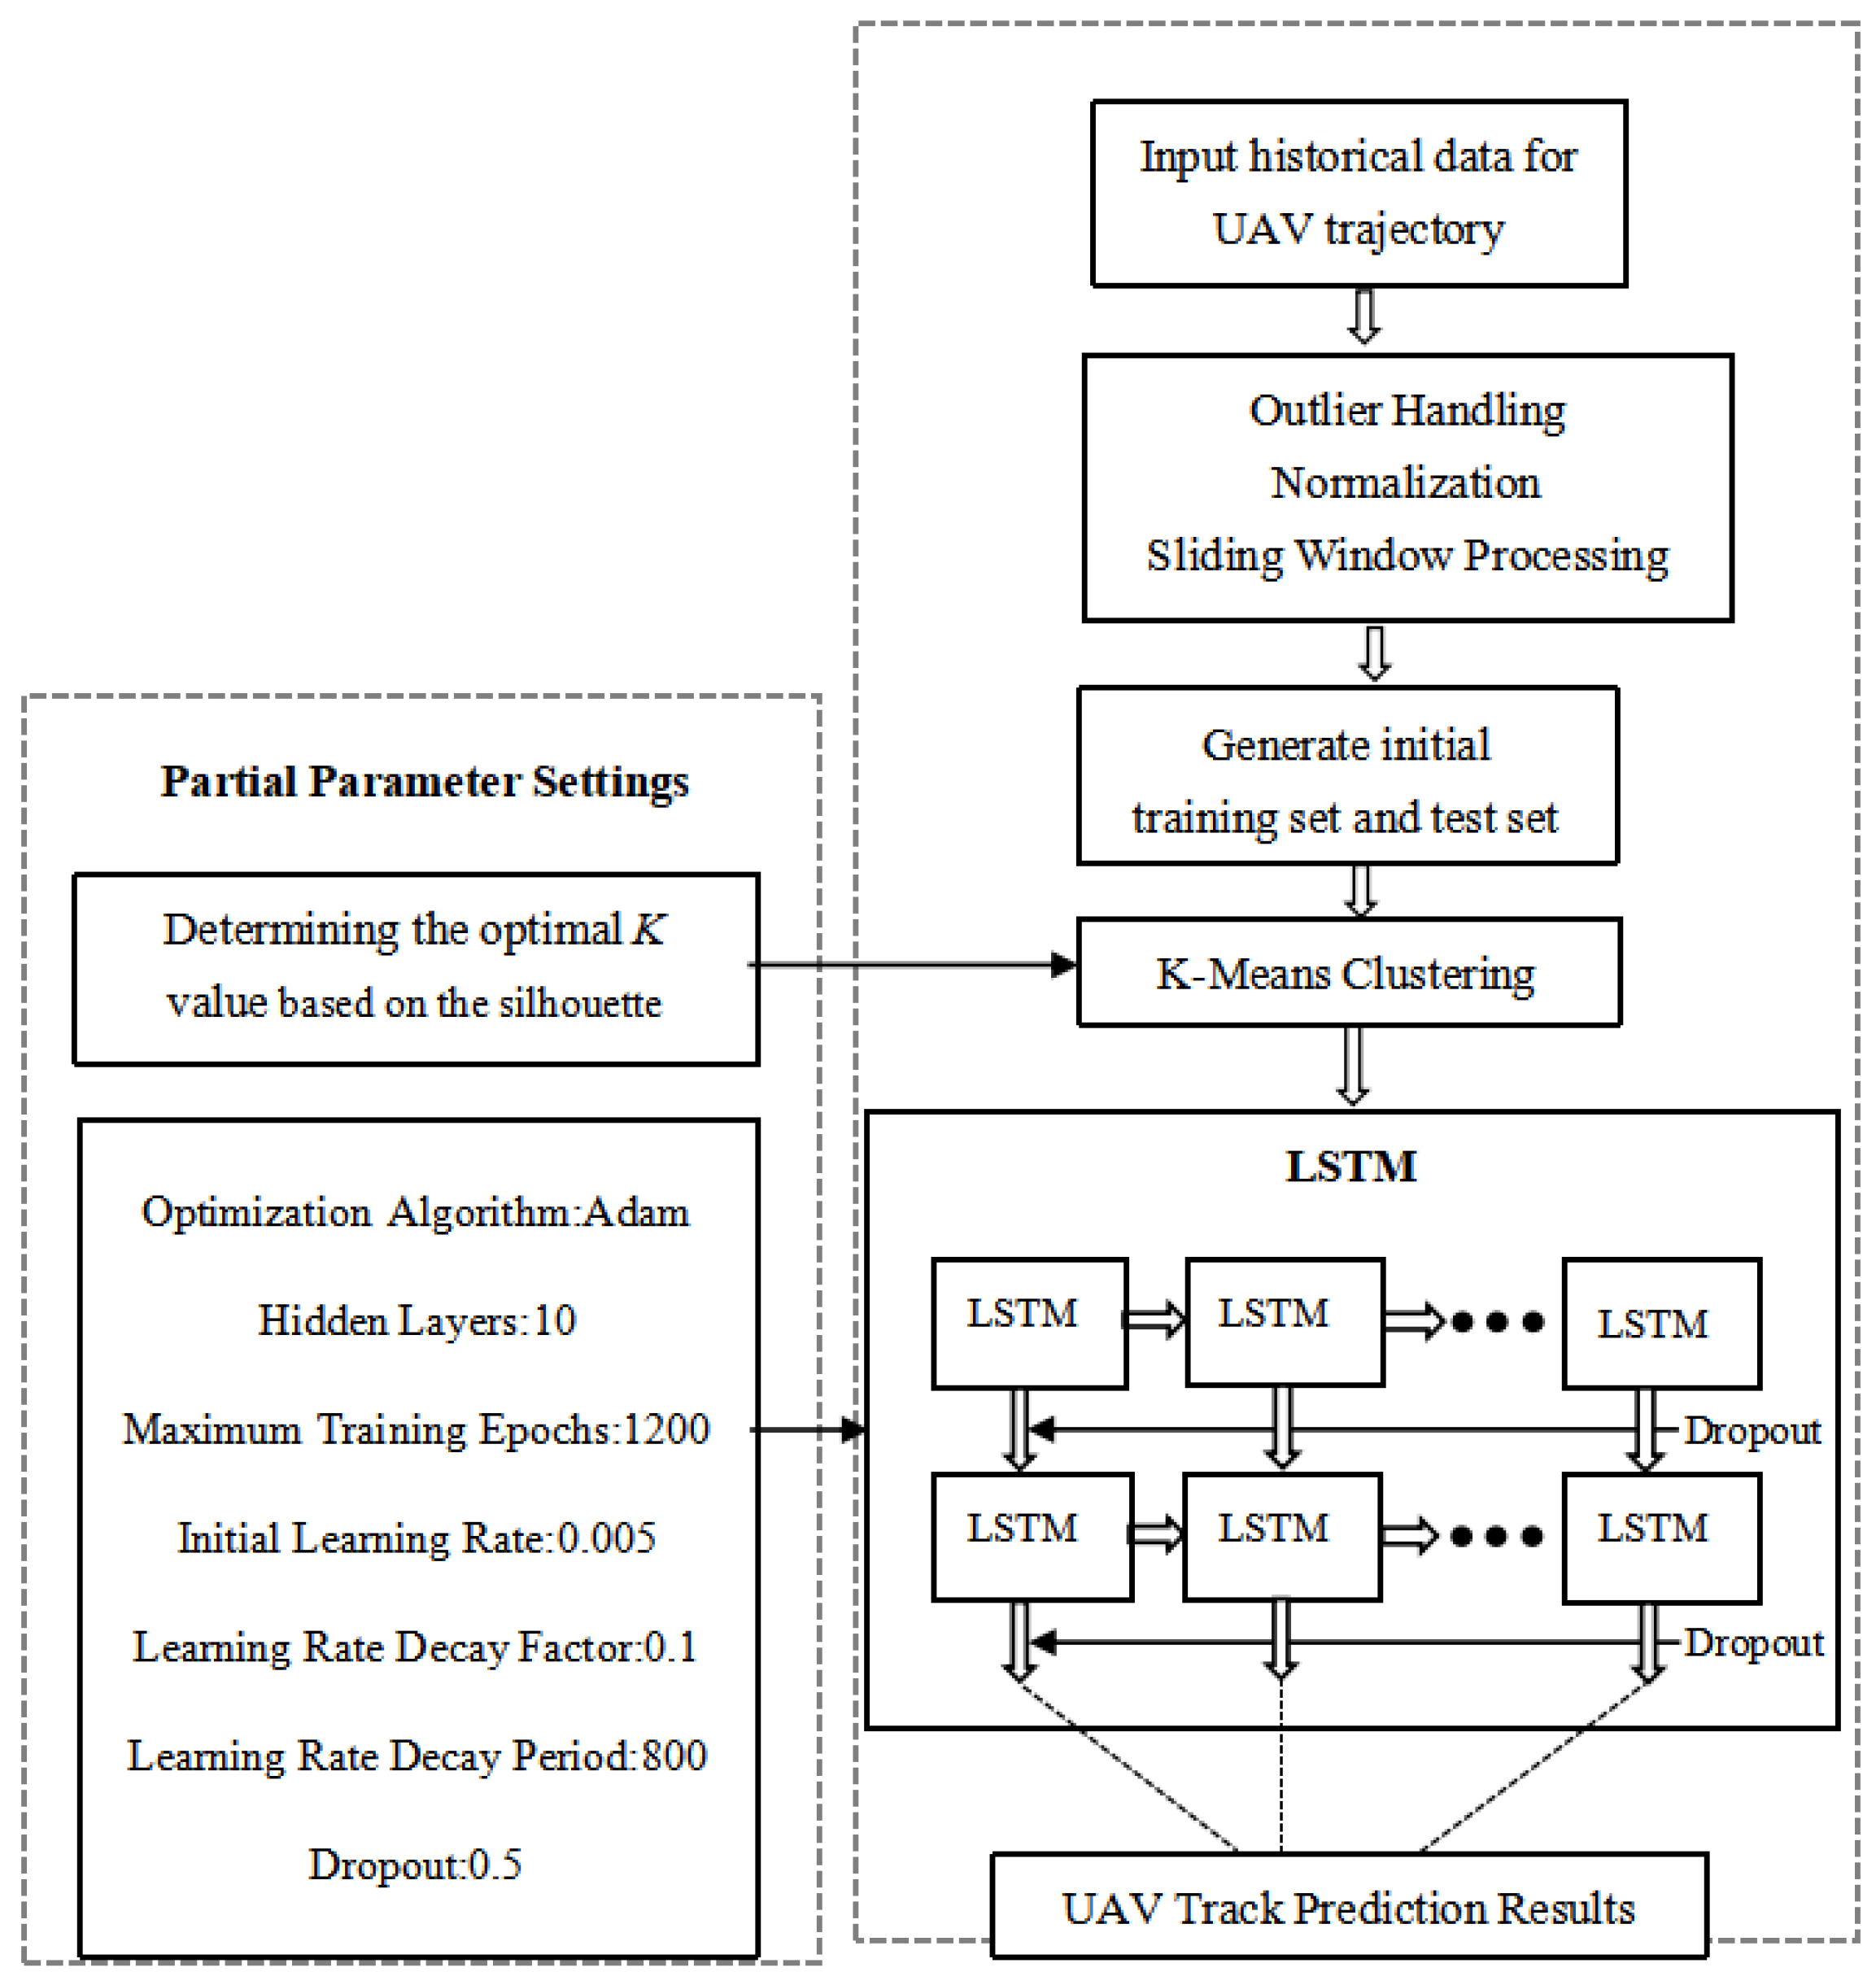
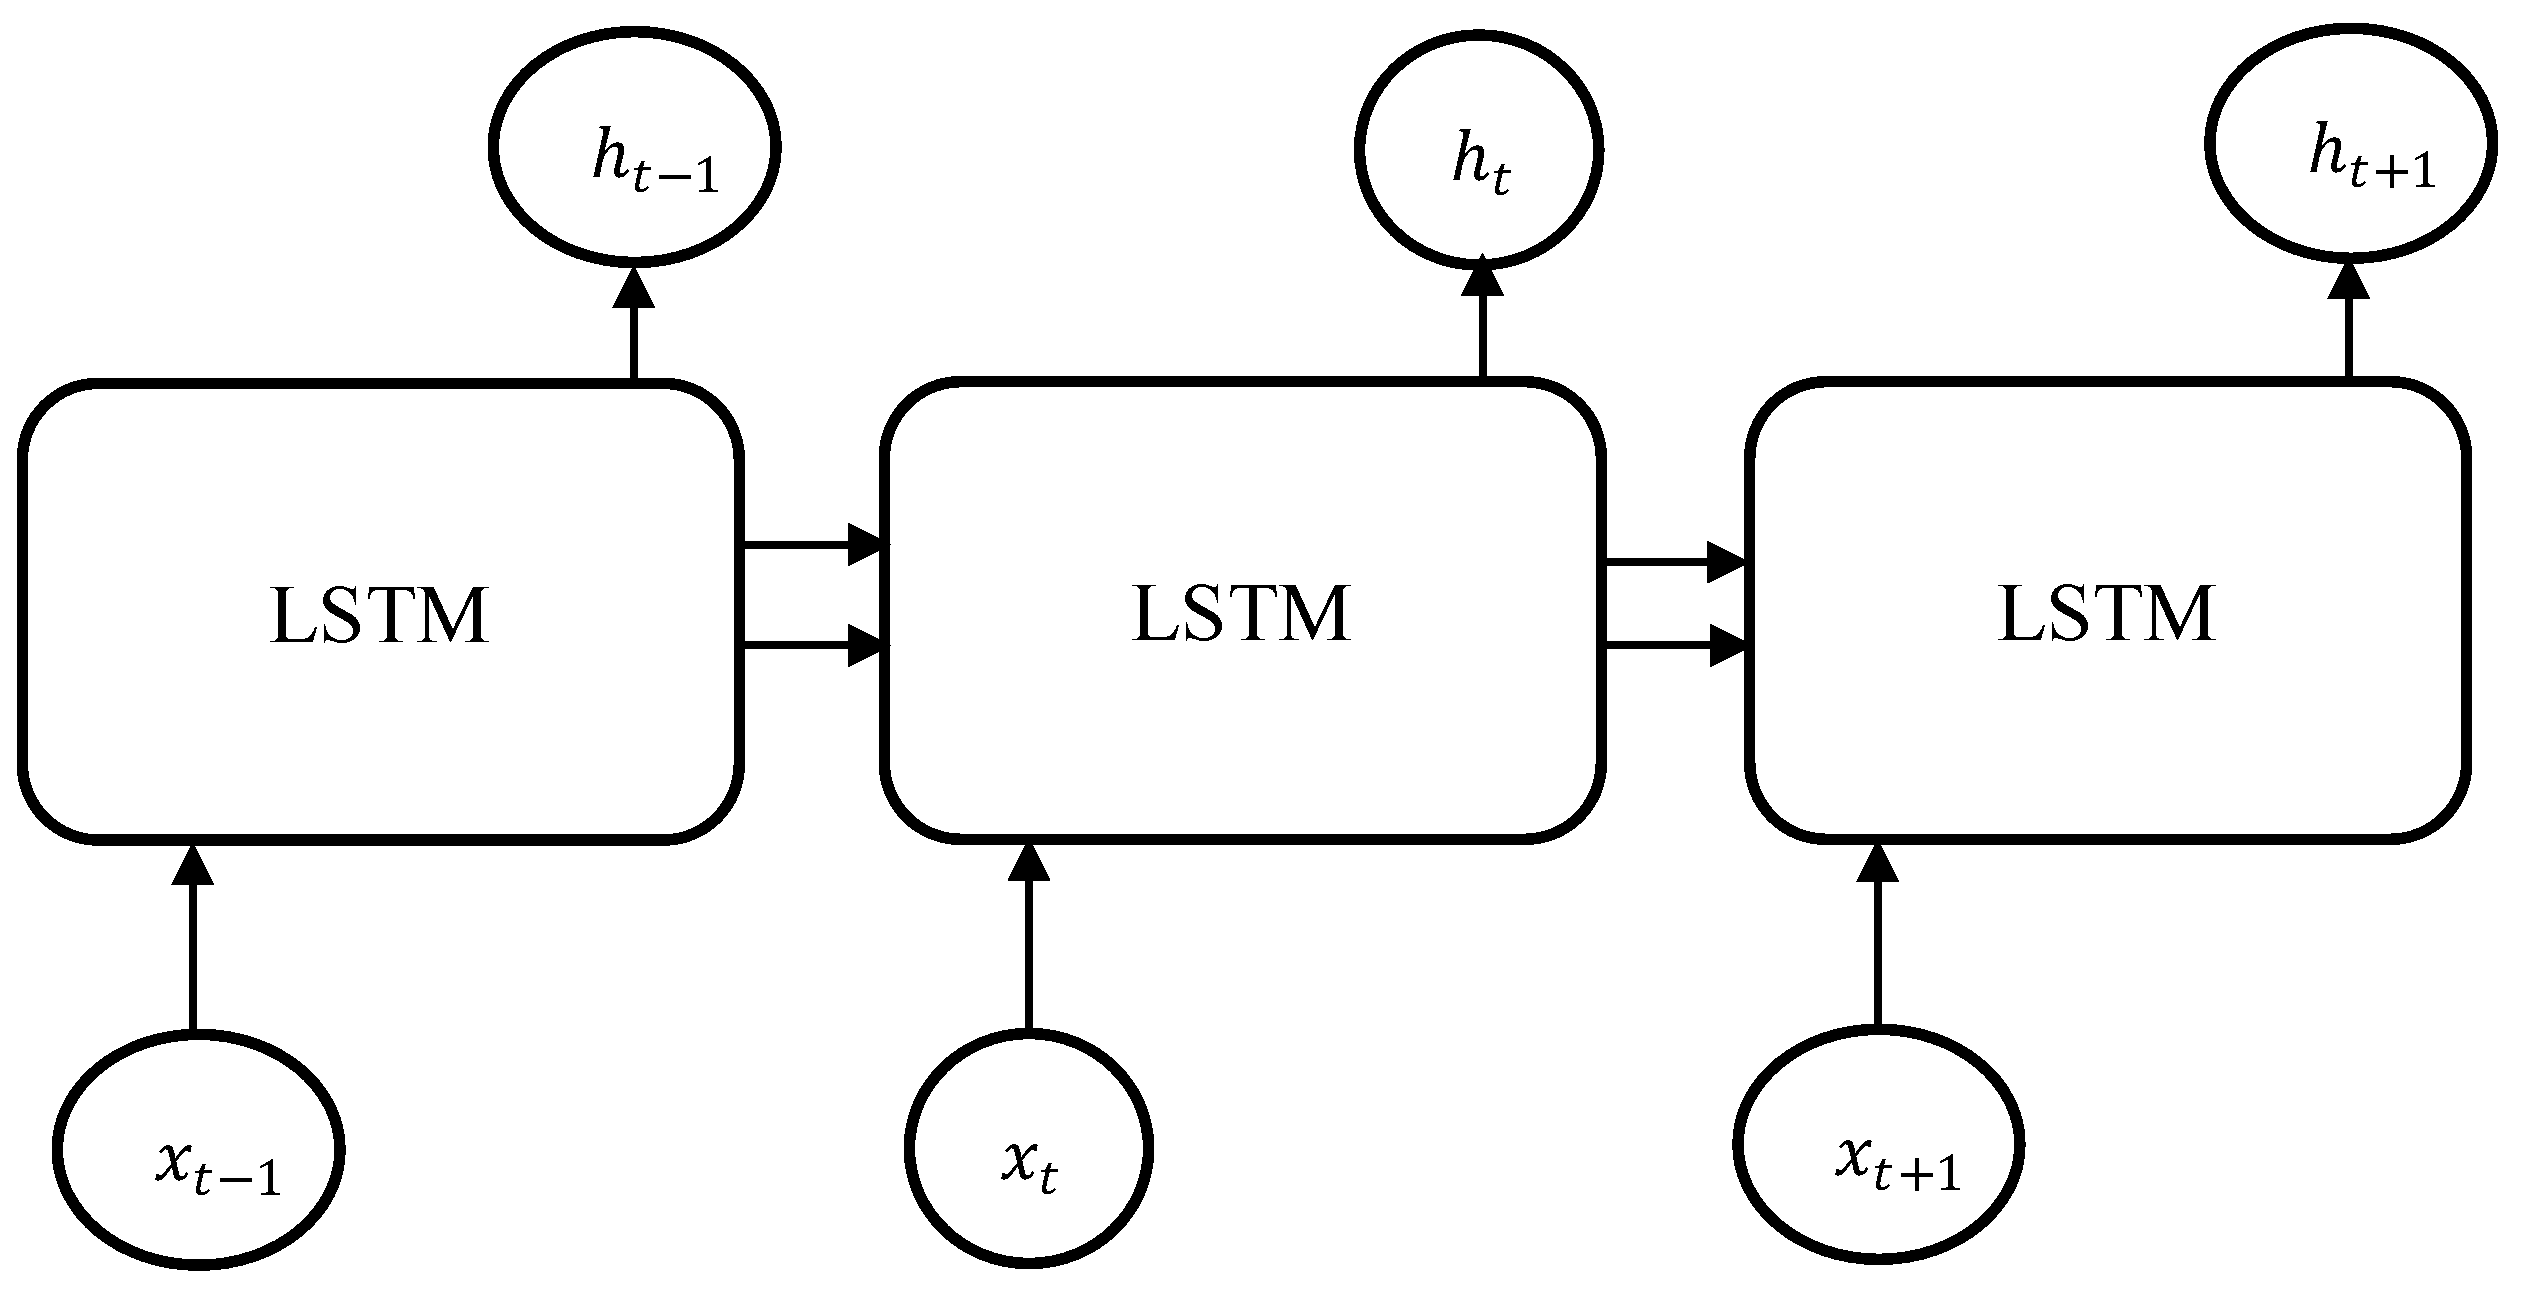
2.1.2. LSTM Prediction
This study employs LSTM networks to predict UAV tracks. Track prediction involves processing long data sequences, including multiple continuous time points of the UAVs’ position, speed, heading, etc. In comparison, back-propagation neural networks and CNN models may struggle with such long sequence data. One of the strengths of LSTM networks lies in their ability to effectively avoid the problem of vanishing gradients. The structure of LSTM networks endows them with strong performance in handling complex operation data of UAV logistics.
2.2. Separation Formulation Based on Position Error
The ICAO DOC9689 [26] provides considerations to calculate separation for manned aircraft separation, including air traffic characteristics, route structures, air traffic service capability, and the TLS. The document notes that aircraft collision avoidance capability should not be considered in separation. In contrast, the safe operation of UAVs heavily relies on collision avoidance ability, i.e., conflict detection and resolution (CDR) technology. Therefore, CDR mechanisms are considered in the establishment of separation for urban logistics UAVs. Except for the UAV position error caused by the track prediction, factors to be considered when calculating the separation required for the operation of urban logistics UAVs are as follows.
2.2.1. Flight Path Structure
Considering the rapid development of urban logistics UAV delivery services, the air traffic volume in low-altitude airspace will increase rapidly, becoming increasingly congested. To fully leverage the lightweight, agile advantages of urban logistics UAVs, free flight can reduce flight path constraints, alleviate flight route pressure, and effectively address future low-altitude airspace congestion issues. However, it is worth noting that in free flight, airspace operation becomes more complex, conflict increases, and safety risk rises. Therefore, it is necessary to analyze and assess the air collision risk of urban logistics UAVs in free flight.
2.2.2. Air Traffic Service Capability
Air traffic service capability includes communication, navigation, and surveillance capability, which need to be considered when setting separation. Communication capability covers the methods of communication between controllers and pilots and the availability, reliability, and capacity of communication systems. Navigation capability considers required navigation performance, navigation precision, and timing accuracy. Surveillance capability depends on the surveillance system used, such as automatic dependent surveillance systems, which need to consider update rates, display precision, and sensor accuracy.
This paper focuses on urban logistics UAVs, analyzing the impact of positioning errors on collision risk, referring to track prediction errors rather than the traditional study of navigation and location-update-frequency-induced positioning errors.
2.2.3. Target Level of Safety
For UAVs, JARUS [18] proposes defining the UAV collision TLS as the number of mid-air collisions per flight hour, with a TLS of 1 × 10⁻⁶. The SORA definition of the TLS differs from and is lower than that for manned aircraft. By comprehensively considering domestic and international research findings [27], a TLS value of 10−6 is chosen.
2.2.4. UAV Performance
Not only the flow data, which directly relate to the conflict frequency, but also the performance of UAVs will affect separation calculation in terms of traffic characteristics. UAV performance parameters include horizontal speed, vertical speed, takeoff weight, dimensions, load factor, wind resistance, maximum bank angle, turning radius, etc. Moreover, some UAVs and their ground control platform have collision avoidance capability, thereby detecting and avoiding obstacles through CDR technology. CDR includes air traffic control modules and flight control collision avoidance modules. Upon conflict, the CDR activates the air traffic control module (equivalent to a controller), computes and issues avoidance commands, and ultimately drives the UAV flight control module (equivalent to a pilot) to execute the command. Both command calculation and execution require response time. Simultaneously, parameters, such as the required avoidance distance, will affect separation formulation.
3. Separation Calculation Model Based on Track Prediction
3.1. Track Prediction Model
To achieve autonomous separation maintenance, firstly, it is necessary to conduct autonomous track prediction. To improve prediction accuracy, a two-stage model is constructed. The prediction process is shown in Figure 1.
Figure 1.
Flowchart for track prediction.
This study combines the K-means classification model and the Adam–LSTM prediction model. The K-means model clusters track types, and the optimal number of clustering categories is evaluated using the silhouette coefficient. Subsequently, the Adam–LSTM model is used for each type of track data, thereby conducting training to realize the time series prediction of individual tracks.
3.1.1. K-Means Classification Model
Track data features, such as heading, latitude and longitude, altitude, and speed information, should be extracted firstly, and then the K-means model is applied for training to achieve clustering and classification. By introducing the silhouette coefficient to evaluate the clustering effect under different numbers of categories, the optimal number of categories is ultimately determined.
3.1.2. Adam–LSTM Prediction Model
LSTM is a special type of recurrent neural network structure used for processing sequential data. The overall structure diagram is shown in Figure 2. An individual LSTM internal unit is depicted in Figure 3.
Figure 2.
LSTM’s overall structure.
Figure 3.
LSTM’s individual element structure. The two input variables in the asterisk are dotted.
By incorporating the Adam optimizer, the learning rate of the LSTM model can be automatically adjusted to achieve rapid convergence.
3.2. Separation Calculation Model
The separation calculation model comprises two main aspects: the conflict frequency and the collision probability in conflict. Conflict frequency refers to the frequency at which two UAVs come close to each other and fall below the separation, represented by the number of conflicts per flight hour, which is the frequency of separation violations. The conflict frequency depends on traffic density, route structures, and the separation. The larger the separation, the higher the conflict frequency in the same operational airspace. The collision probability in conflict depends on various factors, such as the UAV size, speed, position error, and CDR capability. Under a given separation, smaller UAVs, lower speeds, more accurate positions, and faster CDR responses will lead to a lower collision probability.
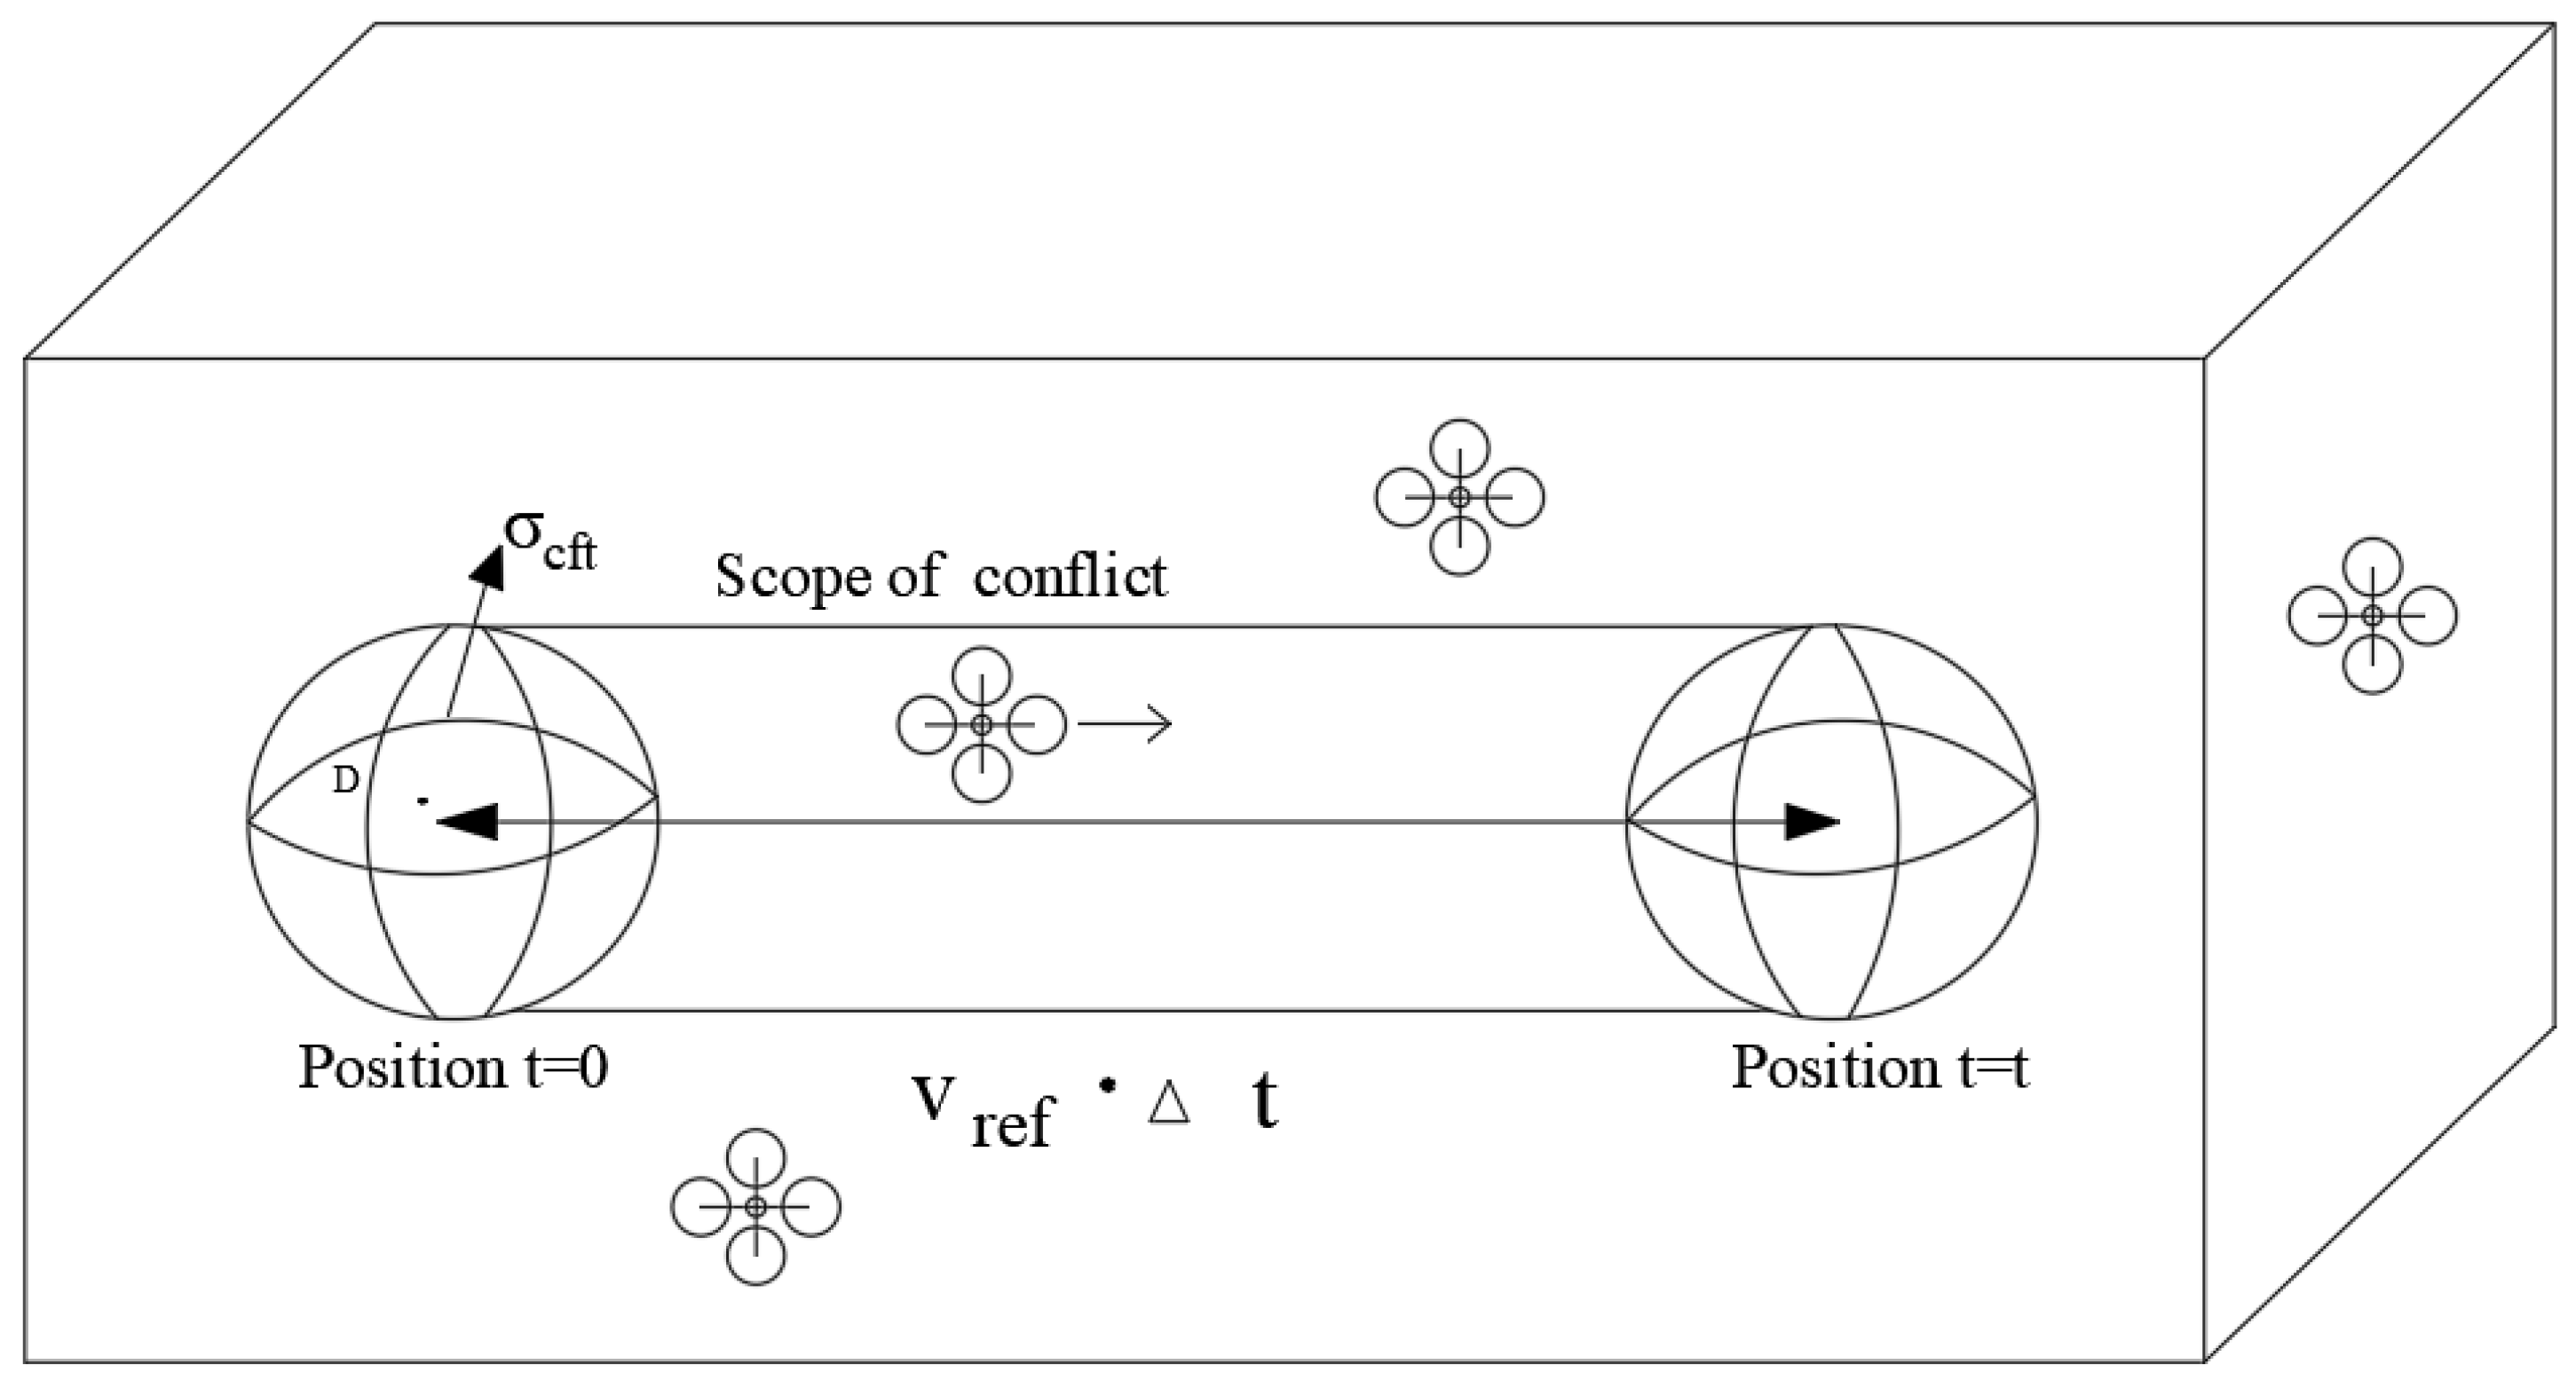
3.2.1. Conflict Frequency
A model for calculating conflict frequency is constructed by designing a gas model. The advantage of a gas model is to quantify collision risk between uniformly distributed aircraft in an area and reflect free flight mode. According to the basic concept of the gas model [14], the conflict frequency between the host and the intruding aircraft is related to the instantaneous aircraft density, the frontal area of their encounter direction, and their respective speeds. To calculate the conflict frequency, some variables are preset.
To average the risk of conflicts occurring in all directions, the area where the host and intruding aircraft might conflict is assumed to be a circle with a radius equal to the separation D. If the distance between the centers of the two aircrafts is within D, a conflict occurs, as shown in Figure 4.
Figure 4.
UAV gas model.
Therefore, the conflict area is as shown in Equation (1):
In the formula, represents a conflict zone and D is the separation. The volume of the conflict airspace swept by the UAV in unit time is as shown in Equation (2):
In the formula, represents the volume of the conflict airspace swept by the UAV in unit time and is the relative speed, determined as a compromise value, as shown in Equation (3):
Within the aforementioned airspace area, conflict frequency equals the product of the unit volume and the aircraft density, as shown in Equation (4):
In the formula, is conflict frequency and is the number of aircrafts per unit volume, assuming that conflicts occur independently among aircrafts. The total conflict frequency within the airspace range can be obtained by multiplying the conflict frequency of a single aircraft by the number of aircrafts and divided by 2, as shown in Equation (5):
In the formula, N is the number of aircrafts.
3.2.2. Collision Probability in Conflict
When calculating separation, to ensure compliance with safety requirements in any case, the separation is calculated based on the most conservative head-on encounter mode. The separation needs to cover not only delays in control command calculation and execution but also the positioning error, as well as the maneuvering distance required for conflict resolution. Let D be the candidate value for separation. It can be expressed by Equation (6):
In the formula, D is the candidate value for separation; is the closure rate; is the response time of the air traffic control module; is the response time of the flight control module; is the maneuvering distance required for collision avoidance; and are the position prediction errors for each UAV.
The collision probability between two aircrafts is as shown in Equation (7):
Let be the actual required distance between two UAVs, as shown in Equation (8):
The probability density function of is as shown in Equation (9):
In the formula, is the mean of and is the standard deviation of .
Collision probability in conflict means the probability that exceeds D, as shown in Equation (10):
3.2.3. Overall Collision Probability
The overall collision risk can be yielded by integrating conflict frequency with collision probability in conflict, in which one collision is equivalent to two accidents. The collision risk should not exceed the TLS, as shown in Equations (11) and (12):
In the formula, TLS is the target level of safety.
4. Case Application
Applying the above UAV separation model based on track prediction, the required separation between UAVs in free flight is studied.
4.1. Calculation of Track Prediction Error
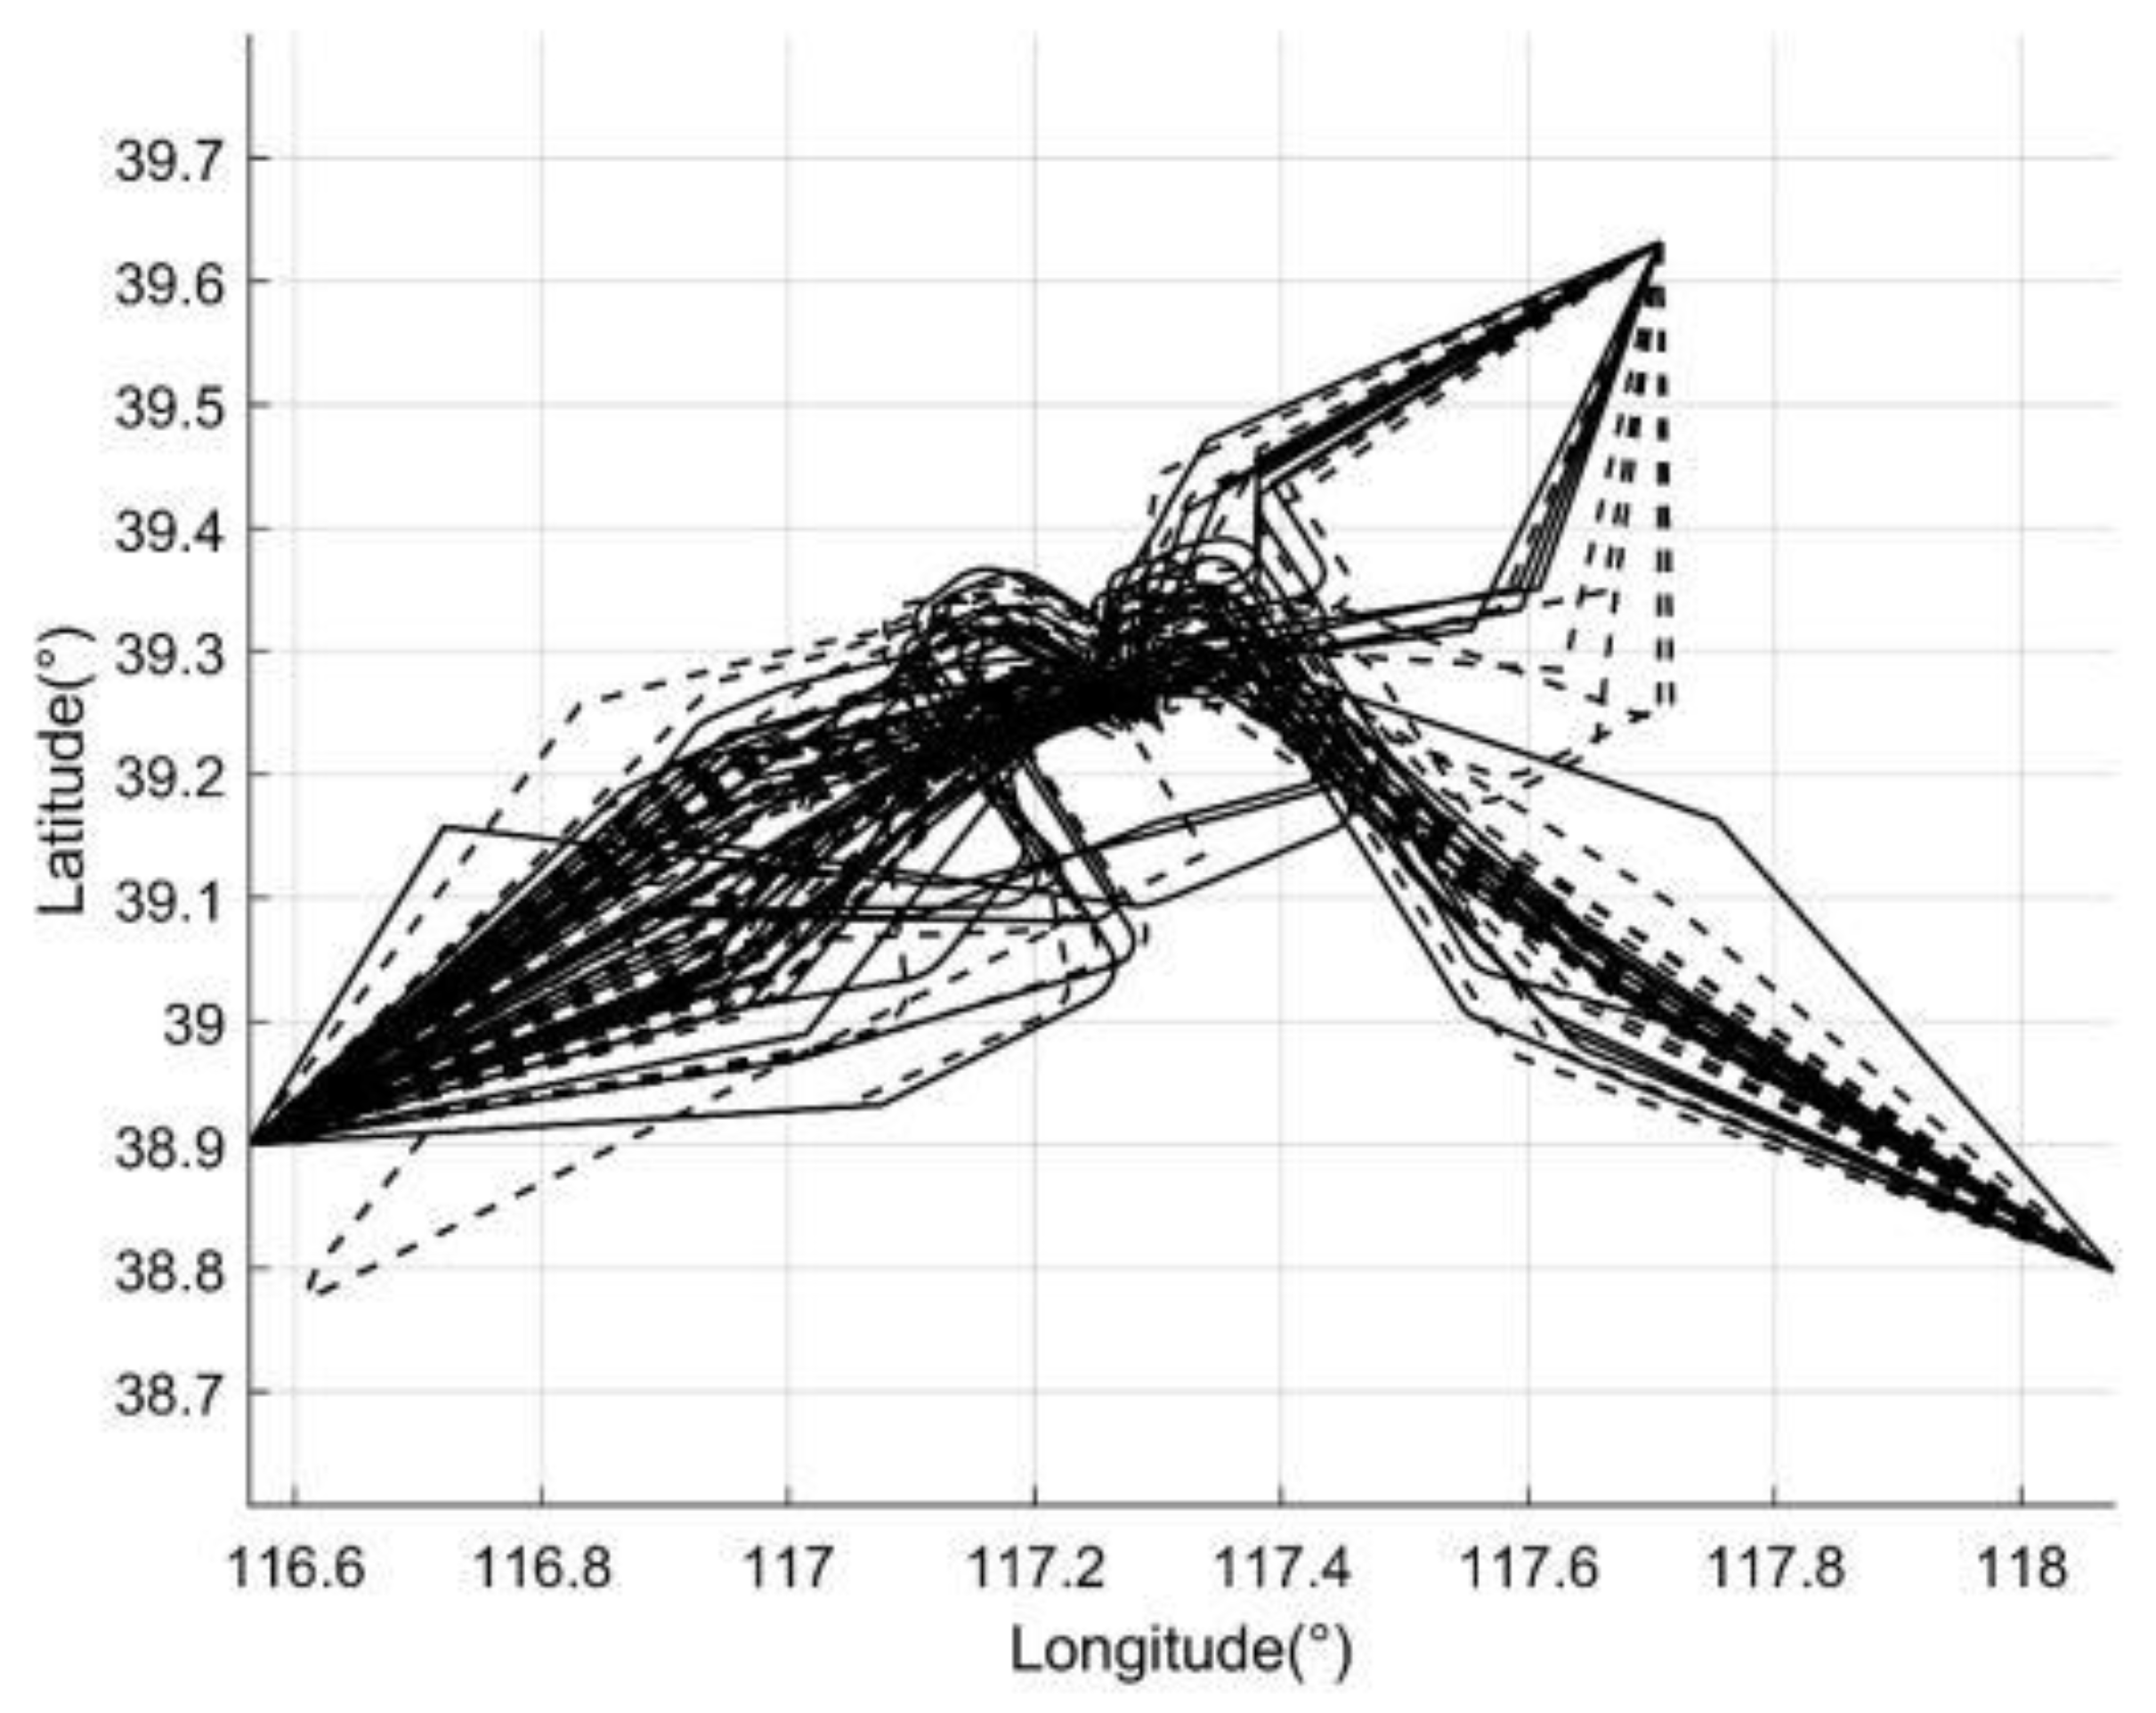
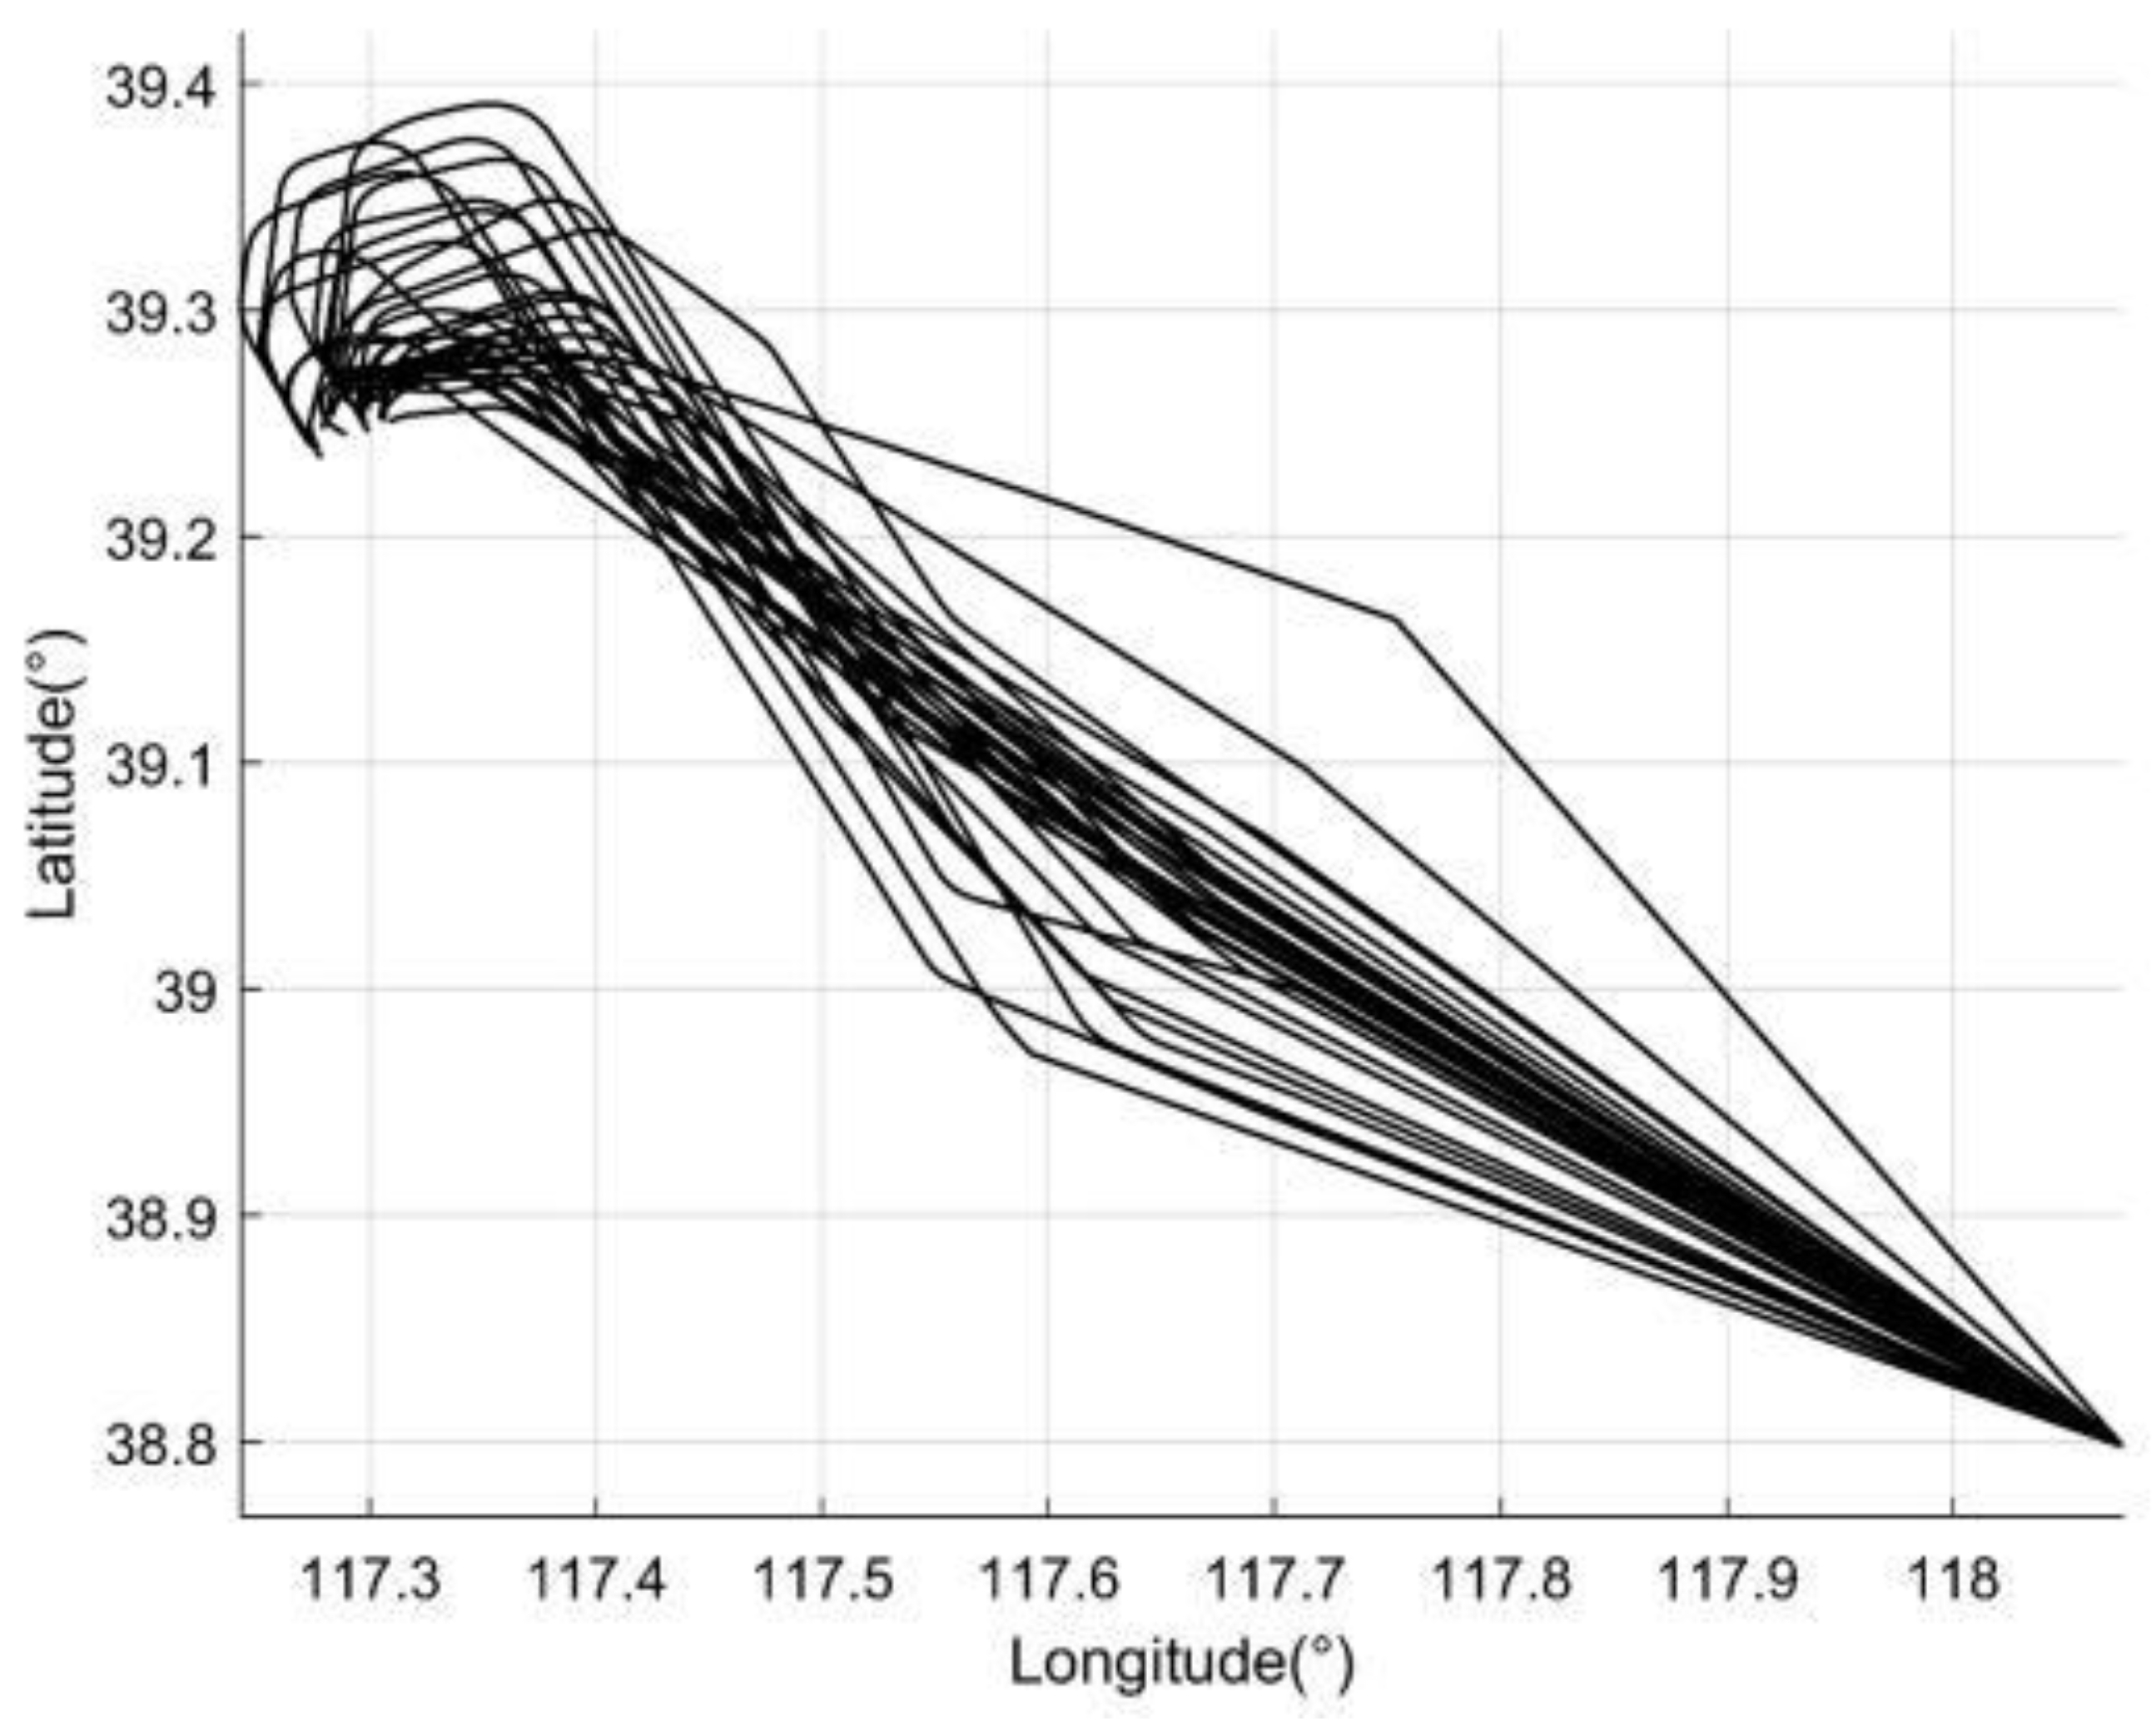
4.1.1. Data Source
For this model solution, the data source selected is 7 days of urban logistics UAVs flight data in May 2021, with an average of about 26,000 tracks per day, totaling 182,511 track data. There are six delivery routes in total. The logistics distribution in this case is from a central station to three stations, each with two alternative routes. Within these data, there are approximately 15 flight operations per day for each route, covering the phases of departure climb, cruise, and descent landing.
As previously mentioned, to achieve autonomous separation maintenance, track prediction is necessary. To improve prediction accuracy, a two-stage track prediction model is constructed based on historical operational data. The historical data are clustered and classified, yielding the following operational results.
4.1.2. Clustering and Classification
Using the K-means classification model, UAV track data are clustered and classified based on certain parameters, such as mission attributes, model types, altitude, latitude, and longitude. The overall clustering results are shown in Figure 5.
Figure 5.
UAV track data clustering.
To determine the optimal number of clusters, the silhouette coefficient is introduced to select the best cluster quantity. Through clustering of the data and programming implementation, the optimal number of clusters is determined to be six, as shown in Figure 6, where the silhouette coefficient reaches its maximum value of 0.8365.
Figure 6.
UAV track data clustering profile coefficient.
For the track data, the aforementioned model is applied. The data are classified according to the six clustering categories. The figure below shows the track classification from the central station to the third station, as shown in Figure 7.
Figure 7.
Examples of UAV track data classification.
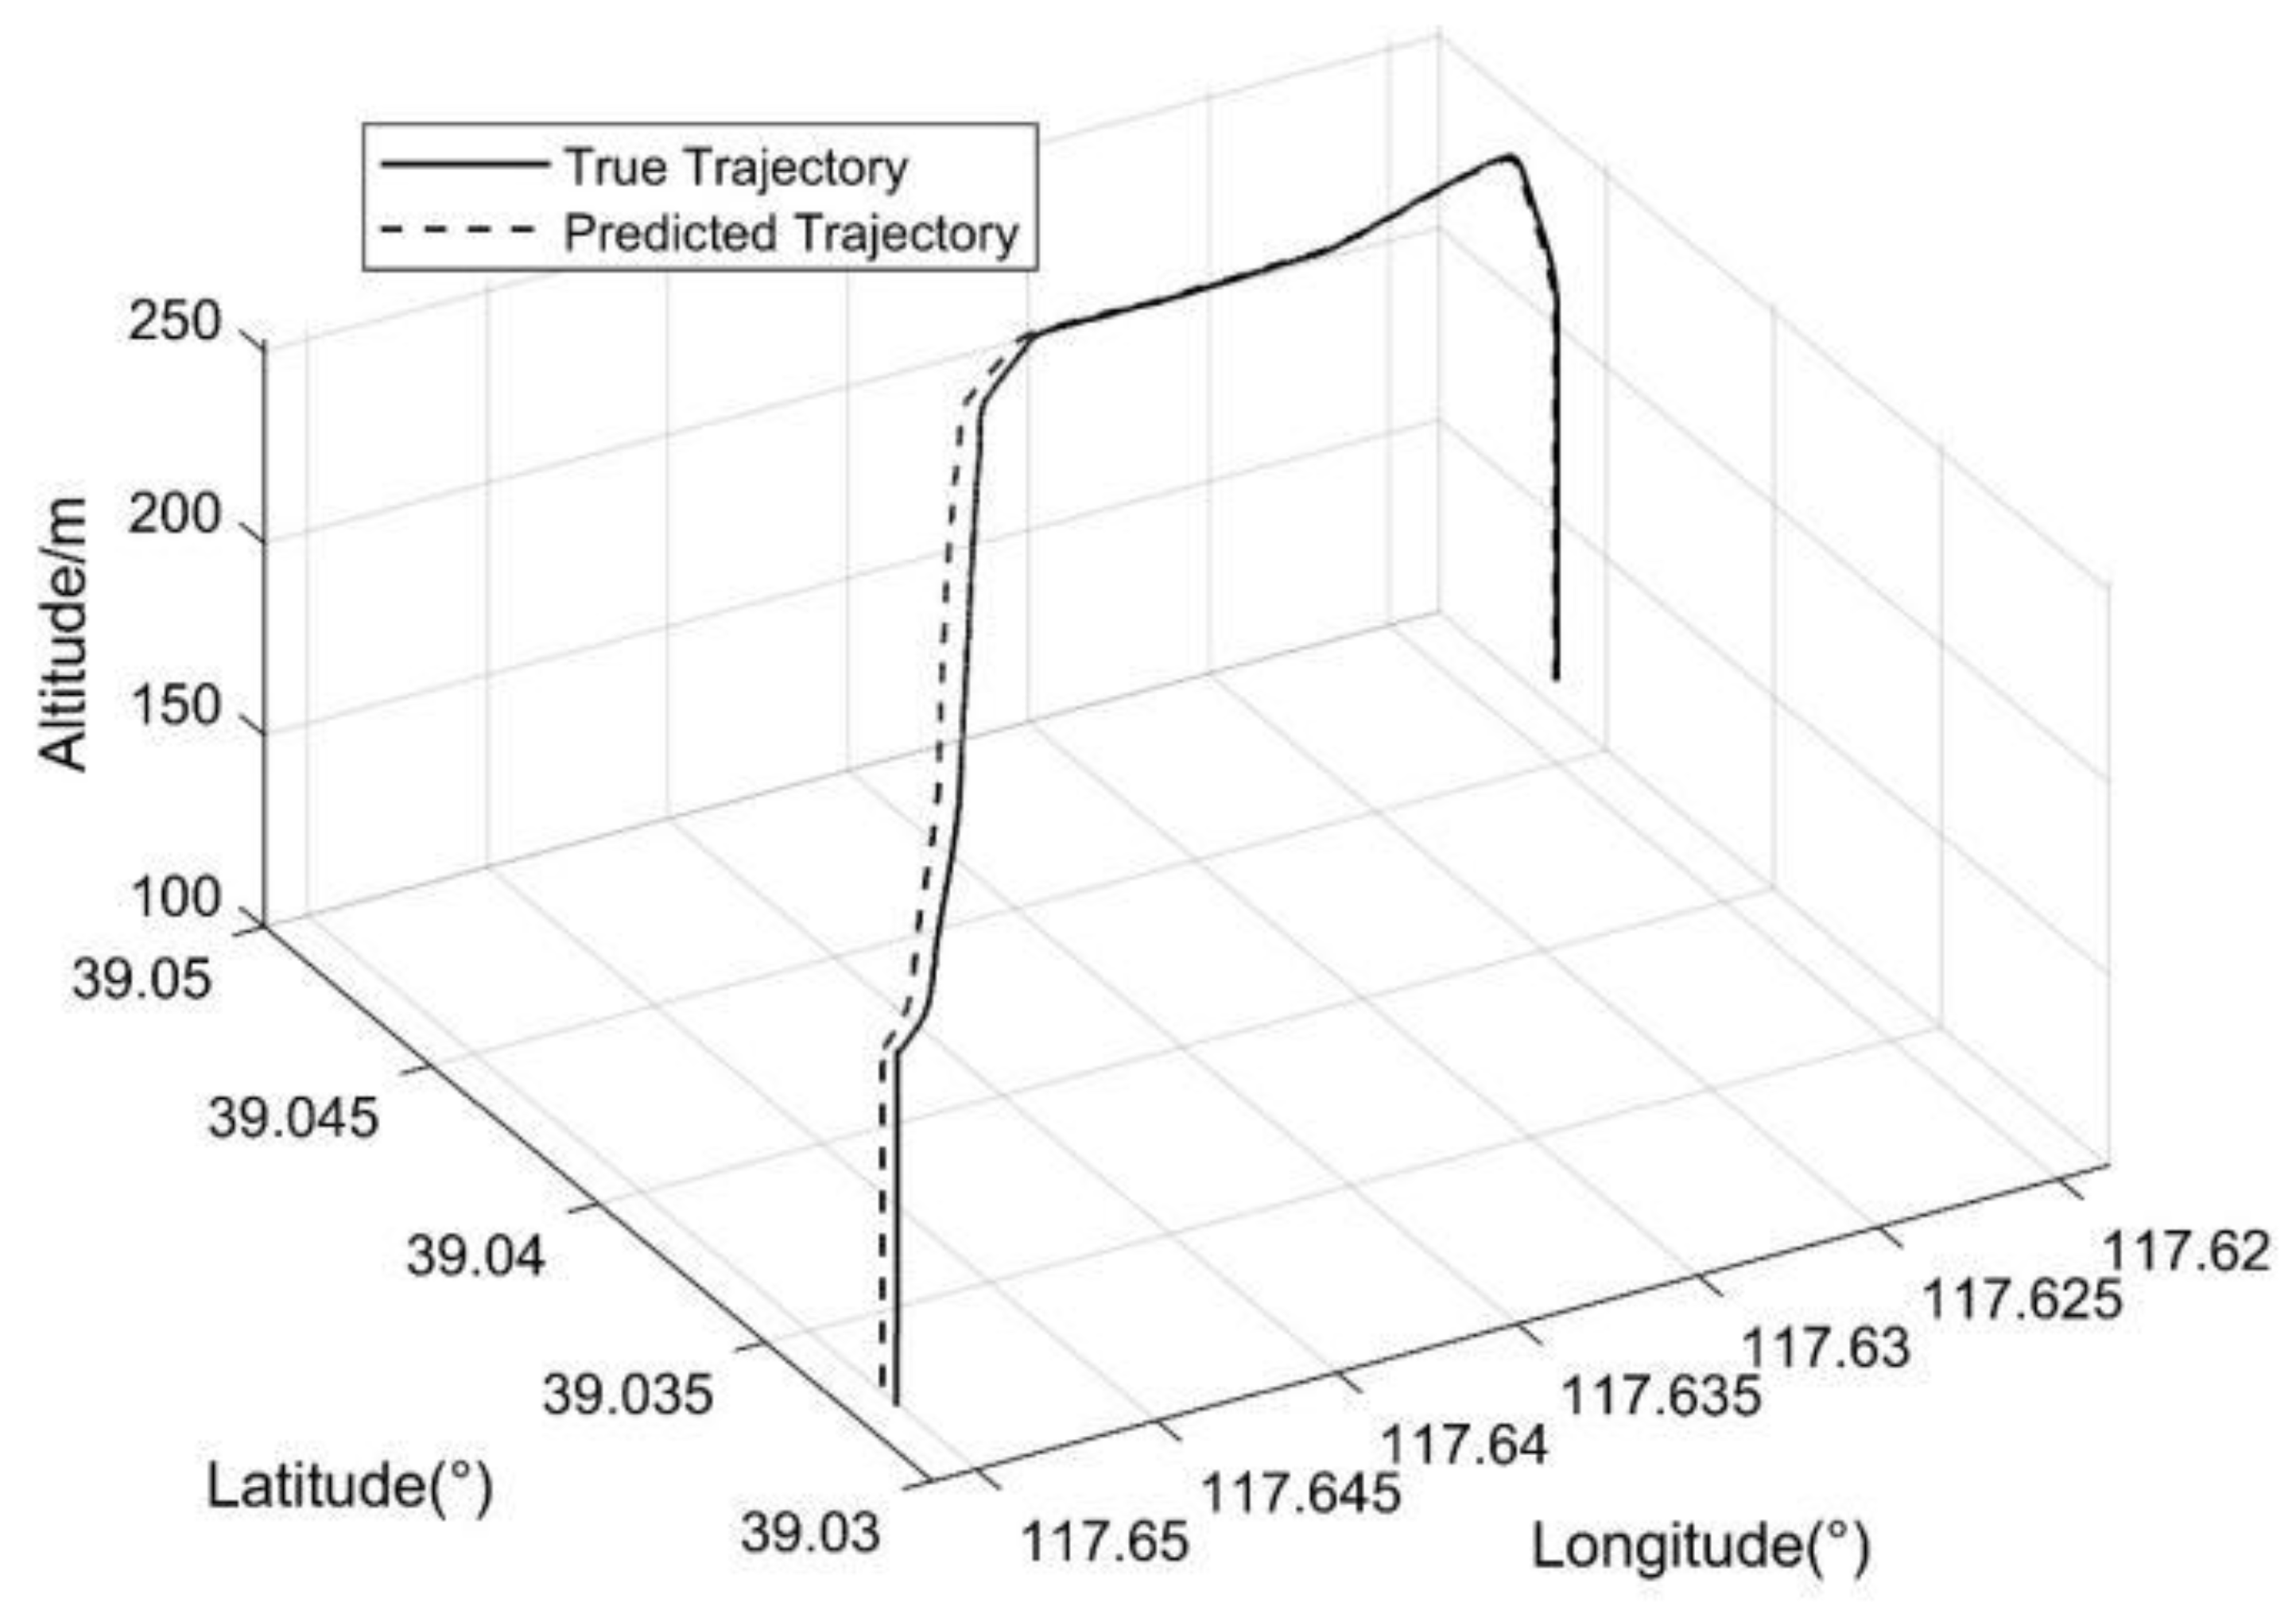
4.1.3. Track Prediction
Based on the aforementioned track classification results, track prediction studies are conducted for each category. Initially, each category of track data needs to be segmented by selecting 60% as the training set, 20% as the validation set, and 20% as the test set. The Adam–LSTM prediction model is chosen for this study. In this research, the LSTM model takes data from 10 track points as input and predicts data for 1 future track point. Track predictions are carried out for each category, and the track prediction effect is shown in Figure 8.
Figure 8.
Examples of comparison of the predicted value with the true value.
Based on the provided track prediction graph, it is intuitively observed that the predicted track is very close to the actual track, indicating that the prediction model is effective.
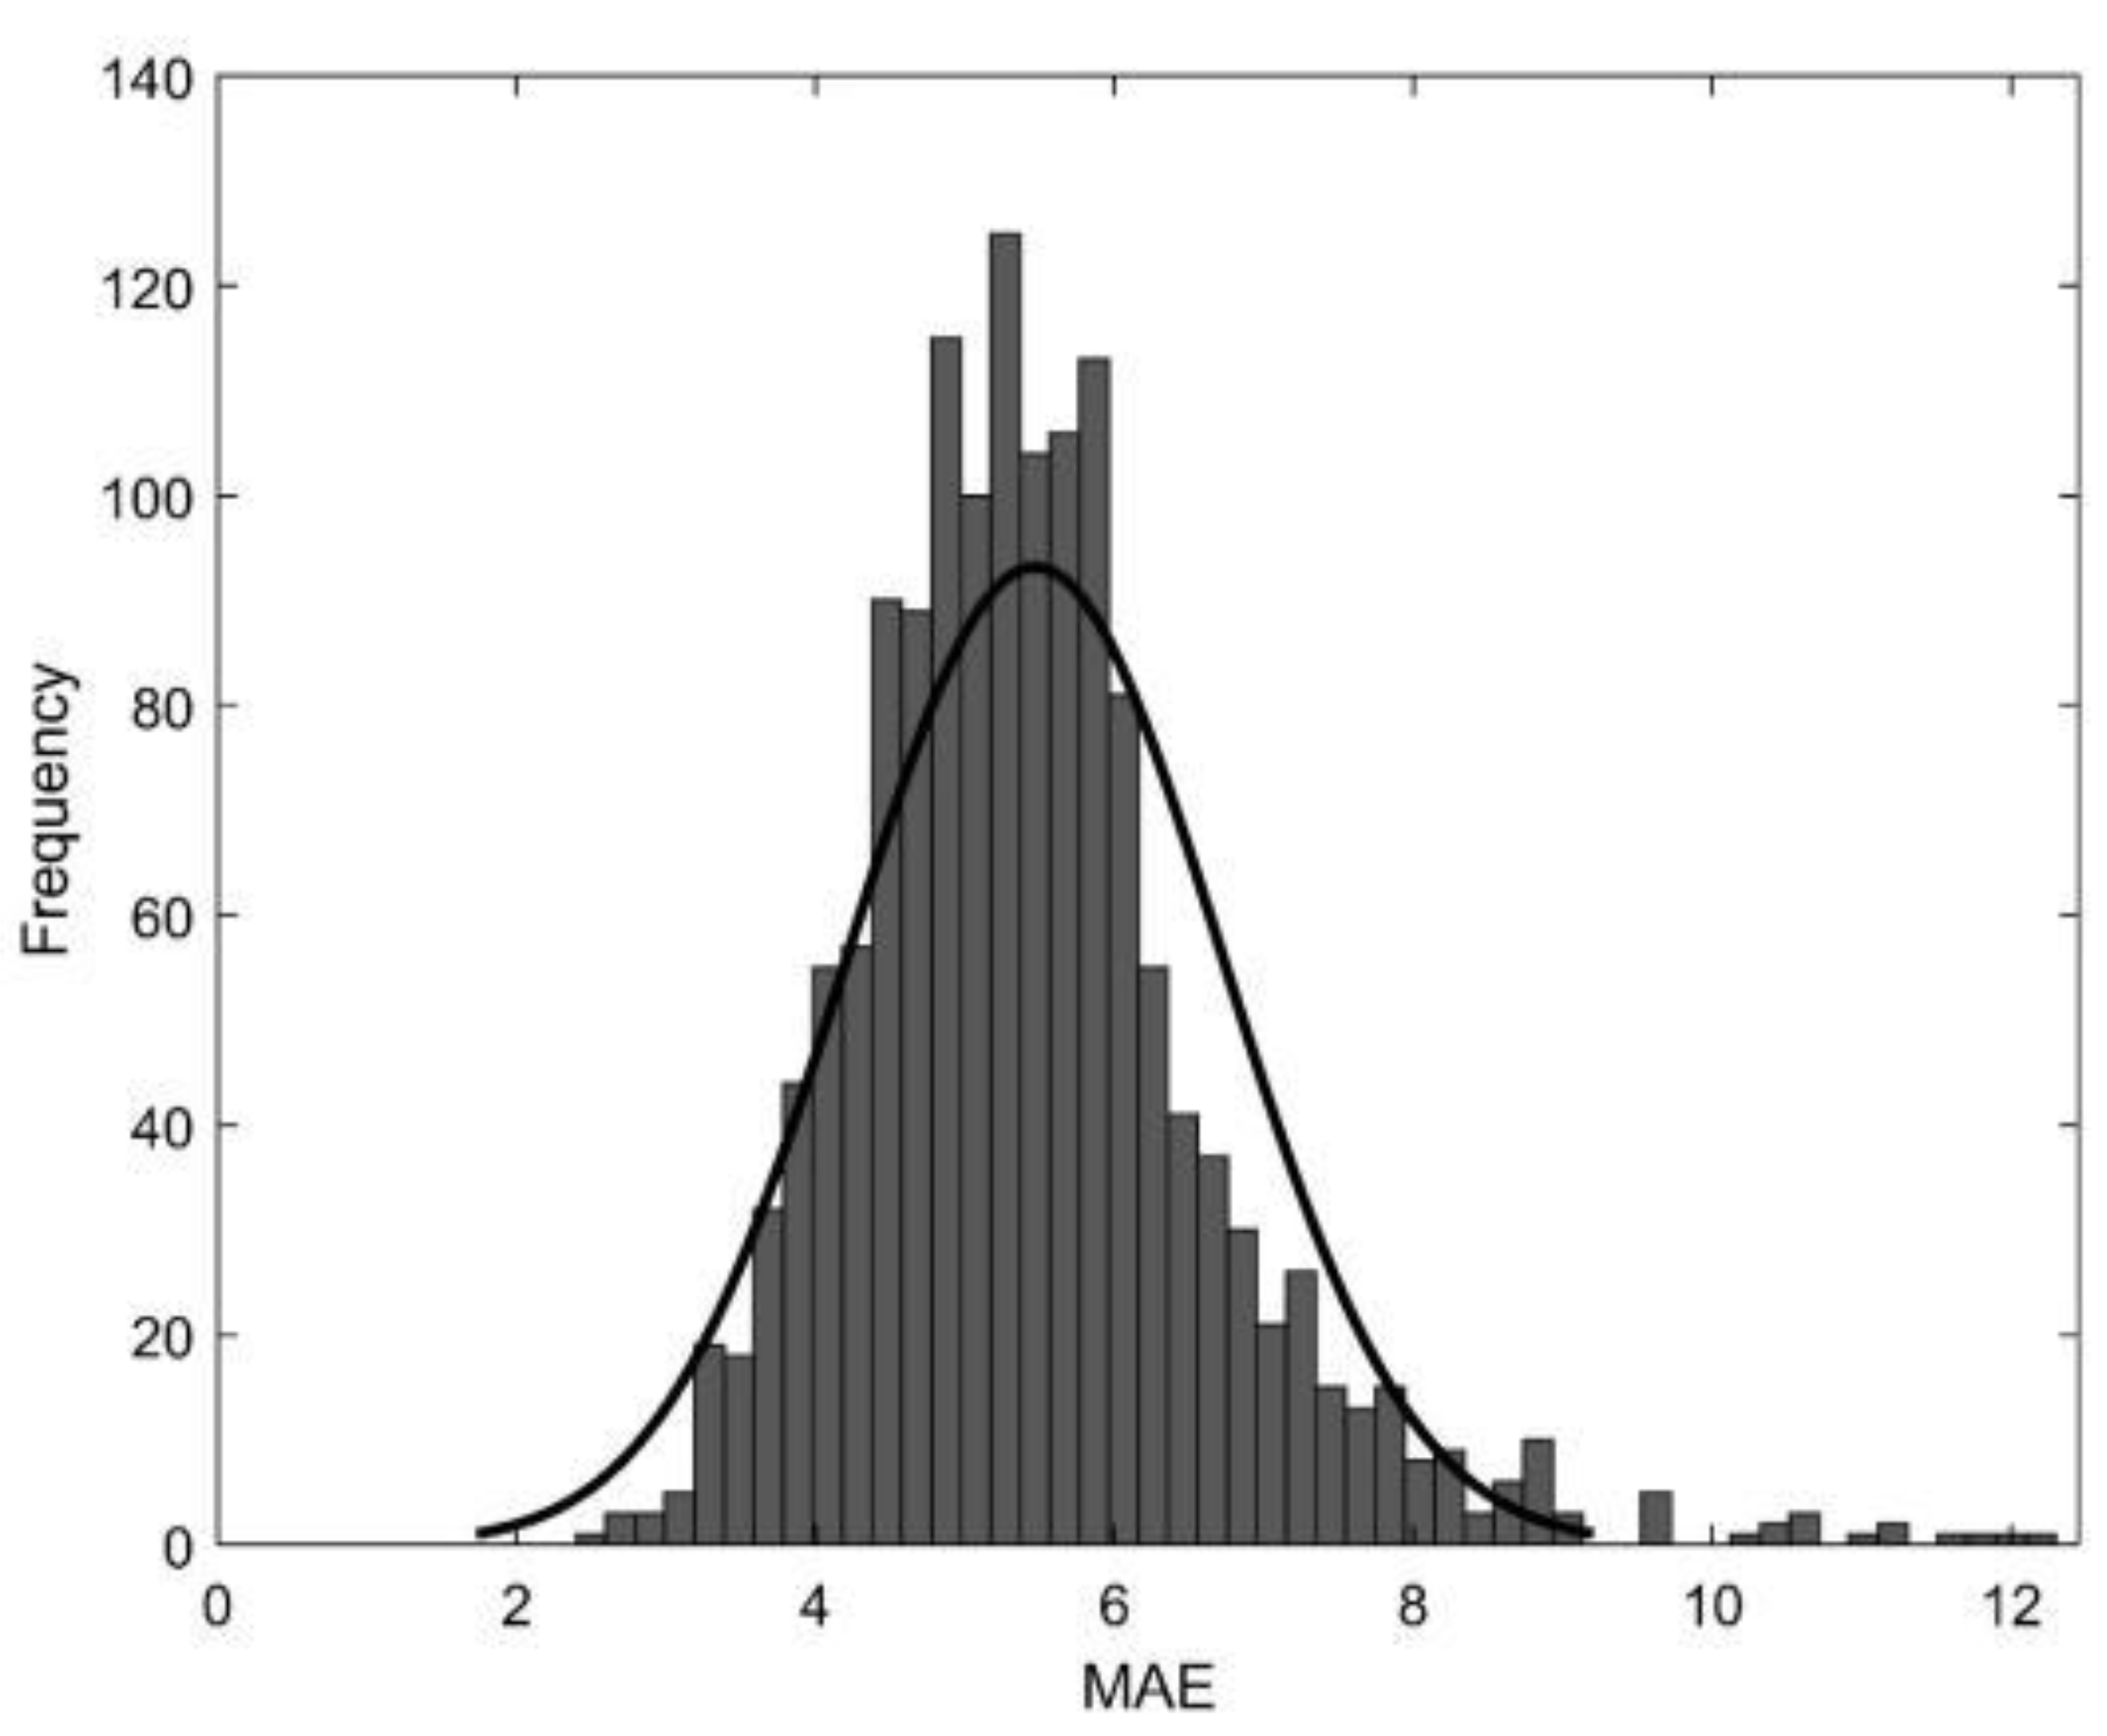
4.1.4. Prediction Error Calculation
Through repeated predictions, it is summarized that the prediction error follows a normal distribution, as shown in Figure 9, where the Mean Absolute Error (MAE) is used to compute the average absolute variance between the predicted value and the actual value.
Figure 9.
Normal distribution fitting plot of MAE data.
The fitted probability density function for the track prediction error is N(5.47, 1.252).
4.2. Calculation of Required Separation
Based on the separation calculation model, the required separation for UAVs in free flight is studied.
4.2.1. Conflict Frequency
Assume there are four UAVs operating within a three-dimensional space of 40 km∗10 km∗2 km, with a set speed of 12 m/s each, as shown in Figure 10.
Figure 10.
UAVs in free flight.
The number of aircrafts per unit volume, the area of the conflict region, and the relative speed are as shown in Equations (13)–(15):
The conflict frequency is:
4.2.2. Collision Probability in Conflict
Parameters
The parameters involved in the calculation process, along with their symbols and values, are shown in Table 1.
Table 1.
The parameters for collision probability calculation.
Required Avoidance Distance
When calculating the required avoidance distance, it is necessary to assess extreme conflict situations, specifically, when two aircrafts encounter each other head-on and implement a horizontal avoidance maneuver. Let the maneuvering avoidance distance be , as shown in Figure 11.
Figure 11.
Two UAVs’ head-on encounter.
Each UAV has a speed of 12 m/s, with a closure rate of 24 m/s. The combined physical dimension of the two aircrafts, , is 5 m, which corresponds to the collision threshold. Considering that some UAVs are fixed-wing, for safety reasons, the method for calculating manned aircraft turning parameters is applied. The maximum tilt angle of the UAV is set to 25°, and the coordinated turn load factor is taken as 1.1 g according to the ICAO DOC8168 [21]. The derivation of the turn rate is shown in Equations (17)–(19):
To calculate , it is necessary to identify when the two UAVs are at the closest point of approach (CPA), , as shown in Equations (20)–(24):
The calculation result is 26 m. This value represents the required avoidance distance without considering track prediction error, response time, etc.
Collision Probability Calculation
As Table 1 shows, the single UAV track prediction error conforms to the normal distributions N(5.47, 1.252). So, the distance between the two UAVs conforms to the normal distributions N(10.94, 1.772). Furthermore, the response time for the air traffic control and flight control module corresponds to 1.92 m, and the required avoidance distance is 26 m. According to Equation (8), the probability density function for the two UAVs’ actual required distance corresponding to the normal distribution is N(38.86, 1.772). This value represents the required separation considering track prediction error and response time. Based on these data, the collision probability in conflict can be calculated using Equation (10).
Calculation of Required Separation
By substituting the conflict frequency and the collision probability in conflict into Equation (11), the overall collision risk is obtained, as shown in Equation (25):
Let , to determine the required separation for UAVs.
5. Results Analysis
The results of the case study above are analyzed from the perspective of track prediction and separation calculation.
5.1. Two-Stage and Traditional Prediction Comparison
To quantitatively evaluate the practical effectiveness of the two-stage track prediction method proposed in this article, a comparison with the prediction results of the traditional LSTM is made based on three effectiveness indicators, respectively. The computation of the Root Mean Square Error (RMSE) can be executed by squaring the difference between each predicted value and its corresponding true value, summing them, calculating the average, and, finally, taking the square root to derive the RMSE value. The computation of the Mean Absolute Error (MAE) can be executed by computing the average absolute variance between the predicted value and the actual value. The computation of the Mean Absolute Percentage Error (MAPE) can be executed by measuring the percentage of variance between the predicted value and the actual value. The smaller the value of the RMSE, MAE, and MAPE, the higher the accuracy of the model, as shown in Table 2.
Table 2.
Comparison of track prediction model effects.
From the perspective of quantitative evaluation indicators, the accuracy of not only individual elements, such as track longitude, latitude, and altitude, but also the total prediction accuracy, but also the two-stage prediction outperform the traditional prediction method.
5.2. Separation Calculation
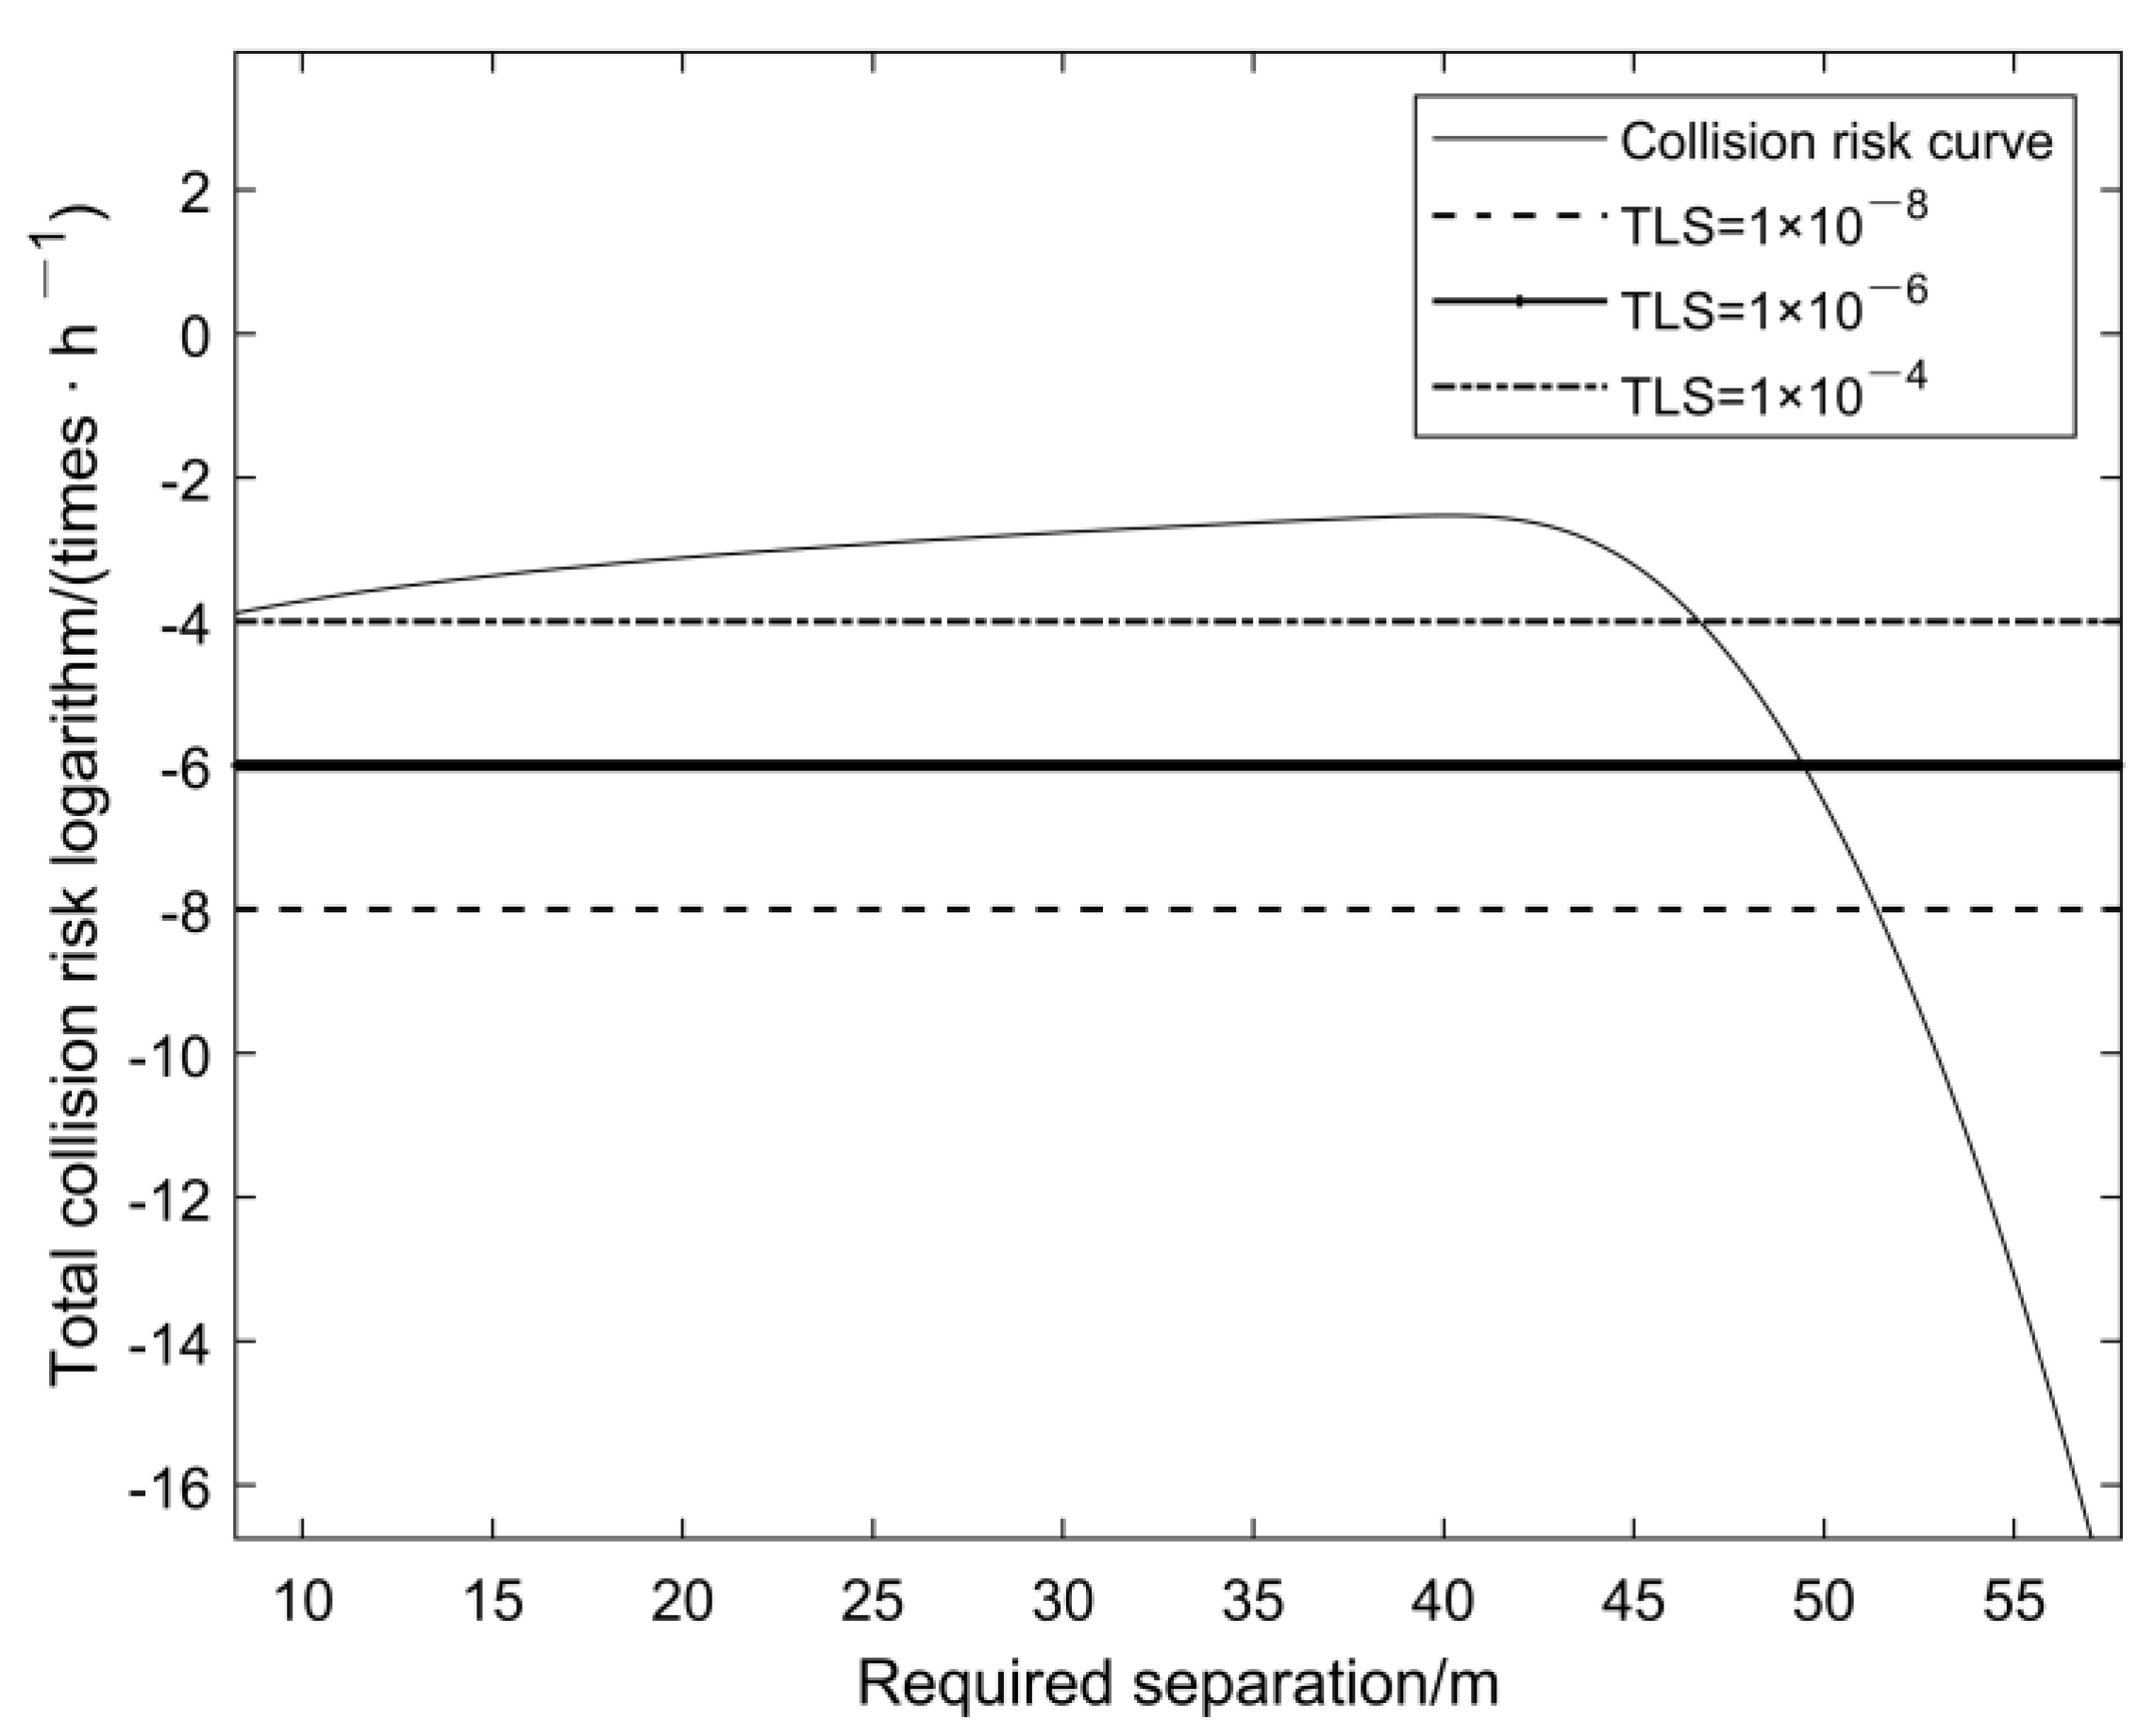
5.2.1. Overall Collision Risk Trend Analysis
When the separation is small, the conflict frequency dominates, leading to a low overall collision risk initially. As the separation increases, the conflict frequency rapidly increases, raising the overall collision risk. When the separation value is large, the collision probability dominates, resulting in a rapid decline in the overall collision risk, as shown in Figure 12.
Figure 12.
The overall collision risk trend.
When the separation value reaches a certain point, the overall collision risk will meet the TLS. By taking the logarithm of the overall collision risk on the vertical axis, a refined display can be achieved. The intersection point of the overall collision risk logarithmic curve and the TLS line is the required separation, 48.5 m, as shown in Figure 13.
Figure 13.
The required separation, complying with the TLS.
5.2.2. Analysis of Required Separation under Different TLS Values
As mentioned earlier, the selection of the TLS value depends on many factors. The required separation changes corresponding to different values are analyzed, as shown in Figure 14.
Figure 14.
The change trend of the required separation.
With the accumulation of UAVs’ operational experience and the development of the industry, the TLS value will be larger. As the TLS increases, the required separation values will gradually decrease.
6. Conclusions
- (1)
- The research problem in this paper is a new problem brought by new things. At present, at home and abroad, including ICAO and JARUS, the operating separation standard for urban logistics UAVs has not been formulated. Based on the JARUS requirements for UAV operation aiming at the autonomous separation maintenance ability of UAVs, a method to calculate the required separation between UAVs is proposed.
- (2)
- As the basis of autonomous separation maintenance ability of UAVs, a two-stage track prediction method is proposed, which breaks through existing track prediction methods. By using K-means, track classification and identification are realized, serving as macro-level track classification. For similar tracks, the Adam–LSTM model is employed to achieve refined track prediction, serving as micro-level track prediction. Compared to the traditional model, the method proposed in this paper can more accurately achieve track prediction.
- (3)
- There is uncertainty in the calculation of the conflict frequency. The calculation of the conflict frequency in the model is directly related to traffic density. As the flow within a unit airspace increases, the value will also increase, thereby ultimately affecting the required separation. The selection of the TLS also has a significant impact on the calculation of separation. The relatively strict TLS provided by JARUS is adopted in this paper. With the accumulation of UAVs’ operational experience and the development of the industry, the TLS will be larger; that is, the required separation value will gradually decrease.
Author Contributions
Conceptualization, Y.Z. and J.Z.; methodology, F.L.; software, Z.L.; validation, X.L., J.Z., F.L. and Z.L.; formal analysis, J.Z.; investigation, Y.Z.; resources, F.L.; data curation, Z.L.; writing—original draft preparation, J.Z.; writing—review and editing, X.L.; visualization, Z.L.; supervision, J.Z.; project administration, J.Z.; funding acquisition, J.Z. and F.L. All authors have read and agreed to the published version of the manuscript.
Funding
This research is funded by the National Key Research and Development Plan Project (2022YFB4300904).
Institutional Review Board Statement
Not applicable.
Informed Consent Statement
Not applicable.
Data Availability Statement
The original data in the study is not easy to provide because it involves the privacy of the provider.
Conflicts of Interest
The authors declare no conflict of interest. The funders have no role in the design of the study; in the collection, analyses, or interpretation of data; in the writing of the manuscript; or in the decision to publish the results.
References
- Brooker, P. Future air traffic management: Quantitative en route safety assessment part 2–new approaches. J. Navig. 2002, 55, 363–379. [Google Scholar] [CrossRef]
- Alligier, R.; Gianazza, D.; Durand, N. Machine learning and mass estimation methods for ground-based aircraft climb prediction. IEEE Trans. Intell. Transp. Syst. 2015, 16, 3138–3149. [Google Scholar] [CrossRef]
- Zeng, W.; Quan, Z.; Zhao, Z.; Xie, C.; Lu, X. A deep learning approach for aircraft track prediction in terminal airspace. IEEE Access 2020, 8, 151250–151266. [Google Scholar] [CrossRef]
- Ma, L.; Tian, S. A hybrid CNN-LSTM model for aircraft 4D track prediction. IEEE Access 2020, 8, 134668–134680. [Google Scholar] [CrossRef]
- Zhang, X.; Mahadevan, S. Bayesian neural networks for flight track prediction and safety assessment. Decis. Support Syst. 2020, 131, 113246. [Google Scholar] [CrossRef]
- Zhang, J.; Jiang, H.; Wu, X.; Tang, X. Four-dimensional track prediction based on BADA and aircraft intention. J. Southwest Jiaotong Univ. 2014, 49, 553–558. [Google Scholar]
- Wang, T.; Huang, B. A four-dimensional flight track prediction model based on improved Kalman filter. J. Comput. Appl. 2014, 34, 1812–1815. [Google Scholar]
- Lv, B.; Wang, C. Application of improved extended Kalman filter in aircraft 4D track prediction algorithm. J. Comput. Appl. 2021, 41 (Suppl. S1), 277–282. [Google Scholar]
- Shi, Q.; Wang, W.; Han, P. Short-term 4D track prediction algorithm based on online updated LSTM network. J. Signal Process. 2021, 37, 66–74. [Google Scholar]
- Hesam, S.; Amelia, C.R. 4D flight track prediction using a hybrid Deep Learning prediction method based on ADS-B technology: A case study of Hartsfield–Jackson Atlanta International Airport (ATL). Transp. Res. Part C 2022, 144, 103878. [Google Scholar]
- Zeng, W.; Chu, X.; Xu, Z.; Liu, Y.; Quan, Z. Aircraft 4D track Prediction in Civil Aviation: A Review. Aerospace 2022, 9, 91. [Google Scholar] [CrossRef]
- Zhao, Y.; Li, K.; Zhu, W. Aircraft 4D track Prediction during Climbing and Descending Stages. Sci. Technol. Eng. 2023, 23, 7582–7588. [Google Scholar]
- Graham, W.; Orr, R.H. Terminal air traffic flow and collision exposure. Proc. IEEE 1970, 58, 328–336. [Google Scholar] [CrossRef]
- Endoh, S. Aircraft Collision Models. Master’s Thesis, Massachusetts Institute of Technology, Cambridge, MA, USA, 1982. [Google Scholar]
- Weibel, R.E.; Hansman, R.J. Safety Considerations for Operation of Unmanned Aerial Vehicles in the National Airspace System: ICAT-2005-1; MIT ICAT: Cambridge, MA, USA, 2006. [Google Scholar]
- Anders LC Henrik, S. Probability of Low-Altitude Midair Collision Between General Aviation and Unmanned Aircraft. Risk Anal. 2019, 39, 2499–2513. [Google Scholar]
- Christopher, W.L.; Blake, W. A Risk Based Paradigm and Model for Unmanned Aerial Systems in the National Airspace. 29 March 2011. Available online: https://www.aa.washington.edu/sites/aa/files/research/afsl/publications/lum_risk_for_uavs_2010_2.pdf (accessed on 18 November 2023).
- JAR-DEL-WG6-D.04; Guidelines on Specific Operations Risk Assessment (SORA). JARUS: Cologne, Germany, 2019.
- Nikodem, F.; Dittrich, J.S.; Bierig, A. The New Specific Operations Risk Assessment Approach for UAS Regulation Compared to Common Civil Aviation Risk Assessment. 25 January 2019. Available online: https://www.dglr.de/publikationen/2019/480130.pdf (accessed on 18 November 2023).
- Pérez-Castán, J.A.; Comenadador, F.G.; Rodríguez-Sanz, A.; Cabrera, I.A.; Torrecilla, J. RPAS conflict-risk assessment in non-segregated airspace. Safety Sci. 2019, 111, 7–16. [Google Scholar] [CrossRef]
- Valtteri, K.; Aaron, M. Collision Risk Modeling and Analysis for Lateral Separation to Support Unmanned Traffic Management. Risk Anal. 2022, 22, 854–881. [Google Scholar]
- Li, Q.; Gan, X.; Sun, J.; Wang, M. Risk assessment of lateral collision between military UAV and civil aviation flight. J. Beijing Univ. Aeronaut. Astronaut. 2021, 47, 724–730. [Google Scholar]
- Bubbles D4.1; Algorithms for Analysing the Collision Risk. SESAR: Brussels, Belgium, 2021.
- Yao, D.; Ma, J.; Zhao, G. On the safety assessment for the collision risk between the civilian and military airplanes. J. Saf. Environ. 2017, 17, 1637–1641. [Google Scholar]
- Wang, L.; Yang, J. Research on assessment method of safety separation for logistics UAVs based on position error probability model. J. Saf. Sci. Technol. 2022, 18, 184–192. [Google Scholar]
- DOC 9689; Manual on Airspace Planning Methodology for the Determination of Separation Minima. ICAO: Montreal, QC, Canada, 1998.
- WG-A/WP8; ICAO RGCSP (Review of the General Concept of Separation Panel). RGCSP Working Group Meeting: Summary of Discussions and Conclusions. ICAO: Montreal, QC, Canada, 1995.
- Falanga, D.; Kleber, K.; Scaramuzza, D. Dynamic obstacle avoidance for quadrotors with event cameras. Sci. Robot. 2020, 5, 9712–9720. [Google Scholar] [CrossRef] [PubMed]
Disclaimer/Publisher’s Note: The statements, opinions and data contained in all publications are solely those of the individual author(s) and contributor(s) and not of MDPI and/or the editor(s). MDPI and/or the editor(s) disclaim responsibility for any injury to people or property resulting from any ideas, methods, instructions or products referred to in the content. |
© 2024 by the authors. Licensee MDPI, Basel, Switzerland. This article is an open access article distributed under the terms and conditions of the Creative Commons Attribution (CC BY) license (https://creativecommons.org/licenses/by/4.0/).