Abstract
Recently, methods to detect DoS and spoofing attacks on In-Vehicle Networks via the CAN protocol have been studied using deep learning models, such as CNN, RNN, and LSTM. These studies have produced significant results in the field of In-Vehicle Network attack detection using deep learning models. However, these studies have typically addressed studies on single-model intrusion detection verification in drone networks. This study developed an ensemble model that can detect multiple types of intrusion simultaneously. In preprocessing, the patterns within the payload using the measure of Feature Importance are distinguished from the attack and normal data. As a result, this improved the accuracy of the ensemble model. Through the experiment, both the accuracy score and the F1-score were verified for practical utility through 97% detection performance measurement.
1. Introduction
As unmanned aerial vehicle (UAV) [1] and Internet of Things (IoT) technologies are developing, they are used for weather observation [2], agriculture [3], and military purposes [4]. However, not only physical signal attacks, such as GPS Signal Spoofing and Jamming Signals [5] but also malware and malicious communication attacks, such as spoofed signals, are being launched [6]. These attacks are classified as a major threat because they can also be used against unmanned aerial vehicles (UAVs). Accordingly, cyber-attack attempts targeting unmanned aerial vehicles (UAVs) are increasing [7], and research to detect them is actively underway [8,9]. These include spoofing, Denial of Service (DoS), and Replay attacks on CAN protocols against UAVs [10].
Research using machine learning (ML) and deep learning (DL) models to detect network intrusions occurring in the CAN protocol [11] is also underway, but the performance of these models is not stable because the feature learning process of ML/DL models cannot be verified. Unfortunately, researchers cannot utilize the patterns analyzed by the ML/DL model [12,13,14,15,16]. In addition, stacking techniques that use an ensemble of different types of models are being used to improve detection, but this results in poor performance. Recently, it has become possible to analyze the Feature Importance and SHAP value of ML/DL models using Lunderberg’s explainable artificial intelligence (XAI) research [15,16] and the SHAP technique. Solved cases [17,18] are also emerging.
This study validates an ensemble model that can simultaneously detect more than one intrusion in a drone network. Related studies have typically addressed studies on single-model intrusion detection verification in drone networks [19,20,21]. Our hypothesis proposes a way to effectively identify multiple needle types through ensemble models. This ensemble model uses a stacking method that combines a single model trained for the binary classification of each attack. Therefore, this study will extend the detection range by utilizing an assembled ensemble model based on performance evaluation and feature importance analysis on ML/DL models trained on individual attacks. Additionally, this study will validate an effective ensemble method for detecting multiple intrusions by analyzing ML/DL models using SHAP value analysis.
2. Related Works
2.1. Controller Area Network (CAN) Protocol
The CAN protocol [9] is a message-oriented protocol for communication between the ECU, sensors, and control equipment in a car. According to Table 1, the CAN protocol is composed of the Application, Object, Transfer, and Physical layers. Unlike the existing UART’s point-to-point method, which uses a 1:1 dedicated line for data communication, the multi-master method reduces the car’s weight by using less wiring, thereby reducing the price.

Table 1.
Classification of tasks by layer.
To share instructions directly with the drone, the UAVCAN payload of CAN 2.0 B is used, and the structure is shown in Figure 1. The task to be performed by the drone and the status information are stored in the transfer payload, which consists of a total of 8 bytes. Therefore, fuzzy and relay attacks on drone center on the CAN payload packets.
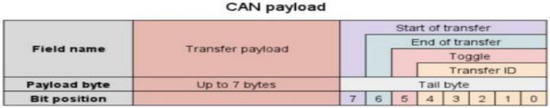
Figure 1.
UAVCAN payload framework [10].
2.2. Network Intrusion Detection Model for CAN Protocol
There are five main types of attack that mainly occur via the UAVCAN protocol [11]. DoS is an attack that paralyzes the system resources and delays work by injecting a large amount of data into a specific system or network. Table 2 shows studies on detecting network intrusion in the CAN protocol.
Table 2.
CAN attack machine learning-based detection research.
This paper targets DoS using the flooding method, which injects messages into the CAN bus at 15 ms intervals.
In a fuzzy attack, the assailant injects a message using a dictionary or brute force method to infer a valid CAN ID [13].
A replay attack intercepts a valid message and maliciously retransmits it, disguising it as a valid message and repeating a specific action [39]. Spoofing is an attack that disguises the CAN ID of a specific message and tricks other nodes in the CAN bus into performing the task intended by the attacker. Impersonation disguises a message as an appropriate node in CAN communication and performs malicious attacks or data modification on the other nodes. Research on the detection models of network attacks that use CAN packets is shown in Figure 2.
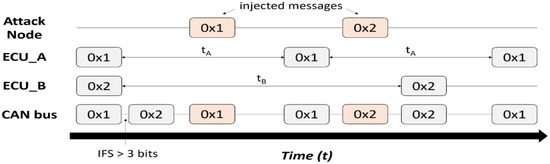
Figure 2.
Diagram of attack through message injection in CAN protocol [38].
2.3. SHAP
SHAP (Shapley Additive Explanations) [40] calculates the value for each feature in a machine learning model, helpings humans to understand their influence. The SHAP value is calculated using the conditional expected value function of the machine learning model. The Shapley value is a solution that distributes the total gain obtained through cooperation among game participants based on their marginal contribution.
The Shapley regression value assigns importance (an importance value) to each variable based on how much it affects the model’s performance during learning.
This is the equation used to determine the Shapley interaction value:
where f represents the model, M denotes the number of x′, and x′ describes the simplified input transformed from the original using a mapping function x = hx(x′).
Hx maps 1 or 0 onto the original input space, where 1 indicates that the input is included in the model and 0 denotes exclusion from the model. |z′| represents the number of non-zero entries in z′, and z′ ⊆ x′ denotes all the z′ vectors, where the non-zero entries are a subset of the non-zero entries in x′. Feature importance using the Shapley value is calculated using Equation (2).
The Shapley value assigns importance to each feature that represents an effect on model prediction. The effect of the i-th feature is computed as the difference between a model trained with the i-th feature and another model trained with a different feature. Since the effect of withholding a feature depends on the other features in the model, the preceding differences are computed for all the possible subsets z′\i [15]. As a result, the Shapley value is the weighted average of all the possible differences, representing a unique additive feature attribution method that satisfies all three axioms (local accuracy, missingness, and consistency). The SHAP value in machine learning is designed to align closely with the Shapley value, using conditional expectations to define the simplified inputs. Feature Importance in a linear model with multicollinearity [9]. Although multicollinearity is a property that violates the independence assumption in linear models, the Shapley regression value can be used even in linear models with multicollinearity.
2.4. Explainable Artificial Intelligence (XAI)
According to Capuano, N., Fenza, G., Loia, V., and Stanzione, C. (2022) [39], artificial intelligence models, such as machine learning and deep learning, have important impacts on cyber security due to the opacity of the internal mechanisms. This is of limited use in areas where decisions are needed. However, if explainability is provided by the AI model using techniques such as SHAP [40] or LIME [41], a novel auto-encoding-based scheme for the LSTM model [22], and sufficient framework-related research is conducted, it can satisfy the transparency required in the cyber security area. A post-analysis of AI models and a reduction in workload using AI models are to be expected. Additionally, in another study [42], as a result of reviewing other related techniques, XAI was found to have the potential to develop into TAI using a framework, although there are limitations, such as the “post-explainability, replicability of methodology” and a lack of “integrated understanding”.
2.5. Deep Neural Network Model
The DNN (Deep Neural Network) model conducts representative deep learning and consists of several hidden layers between the input and output. These DNN models can be applied to classification and regression problems, and one representative is the YouTube video recommendation algorithm [42].
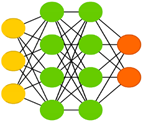
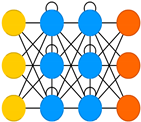
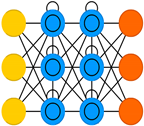
On the other side, the RNN (Recurrent Neural Network) model is similar to the DNN model, but the hidden layer is composed of Recurrent Cells, so it can store old information and make predictions about the sequence. When learning long-term relationships, the weight of the model becomes extremely small or large, so an LSTM model that introduces Memory Cells instead of Recurrent Cells is mainly used for time series analysis. The differences between DNN, RNN, and LSTM models are listed in Table 3.
Table 3.
Diagram of deep learning models [43].
2.6. Attack Scenario Analysis
Related UAV studies have concluded that users have a specific control pattern according to their flight altitude, which occurs in repeated transmissions of specific control messages [43,44]. These patterns may contain unbalanced datasets in the networks of each UAV. However, this study hypothesized a real-world scenario where UAVs receive unbalanced network messages.
2.6.1. Flooding Attack Scenario Analysis
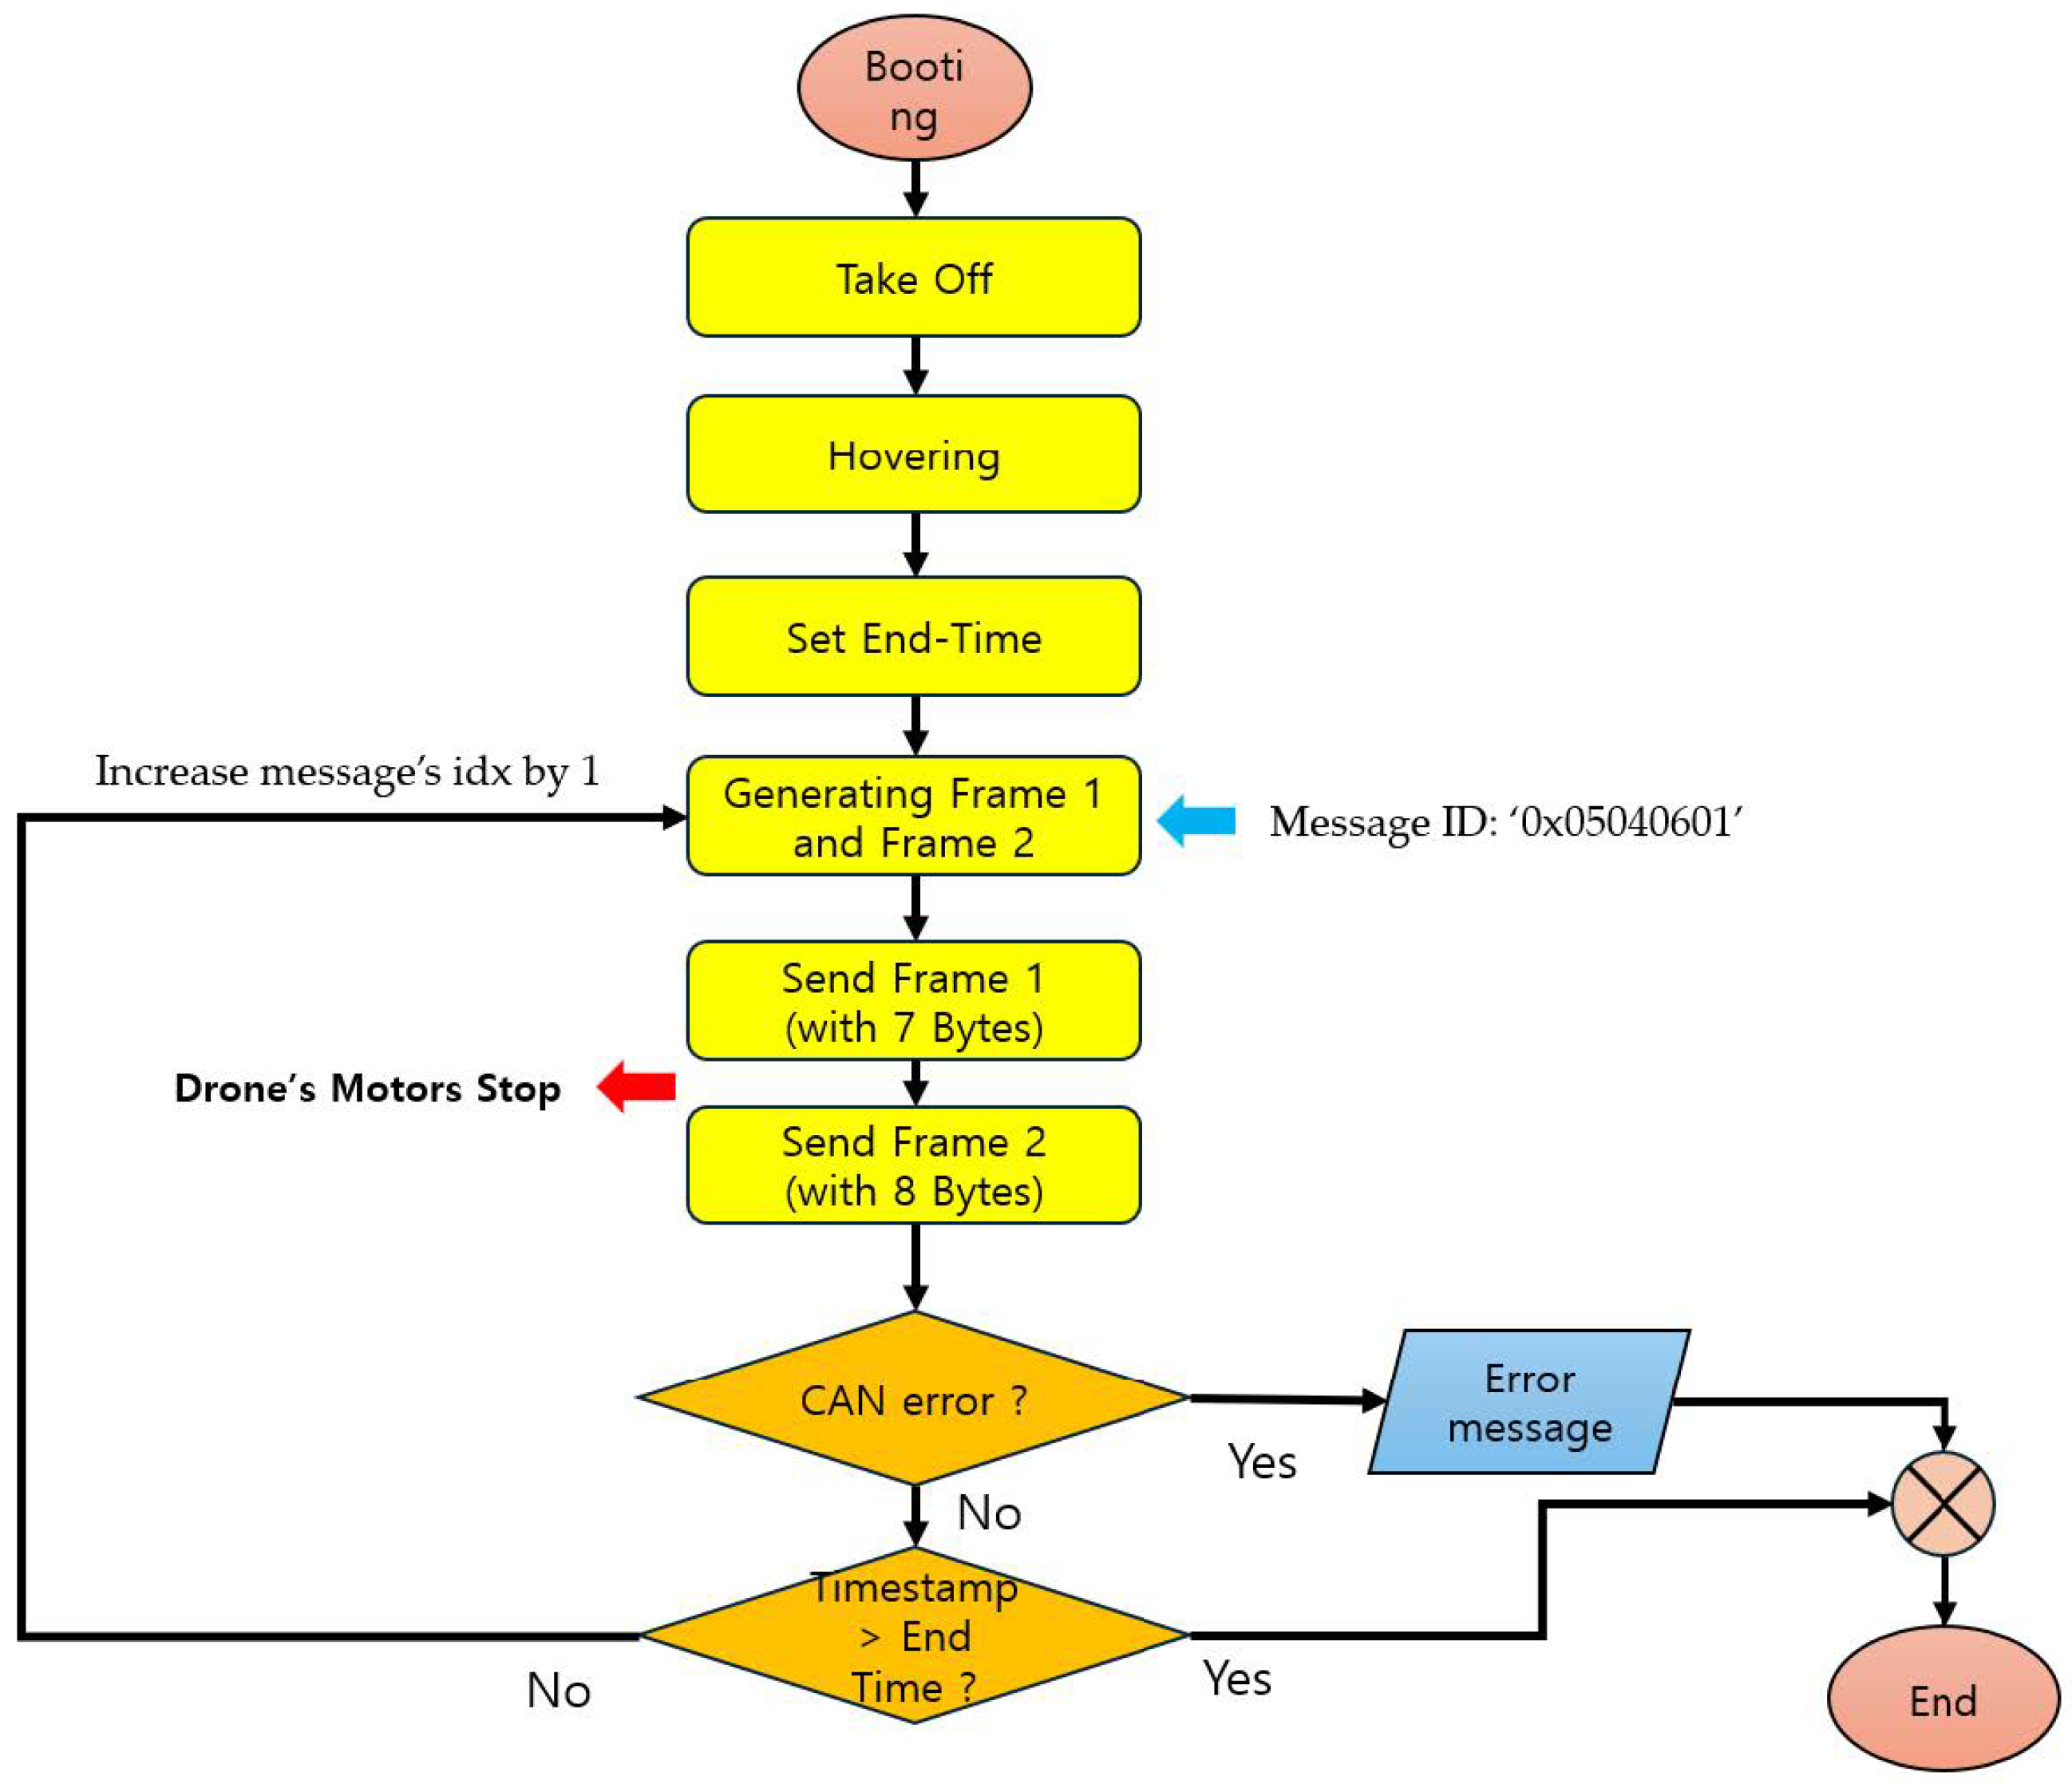
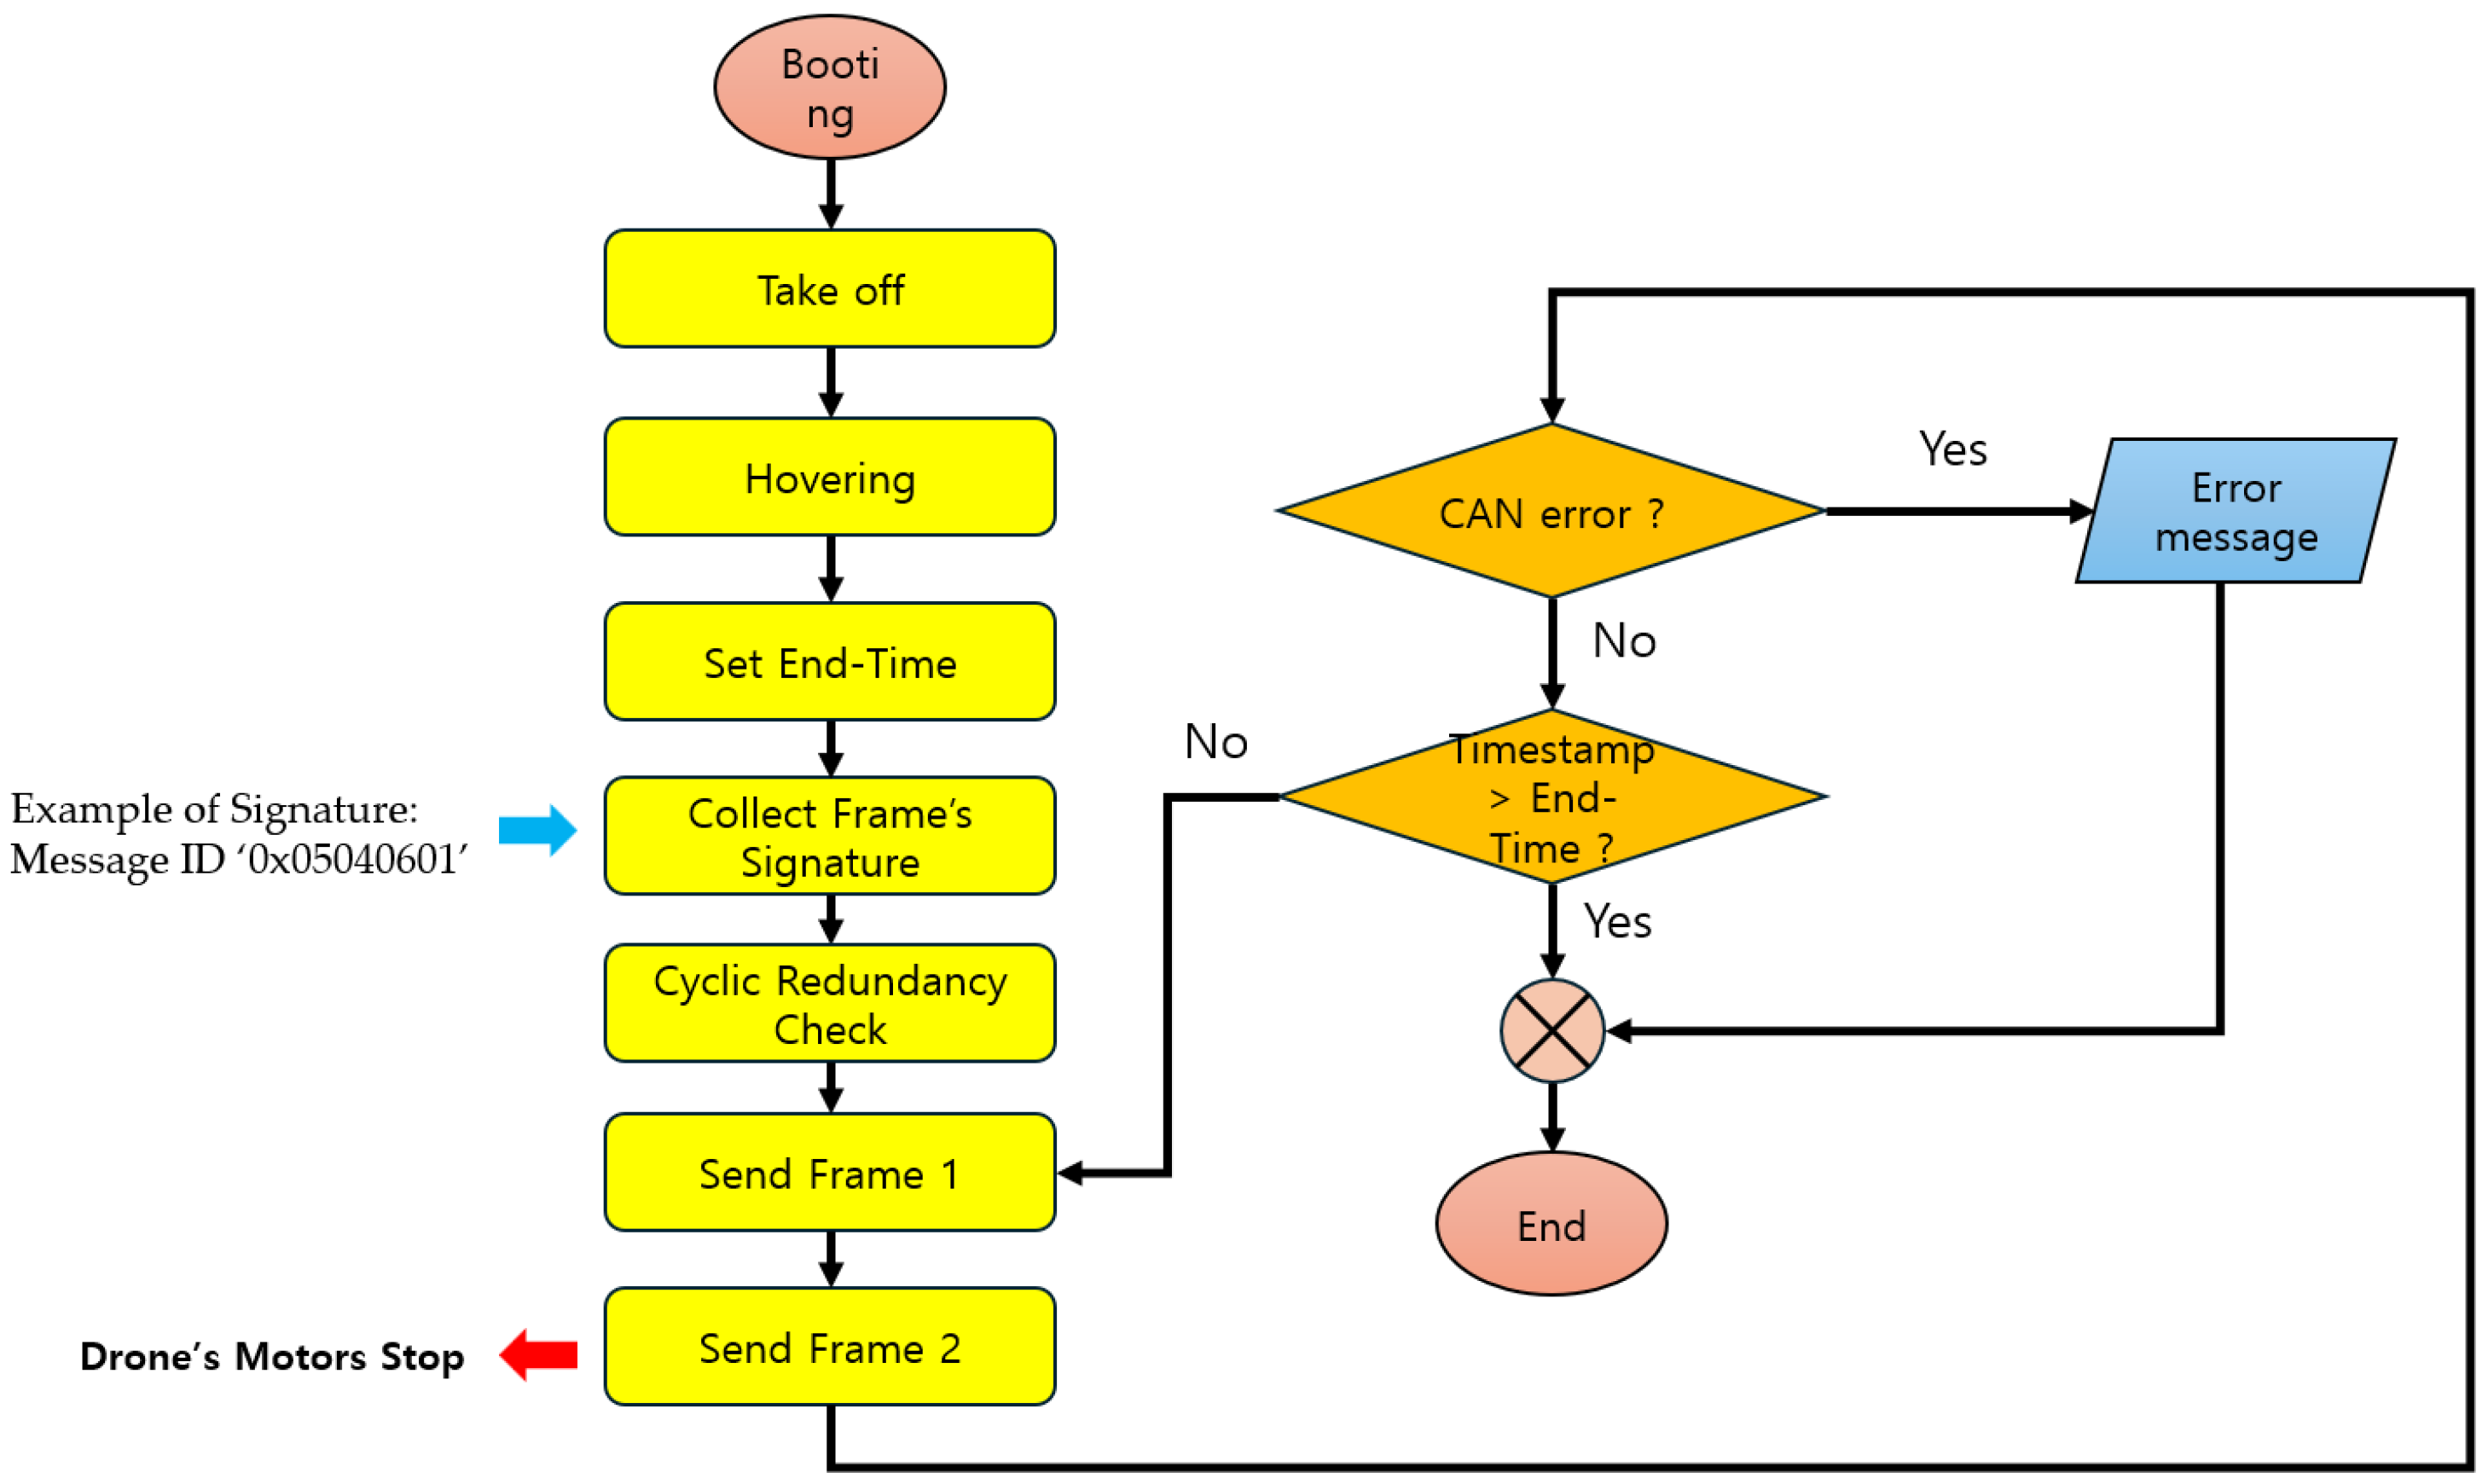
Flooding is a type of denial-of-service (DoS) attack that consists of two frames and injects them into the CAN bus. [45,46,47]. It is performed repeatedly in short cycles, delaying the transmission of messages via the CAN bus and consuming resources of the target ECU, thereby interfering with the service. Flooding mechanism is shown in Figure 3.

Figure 3.
Flowchart of Flooding Attack.
The flooding attack mechanism is executed at 0.005-s intervals, generates payloads consisting of 7 bytes and 8 bytes of data, respectively, modifies the message ID to ‘0 × 05040601’, and injects it into the CAN bus [45]. Therefore, the Motor ECU processes a payload consisting of 8 Bytes, and there may be a delay in processing the Main ECU’s message.
The flooding attack process was analyzed over time, as shown in Table 4. It occurred between 50 s and 90 s, but the operation was normal. However, due to the flooding attack, the motor stopped from the 90 s to 120 s and 130 s to 160 s ranges.
Table 4.
Timeline of flooding attack scenario (types 01 and 02).
The changes occurring on the CAN bus due to flooding attacks are presented in Table 5.
Table 5.
Message injection progress over time on CAN bus.
The Main and Motor ECUs exchange messages on the CAN bus, and at this time, the attacker injects messages into the CAN bus. Therefore, the Motor ECU does not receive messages from the Main ECU, and processing delays occur, causing the UAV’s motor to stop operating. Table 6 provides details on the composition of flooding payloads.
Table 6.
Structure of flooding payload.
There are two types of payloads injected by the attacker, with a data length of 8 bytes, and the Transfer ID is stored in the ninth data byte. The Transfer ID is an integer value used by the message and destination node to distinguish it from the other messages, and the payload adds one to the Transfer ID value of the previously transmitted message. Currently, the Transfer ID of the first flooding payload starts with 80.
The main features of the flooding payload are as follows: First, the data length is seven or eight. Second, the ninth data byte storing the Transfer ID increases by one. Third, the sixth and seventh data bytes are always 00.
2.6.2. Fuzzy Attack Scenario Analysis
Fuzzy attacks in scenario types 03 and 04 involve changing the message composition during injection until the attacker obtains the desired information or action. For the injected message, the message ID is set to ‘0 × 05040601’, and the data byte configuration is changed by brute forcing to a value between 0 and 255. Then, the message is injected at 0.001 s intervals. This fuzzy attack mechanism is written in Python code in Figure 4.
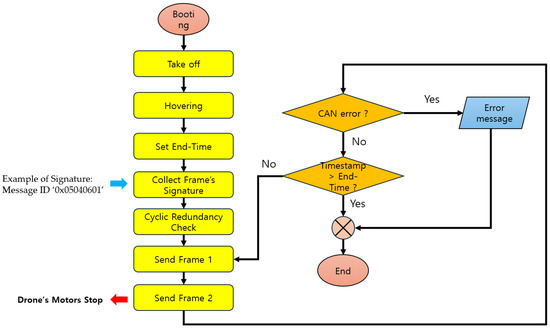
Figure 4.
Flowchart of Fuzzy attack.
Table 7 shows the timestamps of the UAV status during the fuzzy attack experiment. The UAV’s motor stopped when the fuzzy attack occurred.
Table 7.
Timeline of fuzzy attack scenario (types 03 and 04).
2.6.3. Replay Attack Scenario Analysis
During a replay attack, the assailant collects normal messages in advance and repeatedly retransmits them to induce a specific action. In scenario types 05 and 06, this replay attack is performed when the message should be transmitted.
Replay attack types 05 and 06 have different conditions from the other scenarios. Table 8 shows the difference in attack conditions between the two scenarios.
Table 8.
Dataset comparison by scenario.
The Replay attack mechanism used in scenario types 05 and 06 is written in Python code in Figure 5.
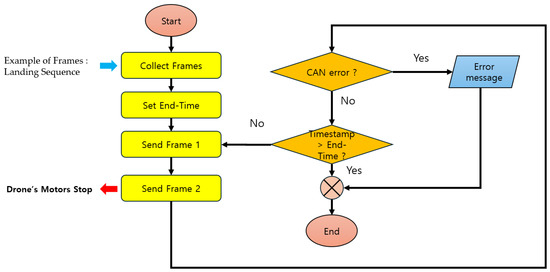
Figure 5.
Flowchart of Replay attack.
3. Method and Materials
In this section, the dataset for each scenario type is analyzed. By comparing the SHAP analysis results of the attack scenario and the ML model, we confirmed whether the ML model effectively analyzes patterns within the dataset.
3.1. Dataset Preprocessing
The analyzed datasets were preprocessed as follows. The train/test datasets were split at a 7:3 ratio under the condition of stratifying the label. Timestamps were included for the time series LSTM [48] and simple RNN models, and the datasets with removed timestamps rows were used for the ML models. Additionally, in all the scenario-type datasets, there was an error of less than 2 s between the experiment on data collection and the collected dataset.
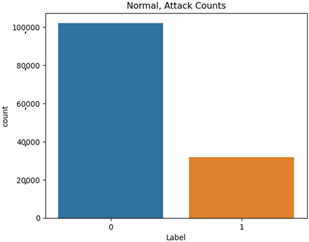
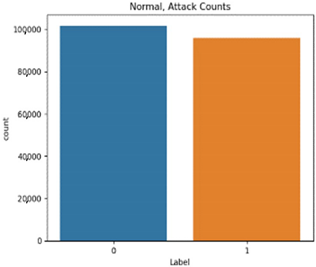
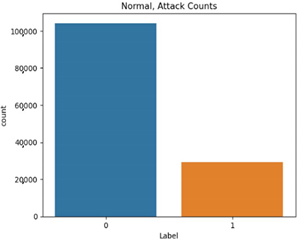
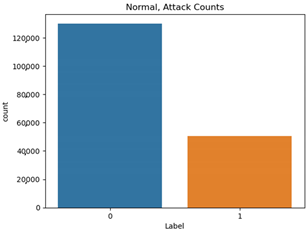
The proportion of each scenario type in the attack datasets is shown in Table 9.
Table 9.
Single attack dataset proportion.
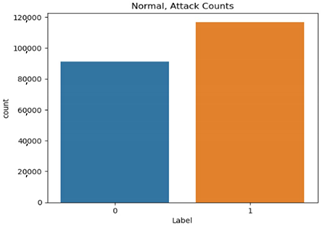
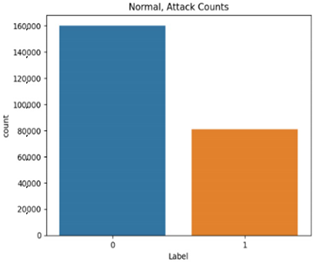
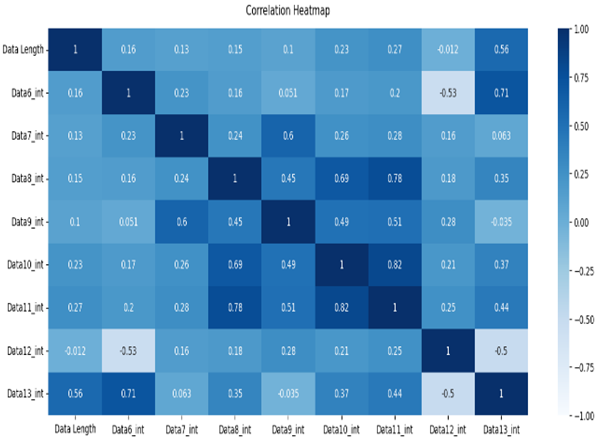
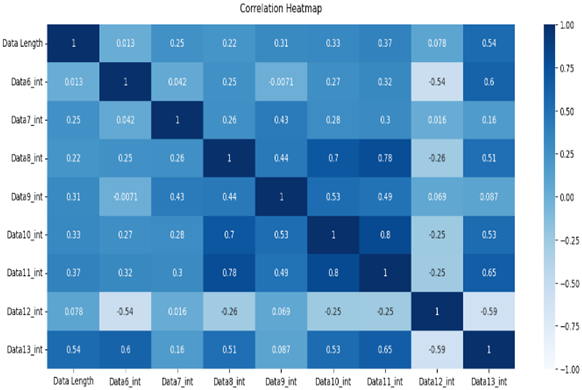
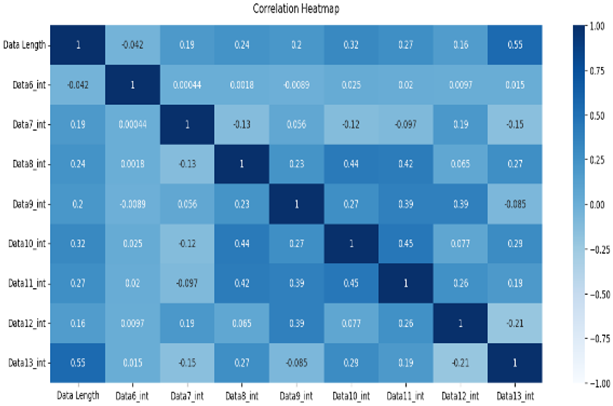
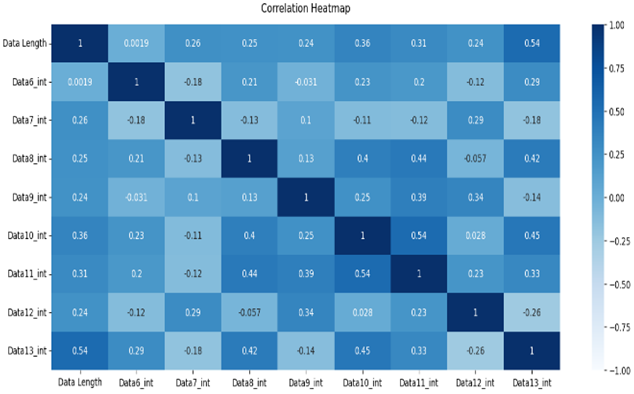
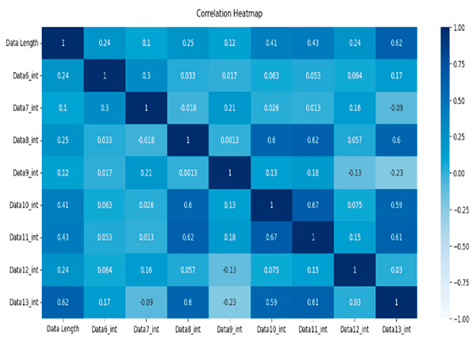
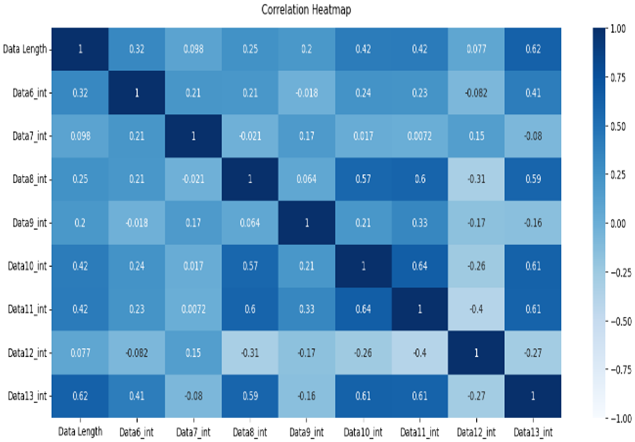
The normal data are labeled 0, and the attack data are labeled 1. Types 01 and 03 have relatively balanced ratios, and types 02, 04, 05, and 06 have relatively unbalanced ratios. As a result of Pearson correlation analysis shown in Table 10, the data length of all the scenario datasets shows a high correlation coefficient with the other data bits. It is assumed that the composition of the payload varies depending on the data length.
Table 10.
Pearson correlation heatmap of the dataset by scenario type.
3.2. Experiment Model
The base model was constructed according to the performance evaluation results in Section 4. Experiment models constructed from each base model are represented as shown in Figure 6. Flooding was detected using the LSTM model, a fuzzy attack was detected using the LSTM model, and a replay attack was detected using the decision tree (DT) model, all under the same conditions as the models learned during performance evaluation.
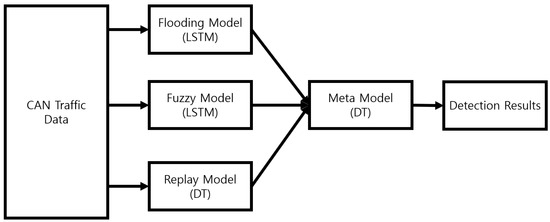
Figure 6.
Structure of experiment model.
3.3. Performance Evaluation Metrics
In this experiment, the relationship between the model’s detection results and the labels of the actual data was defined according to the confusion matrix in Table 11. A TP (True Positive) is when an actual attack is normally detected, an FN (False Negative) when an actual attack is not detected, an FP (False Positive) when a normal attack is detected, and a TN (True Negative) when a normal attack is classified as normal.
Table 11.
Confusion matrix.
To verify the model, the TP, FP, TN, and FN data (classified according to the definition in Table 11) were substituted into the evaluation matrix definitions in Table 12.
Table 12.
Evaluation matrix definitions.
Accuracy is an indicator of how well a model classifies actual data and is a commonly used indicator for model evaluation. However, the bias problem caused by model over-fitting can be overlooked, so it is used together with the F1-Score indicator, which consists of precision and recall.
3.4. Experiment Environment
This experiment was conducted in a computing environment consisting of 32 GB of memory, CPU AMD Ryzen 7 5700X, and GPU NVIDIA GeForce RTX 3060. The hyperparameter settings for each model are as presented in Table 13.
Table 13.
Hyperparameter for each model.
The criteria used to evaluate the performance of each model are as follows. The elements of each matrix, a TP, an FP, a TN, and an FN, follow the definition of a confusion matrix.
4. Experiment Results
4.1. SHAP Value Analyses
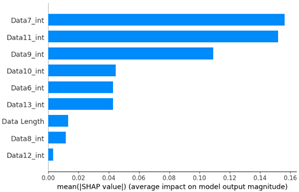
In this experiment, to utilize the effective SHAP analysis technique, for each scenario, the dataset consists of 13 bytes that make up the payload section of messages exchanged on the CAN bus. Each byte stores information such as message ID, CAN ID, data, and CRC details. The patterns within the payload are analyzed through SHAP to distinguish between attack data and normal data. Finally, SHAP value analyses with Tree Explainer (XG Boost) were performed on the datasets for each scenario to measure the SHAP interaction value between feature importance and the important features.
4.1.1. Flooding Scenario Dataset Analysis
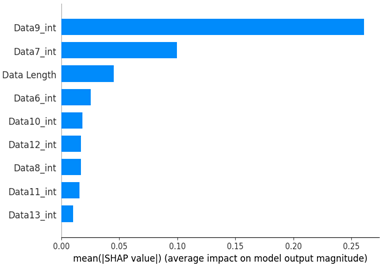
As a result of the SHAP analysis of flooding scenario datasets (scenario types 01 and 02), the ninth and seventh data bytes and the data length were determined to be the most important features. These results are consistent with the flooding payload analysis analyzed in Table 14. This model analyzed the key features of the flooding payload, such as the data length and Transfer ID.
Table 14.
SHAP analysis for scenario type 01.
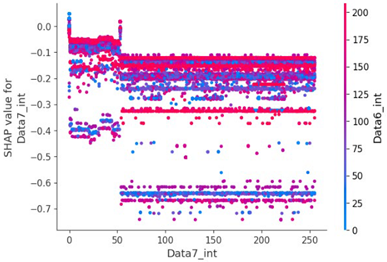
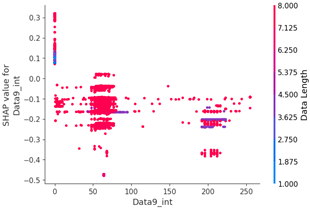
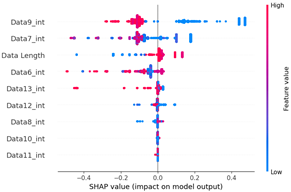
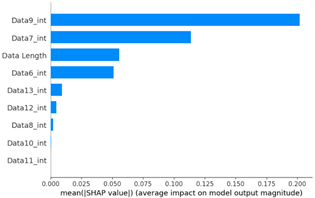
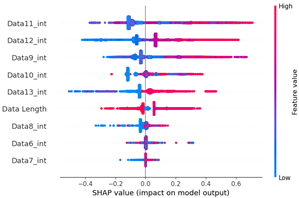
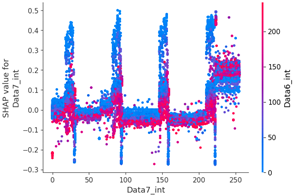
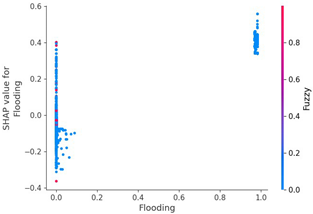
Table 15 shows the SHAP value distribution among the feature values, Feature Importance, and important features determined via the analysis of the scenario type 01 dataset. In the feature value graph, you can see that data length is concentrated around two values near the SHAP value of 0.0. This shows that the data lengths of the flooding payload are all seven and eight, and feature values are concentrated in that section. Additionally, the blue dots with relatively low feature values are concentrated in the range from −0.6 to −0.2 based on the SHAP value, and most of the normal driving data are distributed with a length other than seven or eight.
Table 15.
SHAP analysis for scenario type 02.
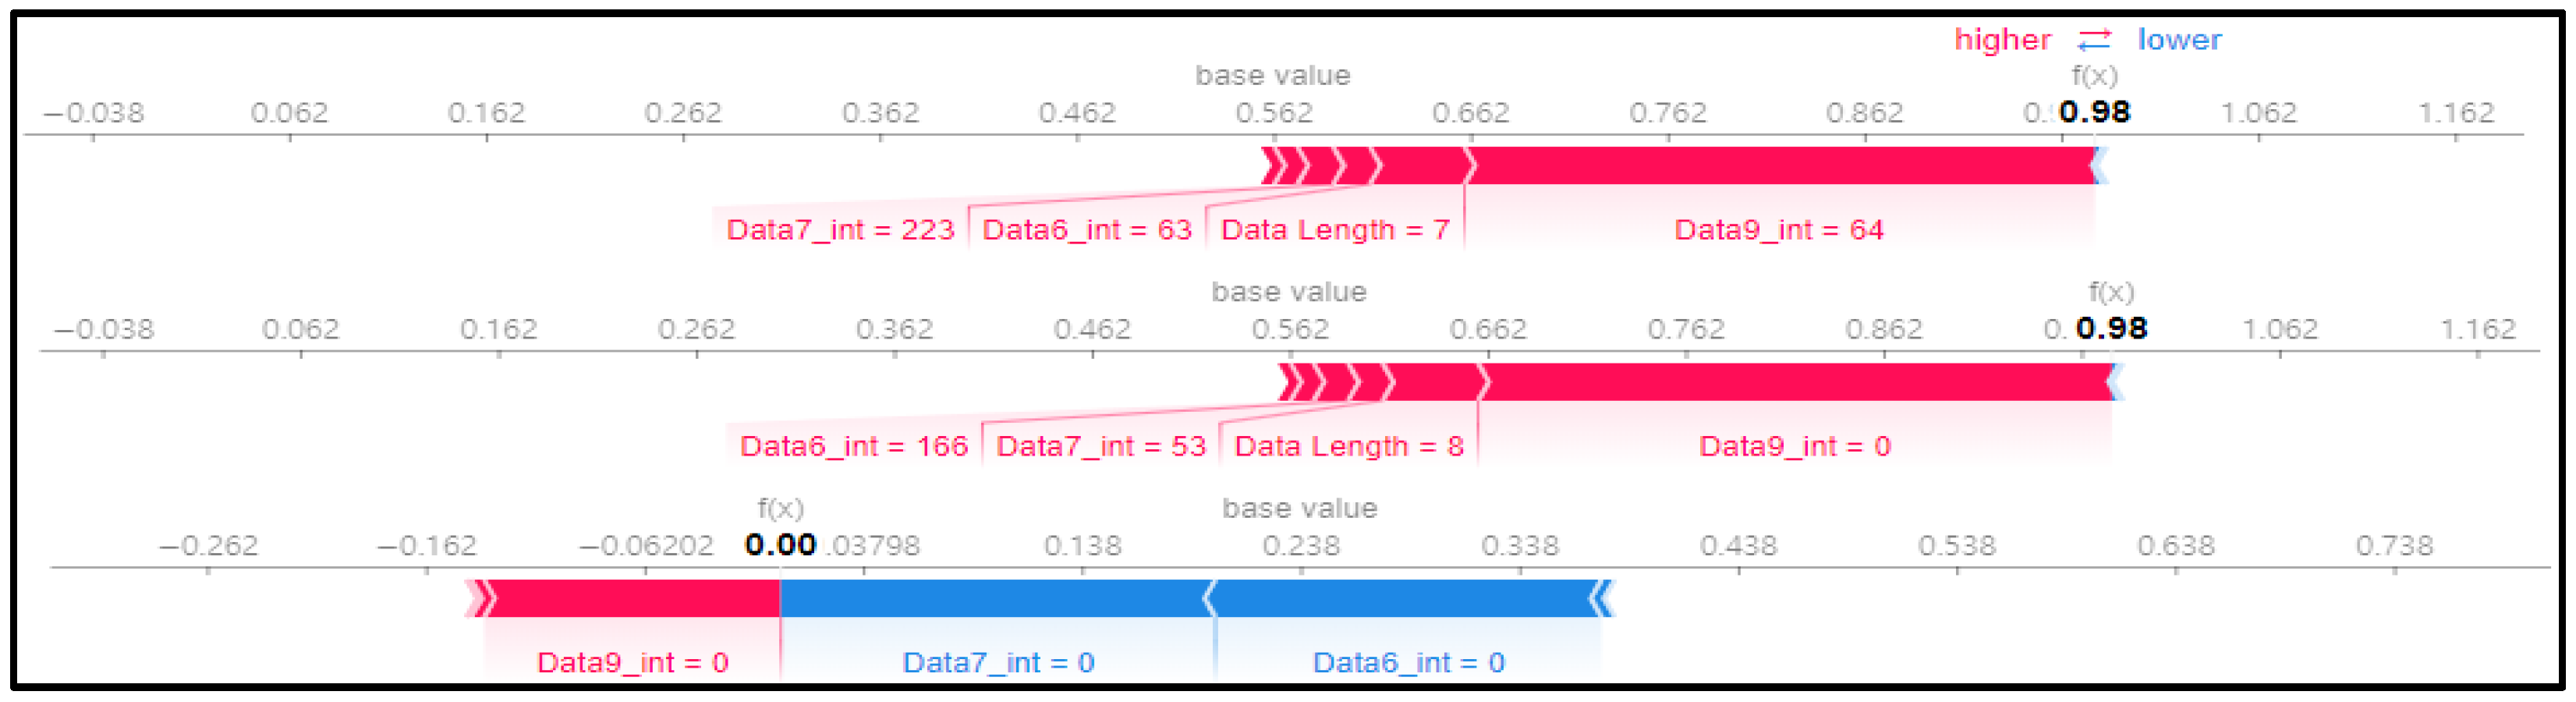
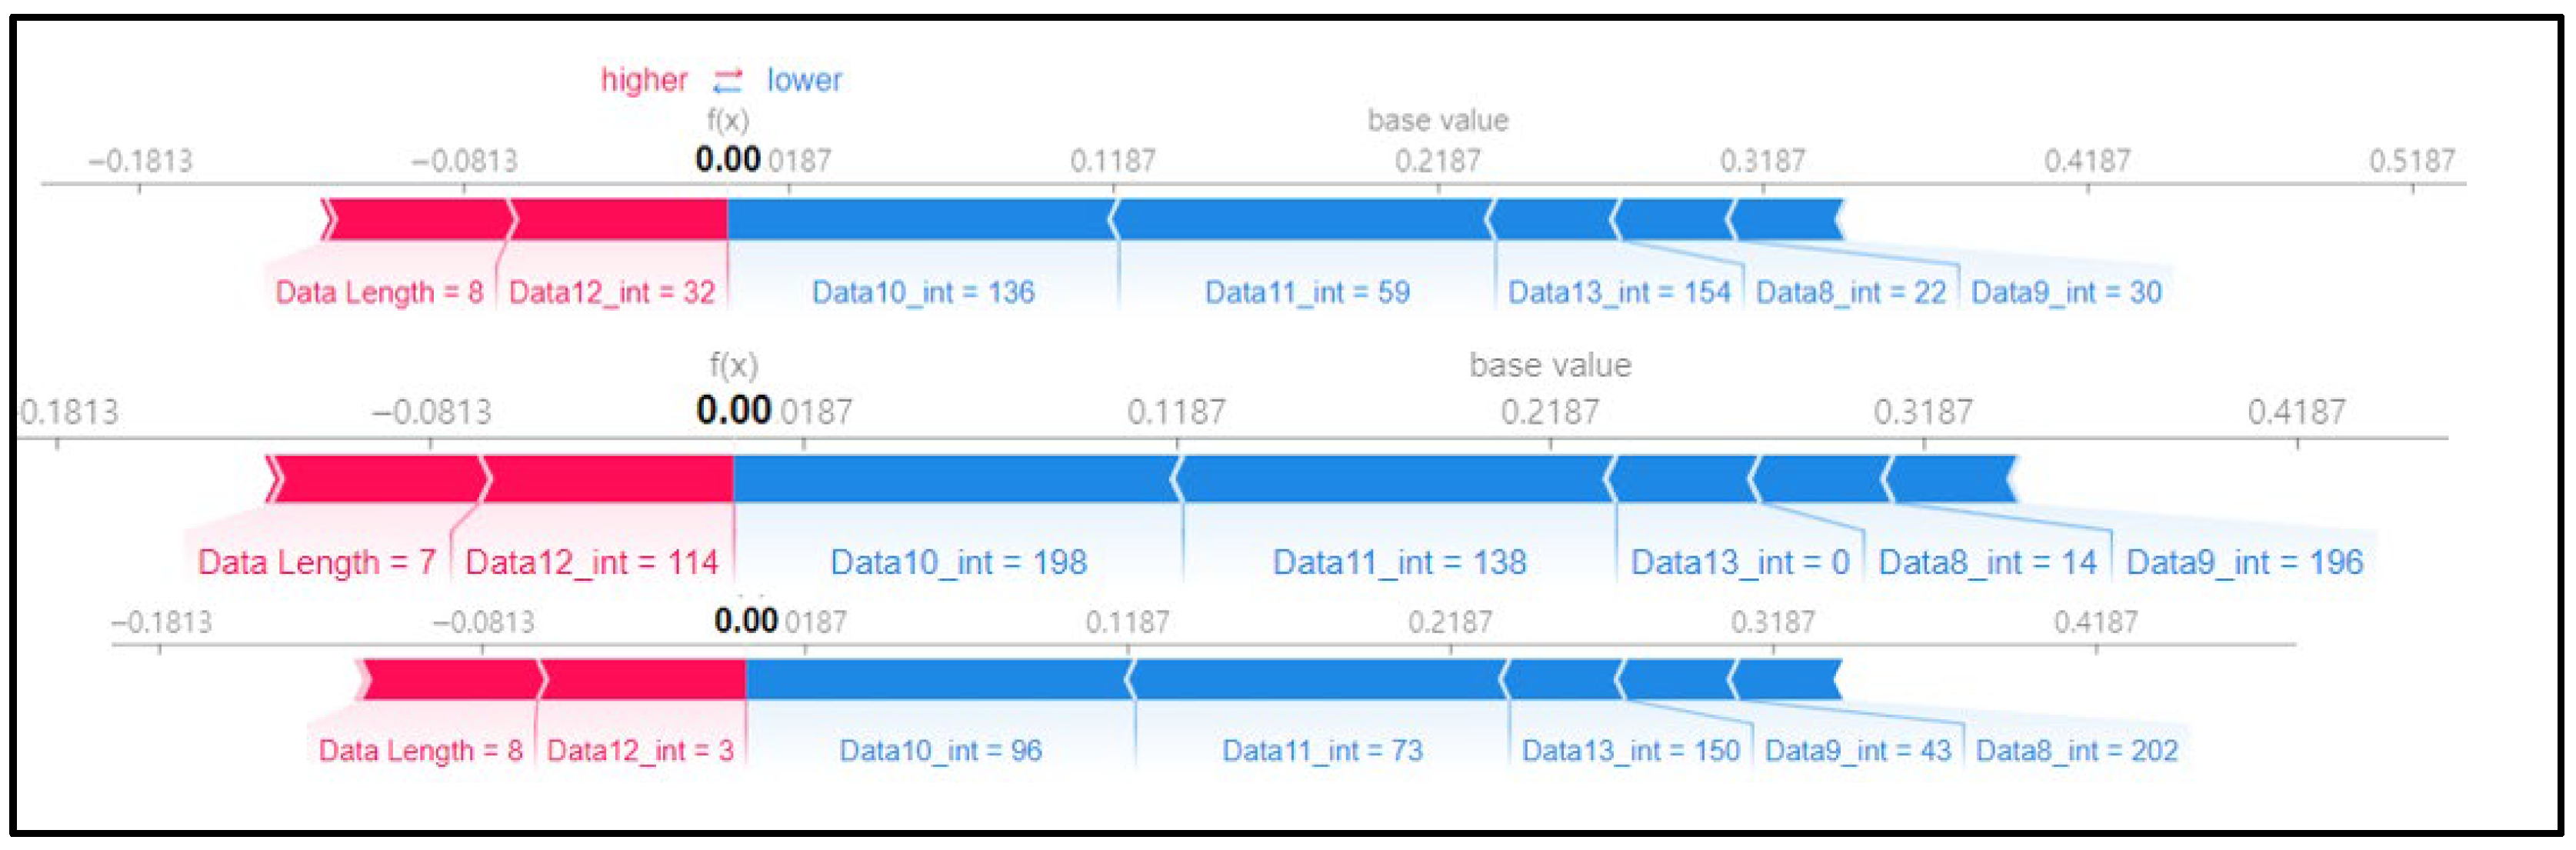
Figure 7 shows a SHAP force plot for three random rows of data. The red section represents where the SHAP value is high, and the blue section denotes where the SHAP value is low. The ninth data byte and data length of the first and second graphs in Figure 7 are clearly different from those in the third graph. This means that the flooding payload has a feature for flooding attacks in the ninth data byte and is judged according to the data length. We can confirm that the evidence has been classified.
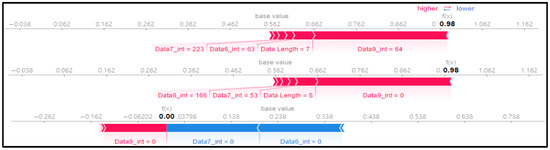
Figure 7.
SHAP force plot for 3 random rows of data.
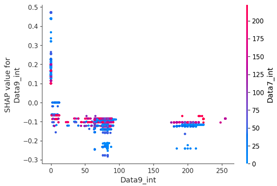
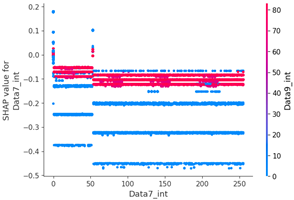
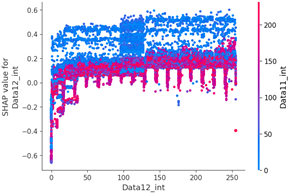
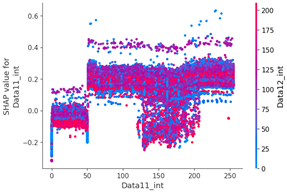
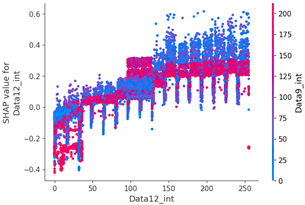
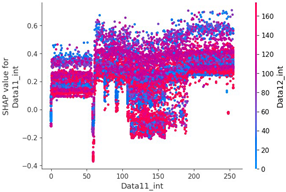
SHAP value analysis was performed on the data length, which had a high correlation coefficient with other data, and the ninth data byte, which had the highest feature importance value.
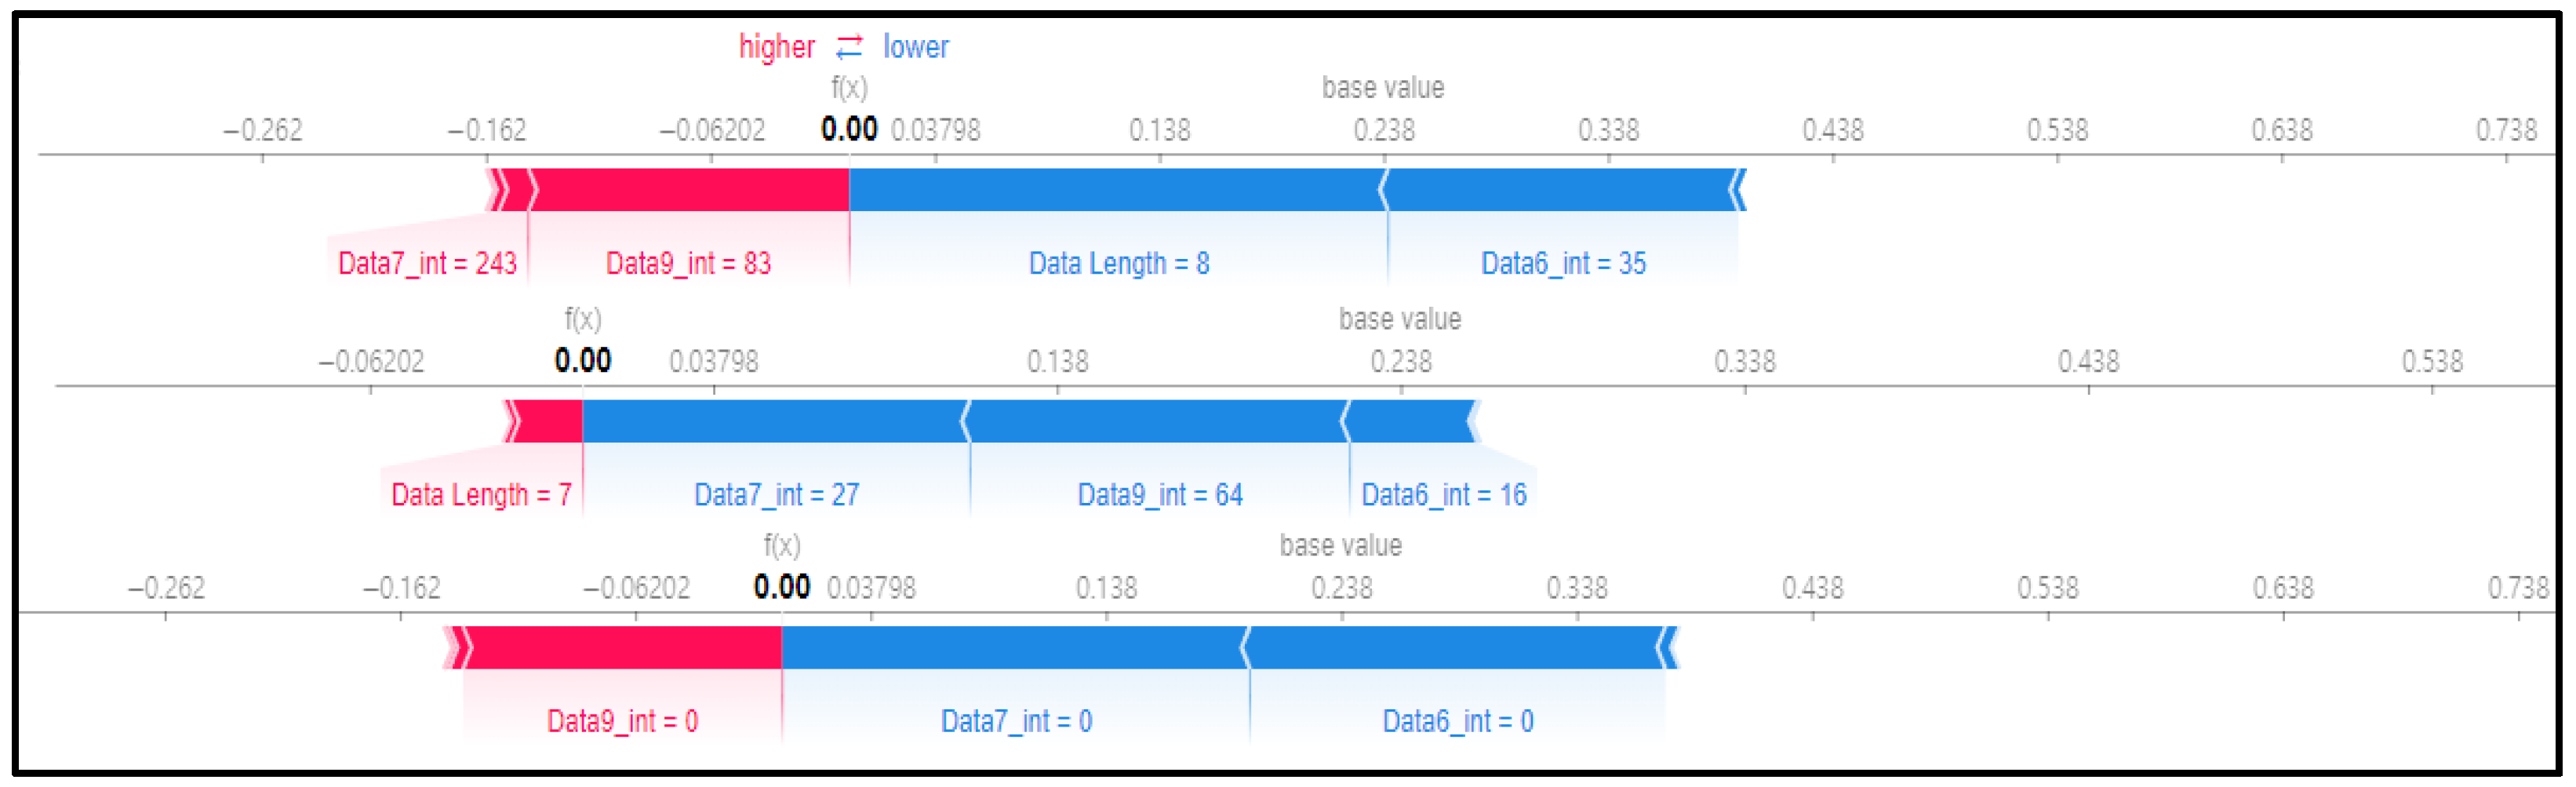
Scenario datasets 01 and 02 are related to flooding attacks, and in the SHAP analysis results shown in Figure 8, the sixth, seventh, and ninth data bytes were commonly selected as important features. Additionally, when analyzing the SHAP value distribution of the sixth and seventh data bytes in scenario type 01, a specific pattern emerged.

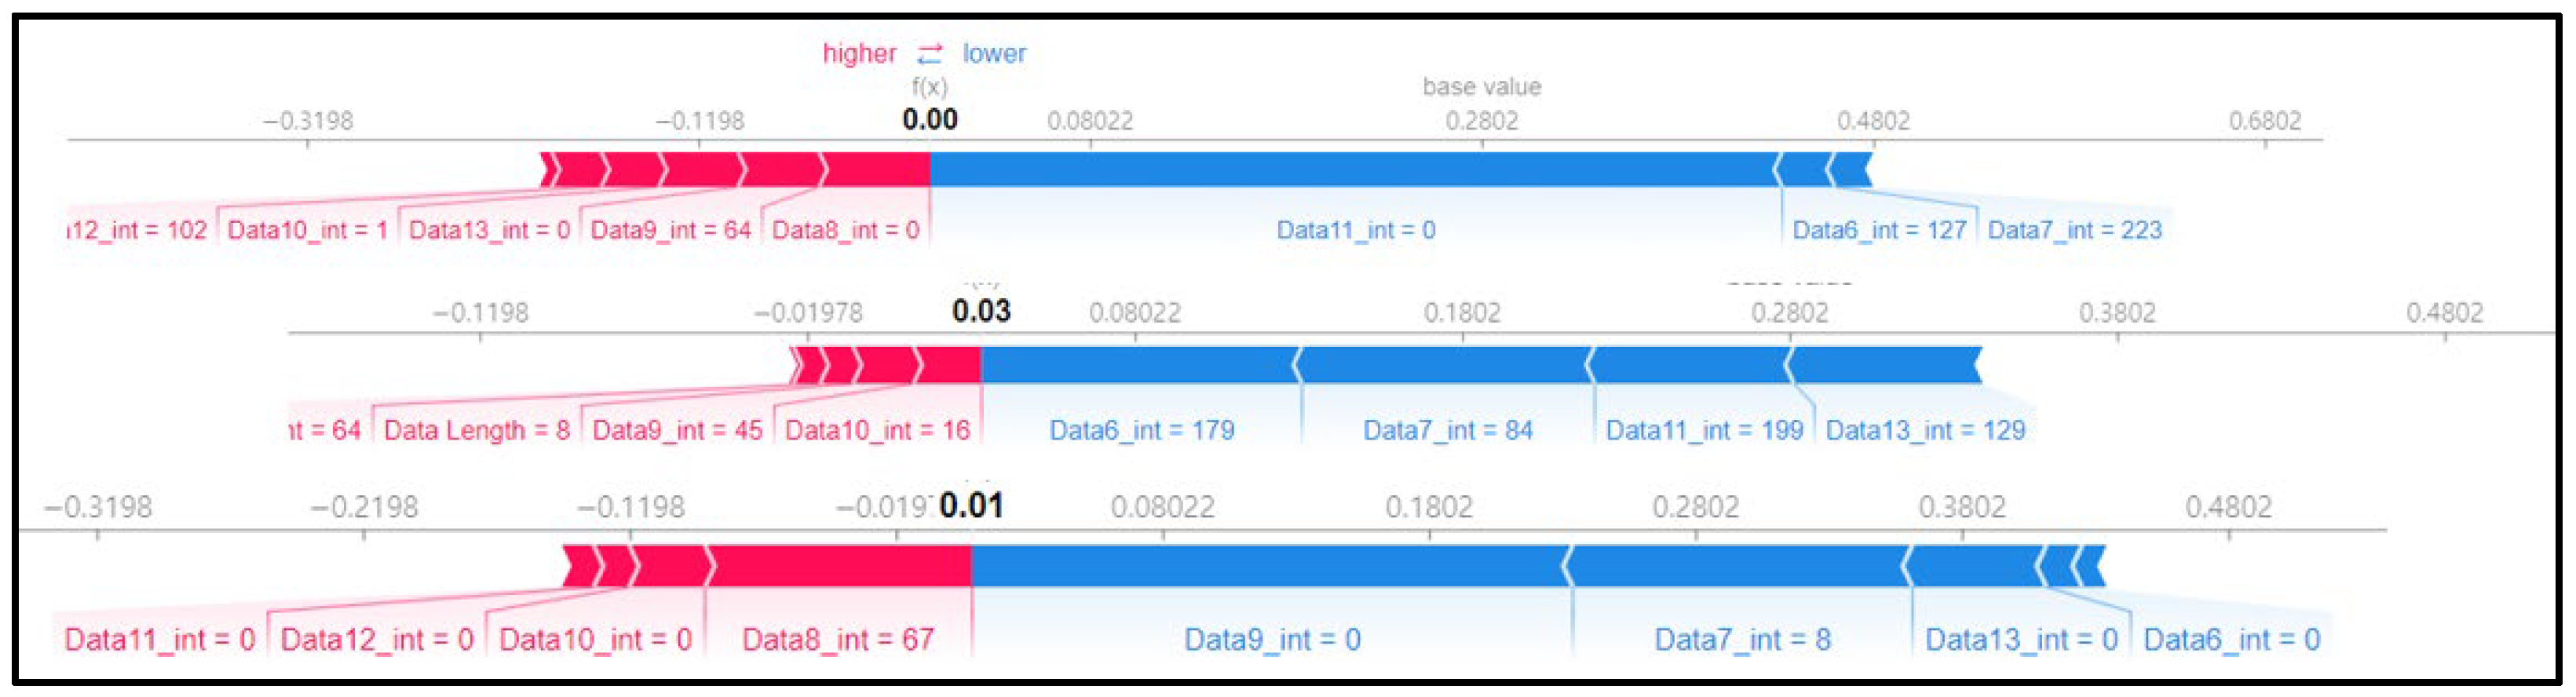
Figure 8.
SHAP force plot for 4 random rows of data (type 02).
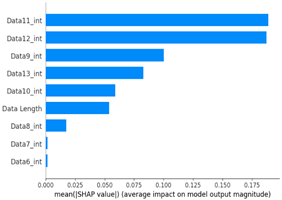
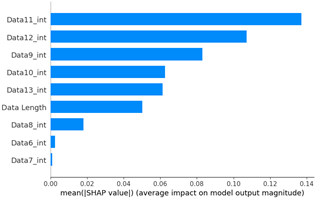
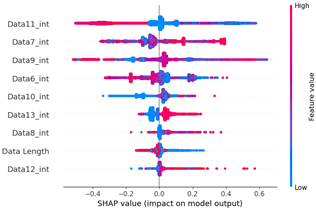
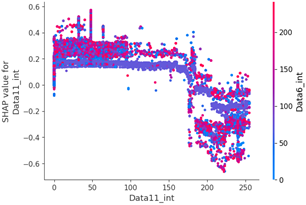
Table 15 shows the SHAP value distribution between the feature values, Feature Importance, and important features through the analysis of the scenario type 02 dataset. It presents the analysis of the same flooding attack dataset as Table 14 does. Therefore, in the Feature Importance graph, the ninth and seventh data bytes and the data length are selected as important features. However, in the SHAP value distribution graph, both the blue and red dots show a more biased distribution, and because type 02 has a higher unbalanced normal–attack ratio than type 01 does, SHAP analysis was performed. It is estimated that the Tree Explainer model of type 02 was more over-fitted compared to type 01.
The Feature Importance for each scenario type dataset was subjected to SHAP value analysis based on the XG boost model as follows. The datasets of scenario types 1 and 2—containing flooding attack data, which represent a DDoS attack—were collected. The ninth, seventh, and sixth data bytes and the data length are commonly measured because they are highly important. They were consistently observed despite the difference in proportions between the two datasets.
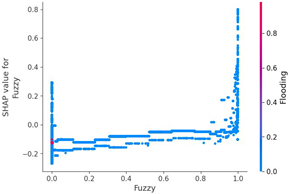
4.1.2. Fuzzy Attack Scenario Dataset Analysis (Types 03 and 04)
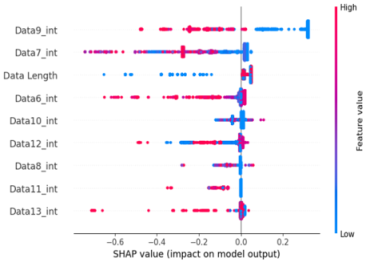
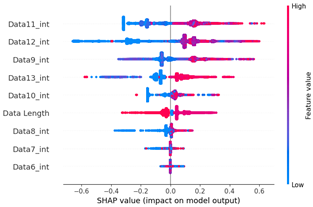
We can check the features of the fuzzy attack through the SHAP value distribution graph in Table 16. Except for the data length, all data byte items have high feature values in the section with a high SHAP value and low feature values in the section with a low SHAP value. This is presumed to be a pattern caused by the attacker injecting the payload using the brute forcing method. Therefore, unlike the previous flooding dataset, the feature importance of data length was relatively low.
Table 16.
SHAP analysis for scenario type 03.
Figure 9 shows the SHAP force plot for three rows of the scenario dataset. We checked if the pattern matched the previous SHAP analysis. Unlike the flooding dataset, a different data byte was selected for each row, and the SHAP value was analyzed separately. It was found that the fuzzy attack method was brute forcing for each data byte.
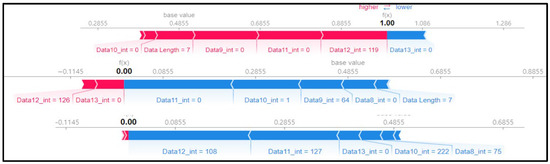
Figure 9.
SHAP force plot for 3 random rows of data (type 03).
Table 17 shows a dataset for the same fuzzy attack as scenario type 03, but it is unbalanced due to the low quantity of attack data. However, in the section where the SHAP value is high, the feature value is high, the data length is unimportant, and the SHAP value distribution between the features is clustered in blue and red.
Table 17.
SHAP analysis of scenario type 04.
The above pattern can be confirmed in the SHAP force plot for three random rows shown in Figure 10. In all three rows, the SHAP value was high in the section with a low base value, and the SHAP value was low in the section with a high base value, and the target features were also different for each row.
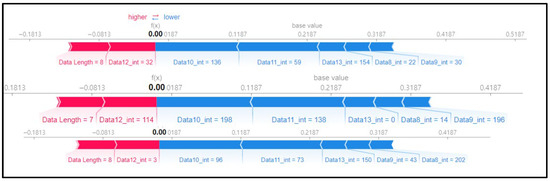
Figure 10.
SHAP force plot for 3 random rows of data (type 04).
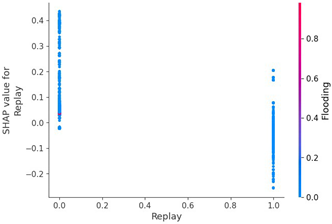
4.1.3. Replay Attack Scenario Dataset Analysis (Types 05 and 06)
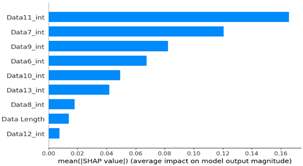
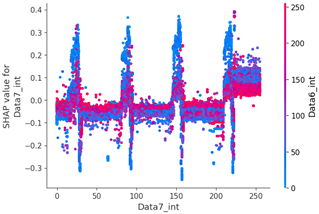
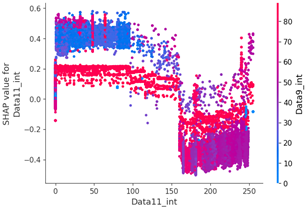
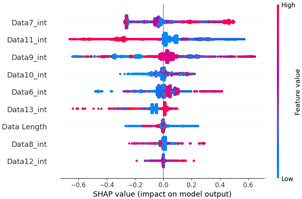
Table 18 shows a graph of the SHAP value analysis results for scenario type 05, which represents replay attacks. In the SHAP value distribution plot of the sixth, seventh, ninth, and eleventh data bytes, the blue and red dots are more clustered than the other previous datasets. This is presumed to be a result of the replay attack’s principle of injecting the same payload repeatedly. Therefore, the normal driving data in various forms can be classified into blue dots with low SHAP values and clustered in a straight line.
Table 18.
SHAP analysis for scenario type 05.
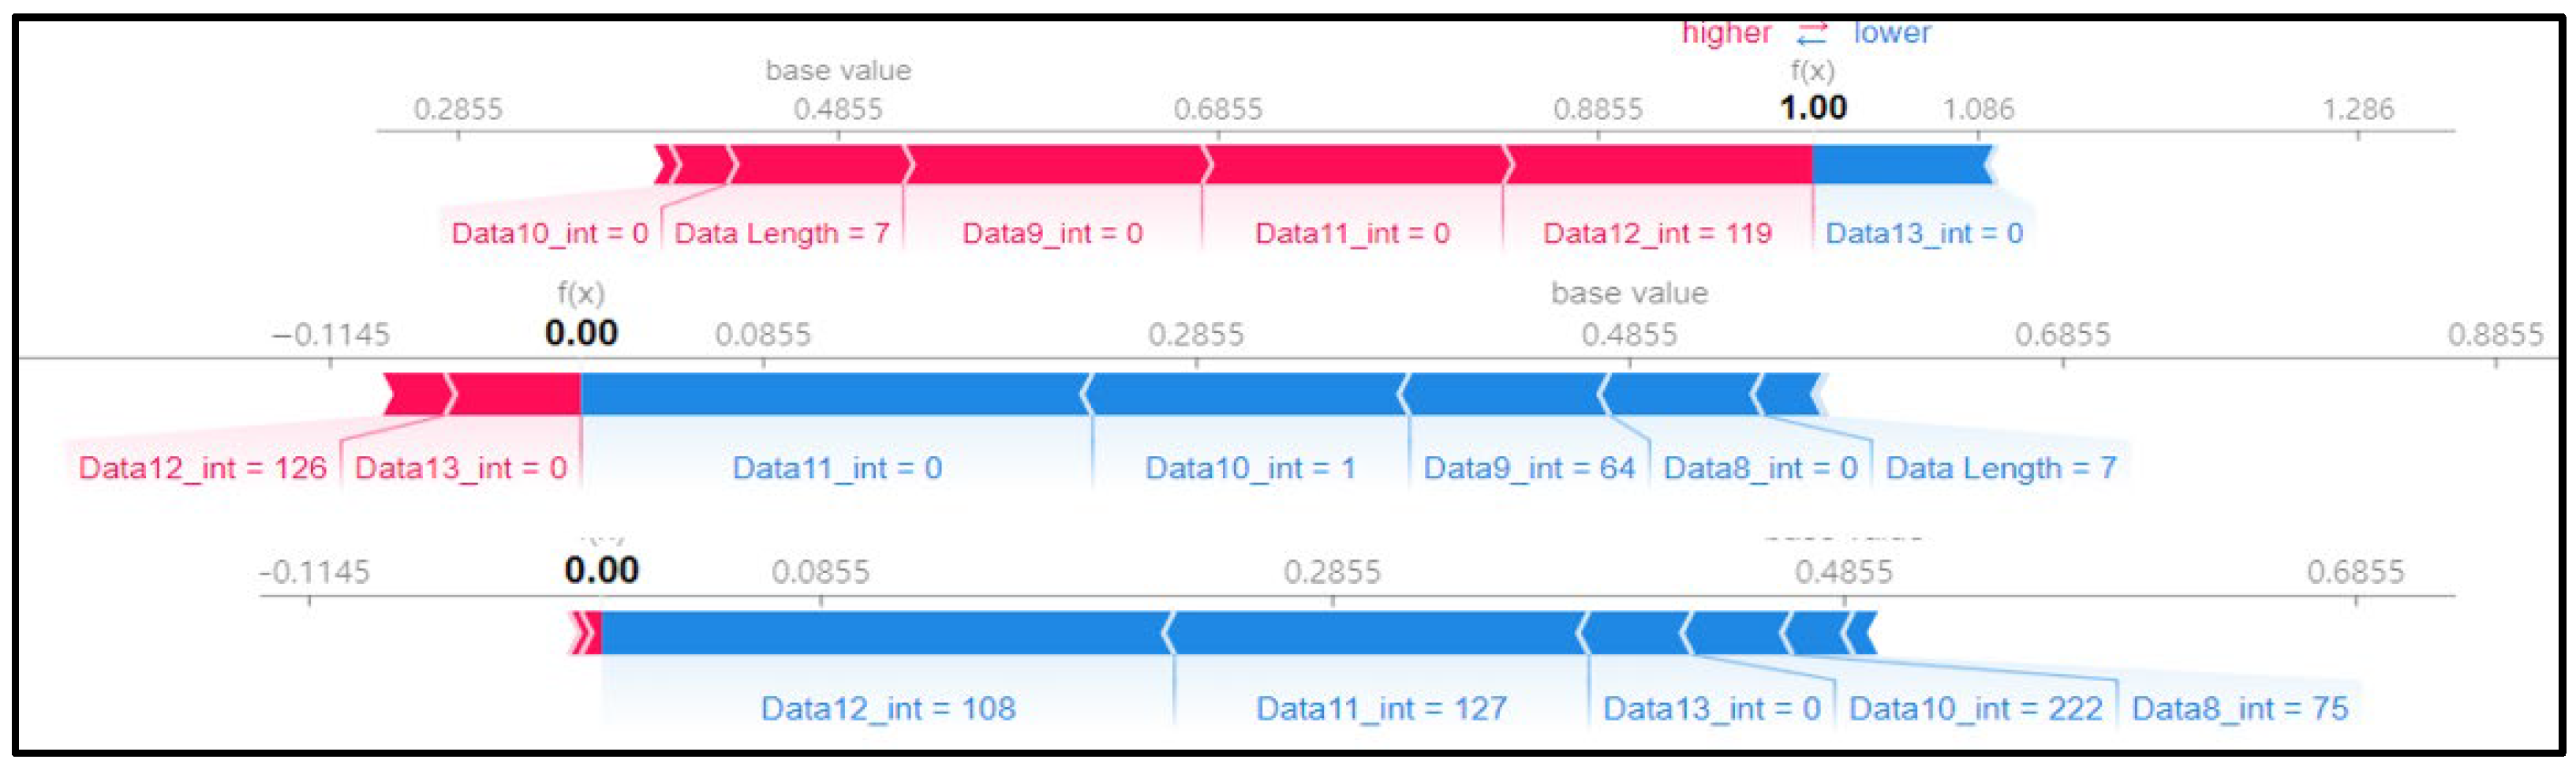
The pattern of the above replay attack can be seen in the SHAP force plot in Figure 11. It is observed that the SHAP value for some features is not high due to the repeated injection of the replay’s payload, and instead, the SHAP value is evenly distributed for several features. This model analyzes whether it is a replay payload by studying the data bytes of the entire message rather than finding attack patterns in other features.
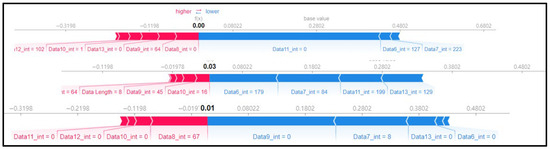
Figure 11.
SHAP force plot for 3 random rows of data (type 05).
Table 19 consists of a SHAP value distribution plot, a feature importance plot, and a distribution graph showing the SHAP and feature values for each element for scenario type 06, which contains the replay attack data presented in Table 19. We can see the clustering of blue and red dots in the SHAP value distribution plot of the sixth and seventh data bytes.
Table 19.
SHAP analysis for scenario type 06.
In Figure 12, unlike Figure 11, the features with high SHAP values can be observed, which suggests that scenario type 06 collected more diverse normal driving data than scenario type 05 did. This is because the dataset of scenario type 06 consists of more rows of data, and the quantity of attack data is also higher.
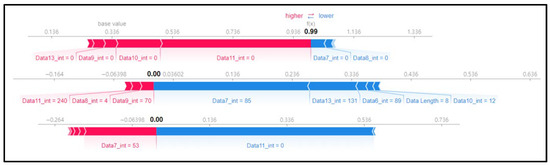
Figure 12.
SHAP force plot for 3 random rows of data (type 06).
4.1.4. Single Model Results Analysis
The accuracy, precision, recall, and F1-score in Table 12 were used as the indicators of model performance evaluation, and the performance evaluation results for each attack are shown in Table 20.
Table 20.
Evaluation results for each single model.
Scenario types 1 and 2 are flooding attack datasets, representing a type of DoS attack. Despite how the timestamps and data are ordered, the time series analysis RNN and LSTM models show an excellent performance of over 95% in accuracy, and their F1-Score indicators are shown. In addition, scenario types 3 and 4, which represent fuzzy attack datasets, and scenario type 6, which is a relay attack dataset, showed an excellent performance of over 95% in both accuracy and the F1-Score indicators. However, in scenario type 5’s dataset, the F1-Score of both models fell below 90%. On the other hand, the LSTM model used for time series analysis shows an accuracy of over 99% [22].
The decision tree single model, Random Forest, K-Neighbors Classifier, and dual classification DNN models showed excellent performances in the accuracy and F1-Score indicators of over 95% in all the datasets, but the logistic regression model’s accuracy varied between 79% and 97%. The F1-Score of the ML model is 97%, which is like the existing model. Over-fitting due to data imbalance was not observed.
In the performance evaluation in Section 3.2, the best models of each attack type were selected as base models to design a stacking-based ensemble model.
The base models independently detect flooding, fuzzy, and replay attacks from the input CAN Traffic Data and deliver these detection results to the meta model shown in Table 21. The decision tree-based metamodel synthesizes the detection results of each base model to determine whether an attack has occurred in a binary sense.
Table 21.
Base model Analysis results for each attack.
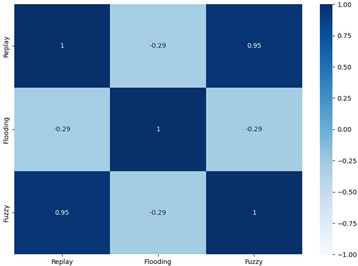
As a result of analyzing the SHAP value interaction and Pearson correlation of the detection results of each base model, it is estimated that the correlation and similarity between the detection results of the replay and fuzzy models are high.
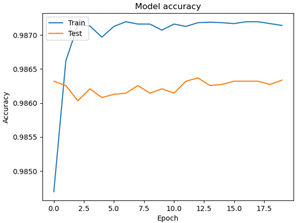
4.2. Experiment Model Results
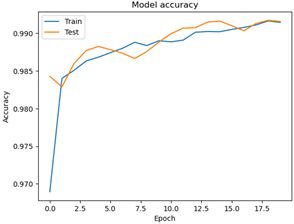
The LSTM model learned about the flood and fuzzy models for over 20 epochs, and the accuracy of the two models was over 98% during the training and testing processes. The accuracy changes according to the learning process are shown in Table 22.
Table 22.
Optimization of flood and fuzzy models.
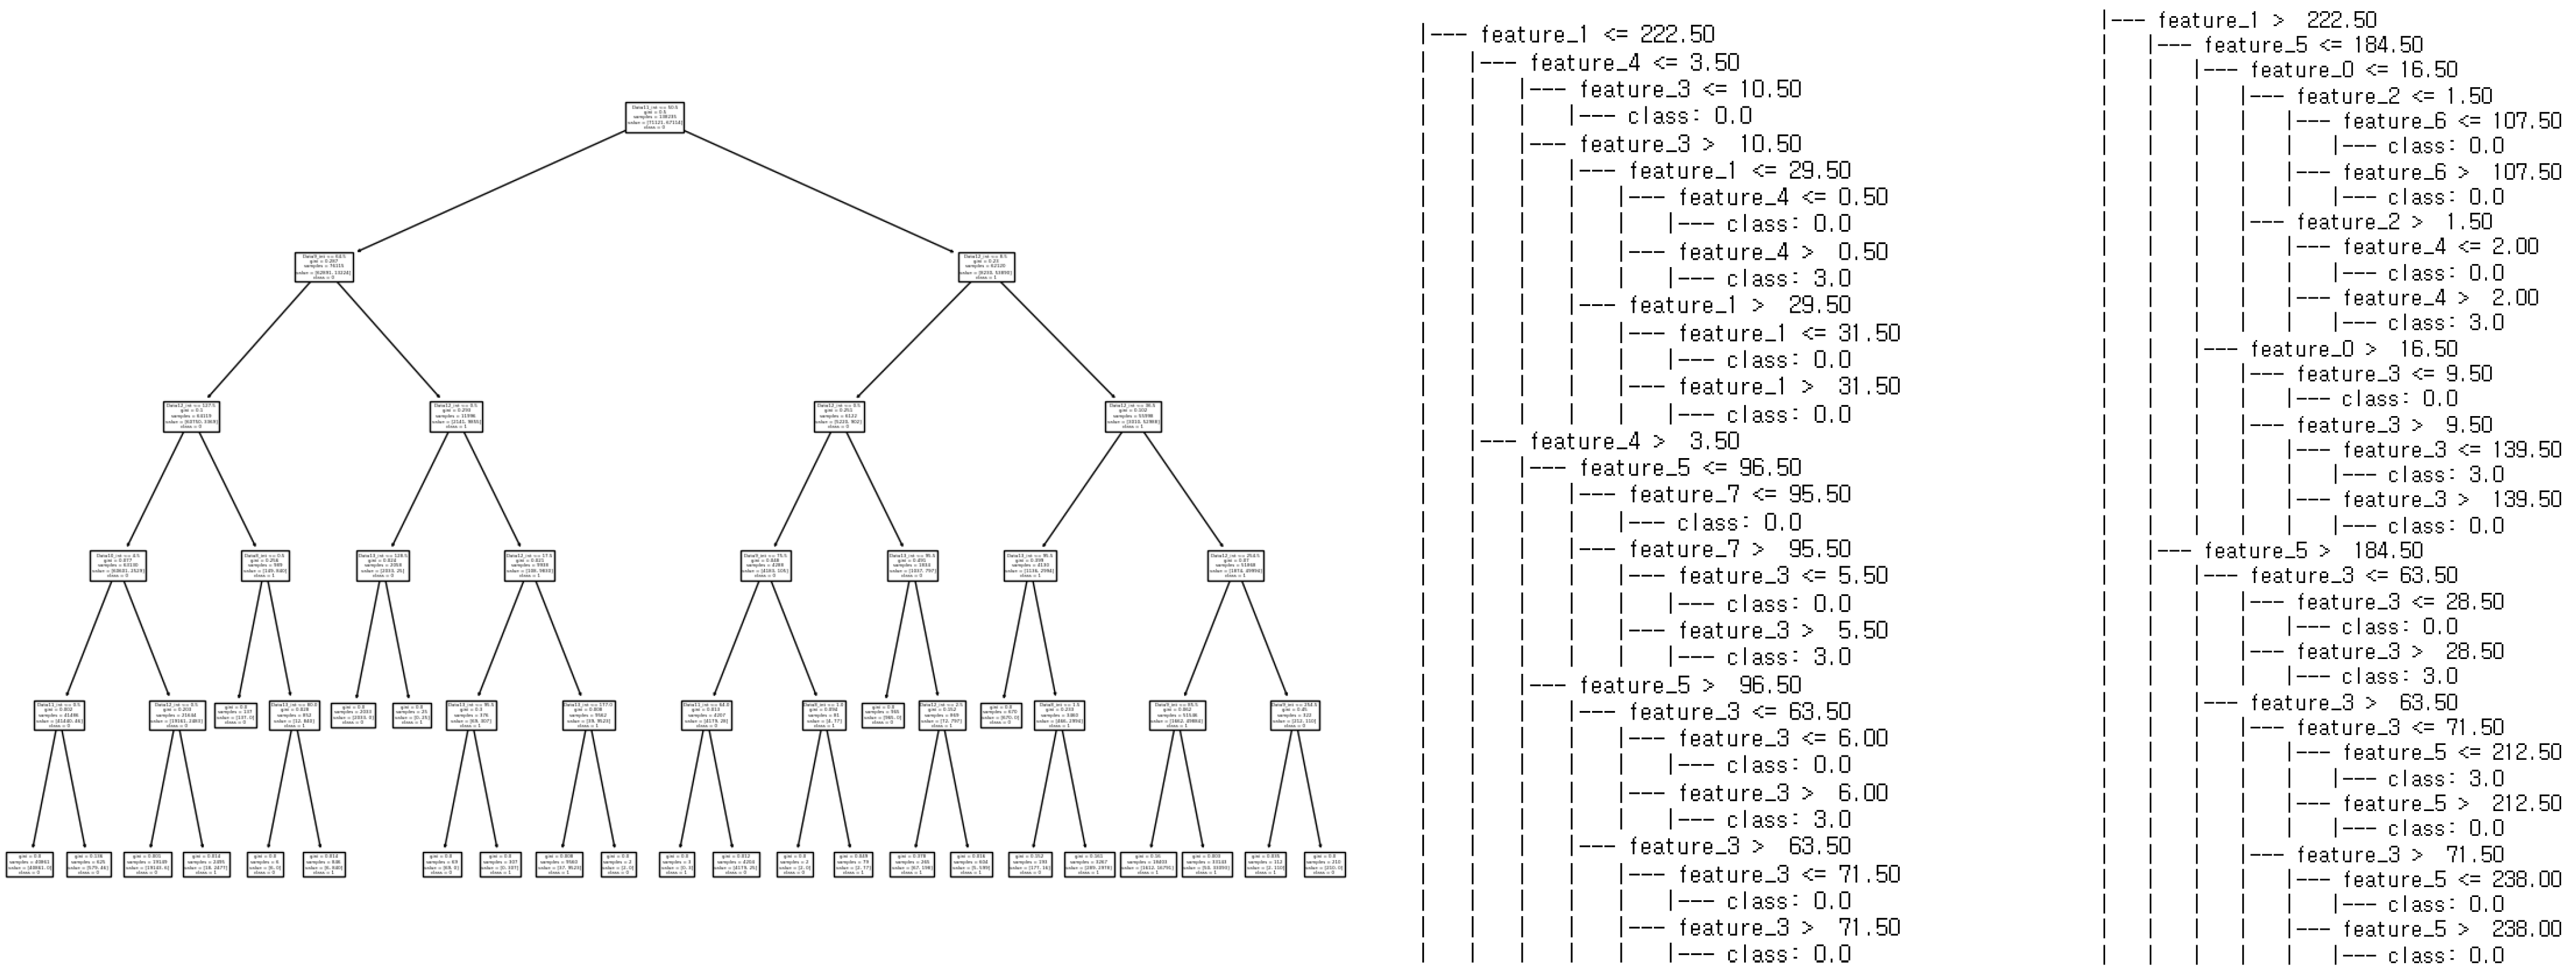
Unlike the previous two models, the decision tree model learned about the replay model, with the max depth set to five, and its performance was evaluated in Figure 13. Replay attacks were detected with an accuracy and an F1-Score of over 97%. Through tree visualization, it was confirmed that the model underwent balanced training.
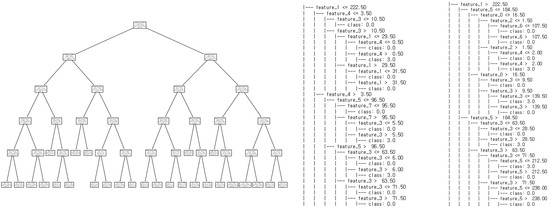
Figure 13.
Structure of relay attack model.
The model that assembled these base models had an accuracy of 83%, a precision of 62%, and an F1-Score of 68%. Therefore, the cause of the poorer performance compared to that of the existing base model was determined through SHAP analysis in Section 4.1.
4.3. Result Analysis
In this experiment, the timestamps were removed from the DL models that performed time series analysis, such as the RNN, LSTM, and ML models, and the experiments were conducted to detect fuzzing, flooding, and relay attacks by learning data with shuffled data sequence. All the models showed significant detection performances.
In addition, by conducting SHAP on the detection performance, it was found that the models learned the data bytes associated with the algorithm used in each attack as a meaningful feature.
Although it was effective in the binary classification of a single attack through a single model, the performance of the binary classification of multiple attack types using a stacking model was poor. Looking at the SHAP analysis and correlation analysis results, it is assumed that the replay and fuzzy models have a high correlation in the detection results, causing overfitting in the ensemble model through stacking, adversely affecting their performance.
5. Discussion and Conclusions
According to the experiments proposed in this study, the LSTM model showed relatively lower performance when learning non-timeline data than timeline data. In this experiment, the Feature Importance and SHAP force plot confirmed more than 96% of both the accuracy score and the F1-score performance for intrusion in the drone network. These results are due to the fact that the Explainer model has the ability to select the intrusion pattern in the payload of the single model.
This study developed an ensemble model that can simultaneously detect multiple types of intrusion. In preprocessing, the patterns within the payload using a measure of Feature Importance were distinguished from attack and normal data, and as a result, improved the accuracy of the ensemble model. Through the experiment, both the accuracy score and F1-score were verified for practical utility through 97% detection performance measurement. However, it is also necessary to reconsider the limitation of three types of intrusion in this study. In future work, we plan to continuously evaluate the potential of these problems to increase the practical applicability of the model.
Author Contributions
Conceptualization, methodology, software, validation, writing—original draft preparation, formal analysis, investigation, visualization: Y.-W.H.; validation, writing—review and editing, supervision, project administration, funding acquisition, project administration, resources: D.-Y.Y. All authors have read and agreed to the published version of the manuscript.
Funding
This work was supported by Hongik University’s new faculty research support fund.
Institutional Review Board Statement
Not applicable.
Informed Consent Statement
Not applicable.
Data Availability Statement
Data available in a publicly accessible repository. The UAVCAN Attack dataset utilized in our experiments originates from the HCRL (Hacking and Countermeasure Research Lab). The dataset can be acquired at https://ocslab.hksecurity.net/Datasets/uavcan-attack-dataset (accessed on 19 November 2023).
Conflicts of Interest
The authors declare no conflict of interest.
References
- OpenCyphal. DS-015 UAVCAN Drone Standard v1.0.1. 2021. Available online: https://legacy.uavcan.org/Specification/4._CAN_bus_transport_layer/ (accessed on 26 April 2024).
- Mademlis, I.; Nikolaidis, N.; Tefas, A.; Pitas, I.; Wagner, T.; Messina, A. Autonomous unmanned aerial vehicles filming in dynamic unstructured outdoor environments. IEEE Signal Process. Mag. 2018, 36, 147–153. [Google Scholar] [CrossRef]
- Kim, J.; Kim, S.; Ju, C.; Son, H.I. Unmanned aerial vehicles in agriculture: A review of perspective of platform, control, and applications. IEEE Access 2019, 7, 105100–105115. [Google Scholar] [CrossRef]
- Gargalakos, M. The role of unmanned aerial vehicles in military communications: Application scenarios, current trends, and beyond. J. Def. Model. Simul. 2021, 15485129211031668. [Google Scholar] [CrossRef]
- Altawy, R.; Youssef, A.M. Security, privacy, and safety aspects of civilian drones: A survey. ACM Trans. Cyber-Phys. Syst. 2016, 1, 1–25. [Google Scholar] [CrossRef]
- Shrestha, R.; Omidkar, A.; Roudi, S.A.; Abbas, R.; Kim, S. Machine-learning-enabled intrusion detection system for cellular connected UAV networks. Electronics 2021, 10, 1549. [Google Scholar] [CrossRef]
- Liu, J.; Yin, T.; Yue, D.; Karimi, H.R.; Cao, J. Event-based secure leader-following consensus control for multiagent systems with multiple cyber attacks. IEEE Trans. Cybern. 2020, 51, 162–173. [Google Scholar] [CrossRef] [PubMed]
- Cao, J.; Ding, D.; Liu, J.; Tian, E.; Hu, S.; Xie, X. Hybrid-triggered-based security controller design for networked control system under multiple cyber attacks. Inf. Sci. 2021, 548, 69–84. [Google Scholar] [CrossRef]
- CAN Specification, Version 2.0; Postfach 30 02 40; Robert Bosch GmbH: Stuttgart, Germany, 1991.
- Sikora, R. A modified stacking ensemble machine learning algorithm using genetic algorithms. In Handbook of Research on Organizational Transformations through Big Data Analytics; IGi Global: Hershey, PA, USA, 2015; pp. 43–53. [Google Scholar]
- Kwon, H.; Park, J.; Lee, Y. Stacking ensemble technique for classifying breast cancer. Healthc. Inform. Res. 2019, 25, 283–288. [Google Scholar] [CrossRef] [PubMed]
- Charoenkwan, P.; Chiangjong, W.; Nantasenamat, C.; Hasan, M.M.; Manavalan, B.; Shoombuatong, W. StackIL6: A stacking ensemble model for improving the prediction of IL-6 inducing peptides. Brief. Bioinform. 2021, 22, bbab172. [Google Scholar] [CrossRef]
- Akyol, K. Stacking ensemble based deep neural networks modeling for effective epileptic seizure detection. Expert Syst. Appl. 2020, 148, 113239. [Google Scholar] [CrossRef]
- Rashid, M.; Kamruzzaman, J.; Imam, T.; Wibowo, S.; Gordon, S. A tree-based stacking ensemble technique with feature selection for network intrusion detection. Appl. Intell. 2022, 52, 9768–9781. [Google Scholar] [CrossRef]
- Lundberg, S.M.; Lee, S.I. A unified approach to interpreting model predictions. In Proceedings of the 31st International Conference on Neural Information Processing Systems, NIPS’17, Long Beach, CA, USA, 4–9 December 2017; Volume 30, pp. 4768–4777. [Google Scholar]
- Lundberg, S.M.; Erion, G.G.; Lee, S.I. Consistent individualized feature attribution for tree ensembles. arXiv 2018, arXiv:1802.03888. [Google Scholar]
- Lundberg, S.M.; Erion, G.; Chen, H.; DeGrave, A.; Prutkin, J.M.; Nair, B.; Lee, S.I. From local explanations to global understanding with explainable AI for trees. Nat. Mach. Intell. 2020, 2, 56–67. [Google Scholar] [CrossRef]
- Li, J.; Guo, Y.; Li, L.; Liu, X.; Wang, R. Using LightGBM with SHAP for predicting and analyzing traffic accidents severity. In Proceedings of the 2023 7th International Conference on Transportation Information and Safety (ICTIS), Xi’an, China, 4–6 August 2023; IEEE: New York, NY, USA, 2023; pp. 2150–2155. [Google Scholar]
- Lee, Y.G.; Oh, J.Y.; Kim, D.; Kim, G. Shap value-based feature importance analysis for short-term load forecasting. J. Electr. Eng. Technol. 2023, 18, 579–588. [Google Scholar] [CrossRef]
- OpenCyphal. Available online: https://legacy.uavcan.org/ (accessed on 26 April 2024).
- Sajid, J.; Hayawi, K.; Malik, A.W.; Anwar, Z.; Trabelsi, Z. A fog computing framework for intrusion detection of energy-based attacks on UAV-assisted smart farming. Appl. Sci. 2023, 13, 3857. [Google Scholar] [CrossRef]
- Tlili, F.; Ayed, S.; Chaari Fourati, L. Dynamic Intrusion Detection Framework for UAVCAN Protocol Using AI. In Proceedings of the 18th International Conference on Availability, Reliability and Security, Benevento, Italy, 28 August–1 September 2023; pp. 1–10. [Google Scholar]
- Hoang, T.N.; Islam, M.R.; Yim, K.; Kim, D. CANPerFL: Improve in-vehicle intrusion detection performance by sharing knowledge. Appl. Sci. 2023, 13, 6369. [Google Scholar] [CrossRef]
- Tanksale, V. Intrusion detection for controller area network using support vector machines. In Proceedings of the 2019 IEEE 16th International Conference on Mobile Ad Hoc and Sensor Systems Workshops (MASSW), Monterey, CA, USA, 4–7 November 2019; IEEE: New York, NY, USA, 2019; pp. 121–126. [Google Scholar]
- Alsoliman, A.; Rigoni, G.; Callegaro, D.; Levorato, M.; Pinotti, C.M.; Conti, M. Intrusion Detection Framework for Invasive FPV Drones Using Video Streaming Characteristics. ACM Trans. Cyber-Phys. Syst. 2023, 7, 1–29. [Google Scholar] [CrossRef]
- Moulahi, T.; Zidi, S.; Alabdulatif, A.; Atiquzzaman, M. Comparative performance evaluation of intrusion detection based on machine learning in in-vehicle controller area network bus. IEEE Access 2021, 9, 99595–99605. [Google Scholar] [CrossRef]
- Kang, M.J.; Kang, J.W. Intrusion detection system using deep neural network for in-vehicle network security. PLoS ONE 2016, 11, e0155781. [Google Scholar] [CrossRef]
- Javed, A.R.; Ur Rehman, S.; Khan, M.U.; Alazab, M.; Reddy, T. CANintelliIDS: Detecting in-vehicle intrusion attacks on a controller area network using CNN and attention-based GRU. IEEE Trans. Netw. Sci. Eng. 2021, 8, 1456–1466. [Google Scholar] [CrossRef]
- Kou, L.; Ding, S.; Wu, T.; Dong, W.; Yin, Y. An intrusion detection model for drone communication network in sdn environment. Drones 2022, 6, 342. [Google Scholar] [CrossRef]
- Song, H.M.; Woo, J.; Kim, H.K. In-vehicle network intrusion detection using deep convolutional neural network. Veh. Commun. 2020, 21, 100198. [Google Scholar] [CrossRef]
- Tariq, S.; Lee, S.; Kim, H.K.; Woo, S.S. CAN-ADF: The controller area network attack detection framework. Comput. Secur. 2020, 94, 101857. [Google Scholar] [CrossRef]
- Seo, E.; Song, H.M.; Kim, H.K. GIDS: GAN based intrusion detection system for in-vehicle network. In Proceedings of the 2018 16th Annual Conference on Privacy, Security and Trust (PST), Belfast, Ireland, 28–30 August 2018; pp. 1–6. [Google Scholar]
- Qin, H.; Yan, M.; Ji, H. Application of controller area network (CAN) bus anomaly detection based on time series prediction. Veh. Commun. 2021, 27, 100291. [Google Scholar] [CrossRef]
- Khan, M.H.; Javed, A.R.; Iqbal, Z.; Asim, M.; Awad, A.I. DivaCAN: Detecting in-vehicle intrusion attacks on a controller area network using ensemble learning. Comput. Secur. 2024, 139, 103712. [Google Scholar] [CrossRef]
- Zhang, H.; Wang, J.; Wang, Y.; Li, M.; Song, J.; Liu, Z. ICVTest: A Practical Black-Box Penetration Testing Framework for Evaluating Cybersecurity of Intelligent Connected Vehicles. Appl. Sci. 2023, 14, 204. [Google Scholar] [CrossRef]
- Adly, S.; Moro, A.; Hammad, S.; Maged, S.A. Prevention of Controller Area Network (CAN) Attacks on Electric Autonomous Vehicles. Appl. Sci. 2023, 13, 9374. [Google Scholar] [CrossRef]
- Fang, S.; Zhang, G.; Li, Y.; Li, J. Windowed Hamming Distance-Based Intrusion Detection for the CAN Bus. Appl. Sci. 2024, 14, 2805. [Google Scholar] [CrossRef]
- Islam, R.; Refat, R.U.D.; Yerram, S.M.; Malik, H. Graph-based intrusion detection system for controller area networks. IEEE Trans. Intell. Transp. Syst. 2020, 23, 1727–1736. [Google Scholar] [CrossRef]
- Capuano, N.; Fenza, G.; Loia, V.; Stanzione, C. Explainable artificial intelligence in cybersecurity: A survey. IEEE Access 2022, 10, 93575–93600. [Google Scholar] [CrossRef]
- Chamola, V.; Hassija, V.; Sulthana, A.R.; Ghosh, D.; Dhingra, D.; Sikdar, B. A review of trustworthy and explainable artificial intelligence (xai). IEEE Access. 2023, 11, 78994–79015. [Google Scholar] [CrossRef]
- Ribeiro, M.T.; Singh, S.; Guestrin, C. “Why should i trust you?” Explaining the predictions of any classifier. In Proceedings of the 22nd ACM SIGKDD International Conference on Knowledge Discovery and Data Mining, San Francisco, CA, USA, 13–17 August 2016; pp. 1135–1144. [Google Scholar]
- Covington, P.; Adams, J.; Sargin, E. Deep neural networks for youtube recommendations. In Proceedings of the 10th ACM Conference on Recommender Systems, Boston, MA, USA, 15–19 September 2016; pp. 191–198. [Google Scholar]
- The Asimov Institute. Available online: https://www.asimovinstitute.org/neural-network-zoo/ (accessed on 8 March 2024).
- Martinez, G.J.; Dubrovskiy, G.; Zhu, S.; Mohammed, A.; Lin, H.; Laneman, J.N.; Striegel, A.; Pragada, R.; Castor, D.R. An open, real-world dataset of cellular UAV communication properties. In Proceedings of the 2021 International Conference on Computer Communications and Networks (ICCCN), Athens, Greece, 19–22 July 2021; IEEE: New York, NY, USA, 2021; pp. 1–6. [Google Scholar]
- Chang, Y.; Cheng, Y.; Murray, J.; Huang, S.; Shi, G. The hdin dataset: A real-world indoor uav dataset with multi-task labels for visual-based navigation. Drones 2022, 6, 202. [Google Scholar] [CrossRef]
- Kim, D.; Song, Y.; Kwon, S.; Kim, H.; Yoo, J.D.; Kim, H.K. Uavcan dataset description. arXiv 2022, arXiv:2212.09268. [Google Scholar]
- Hartmann, K.; Steup, C. The vulnerability of UAVs to cyber attacks—An approach to the risk assessment. In Proceedings of the 2013 5th International Conference on Cyber Conflict (CYCON 2013), Tallinn, Estonia, 4–7 June 2013; pp. 1–23. [Google Scholar]
- Hochreiter, S.; Schmidhuber, J. Long short-term memory. Neural Comput. 1997, 9, 1735–1780. [Google Scholar] [CrossRef] [PubMed]


Disclaimer/Publisher’s Note: The statements, opinions and data contained in all publications are solely those of the individual author(s) and contributor(s) and not of MDPI and/or the editor(s). MDPI and/or the editor(s) disclaim responsibility for any injury to people or property resulting from any ideas, methods, instructions or products referred to in the content. |
© 2024 by the authors. Licensee MDPI, Basel, Switzerland. This article is an open access article distributed under the terms and conditions of the Creative Commons Attribution (CC BY) license (https://creativecommons.org/licenses/by/4.0/).