Abstract
Point cloud registration is a technology that aligns point cloud data from different viewpoints by computing coordinate transformations to integrate them into a specified coordinate system. Many cutting-edge fields, including autonomous driving, industrial automation, and augmented reality, require the registration of point cloud data generated by millimeter-wave radar for map reconstruction and path planning in 3D environments. This paper proposes a novel point cloud registration algorithm based on a weighting strategy to enhance the accuracy and efficiency of point cloud registration in 3D environments. This method combines a statistical weighting strategy with a point cloud registration algorithm, which can improve registration accuracy while also increasing computational efficiency. First, in 3D indoor spaces, we apply PointNet to the semantic segmentation of the point cloud. We then propose an objective weighting strategy to assign different weights to the segmented parts of the point cloud. The Iterative Closest Point (ICP) algorithm uses these weights as reference values to register the entire 3D indoor space’s point cloud. We also show a new way to perform nonlinear calculations that yield exact closed-form answers for the ICP algorithm in generalized 3D measurements. We test the proposed algorithm’s accuracy and efficiency by registering point clouds on public datasets of 3D indoor spaces. The results show that it works better in both qualitative and quantitative assessments.
1. Introduction
Various registration algorithms have significantly improved accuracy and efficiency, but their primary application is in the registration of small components. When facing complex 3D indoor spaces, existing registration algorithms struggle to attain a good balance between accuracy and efficiency. A 3D indoor space, like a room, contains objects of different shapes and sizes with large quantities of point clouds, which pose a challenge for both accuracy and efficiency. The idea behind this paper is to use a statistical weighting strategy to come up with a point cloud registration algorithm that is both accurate and quick for 3D indoor places. Point cloud registration typically serves 3D map reconstruction or navigation in 3D indoor spaces, necessitating higher weights for significant targets that impact navigation, tracking, or localization, such as chairs on the ground, tables in the room, or walls obstructing the path. We can appropriately reduce weights for other types of targets to save computational resources during registration, thereby enhancing the overall efficiency of the algorithm and the registration performance of key targets. This paper uses PointNet [1] for semantic segmentation, marking different targets in the point cloud of 3D indoor spaces. A statistical weighting strategy is introduced where the segmented parts of the point cloud are treated as evaluation criteria and various attributes of the point cloud are set as samples for evaluation. We then use the weights of different parts of the point cloud as reference values to determine the minimum metric of the nonlinear objective function in the Iterative Closet Point (ICP) registration algorithm. We use a new technique to obtain closed-form answers to the nonlinear objective function in a 3D generalized metric. This makes the registration more accurate. Finally, experiments with 3D indoor space datasets verify the accuracy and efficiency of the proposed algorithm, demonstrating significant improvements over the traditional point cloud registration algorithms.
We organize the remainder of this paper as follows: Section 2 introduces the weighting strategy, including the basic principles of objective weighting methods and a novel improvement to the calculation steps proposed in this paper. Section 3 describes the process of obtaining the ICP minimum metric solution with assigned weights. Section 4 analyzes the accuracy and efficiency of the proposed algorithm with registration experiments. Section 5 ultimately provides the conclusion and outlook.
Point cloud registration is a vital technique in computer vision. It introduces a spatial transformation that maps one image onto another and ensures a one-to-one correspondence between points in both images of the same spatial location to achieve information fusion [2]. Over the years, research into point cloud registration has made great progress. In 1992, Besl et al. proposed the Iterative Closest Point (ICP) algorithm [3]. By calculating the distances between corresponding points in the source point cloud and the target point cloud, a rotation–translation matrix RT is constructed. Then, the RT can be applied to transform the source point cloud and calculate the mean squared difference of the transformed points. If the mean squared difference satisfies a threshold condition, then the algorithm terminates. Otherwise, it continues iterating until the error meets the threshold condition or the maximum iteration count is reached. However, ICP is usually sensitive to initial values and may become stuck in local optima [4]. In 2009, Magnusson proposed the normal distributions transform (NDT) as a great 3D surface representation with applications in point cloud registration [5]. The NDT utilizes statistical probability methods to determine corresponding point pairs based on the normal distribution of point clouds, thereby calculating the transformation relationship between the source point cloud and the target point cloud. It is a discrete global registration algorithm that, in discretized coordinate space, maximizes the score of the probability density of the normal distribution calculated for the source points voxelized in the target point cloud. It employs probability density functions and optimal solving methods to compute the transformation relationship between the point clouds to be registered. Compared to ICP, the NDT significantly decreases consumption of hardware resources and enhances registration accuracy. However, since all point cloud data need to be discretized, the NDT has longer running times than ICP, leading to lower efficiency. In 2019, Yasuhiro et al. proposed the PointNetLK, a deep-learning-based point cloud registration algorithm [6]. In PointNetLK, PointNet is treated as a learnable “imaging” function and is utilized for point cloud registration by modifying the classic Lucas–Kanade (LK) algorithm used for image alignment to integrate with PointNet [7]. Unlike ICP and its variants, PointNetLK does not require large amounts of computation resources, offering advantages in terms of registration accuracy, robustness to initialization, and computational efficiency. On the other hand, due to the explicit encoding of the alignment process in the network architecture, PointNetLK shows significant generalization performance for unseen objects, which implies that the network only needs to learn point cloud representations without the necessity to learn the alignment task. In summary, existing point cloud registration algorithms can be broadly categorized into several types: iterative, optimization-based algorithms such as ICP and its variants Point-to-plane ICP, NICP, Go-ICP, and IMLS-ICP, etc. [8,9,10,11]; statistical, Gaussian distribution-based algorithms such as NDT and its variant MSKM-NDT [12]; and deep-learning-based algorithms such as PointNetLK, DeepVCP, and PCGAN [13,14].
In the last few years there have been other papers, such as [15], which provides an overview of traditional and learning-based methods for point cloud registration and outlier rejection. It discusses the limitations of existing approaches and sets the stage for the proposed PointDSC model. Ref. [15] discusses traditional point cloud registration algorithms, such as RANSAC and its variants, which are popular outlier rejection methods but have drawbacks in terms of slow convergence and low accuracy in cases with large outlier ratios. It also mentions the limitations of 3D descriptors in traditional methods due to irregular density and a lack of useful texture, highlighting the importance of geometric consistency, such as length constraints under rigid transformation, which are commonly utilized by traditional outlier rejection algorithms. In addition, it presents learning-based outlier rejection methods, such as DGR and 3DRegNet, which formulate outlier rejection as an inlier/outlier classification problem. These methods use operators like sparse convolution and pointwise MLP for feature embedding, but they overlook the spatial compatibility between inliers. The section also highlights the limitations of existing outlier rejection methods, as well as the need for spatial consistency in outlier rejection for robust 3D point cloud registration. In the related work section of [15], certain algorithms are suggested, including RANSAC [16], spectral matching [17], DGR [18], and 3DRegNet [19]. This section gives a full picture of all the current methods used for point cloud registration and outlier rejection.
Ref. [20] focuses on the recent developments in point cloud registration, including same-source and cross-source methods, as well as the connections between optimization-based and deep learning techniques. The authors emphasize the need for a comprehensive survey to summarize recent advances in point cloud registration, as existing reviews mainly focus on conventional point cloud registration and deep learning techniques, with limited coverage of cross-source point cloud registration. The [20] paper’s contributions include a comprehensive review of same-source point cloud registration, a review of cross-source registration, the development of a new cross-source point cloud benchmark, and the exploration of potential applications and future research directions in point cloud registration. It also discusses the challenges in cross-source point cloud registration, such as noise, outliers, density differences, partial overlap, and scale differences. It provides an evaluation of state-of-the-art registration algorithms on a cross-source dataset, highlighting the performance of optimization-based and deep learning methods. Refs. [17,21,22,23,24,25] provide a foundation for the survey and support the authors’ claims and contributions in the field of point cloud registration. Ref. [20] introduces new cross-source datasets, such as 3DMatch, KITTI, ETHdata, and 3DCSR, for comparison experiments and benchmarking.
2. Weighting Strategy of Targets in Semantic Segmentation
2.1. The Objective Weighting Method
The objective weighting method utilizes objective and measurable metrics, rather than subjective judgments, for weight assignment to ensure fairness and rationality. In our task of point cloud registration, the coordinates, color information, and category labels of each point cloud data point are totally quantifiable. Therefore, using the objective weighting method for weight assignment aligns well with the requirements of the application background. Common objective weighting methods include the standard deviation method, the entropy weight method, and the criteria importance through intercriteria correlation (CRITIC) method [26,27,28]. The standard deviation method’s basic idea is to calculate the variance Si of the data under each indicator. We obtain the weight value for the ith indicator by dividing Si by the sum of all Si values. Larger variances result in higher weights. This method is relatively simple and easy to implement, effectively distinguishing between different indicators. However, it assumes that all indicators are equally important, and a larger variance only indicates higher discrimination ability for different scenarios, not necessarily the importance of the indicator [29]. The entropy weight method, on the other hand, calculates entropy weights based on the dispersion of data for each indicator using information entropy. Afterward, we apply certain corrections to these entropy weights, leading to more objective indicator weights. This method allows for weight adjustments and exhibits adaptability, but it cannot handle strong correlations between indicators; thus, there is a risk of unreasonable weight assignments [30]. The CRITIC method comprehensively assesses the objective weights of indicators based on the comparative intensity of evaluation indicators and the conflict between indicators. It takes into account both the variability in indicator values and the correlation between indicators. Larger numerical values do not necessarily indicate greater importance; instead, the method utilizes the inherent objectivity of the data for scientific evaluation. Comparative intensity is defined as the magnitude of the differences in values between various evaluation schemes for the same indicator, expressed in the form of standard deviation. A larger standard deviation indicates greater fluctuation, implying larger differences in values between schemes, leading to higher weights. Correlation coefficients represent the conflict between indicators. If two indicators exhibit a strong positive correlation, indicating lower conflict, then the weights will be lower. The CRITIC method is used in this paper to give semantic segmentation targets weights. It takes into account the strong correlation between point cloud sets of the same target as well as positional relationships like occlusion and overlap between different targets that affect the registration process.
2.2. Definition of Alternatives and Criteria
In the classic CRITIC method, objects of different categories are defined as alternatives and performance metrics of different aspects of objects are defined as criteria [31]. This paper proposes a novel definition of alternatives and criteria, considering the practical significance of labels in semantic segmentation. The individual segmentation performance of each label influences the overall segmentation performance, and these influences positively correlate. A better local segmentation performance contributes to the improvement in overall segmentation quality. On the other hand, the labels have relative independence, allowing them to serve as different criteria for the same performance metric. Therefore, in the following sections of this paper, different performance metrics in semantic segmentation will be defined as alternatives, and different labels will be defined as criteria.
Based on the format of point cloud data in semantic segmentation, we define each point cloud as a vector,
where x, y, and z are the 3D coordinates of point cloud, R, G, and B are the color information of each point cloud. L represents the label of each point cloud, indicating which class of target it belongs to, and n is the number of all the point clouds in the space.
We can divide the labels of point clouds used in this paper into the following categories based on the Stanford Large-Scale 3D Indoor Spaces Dataset (S3DIS) classification [32], as shown in Table 1.
Table 1.
The labels of point clouds in 3D indoor spaces.
All the labels refer to common furniture found in indoor rooms, with the exception of the last one, “clutter”, which is added to categorize point clouds that cannot be reliably classified into a specific class.
We assume three performance metrics as alternatives for the weighting strategy, which include the importance (IM) of labels, the intersection-over-union (IoU) of labels, and the Class-Pixel-Accuracy (CPA) of labels [33,34]. We subjectively assign and quantitatively express the importance of labels in the following ways, as shown in Table 2:
Table 2.
The importance of labels in 3D indoor spaces.
We set the maximum score of importance at 1. We assign a lower importance to objects such as ceilings, floors, and walls that serve as backgrounds. We assign a higher importance to furniture like tables, sofas, and chairs, which are numerous and highly utilized. Other types of furniture, with relatively infrequent use, fall between the two in terms of importance. We set the importance of clutter objects to only 0.1 in order to exclude them from the radar detection range.
We define the IoU and CPA based on a confusion matrix, a specific matrix that visualizes algorithm performance, where each column represents predicted values, and each row represents the actual categories [35]. In the semantic segmentation results of point clouds, we evaluate the segmentation performance for each class using a binary confusion matrix.
2.3. Steps of Calculation
A decision matrix is defined as follows:
The variables n and m represent the quantity of alternatives and evaluation criteria, respectively. Mij is the value of the jth criterion for the ith alternative, 1 ≤ i ≤ n, 1 ≤ j ≤ m. We specify n as 3 and m as 13 for our 3D indoor point cloud semantic segmentation task.
Because each criterion has different dimensions, normalizing the elements in the decision matrix is necessary to unify the units. This paper’s criteria anticipate higher values, leading to the adoption of a forward normalization approach:
where = min(M1j, M2j, …, Mnj), = max(M1j, M2j, …, Mnj), and Dij is the element Mij of the decision matrix after normalization by dividing its distance from the maximum value by the length of the range.
The Pearson correlation coefficient between two criteria j and k is defined as follows:
where and are mean values of the jth and kth criteria after normalization by Equation (5):
The standard deviation of each criterion is defined:
where σ is the standard deviation, which serves to contrast the intensity among each criterion of the same alternative.
The measure of conflict among each criterion is defined:
where pj is the measure of conflict between the jth criterion and the others, which indicates the correlation among the criteria. The more positive the correlation is, the smaller the value of the inconsistency will be.
The amount of information of each criterion is defined:
where Qj is the amount of information of the jth criterion, which equals the product of standard deviation and measure of conflict. The greater Qj is, the more information transmitted by the corresponding criterion, and the relatively higher importance it will have.
Finally, the weights of the criteria are defined as follows:
where ωj indicates the weight of the jth criterion and will be applied in the subsequent ICP registration process.
2.4. Improvement of Steps
The criteria for labels in the semantic segmentation application background do not strictly adhere to a linear correlation. For instance, there is no inherent positive or negative correlation between the importance of a particular label and its CPA. The classical CRITIC method, unfortunately, fails to adequately consider this kind of fuzzy nonlinearity [36]. Therefore, we make some improvements to CRITIC based on the methodology proposed by Sharkasi and Rezakhah [37]. In the normalization procedure, we include fuzzy set theory and Hamming distance as similarity measures. Additionally, we use the distance correlation instead of the Pearson correlation to describe both the linear and nonlinear relationships between the criteria.
The following procedures allow for improvements: First, the elements of decision matrix D are converted into percentages.
Then, the fuzzy form of elements of decision matrix D is defined as follows:
where Δd is a very small positive number for all i and j values: 0 < D′ij + Δd < 1 and 0 < D′ij − Δd < 1. The boundaries of fuzzy RP points are defined as:
where Lj is the lower bound of the fuzzy RP points and Hj is the upper bound of the fuzzy RP points. The normalization procedure can be described as:
where D′ij is the element after normalization, which belongs to fuzzy set [D′ijL,D’ijH] and D’jL− = min(D’1jL, D’2jL, …, D’njL), D’jH+ = max(D’1jH, D’2jH, …, D’njH).
The distance correlation is defined as:
where and are mean values of the jth and kth criteria after normalization by Equation (16), the numerator refers to the covariance between the jth and kth criteria, cov(j,k), and the denominator refers to the square root of the product of the variances of the two criteria, var(j) and var(k).
Finally, Equation (14) is used for normalization instead of Equation (3), and Equation (15) is used for the distance correlation coefficient ρjk instead of the Pearson correlation coefficient rjk from Equation (6). In Equation (10), rjk is replaced with ρjk to calculate the measure of conflict.
3. The ICP Algorithm with Weighting Strategy
3.1. Selection of Error Metric
In the ICP algorithm, an objective function is defined to minimize the measurement error. Generally, there are two metrics for error measurement: point-to-point and point-to-plane.
Equation (16) describes the point-to-point metric, which simply finds the minimum distance between the target point and the corresponding point on the source surface, where R is the rotational matrix, pi is the source point cloud, tk is the translation matrix, and qi is the target point cloud. Equation (17) shows the point-to-plane metric. Its goal is to find the shortest path between the target point and the tangent plane of the source surface’s corresponding point, where ni is the vector that goes through the tangent plane of the source surface at pi.
As shown in Figure 1b, pi’ is a point on the destination surface and pi is the corresponding point on the source surface. The vector ei is the normal vector to the tangent plane of the source surface at pi, which takes the distance from pi’ to the plane tangent to pi as the point-to-plane error metric. The objective function is to find a suitable rigid transformation that satisfies the minimum sum of all these distances.
Figure 1.
Error metrics: (a) point-to-point; (b) point-to-plane.
3.2. Derivation of Solution
The rigid transformation process of a point clouds is defined as:
where pi is the ith point in the source point cloud and qi is the corresponding point after rigid transformation. R(αk,βk,γk) is the rotation matrix with rotation angle αk, βk, and γk, and tk is the corresponding translation value. k refers to the iterations of the ICP algorithm.
Based on Equation (18), the objective function can be written as:
Considering that ni, pi, tk+1, pi’ ∈ R3, and that R(α,β,γ) is a 3 × 3 matrix, the objective function can be denoted as:
Then, the weight coefficient is introduced into Equation (18):
where ωi is the weight coefficient of the ith point whose value is calculated according to the weighting strategy in Section 3.
The traditional method for solving this nonlinear objective function is to linearize it, then use the least squares method to obtain a linearly approximate solution. These methods often have trouble obtaining exact closed-form solutions because of the nonlinearity introduced by the reference plane and the rigid transformation operator. This makes convergence times slower when working with large point cloud datasets. This paper proposes an exact closed-form solution to improve computational efficiency and enhance registration accuracy, by reducing the objective function into a matrix form with constraints and using Lagrange’s multipliers.
In weighted PP-ICP, the rigid transformation is decomposed into many small transformations, each producing a minimal rotation angle along the rotation axis, called θ, which theoretically should be an infinitesimal value that satisfies:
For each small transformation, the rotation angles αk, βk, and γk have small values. Therefore, the rotation matrix R(αk,βk,γk) can be simplified based on the approximation rule proposed in [8]:
Then, the rotation matrix R(αk,βk,γk) can be simplified to
A six-dimensional vector is defined
as the solution of the objective function. Given the ith point in the source point cloud
an auxiliary matrix is defined
Then, Equation (21) can be written as
by defining
Ignoring constant terms, Equation (29) can be expanded as
by defining
Finally, the objective function can be written as
where the constraint is the approximate matrix form of α2 + β2 + γ2 ≈ 0.
To solve the nonlinear minimization problem, Lagrange’s multipliers are used for derivation. The Lagrange function is defined
The necessary condition for optimization is derived as
which is equivalent to
Equation (37) is substituted into the constraint of Equation (34) to obtain
where λ is the only unknown parameter. According to [38], we can find the solutions in closed form for Equation (38), a sixth-order polynomial. Finally, Equation (37) yields x.
In conclusion, we can summarize the weighted PP-ICP process in this paper as follows: Firstly, PointNet semantically segments the input point cloud data, generating labels for different types of items along with corresponding parameters: importance, IoU, and CPA. Next, we assign weights to these category labels using an objective weighting method, which employs an improved CRITIC as the weighting strategy to calculate the corresponding weight values. Finally, we use the calculated weight values as the weight parameters for the point-to-plane ICP, registering the input point cloud effectively. Figure 2 illustrates the algorithm’s process of weighted PP-ICP.
Figure 2.
Process of weighted PP-ICP.
4. Experiment and Analysis
4.1. Data Preparation
The experimental datasets are sourced from public datasets, S3DIS [32], which consist of six different indoor spaces from six areas, respectively: conference room for Area_1, hallway for Area_2, office for Area_3, lobby for Area_4, storage for Area_5, and open space for Area_6. PointNet infers each label’s IoU and CPA, calculates their average values from the six areas, and summarizes them along with the label’s IM in Table 3.
Table 3.
The average values of alternatives and criteria for six areas.
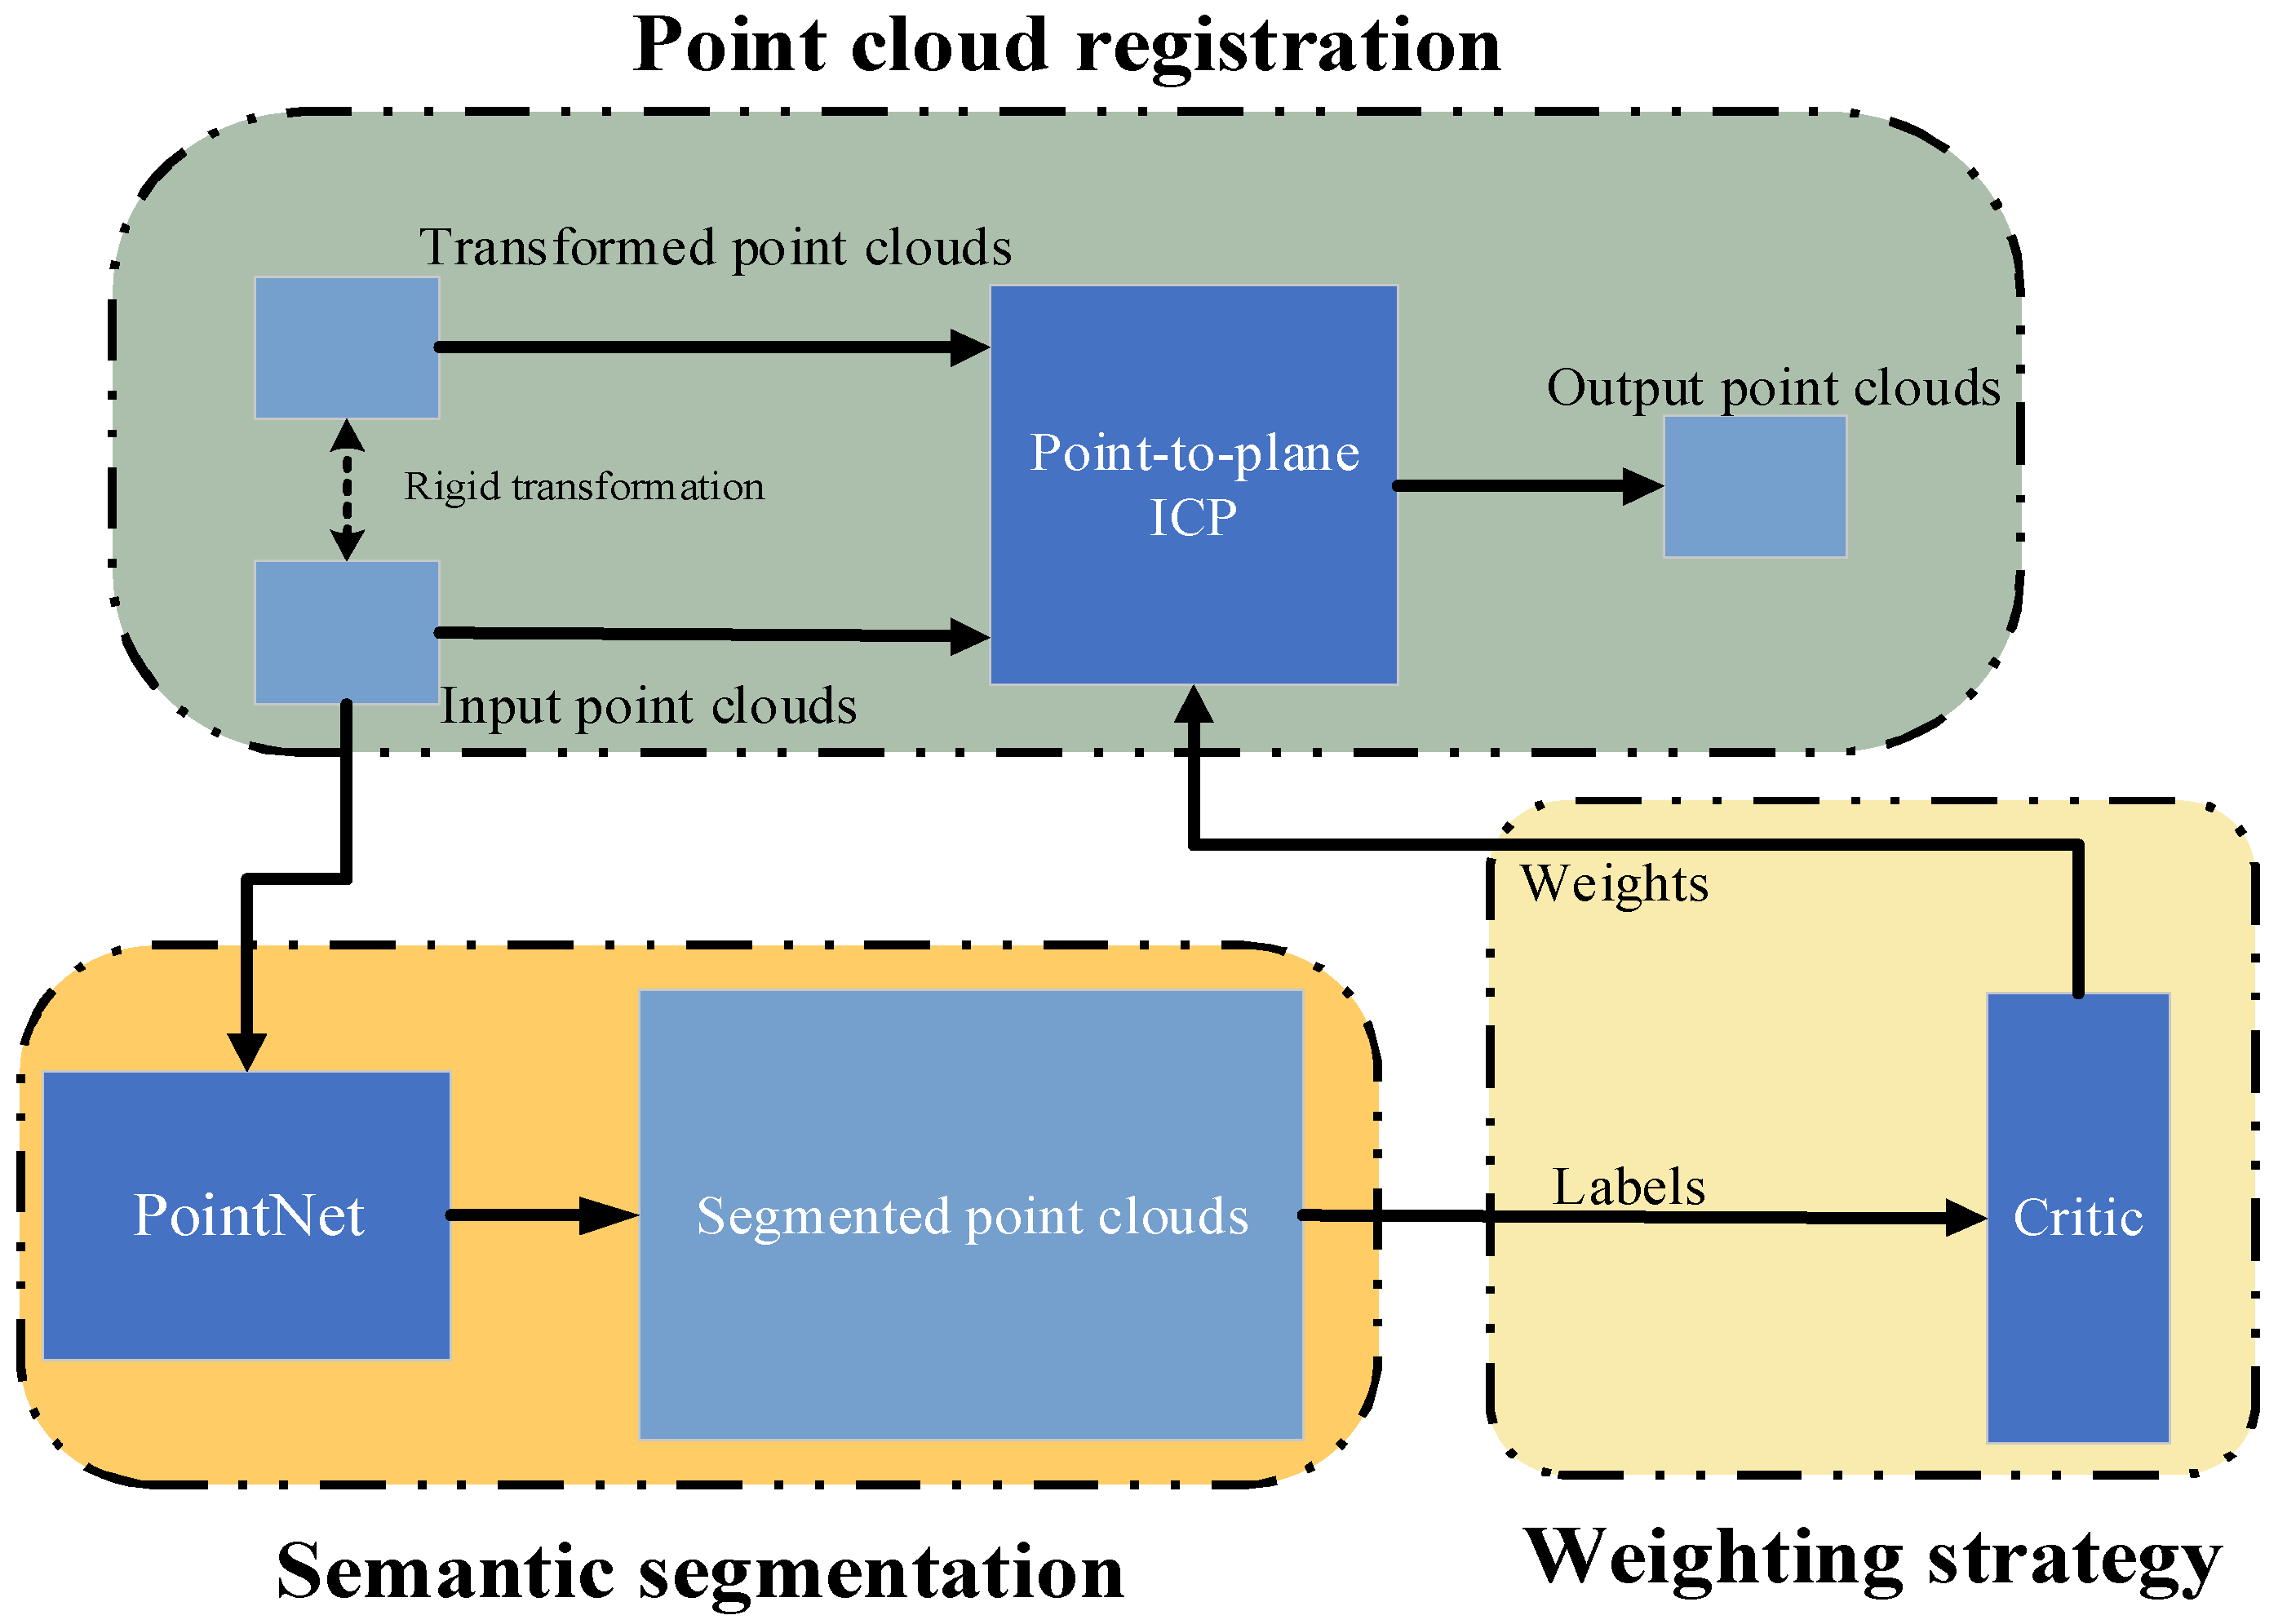
4.2. Weighting Strategy Steps
Based on Table 3, the decision matrix can be described as
Equations (11) and (12) are applied to transform the decision matrix into fuzzy form, as shown in Table 4.
Table 4.
Decision matrix in fuzzy form.
The small positive number Δd in Equation (12) is set to be 0.005.
The boundaries of each criterion and corresponding fuzzy RP points are calculated according to Equation (13), and the results are shown in Table 5.
Table 5.
Boundaries of each criterion and corresponding fuzzy RP points.
The decision matrix is normalized according to Equation (14), and the results are shown in Table 6.
Table 6.
Normalized decision matrix.
The standard variances of criteria are calculated according to Equation (7), and the results are shown as Table 7.
Table 7.
Standard variances of criteria.
The distance correlations between different pairs of criteria are calculated according to Equation (15), and the results are shown in Table 8.
Table 8.
Distance correlations between different pairs of criteria.
The amounts of information and weights of criteria are calculated according to Equations (8)–(10) and corresponding ranks are assigned to the criteria based on the weights. The results are shown in Table 9.
Table 9.
Information amounts, weights, and ranks of criteria.
Table 9 indicates that among all the labels, table, chair, and wall hold the top three rankings in terms of weights, which aligns well with the practical requirements of point cloud registration in 3D indoor spaces. In the Stanford Large-Scale 3D Indoor Spaces Dataset, chairs, walls, and tables are indispensable objects that occupy the central positions in the indoor space and the majority of the spatial volume. Improving the accuracy of point cloud registration for these objects will correspondingly enhance the registration accuracy for the entire 3D indoor space, as registration transforms the entire indoor space into a rigid structure. On the other hand, the weight assigned to clutter is minimized to a value close to zero, effectively minimizing the negative impact of noise and incorrectly matched points that will reduce registration accuracy.
4.3. Point Cloud Registration Experiments
We use the entire S3DIS dataset in the experiments, from Area_1 to Area_6 [32]. When the S3DIS datasets are used as a whole, all the test data are the averaged results of the six indoor spaces in the datasets, as shown in 
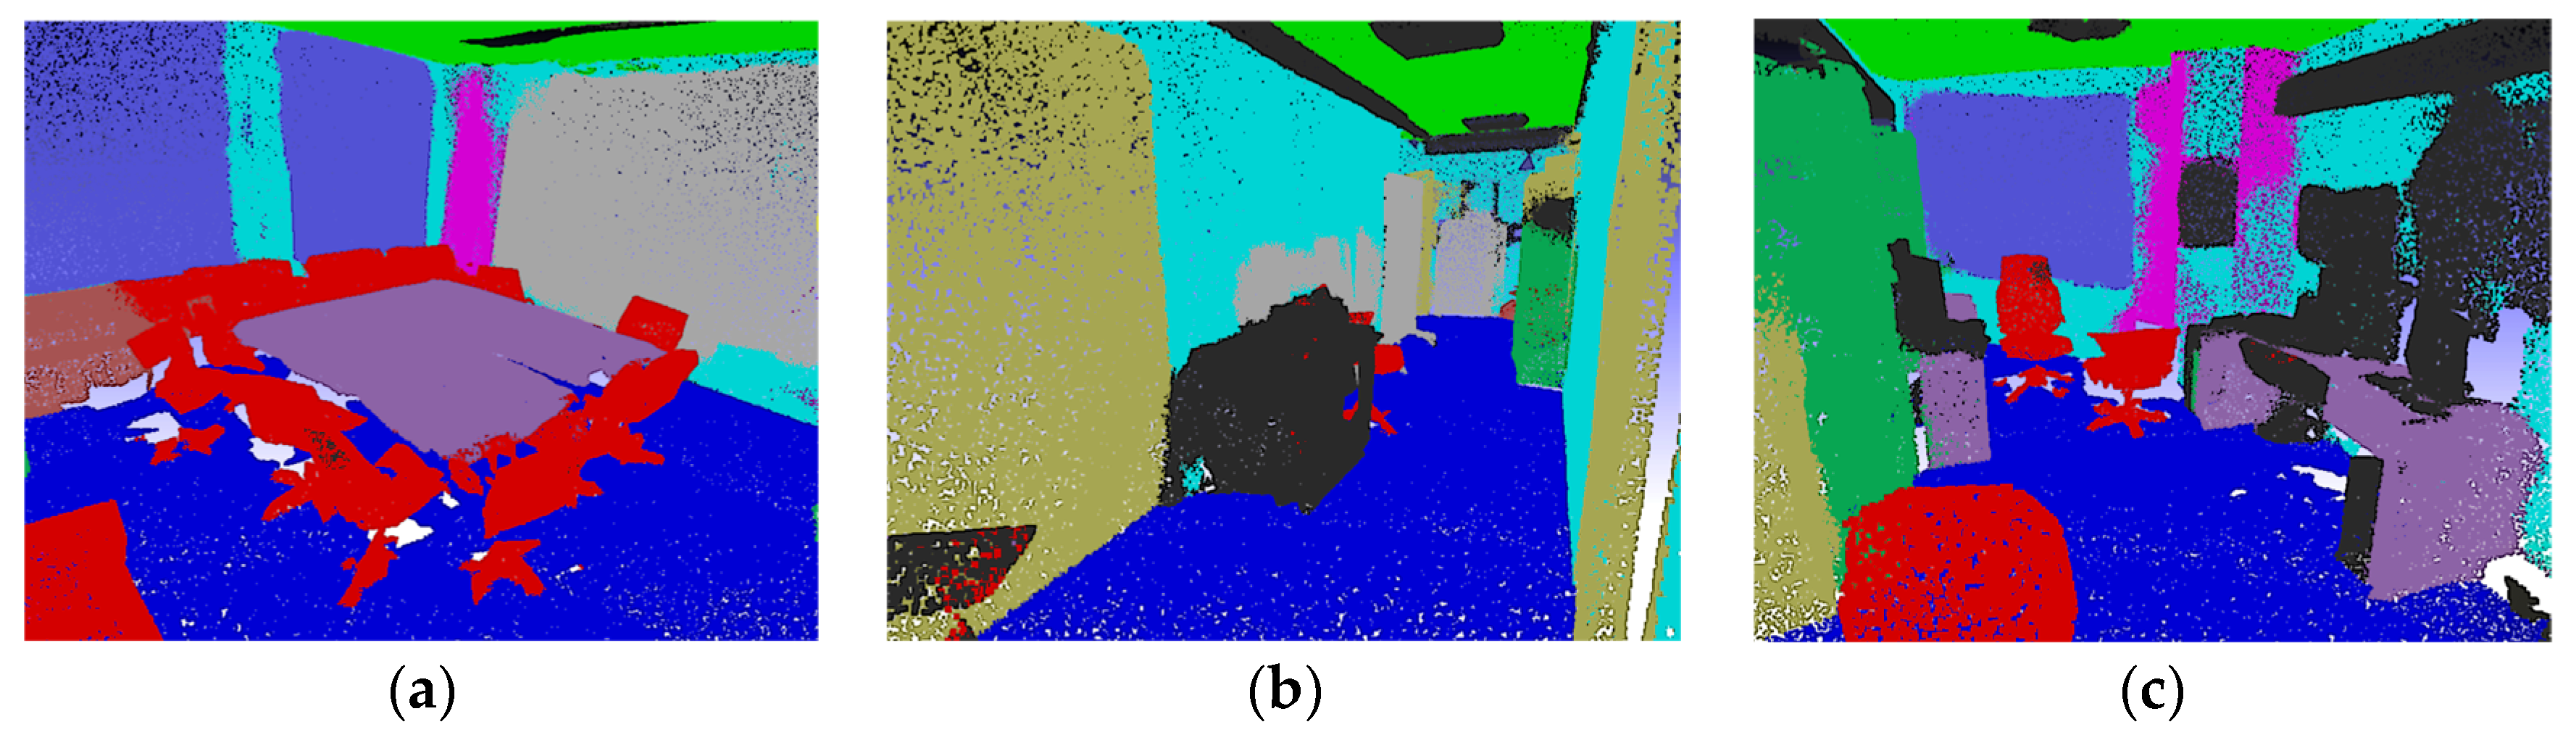
Figure 3. PointNet is used for semantic segmentation of the point cloud.

Figure 3.
Point cloud semantic segmentation of S3DIS: (a) Area_1 (conference room); (b) Area_2 (hallway); (c) Area_3 (office); (d) Area_4 (lobby); (e) Area_5 (storage); (f) Area_6 (open space).
We divide the registration experiment into two parts. In the first part, we conduct experiments with weighted PP-ICP under different parameters, using the corresponding experimental data to determine the parameters that enable the algorithm to perform optimally. We also conduct other experiments to study the influence of semantic segmentation quality on the registration results. The second part is a comparison of weighted PP-ICP with three other registration algorithms: ICP, the NDT, and PointNetLK. We assess the advantages and disadvantages of weighted PP-ICP relative to the other algorithms by comparing the algorithms in terms of root mean square (RMS) error, runtime, and hardware resource utilization across six test scenarios in the datasets, using the method of controlled variables. In these experiments, we conduct both single-axis and multi-axis angle tests on the entire S3DIS dataset. In the single-axis angle test, we rotate the datasets around one axis, keeping the other two axes fixed. The range of rotation angles varies from 15° to 120°, in steps of 15°. The multi-axis angle tests maintain a range of angles between 15° and 120°, with a step of 15° in between. For each type of rigid transformation, we rotate all three axes clockwise by the same angle value, for example, [30°, 30°, 30°] and [60°, 60°, 60°].
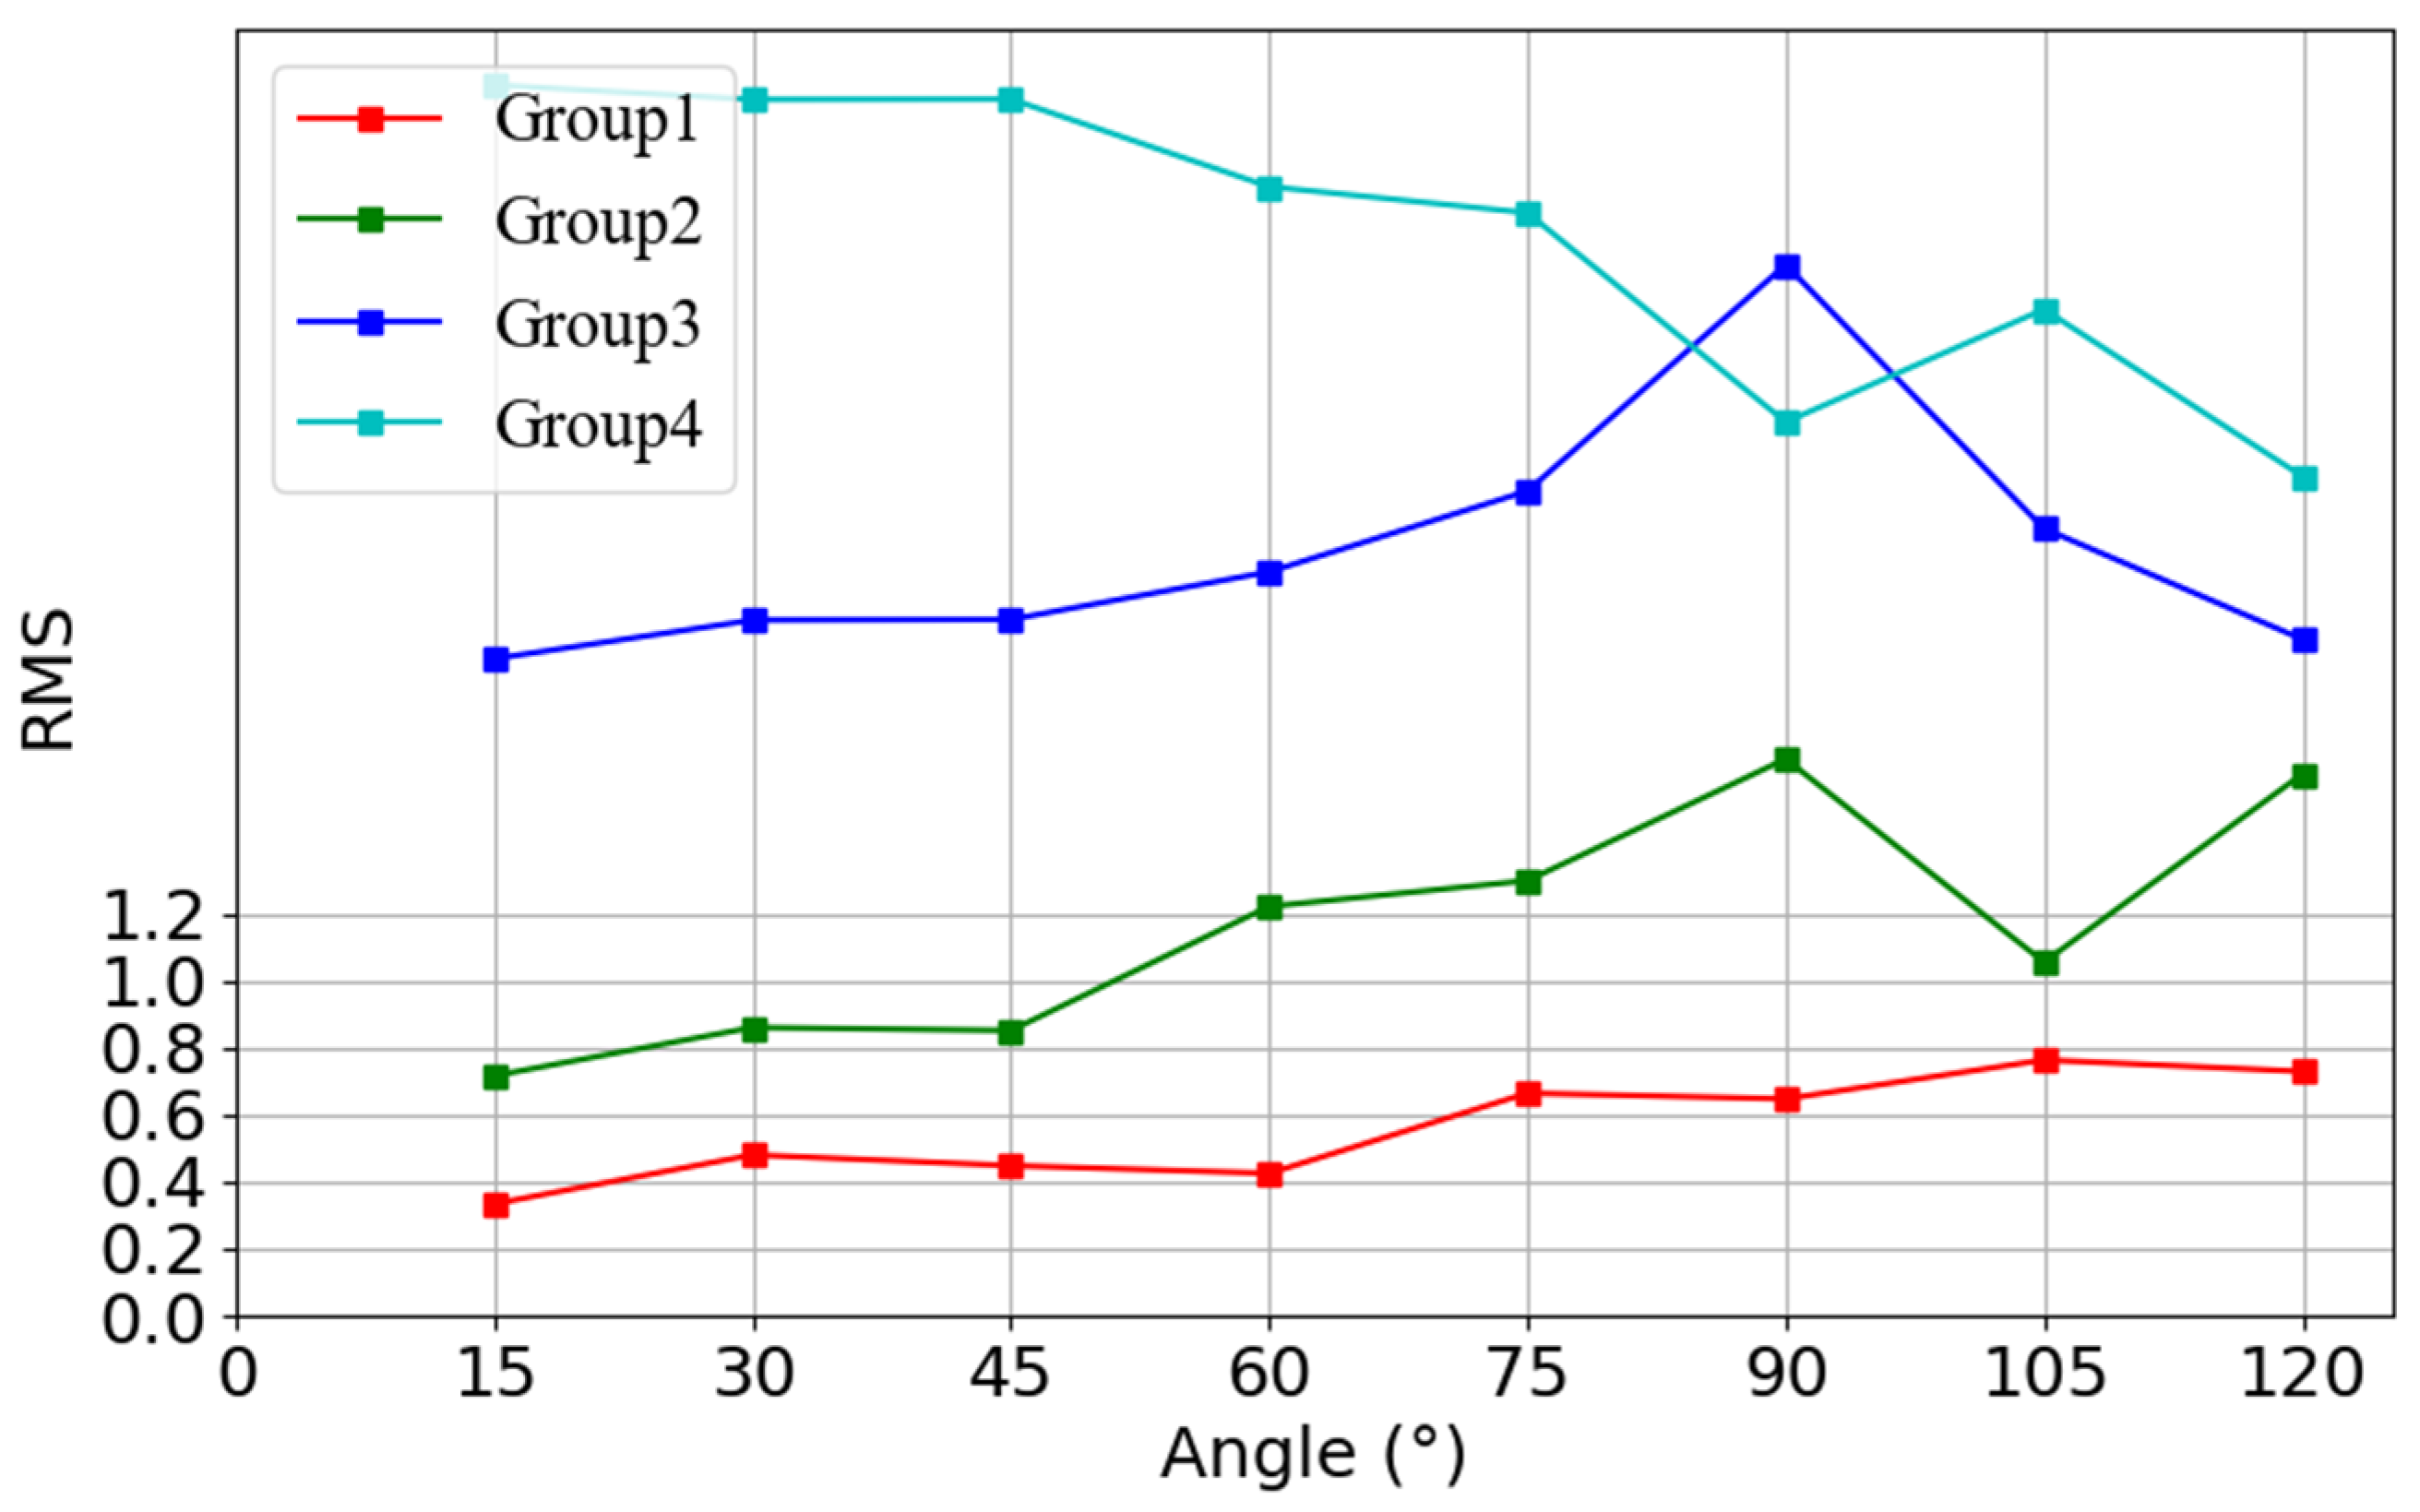
Section 3 uses subjective assignment to determine each category’s importance in the semantic segmentation results. The following tests will verify the validity of these assignments. According to Table 2, we reduce the importance of all labels above 0.5 and increase those below 0.5, resulting in a change magnitude of 0.2 for each group, which decreases to 0.1 when starting from 0.2. This process generates four groups of data regarding label importance, as shown in Table 10.
Table 10.
Groups of importance of labels in 3D indoor spaces.
We calculate and integrate the corresponding weight values into the proposed registration algorithm based on these four sets of data. We perform validation using multi-axis angle tests, as illustrated in Figure 4 and Table 11.
Figure 4.
RMS of weighted PP-ICP for different groups of label importance.
Table 11.
RMS of weighted PP-ICP for different groups of label importance.
Figure 4 and Table 11 demonstrate that group 1 consistently has the smallest RMS across all rotational angles. The maximum value in group 3, 3.134, is 3.11 times higher than the maximum value in group 1, which is 0.762; the maximum value in group 4, 3.674, exceeds the maximum in group 1 by 3.82 times. These results validate that the subjective assignment of label importance in Section 3 is reasonable.
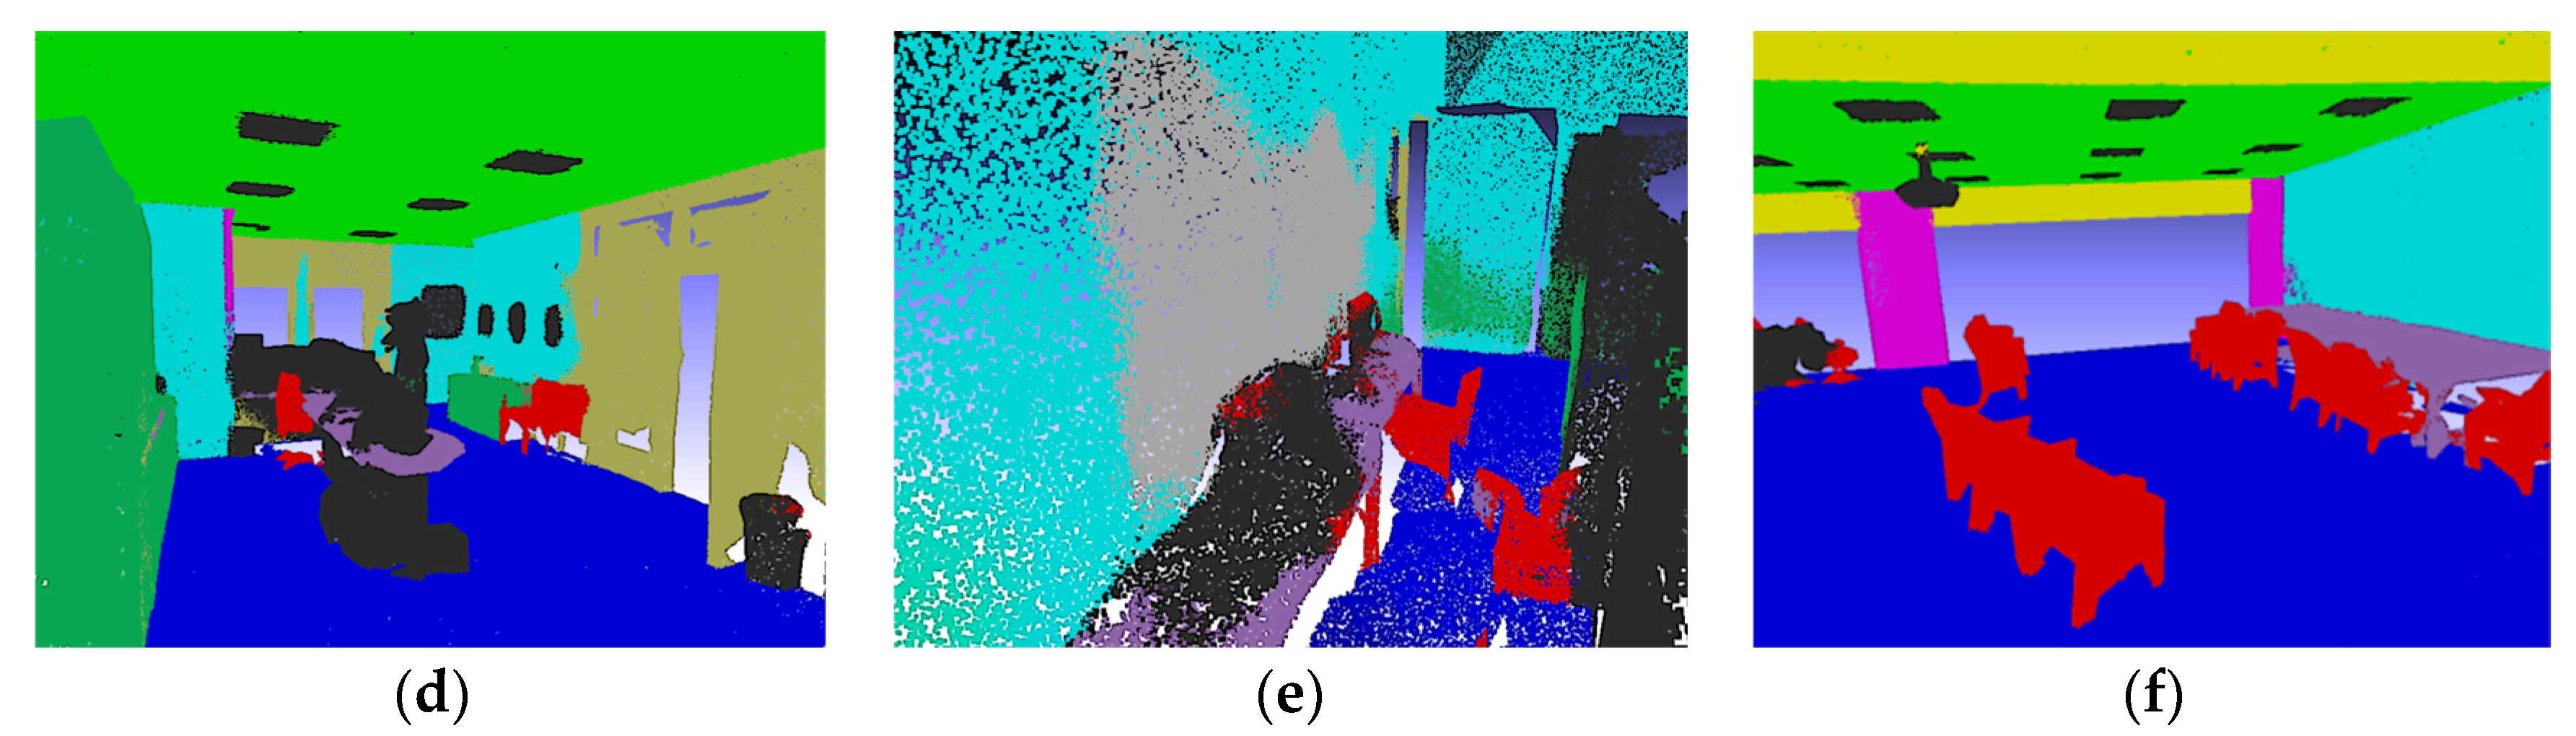
Given that this paper proposes an algorithm based on weights generated from point cloud semantic segmentation results, we expect the quality of segmentation to significantly influence the algorithm’s registration performance. However, we notice differences in the point cloud segmentation results among the six areas of the datasets during the experimental process, prompting us to conduct further tests to investigate the impact of semantic segmentation on the registration algorithm in this paper.
PointNet calculates the whole-scene point accuracy for each area in the datasets to assess the quality of semantic segmentation for the entire area. Table 12 displays the whole-scene point accuracy values for the six areas.
Table 12.
Whole-scene point accuracy for six areas.
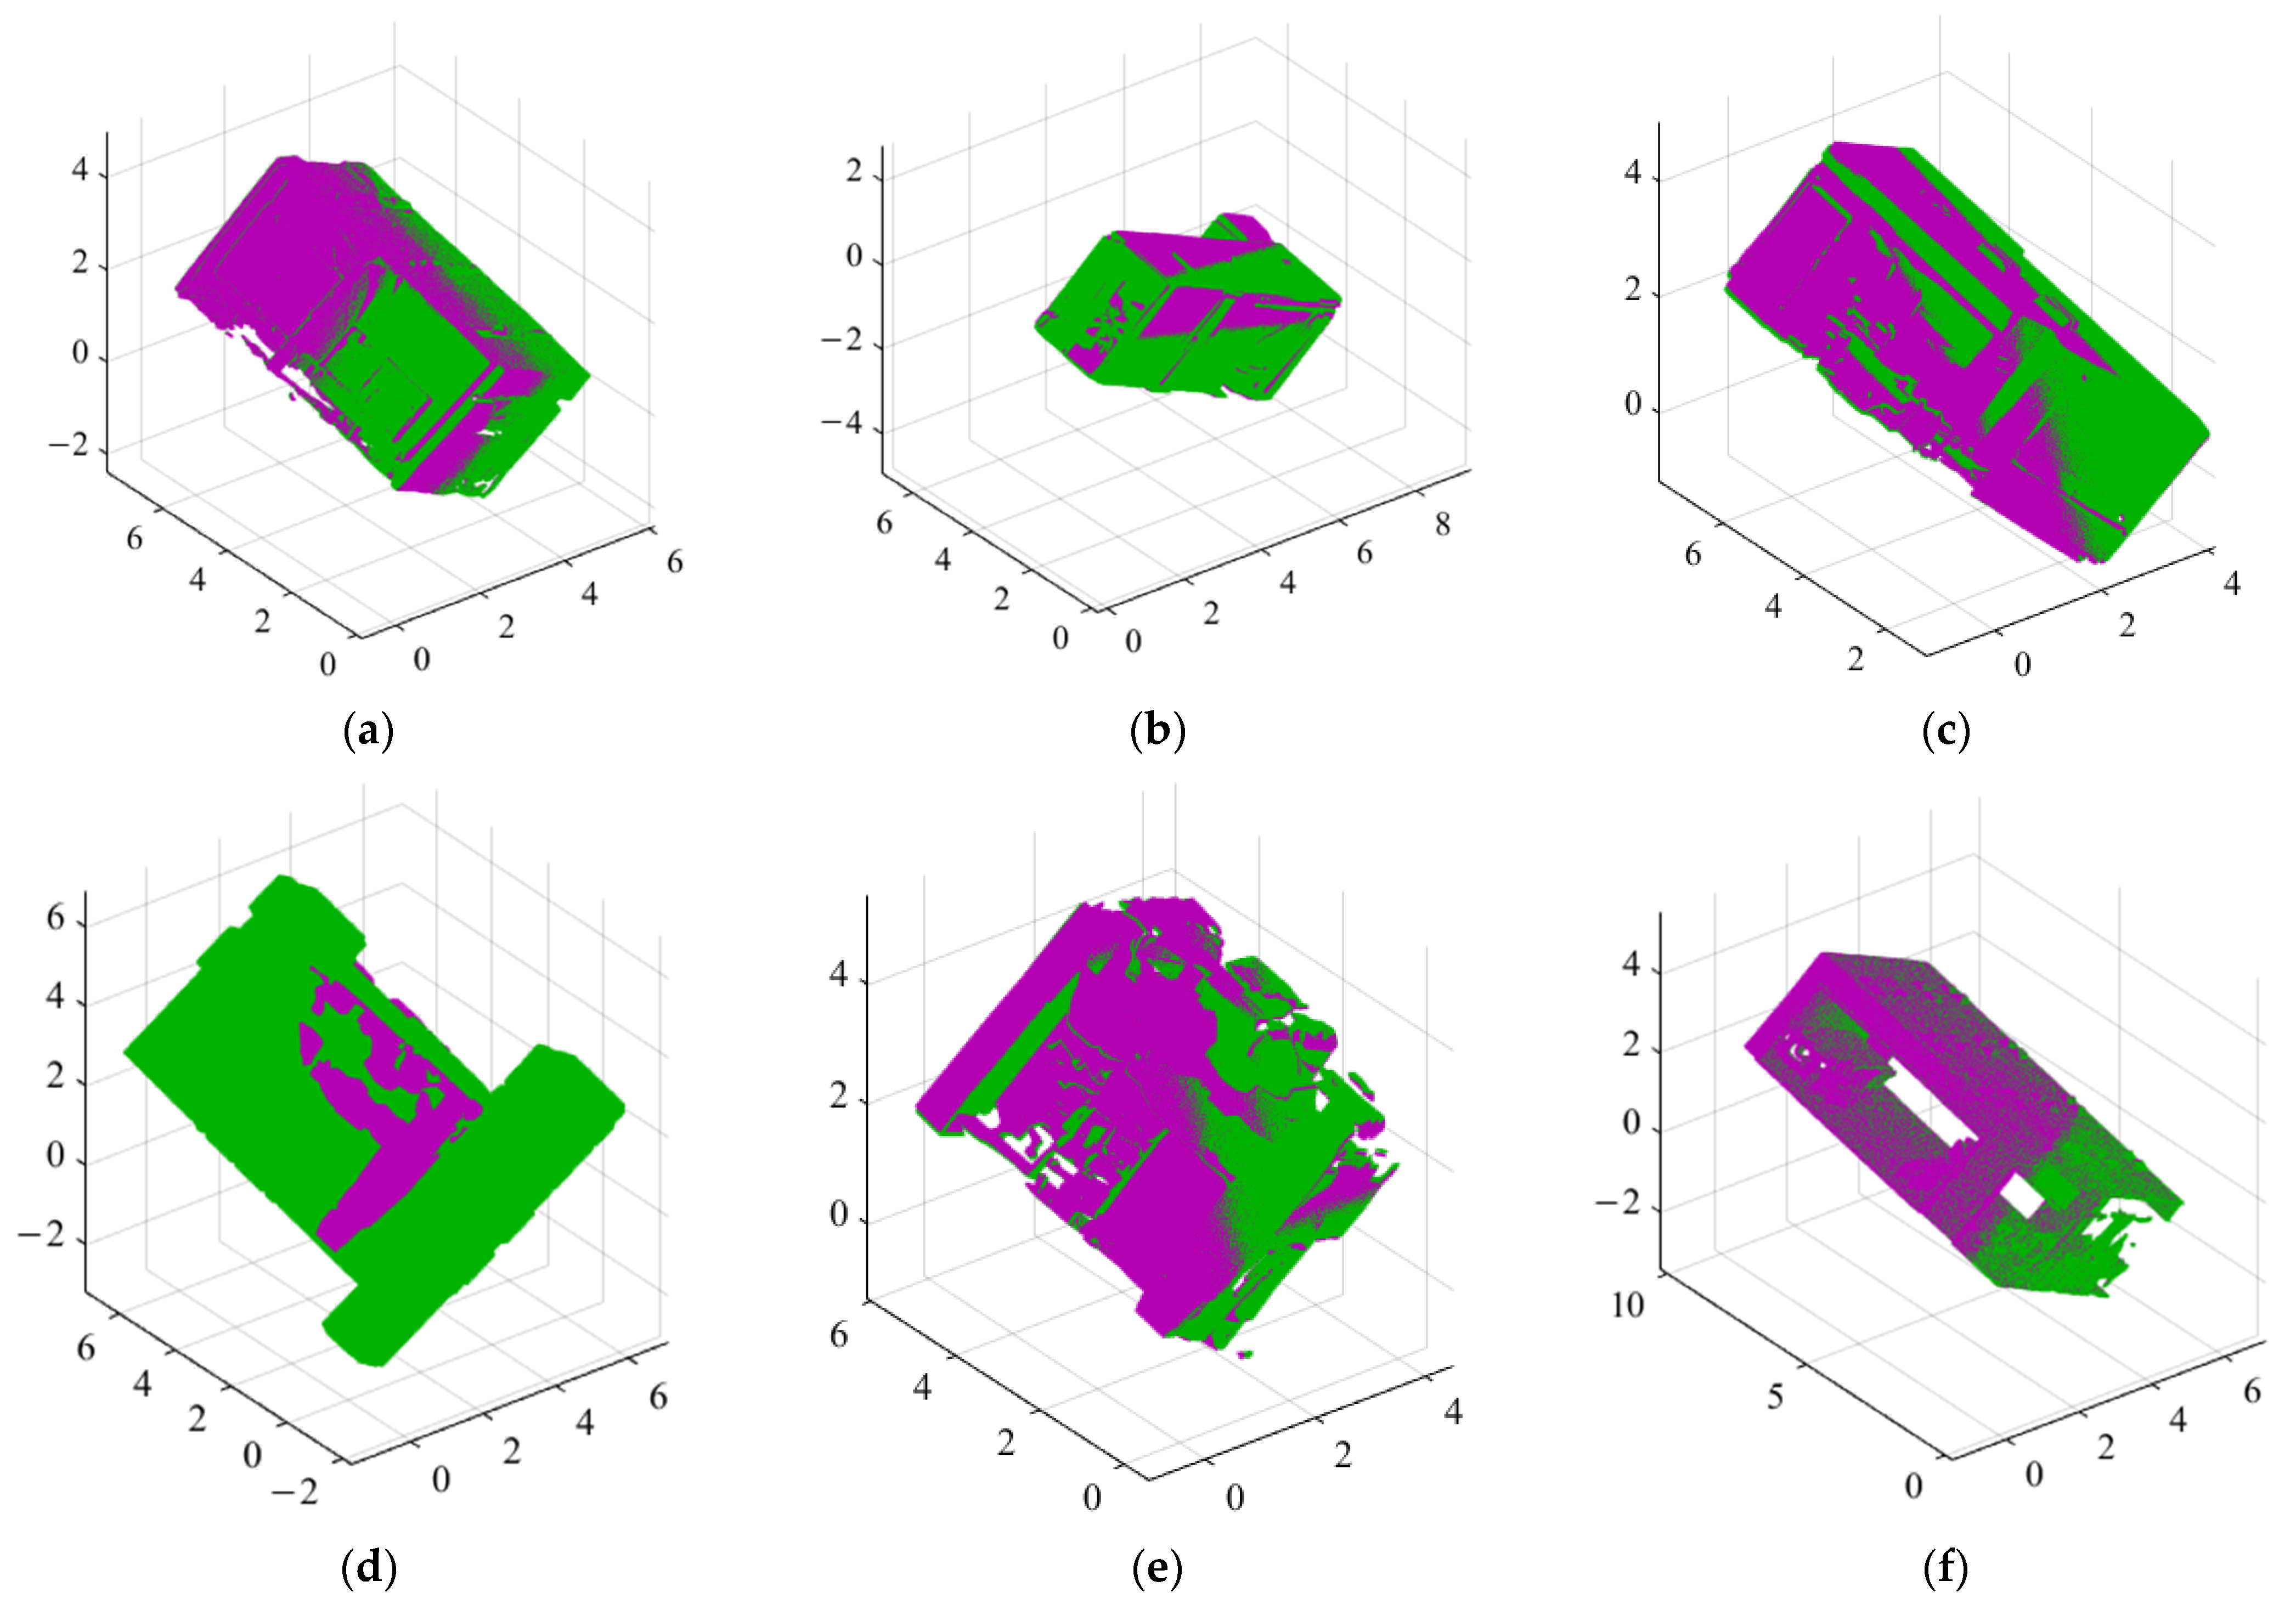
Table 12 shows that Area_6 has the best quality of semantic segmentation, while Area_5 has the worst. Three tests for the six areas are conducted with the rotational angles of the three axes being [30°, 30°, 30°], [60°, 60°, 60°], and [90°, 90°, 90°] respectively. The visualizations of the registration results when the rotational angle is equal to 30° are shown in Figure 5, and the test data are shown in Figure 6 and Table 13.
Figure 5.
Registration results of S3DIS datasets: (a) Area_1; (b) Area_2; (c) Area_3; (d) Area_4; (e) Area_5; (f) Area_6. Rotational angle = [30°, 30°, 30°].
Figure 6.
RMS for six areas.
Table 13.
RMS for six areas.
Figure 6 and Table 13 reveal that Area_6 has the smallest RMS under all three rotation angles, whereas Area_5 has the largest. This corresponds with the results of the PointNet semantic segmentation, where the whole-scene point accuracy is the highest in Area_6 and the lowest in Area_5. Similarly, the whole-scene point accuracy in Area_2 is higher than in Area_4, and the RMS in Area_2 is also smaller than in Area_4 under all three rotation angles. Based on what we have seen in practice, we can say that the proposed algorithm in this paper has a positive relationship between how well it registers and how well it semantically segments point clouds. Correct classifications in semantic segmentation are the only way to assign the correct weights in the registration algorithm’s weight distribution process, thereby enhancing the algorithm’s accuracy.
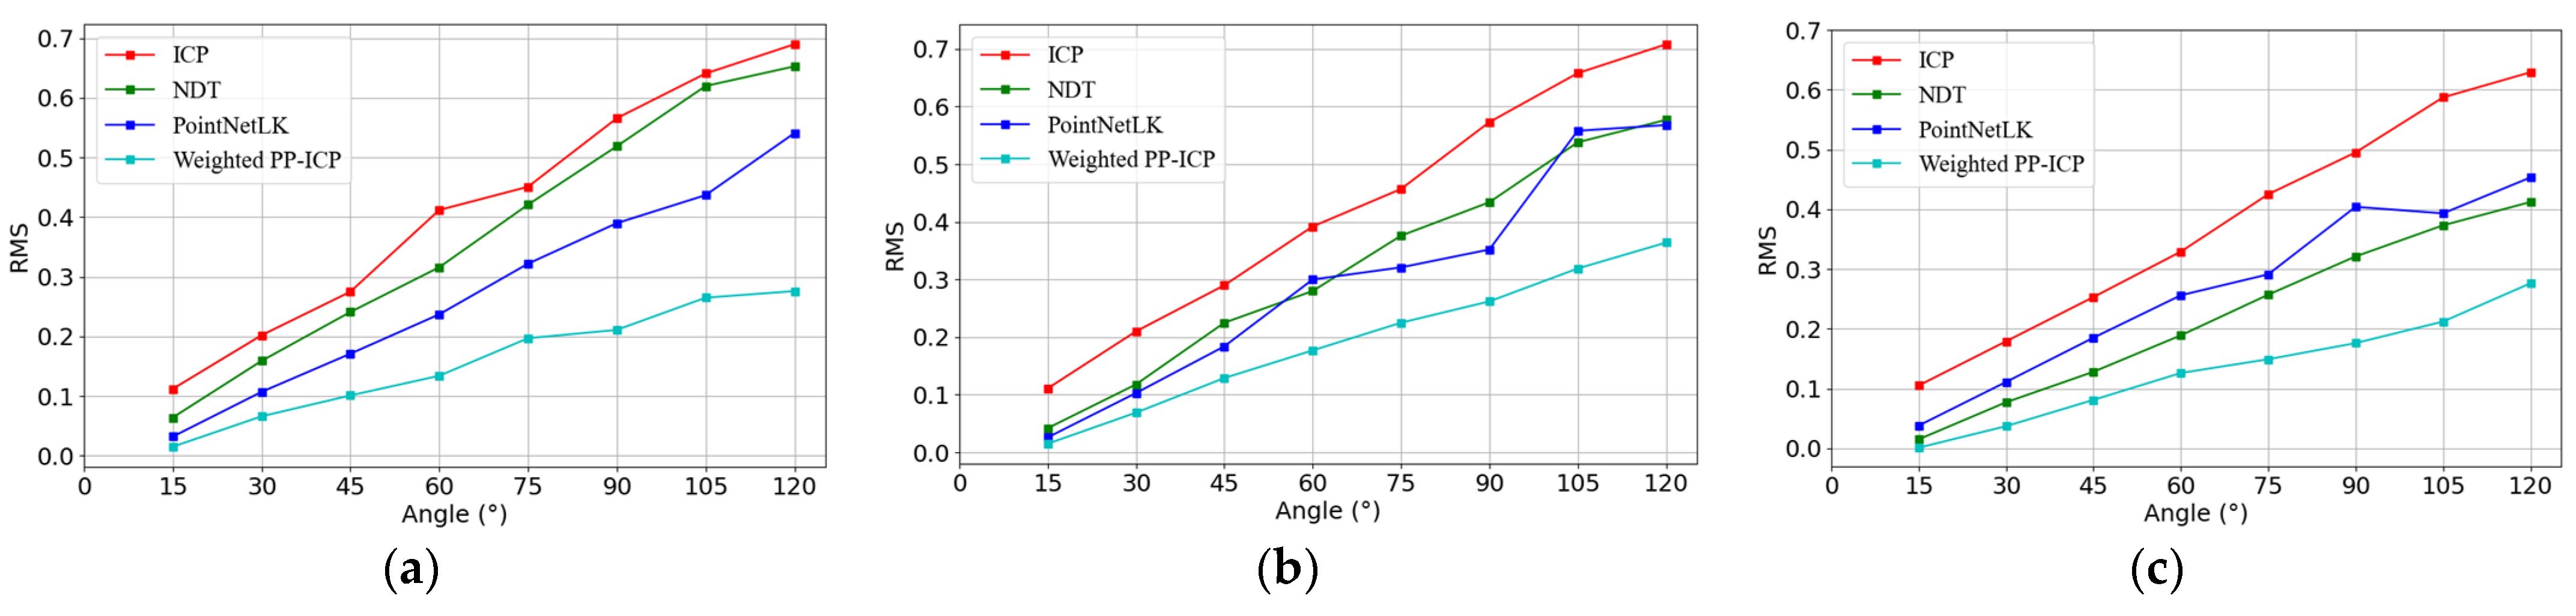
We conduct comparison experiments after determining the importance of labels in semantic segmentation. We set the translation to [0.1, 0.2, 0.15] for all tests. We set the change in angle in the rotational axis for each small rigid transformation in the weighted PP-ICP to 1°. Figure 7 and Table 14 display the root mean square error (RMS).
Figure 7.
RMS of single-axis angle tests: (a) x-axis; (b) y-axis; (c) z-axis.
Table 14.
RMS of single-axis angle tests for the algorithms.
Figure 7 and Table 14 demonstrate that the proposed algorithm in this paper consistently achieves the smallest RMS in all tests, while the original ICP consistently demonstrates the highest RMS. This demonstrates the significant improvement in registration accuracy achieved by the algorithm proposed in this paper. On the other hand, as the rotation angle increases, the RMS of all the algorithms increases, but the weighted PP-ICP always has the smallest increase. This means that the algorithm is very stable when rigid bodies change shape at different rotation angles.
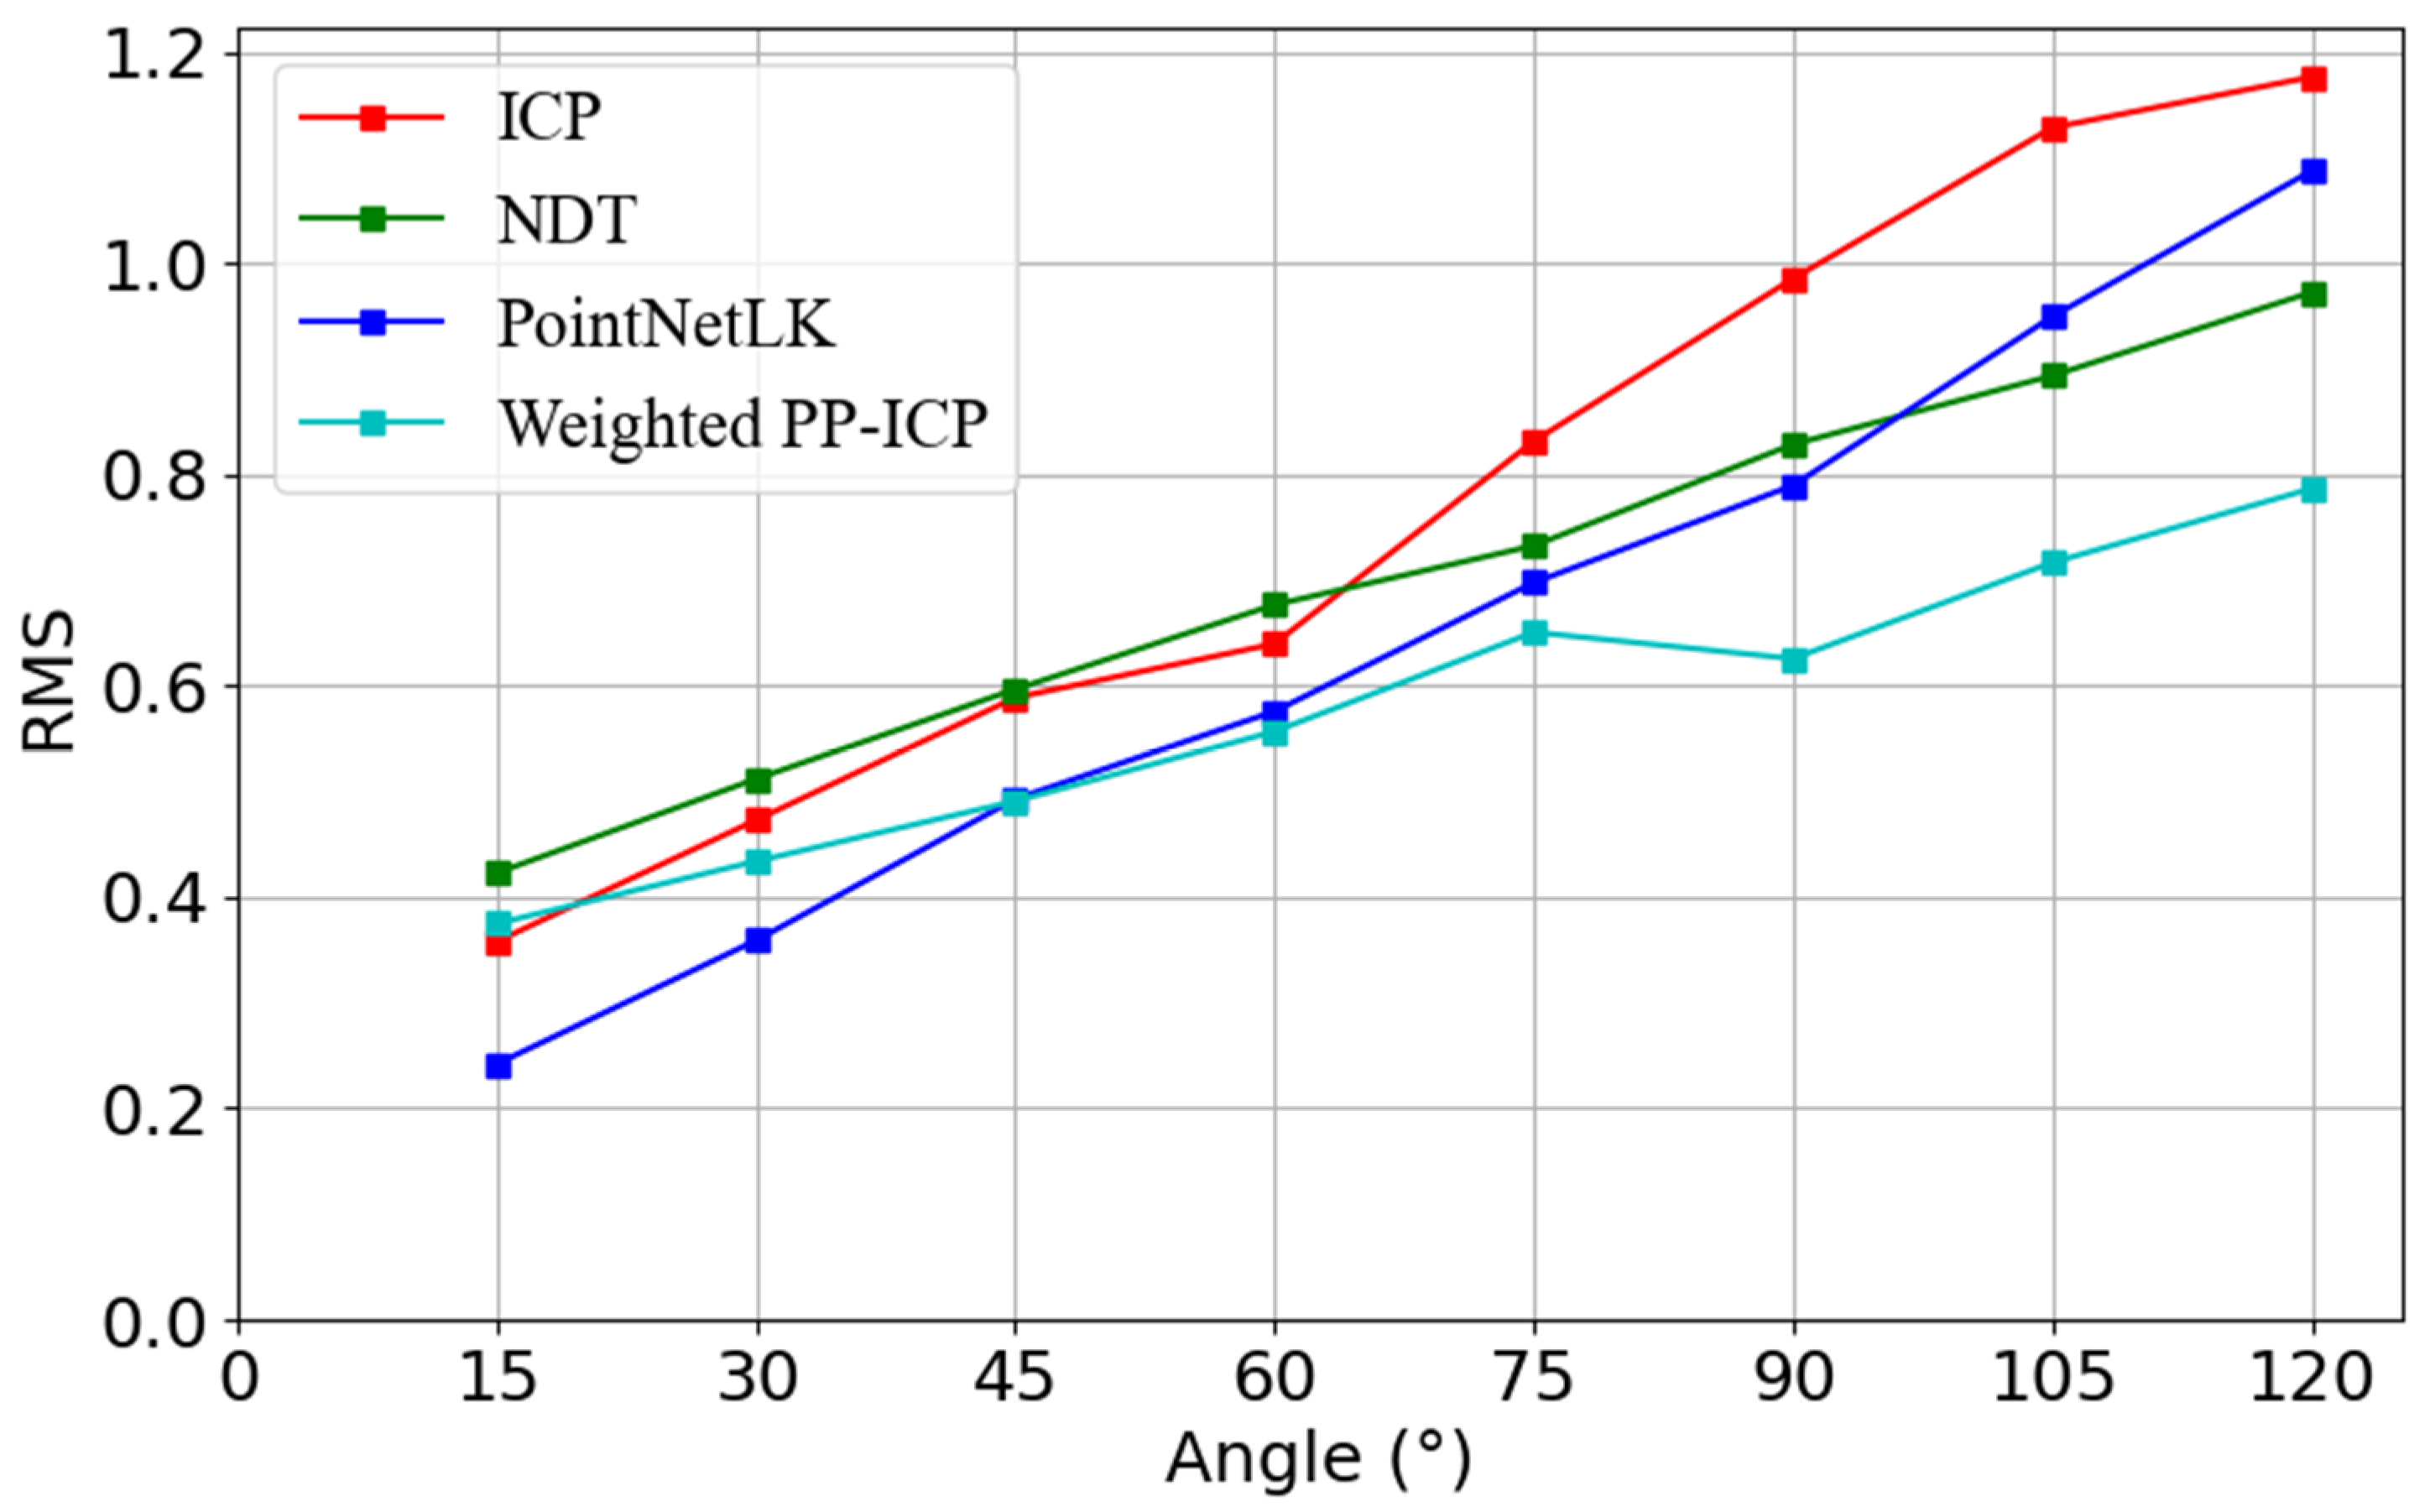
The multi-axis angle tests maintain the angle’s range between 15° and 120°, with a 15° step. For each type of rigid transformation, we rotate all three axes clockwise by the same angle value, such as [30°, 30°, 30°] and [60°, 60°, 60°]. Figure 8 and Table 15 display the tests.
Figure 8.
RMS of multi-axis angle tests.
Table 15.
RMS of multi-axis angle tests for the algorithms.
Figure 8 and Table 15 demonstrate that in the multi-axis angle tests, the weighted PP-ICP consistently exhibits the smallest RMS, with the exception of the cases at 15° and 30°. Similar to the single-axis angle tests, the RMS increases as the rotation angle increases. However, we observe that in the multi-axis angle tests, the RMS of all the algorithms surpasses that of the single-axis angle tests, suggesting an increase in registration errors as the complexity of the rigid-body transformations increases.
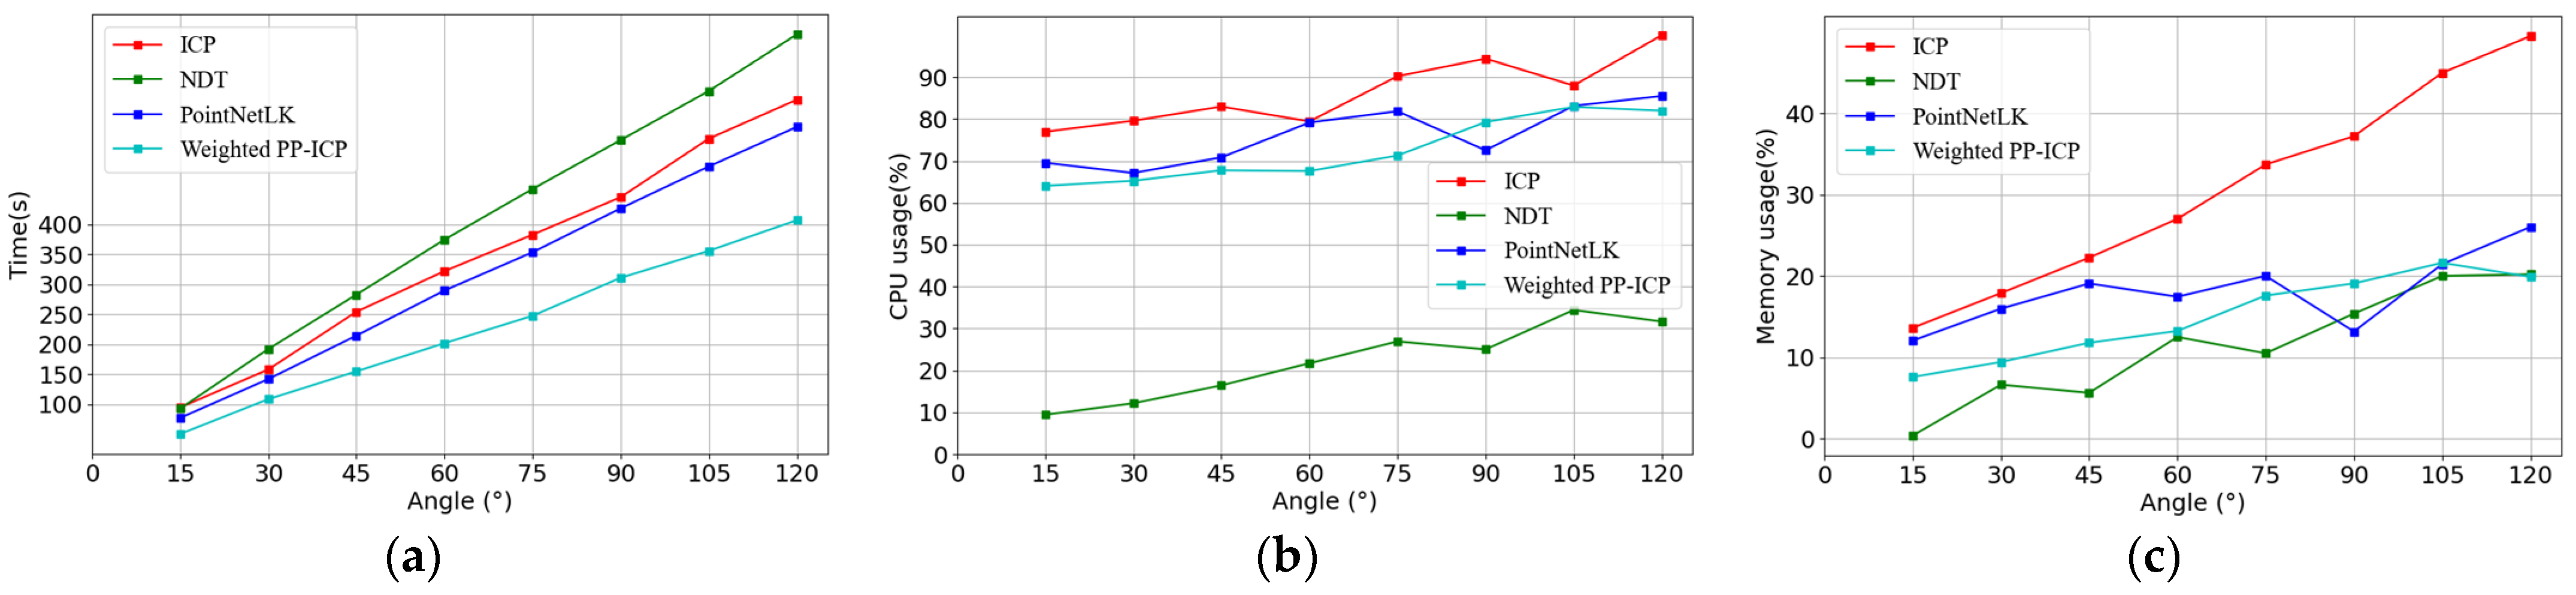
We evaluate the runtime and computation resources used during the multi-axis tests for the four algorithms on a personal computer with a CPU processor (AMD Ryzen 7 4800H) and 16.0 GB of RAM to validate the efficiency. Figure 9 and Table 16 display the results.
Figure 9.
Runtime and computation resource costs during multi-axis tests: (a) runtime; (b) CPU usage; (c) memory usage.
Table 16.
Runtime and computation resource costs during multi-axis tests.
Figure 9 and Table 16 conclude that the weighted PP-ICP algorithm in this paper exhibits significantly shorter runtimes than the original ICP, NDT, and PointNetLK. However, in comparison to the NDT, the proposed algorithm does not perform better in terms of CPU or memory usage. The main reason for this is that the NDT breaks up the original point cloud into a voxel grid to obtain Gaussian distributions through feature extraction. It then changes these distributions to the reference point cloud’s coordinate system [4]. Compared to ICP, which directly matches the original point cloud, the NDT significantly reduces computational complexity, thereby enhancing the hardware efficiency of the algorithm.
5. Discussion
We decompose a complete rigid-body transformation into a superposition of many tiny rigid-body transformations. For instance, a 120-degree rigid-body transformation is essentially a combination of numerous short-time, small-angle rigid-body transformations. By breaking down complex transformations into smaller, simpler components, we can better understand and analyze the overall motion of the rigid body. This decomposition method allows us to study the effects of each individual transformation and how they contribute to the overall movement of the object. By studying these small-angle transformations, we can gain insights into the mechanics and dynamics of rigid-body motion. Within each of these tiny rigid-body transformations, the angle is extremely small, enabling the application of approximation theory. This decomposition allows us to break down complex transformations into simpler, more manageable steps that can be analyzed and understood more easily. By applying approximation theory to each small angle transformation, we can accurately model and predict the behavior of the overall rigid-body transformation. This approach is particularly useful in robotics, computer graphics, and other fields where precise control and understanding of rigid-body movements are crucial. This small angle allows the algorithm to quickly iterate to the optimal solution. During the subsequent experimental validation phase, we discover that the algorithm’s running time increases with the size of the transformation angle, as it superimposes more tiny, rigid-body transformations. However, this decomposition fully utilizes the benefits of the new method for solving the iterative problem suggested in Section 3. Each small transformation exhibits high accuracy, which enhances the accuracy of the final superimposed changes. The original paper provides a theoretical derivation, and we set the amount of angular change in the rotation axis to 1° for each iteration of the algorithm in the subsequent experiments. This incremental approach allows us to achieve precise results with each iteration, ultimately leading to a highly accurate final transformation. By setting the rotation axis change to 1° for each iteration, we are able to control the granularity of the transformations and ensure that the algorithm runs efficiently. This method proves to be highly effective in solving the iterative problem and provides a solid foundation for future experiments and applications.
6. Conclusions
Many millimeter-wave radar applications, including autonomous driving, robotic navigation, and augmented reality, widely use point cloud registration. During the registration process, accuracy and effectiveness are two key factors that will have a direct impact on performance. This paper proposes a novel algorithm for point cloud registration. First, PointNet uses different category labels in the 3D indoor spaces to semantically segment the point cloud for registration. We introduce a statistical weighting strategy that assigns varying weights to the point cloud corresponding to the category labels. Then, during the registration process, we propose a new method to calculate the closed form of ICP iterative optimal solutions in three-dimensional spaces. This method addresses the issue in traditional registration algorithms where the linear approximation of the objective function reduces accuracy. We successfully calculate the closed-form solutions by applying the weights of the point cloud to the objective function solving process. We validate the accuracy and efficiency of the proposed algorithm on point cloud datasets of 3D indoor spaces, and the registration experiments reveal significant improvements in both accuracy and efficiency after incorporating the weighting strategy into the ICP algorithm. The technique may swiftly iterate to the ideal solution by breaking hard transformations into numerous tiny transformations, each with an infinitesimal angle. Furthermore, the approach to finding closed-form solutions presented in Section 4 may significantly improve the registration’s accuracy.
The dataset tests show that the RMS of different types of rigid transformation become much smaller compared to ICP, the NDT, and PointNetLK. On the other hand, compared to the original ICP, the algorithm’s runtime and usage of both CPU and memory improve. Overall, this paper’s proposed weighting-strategy-based point cloud registration algorithm demonstrates improved accuracy and increased efficiency in large-scale 3D indoor spaces.
While the novel algorithm in this paper, based on a weighting strategy, significantly improves the accuracy and efficiency of point cloud registration in 3D indoor spaces, it still falls short in terms of hardware resource utilization when compared to other registration algorithms like the NDT. Future work will focus on further optimizing the ICP iterative process to reduce computation costs, as well as exploring the integration of other more efficient registration algorithms with the proposed weighting strategy.
Author Contributions
Methodology, W.L., H.Z. and S.S.; Software, W.C. and S.S.; Formal analysis, W.L., H.Z. and X.L.; Writing—original draft, W.L.; Writing—review & editing, H.Z., W.C., X.L. and S.S.; Visualization, W.C. All authors have read and agreed to the published version of the manuscript.
Funding
This research was funded by Heilongjiang Province’s Key Research and Development Project: ’open competition mechanism to select the best candidates’, grant number 2023ZXJ03C02; and National Science Foundation of China, grant number 52075117.
Data Availability Statement
The original contributions presented in the study are included in the article, further inquiries can be directed to the corresponding author.
Conflicts of Interest
The authors declare no conflict of interest.
References
- Charles, R.Q.; Su, H.; Kaichun, M.; Guibas, L.J. PointNet: Deep Learning on Point Sets for 3D Classification and Segmentation. In Proceedings of the 2017 IEEE Conference on Computer Vision and Pattern Recognition (CVPR), Honolulu, HI, USA, 21–26 July 2017. [Google Scholar]
- Arun, K.S.; Huang, T.S.; Blostein, S.D. Least-squares fitting of two 3-D point sets. IEEE Trans. Pattern Anal. Mach. Intell. 1987, 5, 698–700. [Google Scholar] [CrossRef] [PubMed]
- Besl, P.J.; McKay, N.D. Method for registration of 3-D shapes. Sens. Fusion IV Control Paradig. Data Struct. 1992, 1611, 586–606. [Google Scholar] [CrossRef]
- Rusinkiewicz, S.; Levoy, M. Efficient variants of the ICP algorithm. In Proceedings of the Third International Conference on 3-D Digital Imaging and Modeling, Quebec City, QC, Canada, 28 May–1 June 2001. [Google Scholar]
- Magnusson, M.; Andreasson, H.; Nuchter, A.; Lilienthal, A.J. Appearance-based loop detection from 3D laser data using the normal distributions transform. In Proceedings of the 2009 IEEE International Conference on Robotics and Automation, Kobe, Japan, 12–17 May 2009. [Google Scholar]
- Aoki, Y.; Goforth, H.; Srivatsan, R.A.; Lucey, S. Pointnetlk: Robust & efficient point cloud registration using pointnet. In Proceedings of the IEEE/CVF Conference on Computer Vision and Pattern Recognition, Long Beach, CA, USA, 15–20 June 2019. [Google Scholar]
- Chang, C.H.; Chou, C.N.; Chang, E.Y. CLKN: Cascaded Lucas-Kanade Networks for Image Alignment. In Proceedings of the 2017 IEEE Conference on Computer Vision and Pattern Recognition (CVPR), Honolulu, HI, USA, 21–26 July 2017. [Google Scholar]
- Low, K.L. Linear Least-Squares Optimization for Point-to-Plane Icp Surface Registration; University of North Carolina: Chapel Hill, NC, USA, 2004. [Google Scholar]
- Serafin, J.; Grisetti, G. NICP: Dense normal based point cloud registration. In Proceedings of the 2015 IEEE/RSJ International Conference on Intelligent Robots and Systems (IROS), Hamburg, Germany, 28 September–2 October 2015. [Google Scholar]
- Yang, J.; Li, H.; Campbell, D.; Jia, Y. Go-ICP: A globally optimal solution to 3D ICP point-set registration. IEEE Trans. Pattern Anal. Mach. Intell. 2015, 38, 2241–2254. [Google Scholar] [CrossRef] [PubMed]
- Deschaud, J.E. IMLS-SLAM: Scan-to-model matching based on 3D data. In Proceedings of the 2018 IEEE International Conference on Robotics and Automation (ICRA), Brisbane, Australia, 21–25 May 2018. [Google Scholar]
- Das, A.; Waslander, S.L. Scan registration with multi-scale k-means normal distributions transform. In Proceedings of the 2012 IEEE/RSJ International Conference on Intelligent Robots and Systems, Vilamoura-Algarve, Portugal, 7–12 October 2012. [Google Scholar]
- Lu, W.; Wan, G.; Zhou, Y.; Fu, X.; Yuan, P.; Song, S. Deepvcp: An end-to-end deep neural network for point cloud registration. In Proceedings of the 2019 IEEE/CVF International Conference on Computer Vision, Seoul, Republic of Korea, 27 October–2 November 2019. [Google Scholar]
- Li, T.; Shi, Y.; Sun, X.; Wang, J.; Yin, B. PCGAN: Prediction-Compensation Generative Adversarial Network for Meshes. IEEE Trans. Circuits Syst. Video Technol. 2021, 32, 4667–4679. [Google Scholar] [CrossRef]
- Bai, X.; Luo, Z.; Zhou, L.; Chen, H.; Li, L.; Hu, Z.; Fu, H.; Tai, C.-L. Pointdsc: Robust point cloud registration using deep spatial consistency. In Proceedings of the IEEE/CVF Conference on Computer Visio and Pattern Recognition, Nashville, TN, USA, 20–25 June 2021; pp. 15859–15869. [Google Scholar]
- Bai, X.; Luo, Z.; Zhou, L.; Fu, H.; Quan, L.; Tai, C.-L. D3Feat: Jointlearning of dense detection and description of 3D local features. In Proceedings of the IEEE/CVF Conference on Computer Vision and Pattern Recognition, Seattle, WA, USA, 13–19 June 2020. [Google Scholar]
- Zhang, Z.; Dai, Y.; Sun, J. Deep learning based point cloud registration: An overview. Virtual Real. Intell. Hardw. 2020, 2, 222–246. [Google Scholar] [CrossRef]
- Pais, G.D.; Ramalingam, S.; Govindu, V.M.; Nascimento, J.C.; Chellappa, R.; Miraldo, P. 3DRegNet: A deep neural network for 3D point registration. In Proceedings of the IEEE/CVF Conference on Computer Vision and Pattern Recognition, Seattle, WA, USA, 13–19 June 2020. [Google Scholar]
- Chen, P.; Li, X. Revised spectral matching algorithm for scenes with mutually inconsistent local transformations. IET Image Processing. 2015, 9, 916–922. [Google Scholar] [CrossRef]
- Huang, X.; Mei, G.; Zhang, J.; Abbas, R. A comprehensive survey on point cloud registration. arXiv 2021, arXiv:2103.02690. [Google Scholar]
- Pomerleau, F.; Colas, F.; Siegwart, R. A review of point cloud registration algorithms for mobile robotics. Found. Trends® Robot. 2015, 4, 1–104. [Google Scholar] [CrossRef]
- Cheng, L.; Chen, S.; Liu, X.; Xu, H.; Wu, Y.; Li, M.; Chen, Y. Registration of laser scanning point clouds: A review. Sensors 2018, 18, 1641. [Google Scholar] [CrossRef] [PubMed]
- Saiti, E.; Theoharis, T. An application independent review of multimodal 3d registration methods. Comput. Graph. 2020, 91, 153–178. [Google Scholar] [CrossRef]
- Zhou, Q.-Y.; Park, J.; Koltun, V. Fast global registra tion. In European Conference on Computer Vision; Springer: Berlin/Heidelberg, Germany, 2016; pp. 766–782. [Google Scholar]
- Huang, X.; Fan, L.; Wu, Q.; Zhang, J.; Yuan, C. Fast registration for cross-source point clouds by using weak regional affinity and pixel-wise refinement. In Proceedings of the 2019 IEEE International Conference on Multimedia and Expo (ICME), Shanghai, China, 8–12 July 2019; pp. 1552–1557. [Google Scholar]
- Xin, S.; Wang, Y.; Lv, W. Standard deviation control chart based on weighted standard deviation method. In Proceedings of the 33rd Chinese Control Conference, Nanjing, China, 28–30 July 2014. [Google Scholar]
- Liu, Z.; Zhang, Z.; Zhang, X.; Lin, X.; Zhao, H.; Shen, Z. A Path Analysis of Electric Heating Technology Based on Entropy Weight Method. In Proceedings of the 2021 IEEE 5th Conference on Energy Internet and Energy System Integration (EI2), Taiyuan, China, 22–24 October 2021. [Google Scholar]
- Diakoulaki, D.; Mavrotas, G.; Papayannakis, L. Determining objective weights in multiple criteria problems: The critic method. Comput. Oper. Res. 1995, 22, 763–770. [Google Scholar] [CrossRef]
- Xu, Y.; Cai, Z. Standard deviation method for determining the weights of group multiple attribute decision making under uncertain linguistic environment. In Proceedings of the 2008 7th World Congress on Intelligent Control and Automation, Chongqing, China, 25–27 June 2008. [Google Scholar]
- Wang, J.; Hao, Y.; Yang, C. An entropy weight-based method for path loss predictions for terrestrial services in the VHF and UHF bands. Radio Sci. 2023, 58, 1–11. [Google Scholar] [CrossRef]
- Wang, Z.; Yang, X.; Hu, H.; Lou, Y. Actor-critic method-based search strategy for high precision peg-in-hole tasks. In Proceedings of the 2019 IEEE International Conference on Real-Time Computing and Robotics (RCAR), Irkutsk, Russia, 4–9 August 2019. [Google Scholar]
- Armeni, I.; Sener, O.; Zamir, A.R.; Jiang, H.; Brilakis, I.; Fischer, M.; Savarese, S. 3D semantic parsing of large-scale indoor spaces. In Proceedings of the 2016 IEEE Conference on Computer Vision and Pattern Recognition, Las Vegas, NV, USA, 26 June–1 July 2016. [Google Scholar]
- Zhou, D.; Fang, J.; Song, X.; Guan, C.; Yin, J.; Dai, Y.; Yang, R. Iou loss for 2d/3d object detection. In Proceedings of the 2019 International Conference on 3D Vision (3DV), Quebec City, QC, Canada, 16–19 September 2019. [Google Scholar]
- Bressan, P.O.; Junior, J.M.; Martins, J.A.C.; de Melo, M.J.; Gonçalves, D.N.; Freitas, D.M.; Ramos, A.P.M.; Furuya, M.T.G.; Osco, L.P.; de Andrade Silva, J.; et al. Semantic segmentation with labeling uncertainty and class imbalance applied to vegetation maping. Int. J. Appl. Earth Obs. Geoinf. 2022, 108, 102690. [Google Scholar]
- Marom, N.D.; Rokach, L.; Shmilovici, A. Using the confusion matrix for improving ensemble classifiers. In Proceedings of the 2010 IEEE 26-th Convention of Electrical and Electronics Engineers in Israel, Eilat, Israel, 17–20 November 2010. [Google Scholar]
- Baidya, J.; Garg, H.; Saha, A.; Mishra, A.R.; Rani, P.; Dutta, D. Selection of third party reverses logistic providers: An approach of BCF-CRITIC-MULTIMOORA using Archimedean power aggregation operators. Complex Intell. Syst. 2021, 7, 2503–2530. [Google Scholar] [CrossRef]
- Sharkasi, N.; Rezakhah, S. A modified CRITIC with a reference point based on fuzzy logic and hamming distance. Knowl. Based Syst. 2022, 255, 109768. [Google Scholar] [CrossRef]
- Censi, A. An ICP variant using a point-to-line metric. In Proceedings of the 2008 IEEE International Conference on Robotics and Automation, Pasadena, CA, USA, 19–23 May 2008. [Google Scholar]
Disclaimer/Publisher’s Note: The statements, opinions and data contained in all publications are solely those of the individual author(s) and contributor(s) and not of MDPI and/or the editor(s). MDPI and/or the editor(s) disclaim responsibility for any injury to people or property resulting from any ideas, methods, instructions or products referred to in the content. |
© 2024 by the authors. Licensee MDPI, Basel, Switzerland. This article is an open access article distributed under the terms and conditions of the Creative Commons Attribution (CC BY) license (https://creativecommons.org/licenses/by/4.0/).