Abstract
The experimental determination of cutting forces during milling is an important aspect followed in the manufacturing process and involves the use of specialized devices known as dynamometers. These can be made in the laboratory, depending on the type of measurements to be made, or they can be commercial, purchased from specialized companies. In this paper, such a dynamometer made by the authors in the laboratory is analyzed. For the elastic elements, octagonal rings are used. The main problem in the case of these dynamometers, namely the determination of the stiffness of the rings, is solved analytically, using the FEM for comparison, and then experimentally validated. The dynamic model, created based on the obtained values using d’Alembert’s principle, allows for simulating the behavior of this dynamometer in practical applications and determining the field in which it can be used. The frequencies and natural modes of vibration are determined, and the values obtained are compared with those obtained using ANSYS software 2021 R2.
1. Introduction
The most important parameters that has to be known in any machining are the cutting forces that develop in all three directions of a spatial orthogonal system. In the case of milling, the force values for all three directions are essential for analyzing, controlling, and optimizing the milling process. Taking into account the dynamics of the milling process and machining conditions, determining these values is often difficult. The determination of the force values can be achieved either theoretically, based on computational relationships, or experimentally, by measuring them directly. The analytical relationships that provide the values of the forces that appear in the milling process are based on the use of experimentally obtained coefficients. In essence, the experimental component is fundamental in the determination of cutting forces.
The direct determination of cutting forces using measurements can be achieved by means of specialized devices called dynamometers. Over time, different types of dynamometers have been developed that use strain gauges for deformation measurements [,,,,,], or rotating dynamometers [,] have been applied as integrated systems on tool holders for the milling process.
The most frequently used dynamometers are made with strain gauge or piezoelectric sensors, but there are some other indirect methods such as those from the feed drivers of spindle or from machine tool vibrations. The direct methods are mainly used to measure, with high precision, the forces, while the indirect methods are used in process monitoring applications.
In practice, the best result can be obtained by using a flexural mechanism [,,,,]. Flexural mechanisms offer some real advantages such as a simple design and assembly, low cost of manufacturing, monolithic structure, linear relationship between the applied force and displacement for small distortions, and continuous and smooth displacement characteristics.
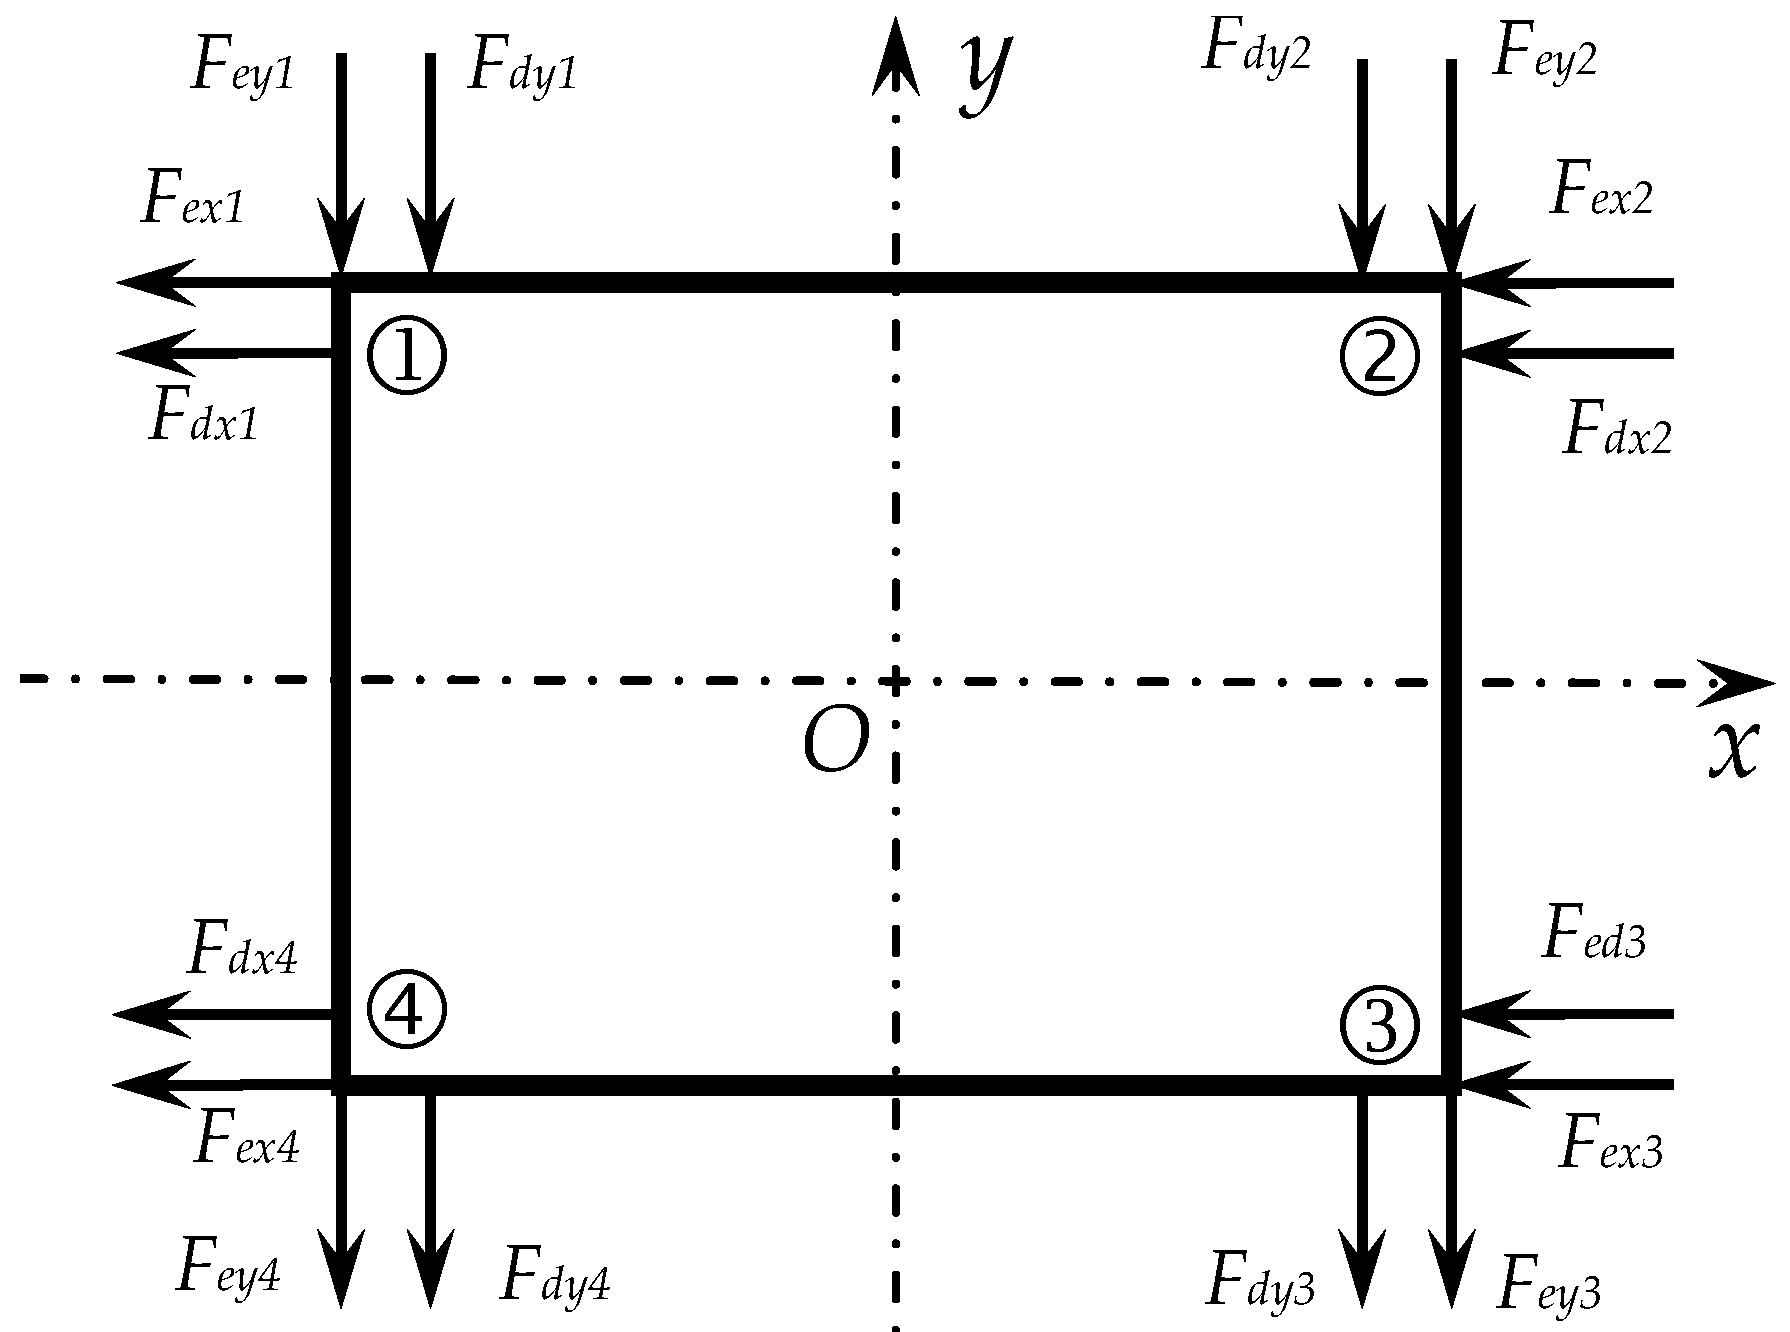
A dynamometer that is used to determine milling forces consists of two flat plates linked together by four octagonal rings in a symmetrical structure. The workpiece is placed on the upper plate. The bottom plate is fixed to the table of the milling machine. Elastic rings are subjected to forces that are monitored and summed accordingly. The forces that develop along the three directions can be obtained in this way.
Generally, dynamometers can be divided, from the point of view of their production, into two classes: commercial devices, produced by renowned companies in the field and used for general industrial processes, and laboratory devices, designed and manufactured for certain experiments, which assume certain particularities that must be taken into account.
In the case of commercial dynamometers, they are made of a set of piezoelectric sensors that are arranged to measure the machining forces and/or torque. The laboratory dynamometers are made with either strain gauges or piezoelectric sensors. Due their high sensitivity and rigidity, piezoelectric ones are preferred. The usage of strain gauges is based on Hooke’s law, which takes into consideration the relations between the elastic strain, stress, and associated force.
The dynamometers with strain gauges involve some disadvantages, such as the following:
- They have a complicated measurement structure: the strain gauges must be connected in an electrical circuit (measuring bridge), which must be balanced and calibrated;
- The deformation–electrical resistance relationship is more nonlinear;
- They are fragile and difficult to mount on curved surfaces;
- The maximum deflection that can be measured is an order of magnitude smaller (typically, less than 0.01 m/m);
- They have temperature sensitivity.
In the case of using of piezoelectric crystals, a very good compromise is obtained between the stiffness and sensitivity, and as a result, piezoelectric dynamometers are widely used. Regardless of the type of dynamometer used, it must meet a number of conditions, such as the following []:
- Sensitivity, expressed by the accuracy of the measured data;
- Stiffness, which means that the dynamometer has to be able to withstand the forces without causing much deflection, which may affect the machining condition;
- Cross sensitivity, such that one force does not affect the measurement of the other forces;
- Quick response time;
- High-frequency response such that the readings are not affected by vibrations within a reasonably high range of frequency;
- Stability against humidity and temperature;
- Increased maneuverability.
The dynamometers are mounted on the machine table and are aligned with the feed direction. In applications, the workpiece must be limited in its dimensions and mass, because a large mass strongly influences the dynamic response of the dynamometer. Using force transducers, an important goal is achieved: measuring, at the same time, the force signal magnitude of the force and frequency content.
Regardless of the method used, in addition to the maximum value of cutting force that can be measured, another characteristic to watch for is the frequency range in which these forces occur. This is closely related to the analyses that can be performed on the milling process in both domains: the time domain and frequency domain.
Therefore, dynamometers must ensure that measurements can be made both in the time range and in the frequency range over as wide of a range as possible for the amplitude of forces, encompassing the frequencies of vibrations resulting from the milling process.
In the present paper, a dynamometer design based on octagonal-ring elastic elements and force transducers produced by the company Brüel & Kjær (Virum, Denmark) is presented. The basic structure of the dynamometer is the classic one, but the strain gauges used for the deflection measurements are replaced with calibrated force transducers. Thus, the values of the dynamic forces in the three directions and their associated frequencies can be determined. At the same time, static and dynamic calibrations and a study of the dynamic behavior are conducted. The use of such systems is important in current practice for the study of various aspects involved in technological processes. An important advantage is the fact that the use of calibrated force transducers produced by different companies offers the possibility to connect them to any data acquisition platform while considering their sensitivity characteristics. At the same time, using the direct frequency analysis, offered by soft applications tied with acquisition platforms, permits the damping ratio and transmissibility rate to be found.
The aim of this study is to create a model to study the dynamic behavior of the considered dynamometer with force transducers. The stiffness of the rings is found using three different methods: analytic, experimental, and using the FEM. Based on these characteristics and considering the damping coefficient found in a previous paper [], it is described as a three-degrees-of-freedom model.
2. Materials and Methods
The dynamometer shown in Figure 1, made of two plates defined as the upper plate and bottom plate and four rings, was considered.

Figure 1.
Dynamometer view: (a) front view; (b) side view.
The geometry and design data of the dynamometer components are shown in Figure 2, where the dimensions are given in mm.

Figure 2.
Geometry of the dynamometer components (the dimensions are given in mm): (a) ring geometry; (b) upper plate geometry; (c) bottom plate.
The accuracy of the measurements made is dependent on the static and dynamic calibrations of the dynamometer. The cutting force value recorded by the force transducers can be distorted by the dynamic parameters of the dynamometer, inertia and stiffness, and the workpiece structures. For a correct measurement of the forces and frequencies, the dynamometer is excited with known harmonic forces at different frequencies in the two directions. For this, an electrodynamic exciter is used, and the input/output transmissibility ratio can be determined.
The static calibration refers to the elastic deflection of the ring components and, consequently, the value of stiffness, while the dynamic calibration refers to the dynamic response of the dynamometer: in the present case, the frequency bandwidth and dynamic force magnitude.
For force determination, force transducers were used; four force transducers made by Brüel & Kjær, type 8230-003, were mounted on the rings (Figure 3a); at one end, they were fixed to the rings, and at the other end, they were locked by means of stops embedded in the bottom plate (Figure 3b). The main characteristics of the used force transducers are presented in Table 1 [].

Figure 3.
Force transducer mounting: (a) in rings; (b) detailed mounting.

Table 1.
Main characteristics of the force transducer.
3. Static Stiffness Determination
3.1. Ring Stiffness Experimental Determination
To determine the stiffness experimentally, octagonal elastic rings were fixed (recessed) at one end and loaded, successively, through a pulley system with different forces. Displacements were measured at the point of application of force, and we obtained a series of load–unload curves using a digital dial gauge. The measurements were conducted for both directions: transverse and longitudinal (Figure 4). The system was loaded and unloaded in the same manner.

Figure 4.
Ring stiffness determination set-up: (a) longitudinal direction of the ring; (b) transverse direction of the ring.
We conducted 10 loads and unloads for each case using plates with a known mass. The values for each deformation at a certain load were averaged, and average values for both the load and unload were calculated. As can be seen from Figure 3, in both cases, in the case of unloads, there is a residual deformation.
In the case of both longitudinal and transverse stiffnesses, average values for deflections between loading and discharging were determined for each value of applied force. In this way, average curves were obtained for which the experimental values for stiffness could be determined. In the end, two experimental curves were obtained for stiffness for both the longitudinal and transverse directions (Figure 5). The values used in the curve drawings were the average values obtained during the ten tests.

Figure 5.
Ring stiffness experimental curves: (a) stiffness curve in longitudinal direction of the ring; (b) stiffness curve in transverse direction of the ring. Blue—load; Red—unload; Yellow—Average.
3.2. Analytic Stiffness Calculation
The values for stiffness for octagonal rings can be calculated according to different relations presented in technical papers. In [,,,], for longitudinal and transverse stiffness calculations, the following relations are presented:
- For the longitudinal direction:
- For the transverse direction:

Figure 6.
Ring geometry with main dimensions considered in stiffness analytic calculation.
Considering the geometrical data, where a = 50 mm, b = 18 mm, t = 4.6 mm, r = 15.4 mm, and E = 2.1 × 10⁵ N/mm2, the following values for stiffness were obtained:
- For the longitudinal direction (1):
- For the transverse direction (2):
3.3. FEM Ring Stiffness Determination
The third method used simulated the stiffness using the finite element method []. The stiffness based on the FEM was measured considering the tools given by the program ANSYS Mechanical APDL. The 3D geometry of the ring was built using the module for modeling from the pre-processor step (Figure 7a).

Figure 7.
Ring models obtained in ANSYS: (a) 3D model; (b) ring finite element model.
The rings were meshed with a 3D element defined as the 8-Node Structural Solid element SOLID185. The FE model consists of 1337 nodes and 5620 elements (Figure 7b).
For the FEM analysis, the force was applied on the node in two directions, which are similar for the experiments:
As boundary conditions, taking into consideration the structure of the dynamometer, the following were considered:
- For the longitudinal direction of stiffness: the displacement of the nodes from the bottom screw faces is fixed in all three directions, and the nodes from the upper surface of the upper screw are blocked on both directions (Ox and Oy) (Figure 7b);
- For the transverse direction of stiffness: the same conditions were held for the bottom screw, and for the upper screw, the nodes were blocked in both directions (Oy and Oz) (Figure 7b);
In the case of the ring’s longitudinal direction stiffness, simulations were performed for six values of loads (Table 2).

Table 2.
Values of main quantities for longitudinal stiffness.
The same values for load forces were used in the experimental set-up. The deformation and stiffness values obtained using FEM, for each force, are presented in the same table. For the stiffness calculation, the values of the force and deformations in the same node were considered. The deformed shape in the case of longitudinal load is presented in Figure 8.

Figure 8.
Ring FEM analysis in longitudinal direction: (a) boundary conditions and load; (b) longitudinal deformed ring for a load of 585.66 N.
Considering the values presented in Table 1, the average value for stiffness in the longitudinal direction is kFEM_long = 28.953 × 10⁶ [N/m].
In the case of the transverse stiffness determination, it was achieved in the same simulation as in the case of the longitudinal stiffness. The obtained values for deformation and stiffness are presented in Table 3.

Table 3.
Values of main quantities for transverse stiffness.
Based on the values presented in Table 2, the average value for stiffness in the transverse direction is kFEM_tr = 29.041 × 10⁶ [N/m]. The deformed shape in the case of longitudinal load is presented in Figure 9.

Figure 9.
Ring FEM analysis in transverse direction: (a) boundary conditions and load; (b) longitudinal deformed ring for a load of 585.66 N.
A synthesis of the obtained values for the ring’s stiffness in both the longitudinal and transverse directions is presented in Table 4.

Table 4.
Synthesis of the stiffness values of the ring.
As can be seen from Table 4, there are three different values for longitudinal and transverse stiffnesses. For the next simulation, their average values were considered: klong = 29.195 × 10⁶ [N/m], and ktr = 28.894 × 10⁶ [N/m].
By comparing the values of the average stiffness with the obtained values, one can find small differences in the absolute values of individual errors (Table 5).

Table 5.
Synthesis of the errors.
3.4. Dynamometer Assembly Stiffness Experimental Determination
The next static tests carried out concerned the dynamometer assembly in the two horizontal loading directions: along the processing direction, Ox (Figure 10a), and that perpendicular to it, Oy (Figure 10b), with the transducers mounted.

Figure 10.
Static test of dynamometer: (a) longitudinal load; (b) transverse load.
As in the case of the ring test, we conducted 10 loads and unloads for each direction with the same plates. For all tests, average values for both loads and unloads were obtained. The stiffness curves were plotted for both the longitudinal and transverse directions (Figure 11).

Figure 11.
Dynamometer assembly experimental stiffness curves: (a) longitudinal direction; (b) transverse direction. Blue—load; Red—unload; Yellow—Average.
The average values for the measured stiffness in the longitudinal direction are presented in Figure 11a, and the average (medium) longitudinal stiffness is calculated as km_long = 2.165 × 10⁹ [N/m], while the average values for the measured stiffness in the transverse direction are presented in Figure 11b, and the average (medium) value for transverse stiffness is km_tr = 2.137 × 10⁹ [N/m].
3.5. Dynamometer Assembly Stiffness Determination Using FEM
The 3D model of the dynamometer was created using the same program ANSYS—Mechanical APDL 2021 R2. The base and upper plates and the rings were modeled (Figure 12a). For the finite element model, the same type of element as in the case of the ring was used. The FE model consists of 9661 nodes and 21,131 elements (Figure 12b).

Figure 12.
The solid 3D model created in ANSYS: (a) isometric view; front view; side view; (b) the FE model.
To simulate the loads and to avoid local effects linked to the application of a force to a single node, a pressure was applied on the lateral surfaces of the upper plate in both directions: longitudinal (Ox) and transverse (Oy).
To find the values of deformations, the nodes situated in the middle of lateral surfaces were considered, and we took an average of these values.
The obtained values for the longitudinal load are presented in Table 6, and for the transverse load, in Table 7.

Table 6.
Synthesis of the stiffness values of dynamometer in Ox direction.

Table 7.
Synthesis of the stiffness values of dynamometer in Oy direction.
The comparison of the obtained values from the experiments and from the FEM is presented in Table 8.

Table 8.
The average values of dynamometer stiffness.
4. Model of Dynamometer as a System with Three Degrees of Freedom
4.1. The Considered Model
For the study, the upper plate of the dynamometer and the four connection points of the rings were considered (Figure 13a). The elastic rings are represented by springs connected with the plate in the symmetrically four points (Figure 13b).

Figure 13.
Model of upper plate: (a) the connection points and dimensions; (b) the mass–spring model of the upper plate and the rings.
The positions of the considered points, according to the orthogonal system xOy, with the origin O in the mass center, are as follows:
4.2. Motion of the Upper Plate
To analyze the dynamic behavior of the considered dynamometer, we considered that the upper plate has a combined motion in both directions, longitudinal and transverse, with an o twist motion. The longitudinal and transverse motions are defined by positions denoted with “x” and “y”, and the rotation is defined by the small angle “θ” (Figure 14).

Figure 14.
Scheme of plate motion: in longitudinal direction, “Ox”; in transverse direction, “Oy”.
Based on the scheme in Figure 14, the positions of the points in new coordinates given by the orthogonal reference system are as follows:
In the hypothesis of small deformations, one can use the following approximations: sinθ ≅ θ, and sinθ ≅ 1. Then, Equation (6) becomes:
Considering the coordinates of the points given in (5), the new coordinates are as follows:
Considering the initial position and the relations from (8), the displacements of each point become:
The above relations (9) will be used in defining the motion equations, which are presented in the next subchapter.
4.3. Motion Equations
To define the motion equations for all three degrees of freedom, the d’Alembert principle was used.
The motions were considered to occur in the positive directions of the axes “Ox” and “Oy”, and the rotation was considered to be counterclockwise (Figure 14). As a result of these considerations of movements, the elastic and damping forces were developed (Figure 14).
In Figure 15, the following notations are considered: and are the elastic forces in each connection point for both directions (“Ox” and “Oy”), and and are the damping forces in each connection point for both directions (“Ox” and “Oy”).

Figure 15.
Force diagram of upper plate of the dynamometer.
The elastic and damping forces mentioned in (10) can be expressed as:
and
Introducing relations (11) and (12) in (10) after some calculations, we obtained the following motion equations:
Motion equations can be rewritten in the matrix form:
where the following notations are considered: is the upper plate mass [kg], is the inertia moment of the plate measured in [kg·m2], are the damping constants, and are the stiffness constants.
The matrix form of the motion equations can be rewritten as:
where is the inertia matrix, represents the damping matrix, defines the stiffness matrix, is the acceleration vector, is the velocity vector, represents the displacement vector, and is the zero vector.
5. Modal Analysis of the Dynamometer
5.1. Modal Analysis Considering the State Space Model
In the case of the state-space formulation, the displacements and velocities are considered as unknown variables. Both quantities describe the state of the system at any time.
From the motion equations, the state-space equations are defined as [,,,]:
where is the state vector that contains the displacements and velocities for all degrees of freedom, is the a matrix, which contains the characteristics of the system, and is a matrix that refers to the influence of forces described in the input matrix . Matrix is given by:
with the notations from Equation (14), a zero matrix , and an identity matrix .
The natural frequencies of any mechanical system with a behavior described by Equation (16) are given by the eigenvector of matrix described by (17), where damping is considered to be zero:
To solve the equation of eigenvalues:
Three pairs of six eigenvalues that are complex numbers are obtained. The imaginary part of them represents the natural circular frequency for each degree of freedom.
The simulation data are as follows: the total mass (upper plate + rings + workpiece) is ; stiffness is considered to be the longitudinal stiffness of the ring plus the stiffness of the transducer, where ; is considered to be the transverse stiffness of the ring plus the stiffness of the transducer, where ; the damping coefficients [] are and ; a = 0.087 [m]; b = 0.042 [m]; and the mechanical moment of inertia J = 0.0636 [kg·m2].
Using the tools of MATLAB® R2024a software, we obtained the following values for the rotational frequencies: , and . Corresponding to these circular frequencies are the following natural frequencies: , and .
5.2. Frequency Response Function of the System
Frequency response functions (denoted as FRFs) define the structural response to different applied forces as a function of frequency. FRFs can be expressed in terms of the main quantities that describe vibrations, displacement, velocity, or acceleration, and are defined as a ratio of these quantities over the input signal (force/moment) for different frequencies. Generally, the FRF describes the motion of the considered point due to an applied exciting force using an impact hammer or a shaker [,,,].
As is known, modal decoupling enables the transformation of a system with “j” degrees of freedom, coupled by motion equations, in “j” decoupled single-degree-of-freedom (SDOF) equations. Each equation defines a vibration mode, and the system is practically decomposed in the “j” SDOF, with each DOF being defined by a motion equation of the form:
where the index “j” refers to the “jst” mode of vibration, mj, ωj, and ζj, are the modal mass, the circular frequency, and the damping ratio, respectively, of the “jst” mode, and i is the complex number (i2 = −1).
From (20), one can write the FRF as:
with X(ω) and F(ω) defined as the Fourier transforms of the response and excitation, respectively.
Considering relations (20) and (21), the FRF expression becomes:
The FRF given by (22) be rewritten as:
where Re(ω) is the real part and Im(ω) is the imaginary part of the FRF. After some mathematical transformations and taking into consideration the general relationships between damping coefficient, mass, damping ratio, and circular natural frequency, the real and imaginary components of (23) are:
Based on the obtained values for natural circular frequencies, the model components (mass, damping, and stiffness), considering the superposition principle, are plotted as an FRF for the considered dynamometer (Figure 16).

Figure 16.
The FRF representation.
5.3. Modal Analysis by FEM
The FEM modal analysis was conducted using ANSYS software. It used the same model as in the case of the static analysis of deformations.
As boundary conditions, we considered that the bottom plate was fixed, and in all the nodes of the bottom, the degrees of freedom were considered zero (displacements and rotations).
With natural frequencies, we found that and , which are similar to those found when considering the system to be a concentrated mass connected to four elastic elements and having three degrees of freedom. The mode shapes are presented in Figure 17 and Figure 18.

Figure 17.
The mode shapes for a frequency of 2947.32 [Hz]: (a) deformation in longitudinal direction; (b) deformation in transverse direction.

Figure 18.
The mode shape for a frequency of 3912.84 [Hz].
6. Conclusions
The values for ring stiffness were found for the two directions of deformation: longitudinal and transverse. These values were determined using three different methods: analytically, by using relations from references, through experiments, and with the finite element method, using the facilities offered by the program ANSYS. There was a very good correlation between the values determined using the three methods. As a result, an average value was considered between the three values found. Damping forces were also considered as the values of the damping coefficient, using the data presented in a previous paper [].
Considering the d’Alembert principle, we found the motion equation expressed by (12) and in matrix form, as expressed by (13). Using the property of the evolution matrix A from the state-space approach, we found the natural frequencies of the dynamometer when considered as a lumped mass system.
The results of the research carried out using the three methods highlight the fact that there are two identical values of natural frequencies (corresponding to longitudinal and transverse movements) and a frequency corresponding to twisting. It was proven that there is a good correlation between the results obtained using the lumped model and the results obtained using the FEM.
The present study offers a model of a milling dynamometer used to evaluate its natural frequencies that can help in defining the next steps of future studies of milling and allows for the avoidance of resonances. The obtained results can be extended for other sizes of dynamometers. Their behaviors will be similar to the behavior of the studied dynamometer from a qualitative point of view, but the values obtained will be different, in accordance with the dimensions used for the respective case.
Author Contributions
Formal analysis, I.C.R. and S.V.; writing—original draft and MATLAB simulations, M.I.M.; experiments, I.C.R. and M.I.M.; FEM analysis, I.C.R.; supervision, S.V. All authors have read and agreed to the published version of the manuscript.
Funding
This research received no external funding. The APC was funded by Transilvania University of Brasov.
Institutional Review Board Statement
Not applicable.
Informed Consent Statement
Not applicable.
Data Availability Statement
The data presented in this study are available upon the request from the corresponding author.
Conflicts of Interest
The authors declare no conflicts of interest.
References
- Gomez, M.; Honeycutt, A.; Schmitz, T. Hybrid manufactured dynamometer for cutting force measurement. Manuf. Lett. 2021, 29, 65–69. [Google Scholar] [CrossRef]
- Gomez, M.; Schmitz, T. Stability Evaluation for a Damped, Constrained-Motion Cutting Force Dynamometer. J. Manuf. Mater. Process. 2022, 6, 23. [Google Scholar] [CrossRef]
- Uddin, M.; Songyi, D. On the design and analysis of an octagonal–ellipse ring based cutting force measuring transducer. Measurement 2016, 90, 168–177. [Google Scholar] [CrossRef]
- Mohanraj, T.; Shankar, S.; Rajasekar, R.; Uddin, M. Design, development, calibration, and testing of indigenously developed strain gauge based dynamometer for cutting force measurement in the milling process. J. Mech. Eng. Sci. 2020, 14, 6594–6609. [Google Scholar] [CrossRef]
- Ramsauer, C.; Leitner, D.; Habersohn, C.; Schmitz, T.; Yamazaki, K.; Bleicher, F. Flexure-based dynamometer for vector-valued milling force measurement. J. Mach. Eng. 2023, 23, 47–56. [Google Scholar] [CrossRef]
- Rizal, M.; Ghani, J.A.; Usman, H.; Dirhamsyah, M.; Mubarak, A.Z. Design and optimization of a cross-beam force transducer for a stationary dynamometer for measuring milling cutting force. J. Mach. Eng. 2023, 23, 5–29. [Google Scholar] [CrossRef]
- Rizal, M.; Ghani, J.A.; Nuawi, M.Z.; Haron, C. Development and testing of an integrated rotating dynamometer on tool holder for milling process. Mech. Syst. Signal Process. 2015, 52, 559–576. [Google Scholar] [CrossRef]
- Zhang, P.; Gao, D.; Lu, Y.; Xie, Z.; Wang, Z. Development and testing of a wireless multi-axis toolholder dynamometer for milling and drilling process. Proc. Inst. Mech. Eng. Part B J. Eng. Manuf. 2023, 18, 55. [Google Scholar] [CrossRef]
- Gomez, M.F.; Smitz, T.L. Displacement-based dynamometer for milling force measurement. In Proceedings of the 47th SME North American Manufacturing Research Conference, Erie, PA, USA, 10–14 June 2019; Procedia Manufacturing. Volume 34. [Google Scholar]
- Jullien-Corrigan, A.; Ahmadi, K. Measurement of high-frequency milling forces using piezoelectric dynamometers with dynamic compensation. Precis. Eng. 2020, 66, 1–9. [Google Scholar] [CrossRef]
- Korkut, I. A dynamometer design and its construction for milling operation. Mater Des. 2003, 24, 631–637. [Google Scholar] [CrossRef]
- Kiran, K.; Kayacan, M.C. Cutting force modeling and accurate measurement in milling of flexible workpieces. Mech. Syst. Signal Process. 2019, 133, 106284. [Google Scholar] [CrossRef]
- Lyu, Y.; Jamil, M.; He, N.; Gupta, M.K.; Pimenov, D.Y. Development and Testing of a High-Frequency Dynamometer for High-Speed Milling Process. Machines 2021, 9, 11. [Google Scholar] [CrossRef]
- Milton, C. Shaw Metal Cutting Principles, 2nd ed.; Oxford University Press: Oxford, UK, 2005; ISBN 0-19-514206-3. [Google Scholar]
- Brüel&Kjær—Product Data, Force Transducer. Available online: https://www.bksv.com/-/media/literature/Product-Data/bp2080.ashx (accessed on 13 May 2024).
- Totis, G.; Wirtz, G.; Sortino, M.; Veselovac, D.; Kuljanic, E.; Klocke, F. Development of a dynamometer for measuring individual cutting edge forces in face milling. Mech. Syst. Signal Process. 2010, 24, 1844–1857. [Google Scholar] [CrossRef]
- Totis, G.; Adams, O.; Sortino, M.; Veselovac, D.; Klocke, F. Development of an innovative plate dynamometer for advanced milling and drilling applications. Measurements 2014, 49, 164–181. [Google Scholar] [CrossRef]
- Pathri, B.P.; Garg, A.K.; Unune, D.R.; Mali, H.S.; Dhami, S.S.; Nagar, R. Design and fabrication of a strain gauge type 3-axis milling tool dynamometer: Fabrication and Testing. Int. J. Mater. Form. Mach. Process. 2016, 3, 1–15. [Google Scholar] [CrossRef]
- Yaldız, S.; Ünsaçar, F.; Sağlam, H.; Işık, H. Design, development and testing of a four-component milling dynamometer for the measurement of cutting force and torque. Mech. Syst. Signal Process. 2007, 21, 1499–1511. [Google Scholar]
- Alipanahi, A.; Mahboubkhah, M.; Barari, A. Cross-sensitivity control in a novel four-component milling dynamometer for simultaneous measurement of tri-axial forces and torque. Measurement 2022, 191, 110788. [Google Scholar] [CrossRef]
- Mupona, M.I.; Roşca, I.C. Modal analysis of a milling dynamometer considered as 1DOF system. Vibroeng. Procedia 2022, 46, 54–60. [Google Scholar] [CrossRef]
- He, J.; Fu, Z.-F. Modal Analysis, 1st ed.; Butterworth-Heinemann: Oxford, UK, 2001; ISBN 978-0-750-65079-3. [Google Scholar]
- Schmitz, T.L.; Smith, S.K. Machining Dynamics Frequency Response to Improved Productivity, 2nd ed.; Springer International Publishing: Cham, Switzerland, 2019; ISBN 978-3-319-93706-9. [Google Scholar]
- Schmitz, T.L.; Smith, S.K. Mechanical Vibrations. Modeling and Measurements, 2nd ed.; Springer International Publishing: Cham, Switzerland, 2021; ISBN 978-3-030-52343-5. [Google Scholar]
Disclaimer/Publisher’s Note: The statements, opinions and data contained in all publications are solely those of the individual author(s) and contributor(s) and not of MDPI and/or the editor(s). MDPI and/or the editor(s) disclaim responsibility for any injury to people or property resulting from any ideas, methods, instructions or products referred to in the content. |
© 2024 by the authors. Licensee MDPI, Basel, Switzerland. This article is an open access article distributed under the terms and conditions of the Creative Commons Attribution (CC BY) license (https://creativecommons.org/licenses/by/4.0/).