
Pedestrian Abnormal Behavior Detection System Using Edge–Server Architecture for Large–Scale CCTV Environments


Abstract
1. Introduction
2. Related Work
2.1. Recent Trends in Applied Deep Learning Research
2.2. Surveillance Video Analysis System
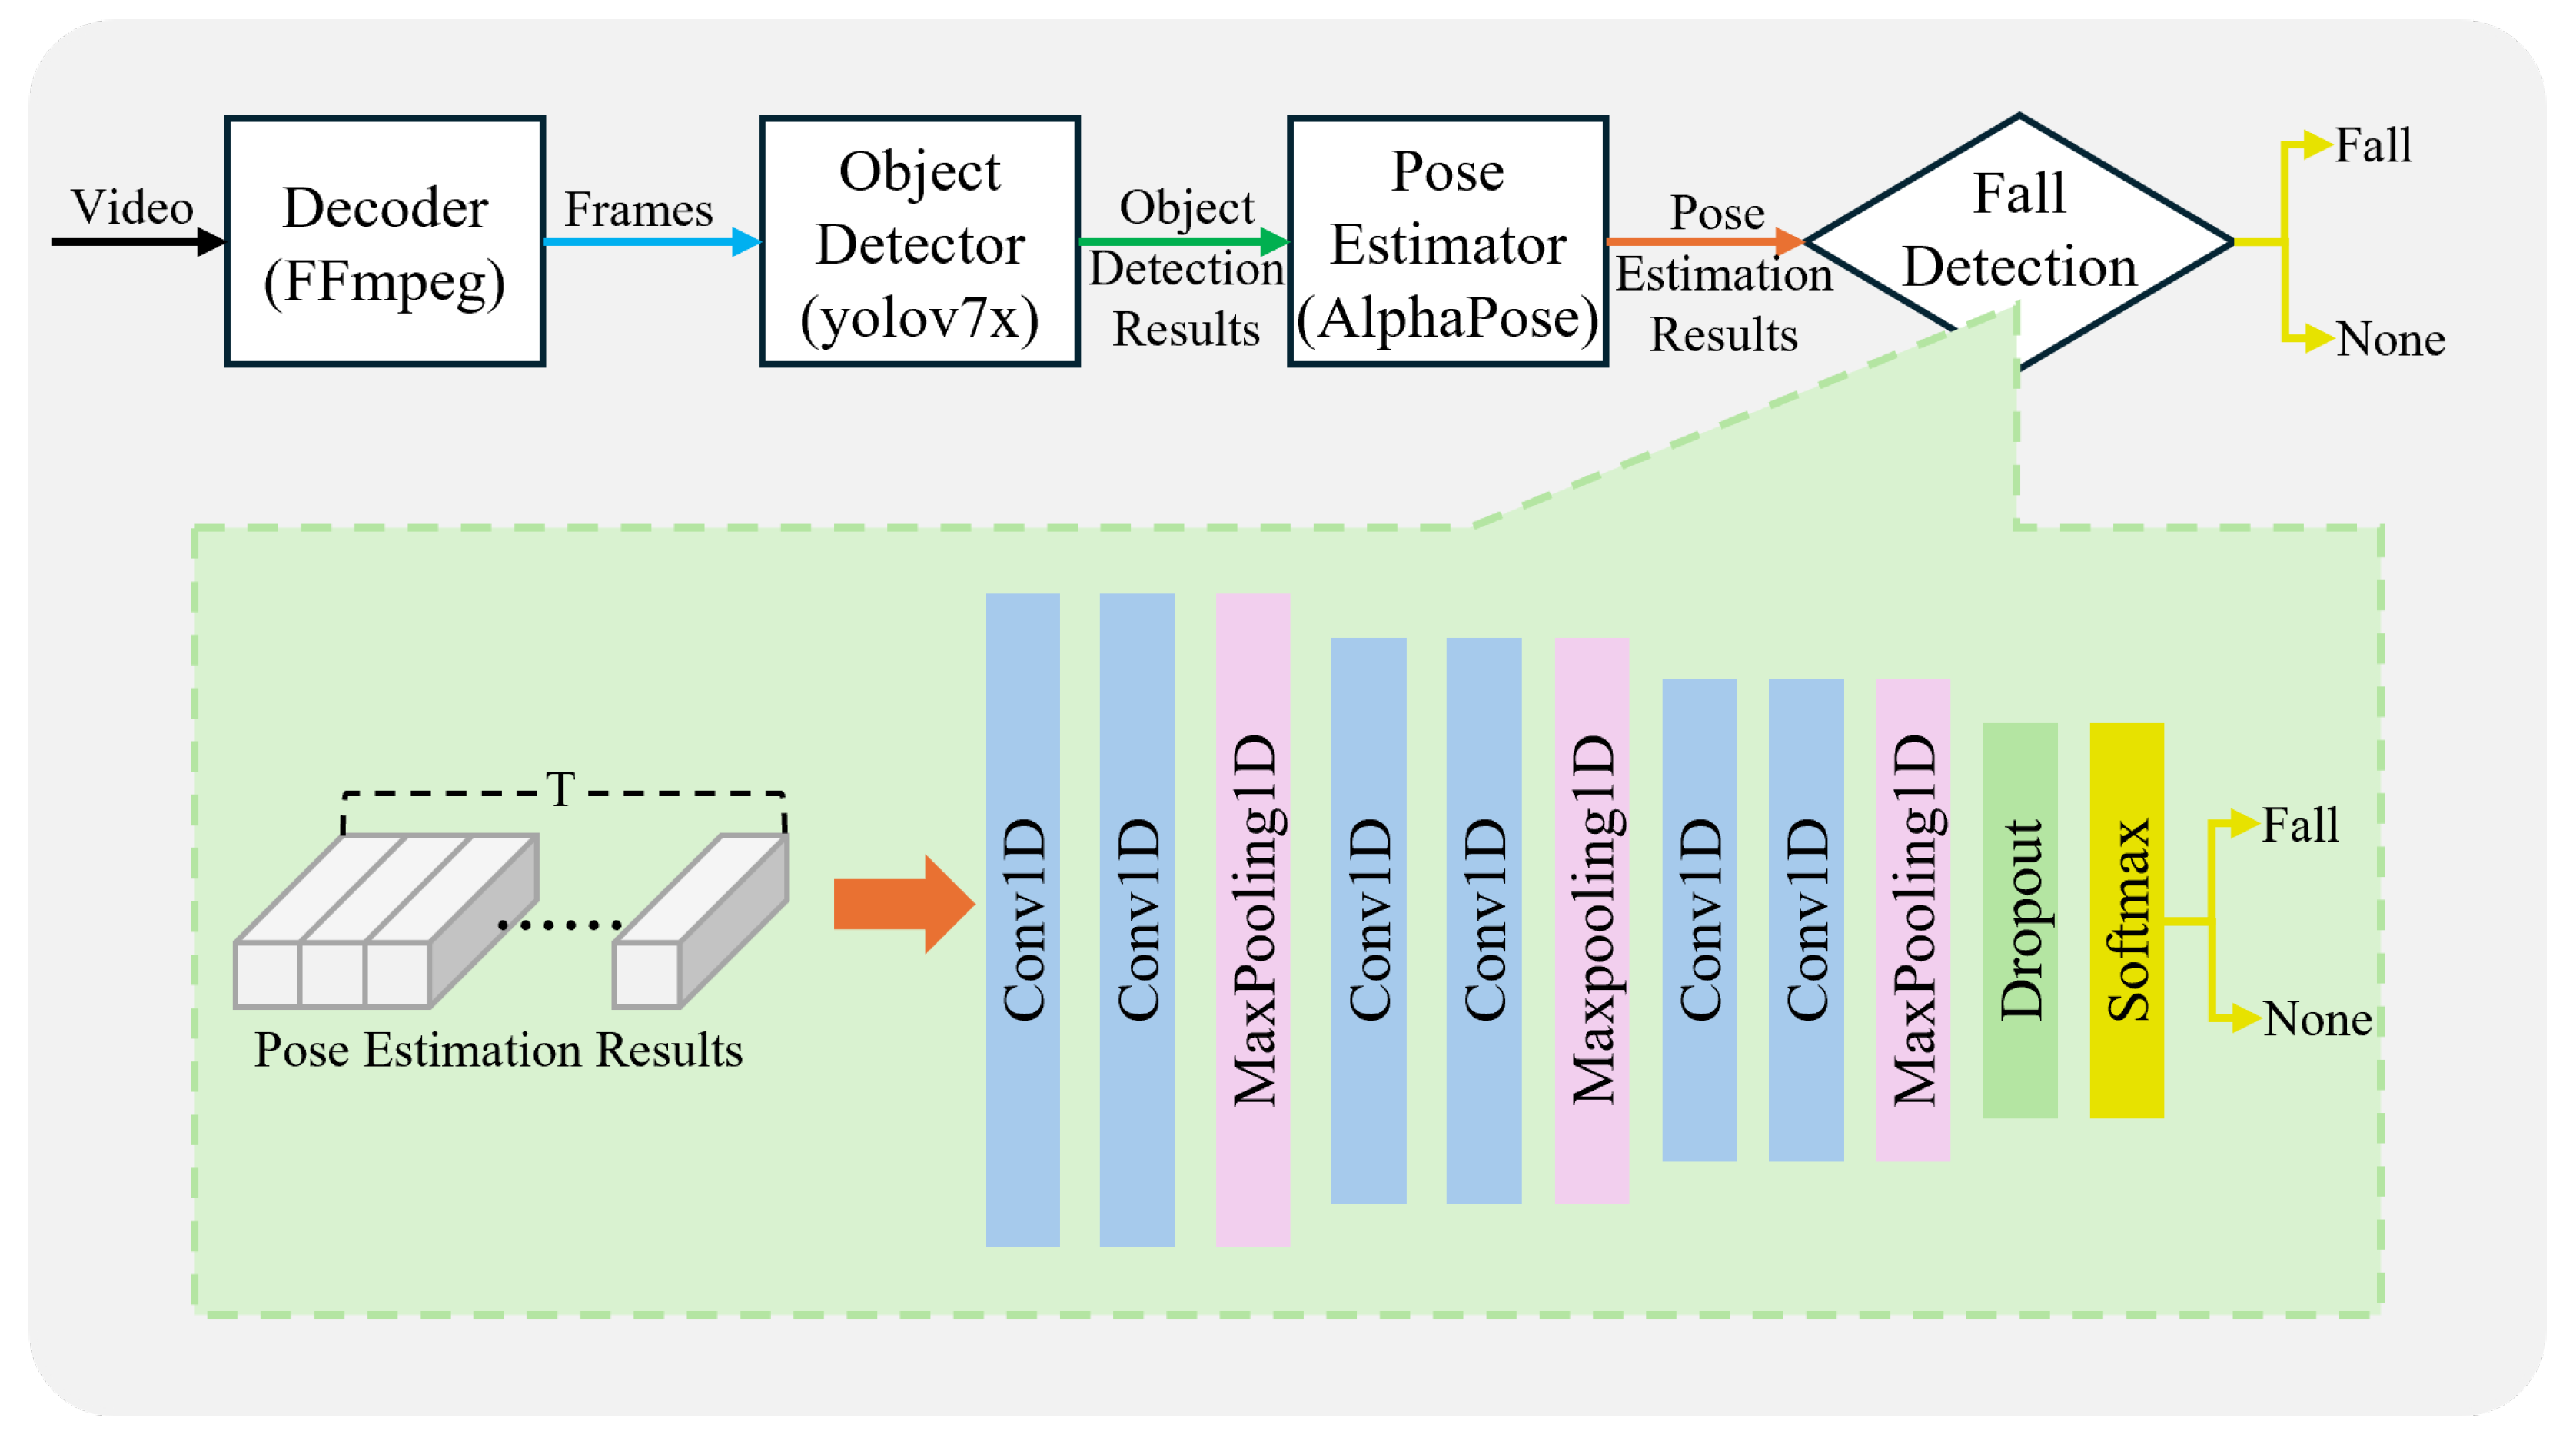
2.3. Pedestrian Abnormal Behavior Detection in Surveillance Videos
3. Proposed System
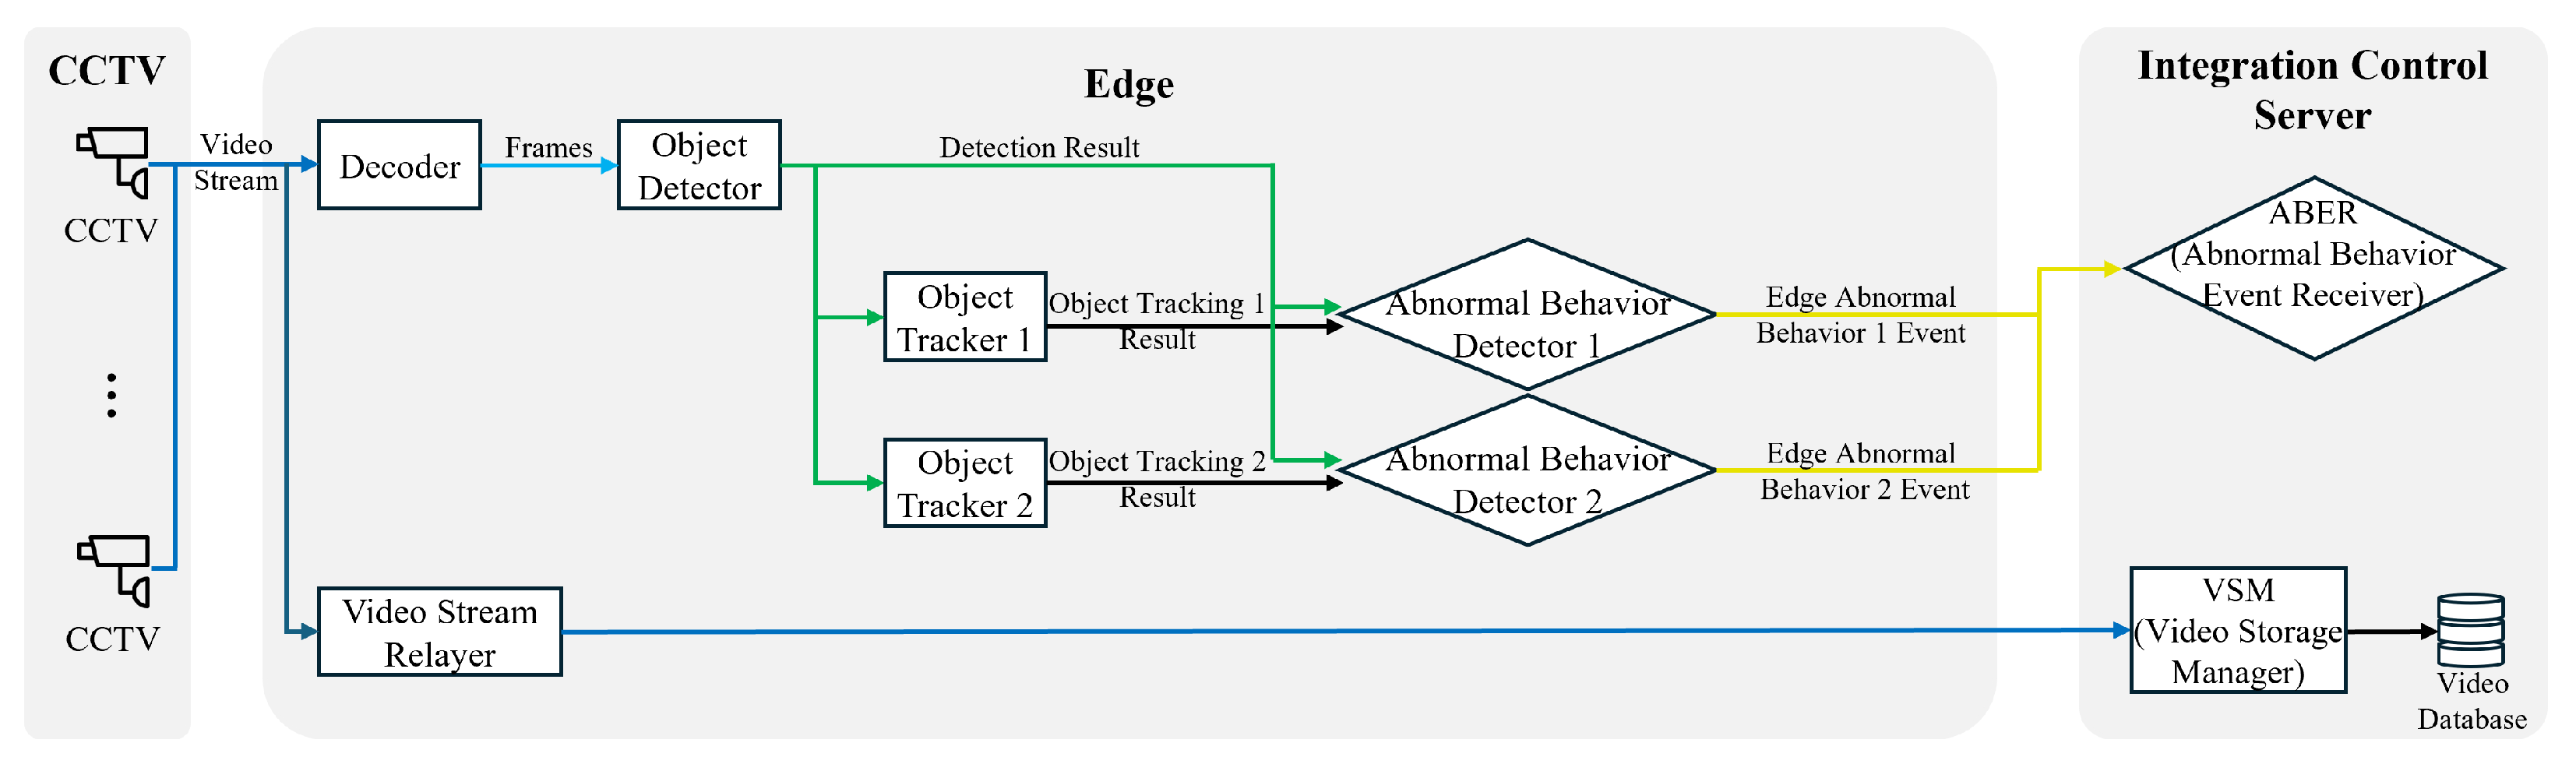
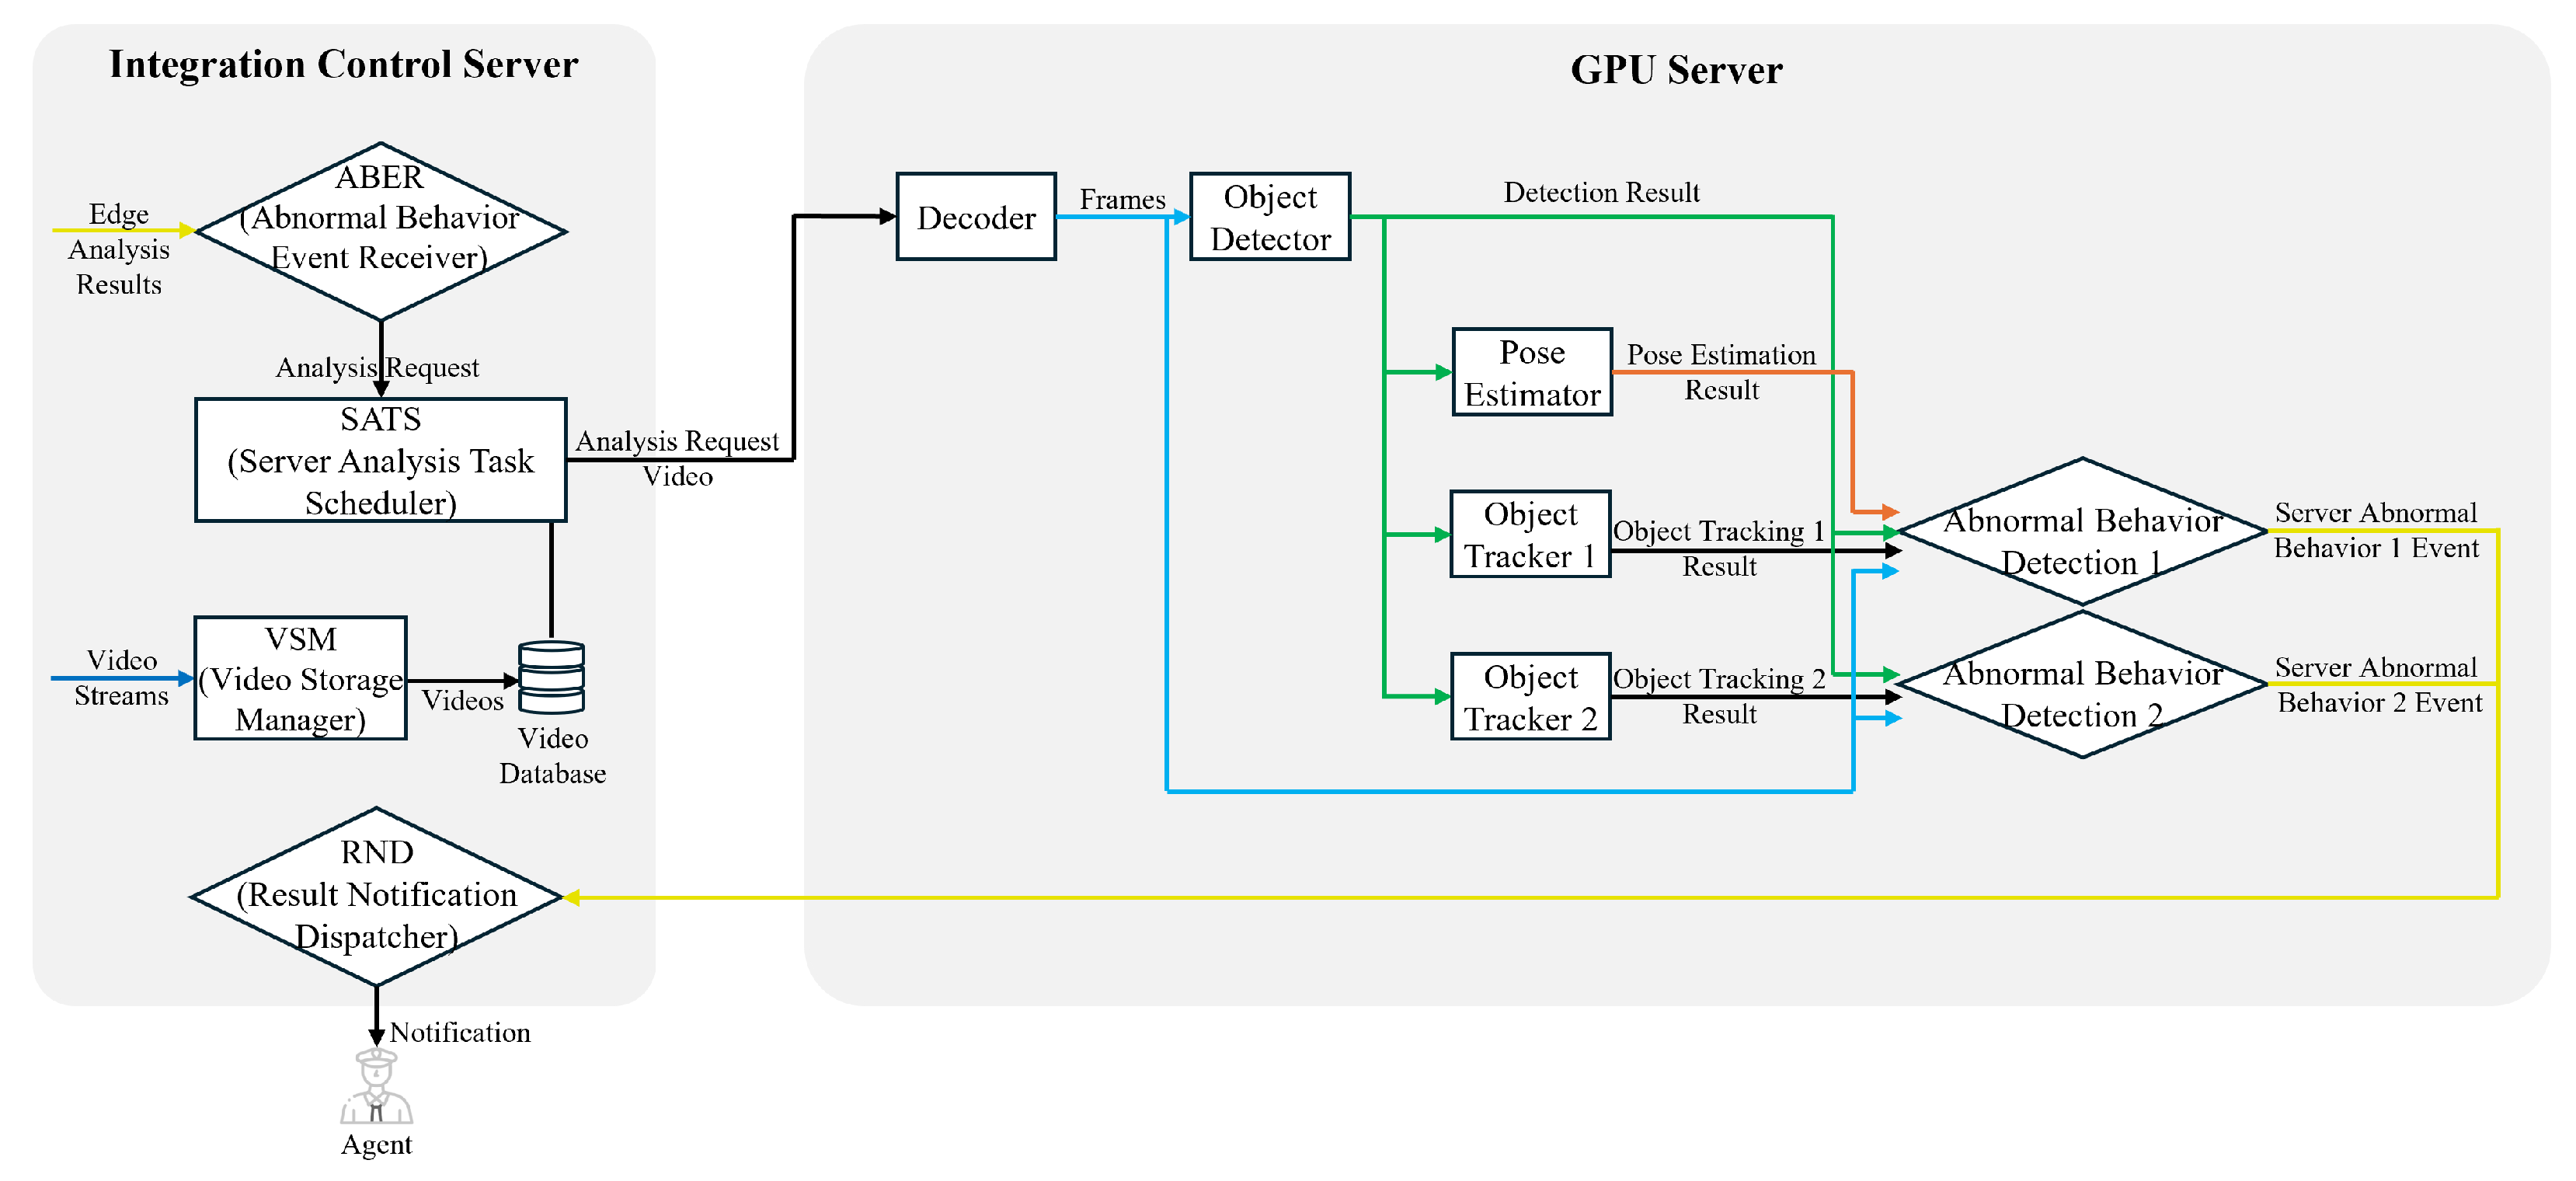
3.1. Edge–Server Architecture-Based Pedestrian Abnormal Behavior Detection System
| Algorithm 1 Assign and manage analysis requests in analysis modules. |
|
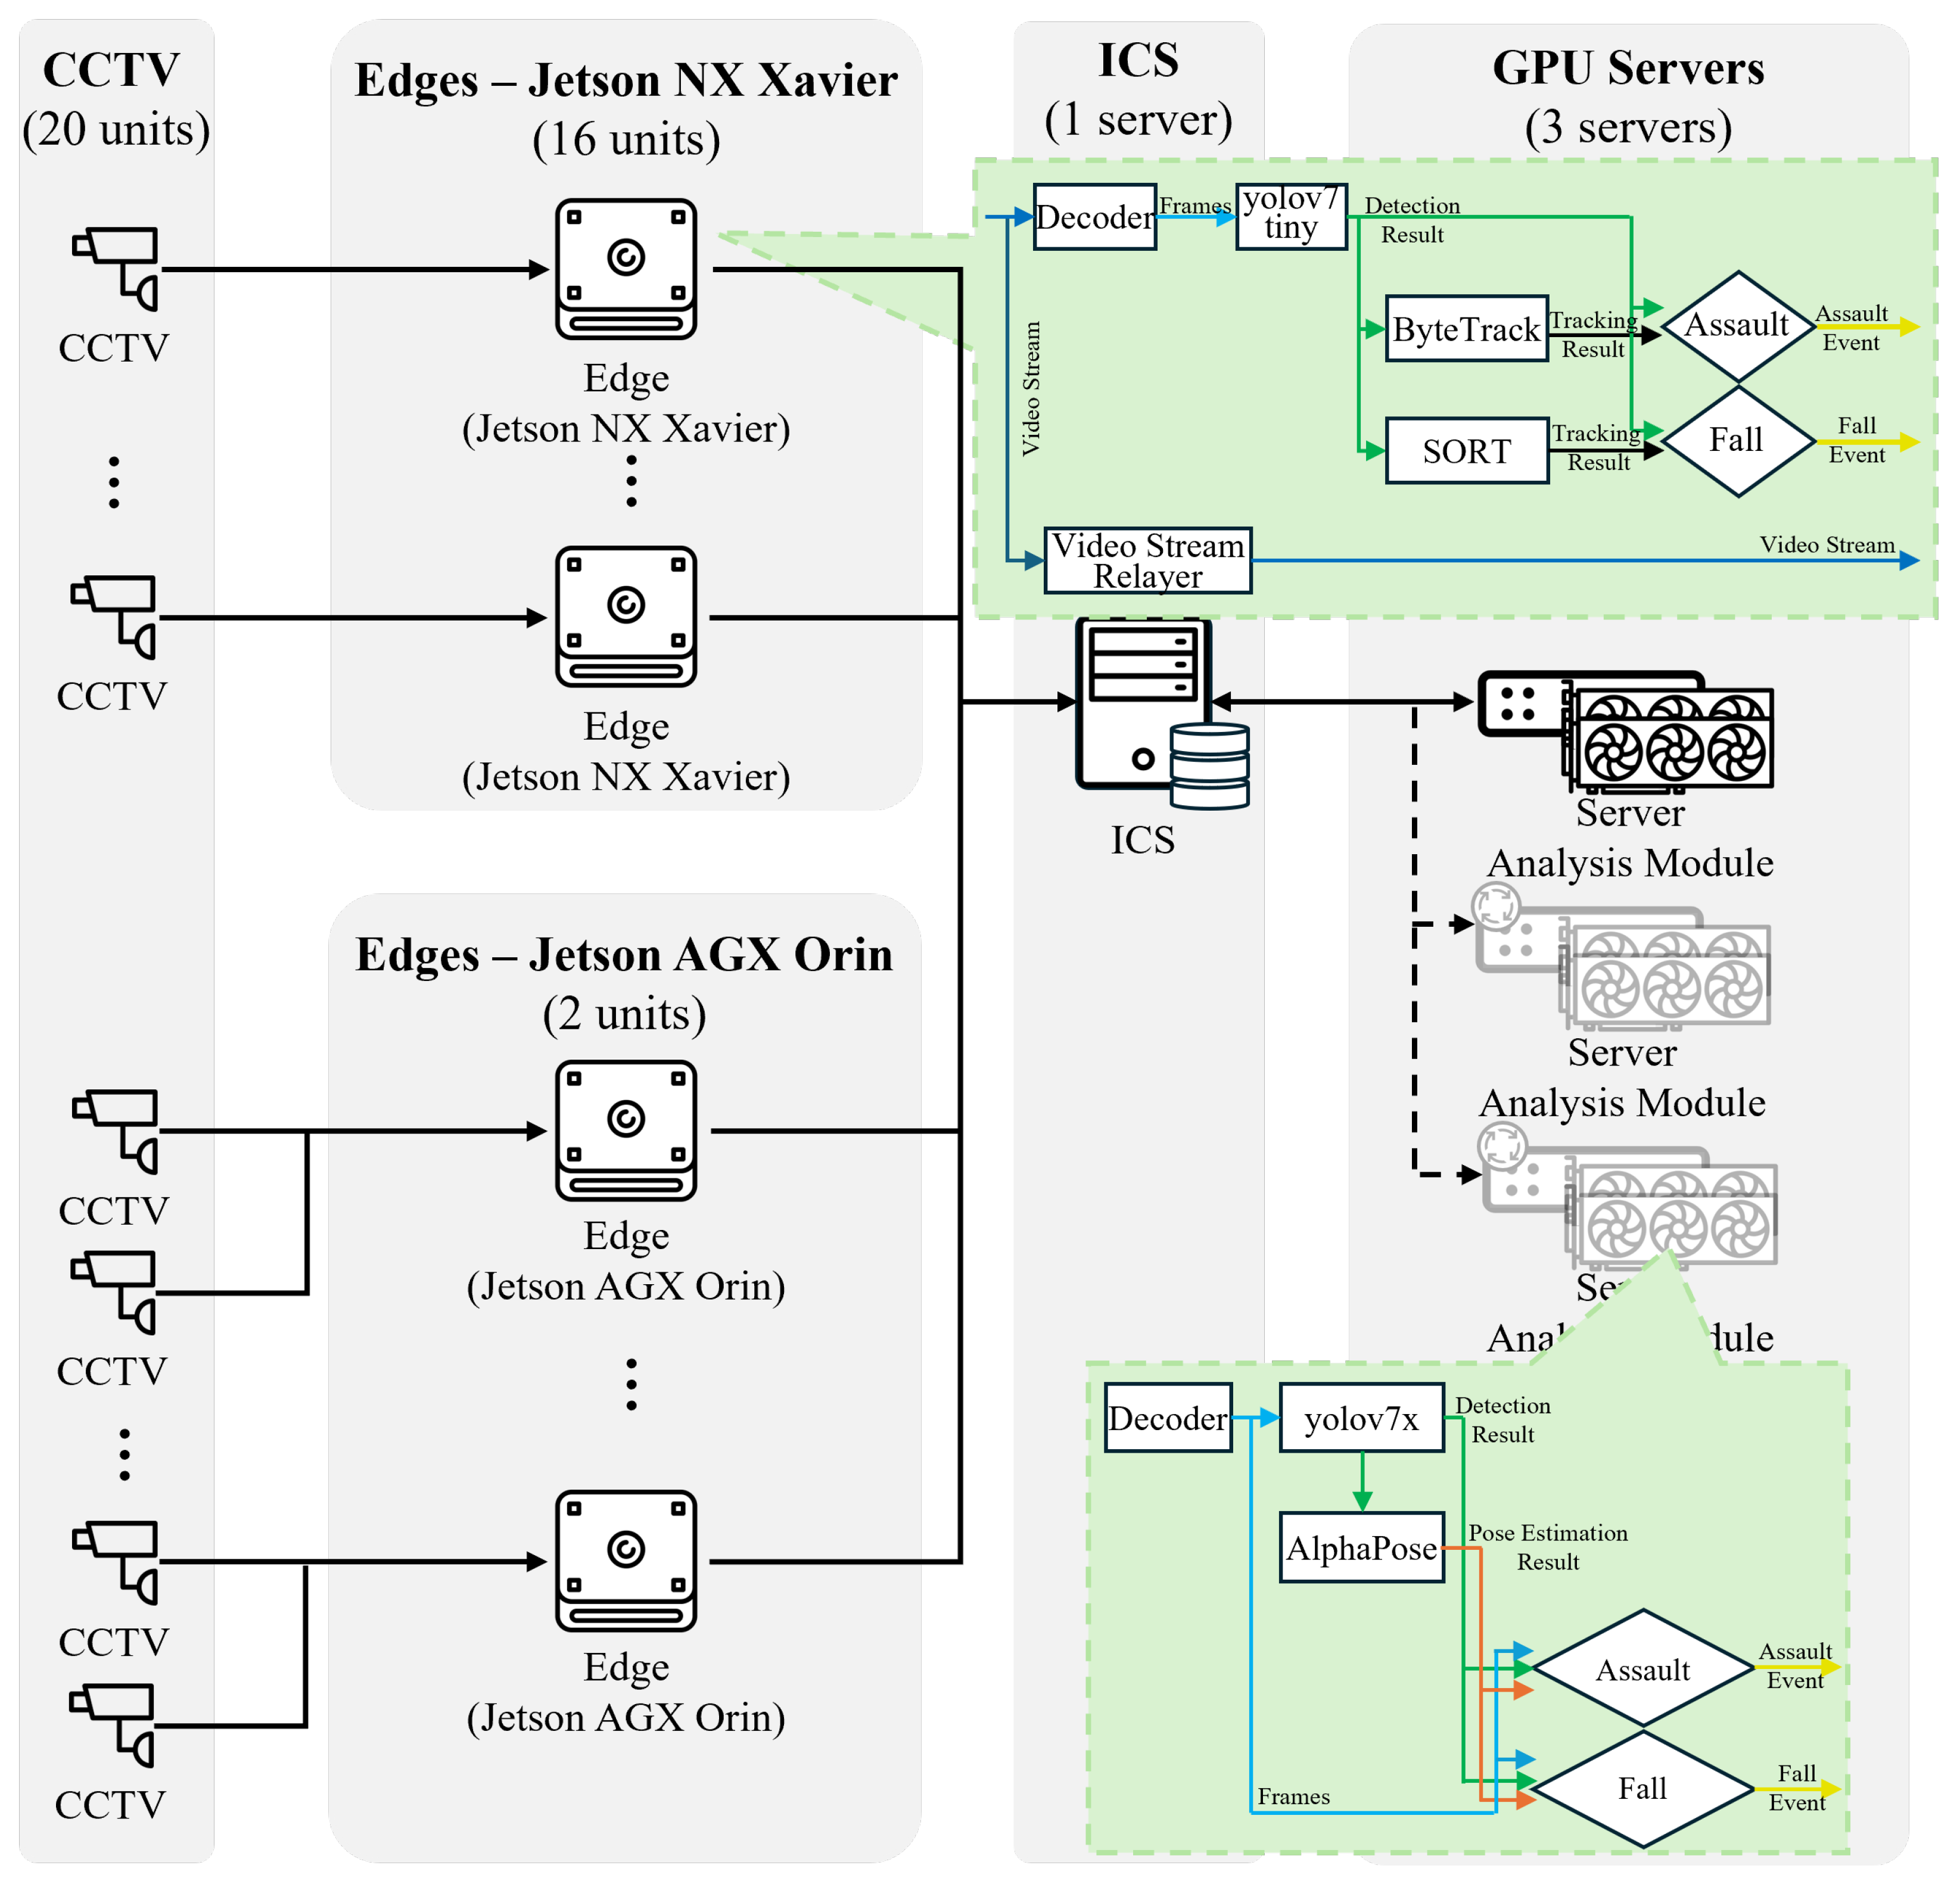
3.2. Application of the Proposed System
4. Experiments
4.1. Experimental Environment
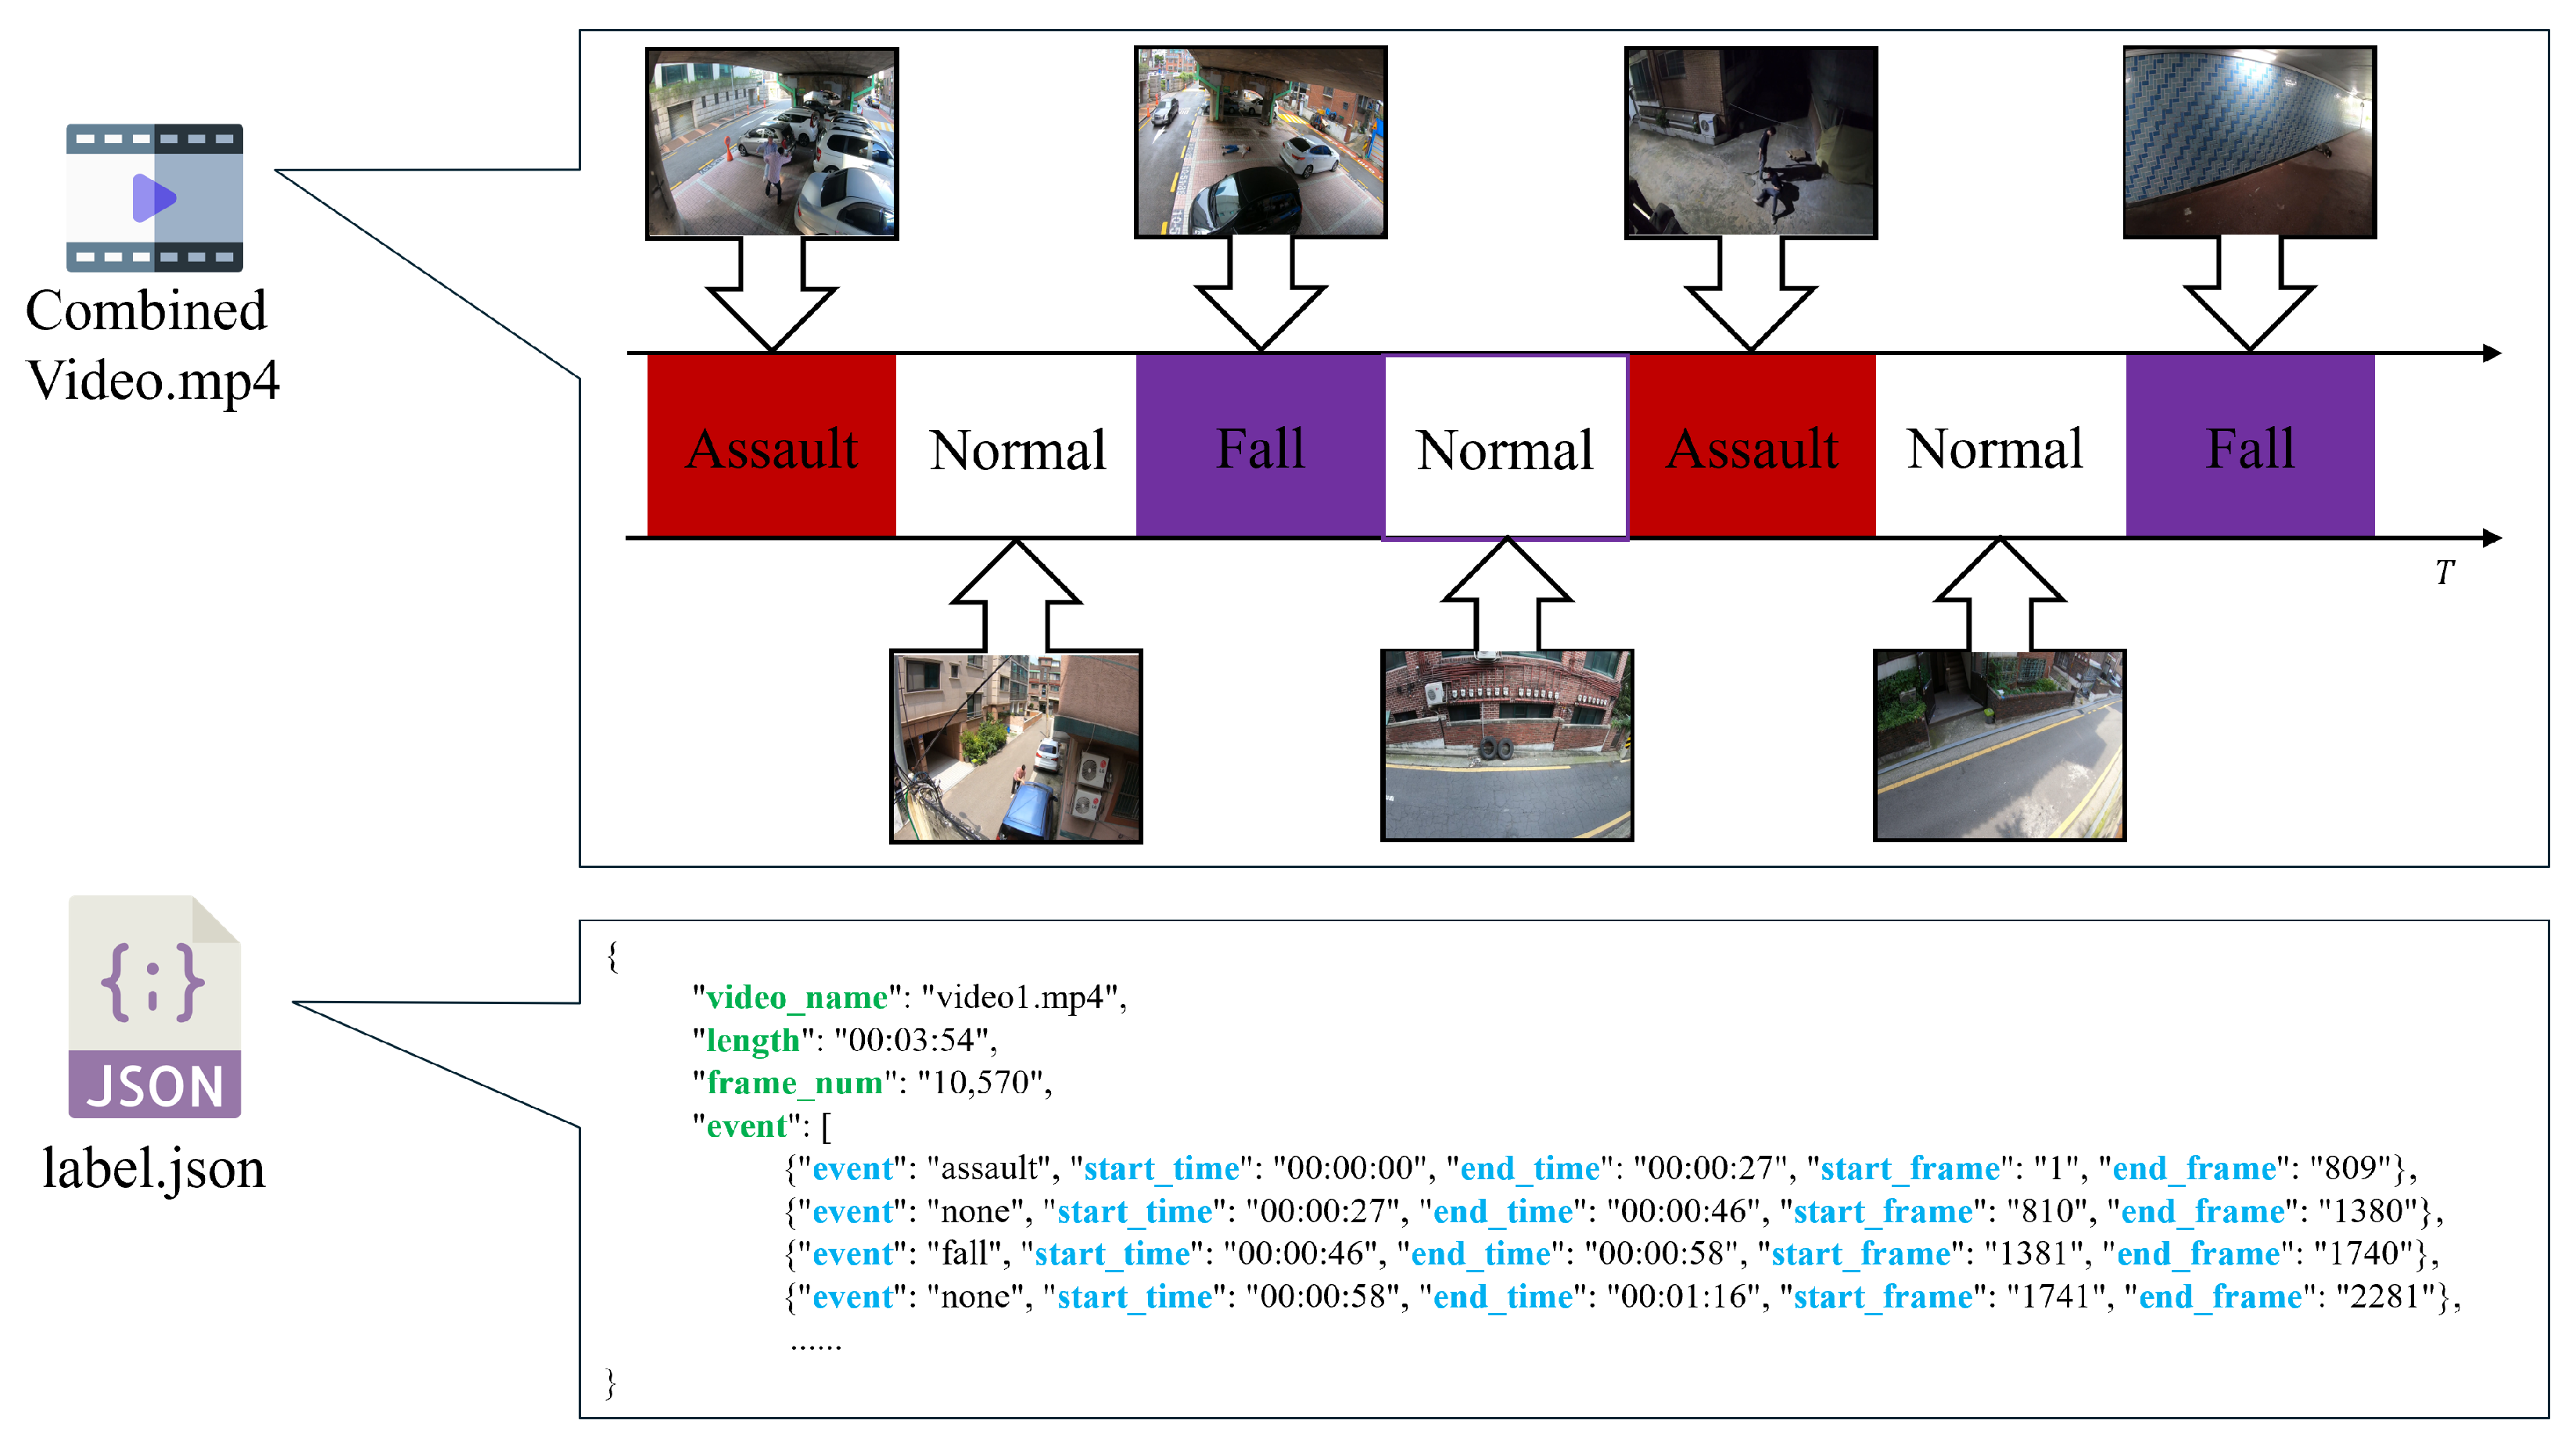
4.2. Datasets
4.3. System Efficiency Analysis and Performance Comparison
5. Discussion
6. Conclusions
Author Contributions
Funding
Institutional Review Board Statement
Informed Consent Statement
Data Availability Statement
Conflicts of Interest
Abbreviations
| CCTV | closed-circuit television |
| CNN | convolutional neural network |
| 3D CNN | three-dimensional convolutional neural network |
| ABER | abnormal behavior event receiver |
| ICS | integration control server |
| SATS | server analysis task scheduler |
| VSM | video storage manager |
| RND | result notification dispatcher |
References
- Ugli, D.B.R.; Kim, J.; Mohammed, A.F.; Lee, J. Cognitive video surveillance management in hierarchical edge computing system with long short-term memory model. Sensors 2023, 23, 2869. [Google Scholar] [CrossRef]
- Song, L.K.; Li, X.Q.; Zhu, S.P.; Choy, Y.S. Cascade ensemble learning for multi-level reliability evaluation. Aerosp. Sci. Technol. 2024, 148, 109101. [Google Scholar] [CrossRef]
- Zhang, J.; Tian, J.; Alcaide, A.M.; Leon, J.I.; Vazquez, S.; Franquelo, L.G.; Luo, H.; Yin, S. Lifetime extension approach based on levenberg-marquardt neural network and power routing of dc-dc converters. IEEE Trans. Power Electron. 2023, 38, 10280–10291. [Google Scholar] [CrossRef]
- Zhang, J.; Tian, J.; Yan, P.; Wu, S.; Luo, H.; Yin, S. Multi-hop graph pooling adversarial network for cross-domain remaining useful life prediction: A distributed federated learning perspective. Reliab. Eng. Syst. Saf. 2024, 244, 109950. [Google Scholar] [CrossRef]
- Li, X.; Lv, S.; Zhang, J.; Li, M.; Rodriguez-Andina, J.J.; Qin, Y.; Yin, S.; Luo, H. FDGR-Net: Feature Decouple and Gated Recalibration Network for medical image landmark detection. Expert Syst. Appl. 2024, 238, 121746. [Google Scholar] [CrossRef]
- Ali, M.; Goyal, L.; Sharma, C.M.; Kumar, S. Edge-Computing-Enabled Abnormal Activity Recognition for Visual Surveillance. Electronics 2024, 13, 251. [Google Scholar] [CrossRef]
- Lee, H.; Cho, H.; Noh, B.; Yeo, H. NAVIBox: Real-Time Vehicle–Pedestrian Risk Prediction System in an Edge Vision Environment. Electronics 2023, 12, 4311. [Google Scholar] [CrossRef]
- Graves, A. Long short-term memory. In Supervised Sequence Labelling with Recurrent Neural Networks; Springer: Berlin/Heidelberg, Germany, 2012; pp. 37–45. [Google Scholar]
- Yao, S.; Ardabili, B.R.; Pazho, A.D.; Noghre, G.A.; Neff, C.; Tabkhi, H. Integrating AI into CCTV Systems: A Comprehensive Evaluation of Smart Video Surveillance in Community Space. arXiv 2023, arXiv:2312.02078. [Google Scholar]
- Zahrawi, M.; Shaalan, K. Improving video surveillance systems in banks using deep learning techniques. Sci. Rep. 2023, 13, 7911. [Google Scholar] [CrossRef] [PubMed]
- Lee, S.; Park, R.; Park, H.M. Robust and Efficient Road-view CCTV Video Violence Detection Method. J. Inst. Electron. Inf. Eng. 2023, 60, 631–641. [Google Scholar]
- Moon, S.; Yang, C.; Kang, S.J. Real-time Detection of Specific Events: A Case Study of Detecting Falls. IEIE Trans. Smart Process. Comput. 2023, 12, 171–177. [Google Scholar] [CrossRef]
- Wang, C.Y.; Bochkovskiy, A.; Liao, H.Y.M. YOLOv7: Trainable bag-of-freebies sets new state-of-the-art for real-time object detectors. In Proceedings of the IEEE/CVF Conference on Computer Vision and Pattern Recognition, Vancouver, BC, Canada, 17–24 June 2023; pp. 7464–7475. [Google Scholar]
- Huang, T.; Han, Q.; Min, W.; Li, X.; Yu, Y.; Zhang, Y. Loitering detection based on pedestrian activity area classification. Appl. Sci. 2019, 9, 1866. [Google Scholar] [CrossRef]
- Mehmood, A. Abnormal behavior detection in uncrowded videos with two-stream 3D convolutional neural networks. Appl. Sci. 2021, 11, 3523. [Google Scholar] [CrossRef]
- Ullah, F.U.M.; Ullah, A.; Muhammad, K.; Haq, I.U.; Baik, S.W. Violence detection using spatiotemporal features with 3D convolutional neural network. Sensors 2019, 19, 2472. [Google Scholar] [CrossRef] [PubMed]
- Salimi, M.; Machado, J.J.; Tavares, J.M.R. Using deep neural networks for human fall detection based on pose estimation. Sensors 2022, 22, 4544. [Google Scholar] [CrossRef] [PubMed]
- Hwang, Y.; Song, J.; Nang, J. Development of Risky Objects to Pedestrian Detector based on Deep-Learning for Night Time CCTV Video Analysis. In Proceedings of the KIISE Korea Software Congress, Pyeongchang, Republic of Korea, 20–22 December 2021; pp. 407–409. [Google Scholar]
- Moon, H.; Song, J.; Nang, J. How to Augment your Dataset to Recognize Small Ojects in CCTV Footage Dataset Enrichment Methods for Recognizing Small Objects. In Proceedings of the the KIISE Korea Computer Congress, Jeju, Republic of Korea, 18–20 June 2023; pp. 970–972. [Google Scholar]
- NVIDIA Corporation. NVIDIA TensorRT Documentation. 2024. Available online: https://docs.nvidia.com/deeplearning/tensorrt/ (accessed on 3 April 2024).
- Zhang, Y.; Sun, P.; Jiang, Y.; Yu, D.; Weng, F.; Yuan, Z.; Luo, P.; Liu, W.; Wang, X. Bytetrack: Multi-object tracking by associating every detection box. In Proceedings of the European Conference on Computer Vision, Tel Aviv, Israel, 23–27 October 2022; Springer: Cham, Switzerland, 2022; pp. 1–21. [Google Scholar]
- Bewley, A.; Ge, Z.; Ott, L.; Ramos, F.; Upcroft, B. Simple online and realtime tracking. In Proceedings of the 2016 IEEE international conference on image processing (ICIP), Phoenix, AZ, USA, 25–28 September 2016; IEEE: Piscataway, NJ, USA, 2016; pp. 3464–3468. [Google Scholar]
- NVIDIA Corporation. NVIDIA DeepStream SDK Documentation. 2024. Available online: https://developer.nvidia.com/deepstream-sdk (accessed on 3 April 2024).
- Hwang, Y.; Song, J.; Nang, J.J. Development of Pose-based CCTV Video Behavior Classifier for Detecting Violent Events. In Proceedings of the the KIISE Korea Computer Congress, Jeju, Republic of Korea, 29 June–1 July 2022; pp. 948–950. [Google Scholar]
- Fang, H.S.; Li, J.; Tang, H.; Xu, C.; Zhu, H.; Xiu, Y.; Li, Y.L.; Lu, C. Alphapose: Whole-body regional multi-person pose estimation and tracking in real-time. IEEE Trans. Pattern Anal. Mach. Intell. 2022, 45, 7157–7173. [Google Scholar] [CrossRef] [PubMed]
- Artificial Intelligence Hub Korea. AIhub Abnormal Behavior CCTV Dataset. 2021. Available online: https://aihub.or.kr/aihubdata/data/view.do?currMenu=115&topMenu=100&aihubDataSe=realm&dataSetSn=171 (accessed on 1 April 2024).
- Artificial Intelligence Hub Korea. AIhub Subway Dataset. 2021. Available online: https://www.aihub.or.kr/aihubdata/data/view.do?currMenu=115&topMenu=100&dataSetSn=174 (accessed on 1 April 2024).
- Artificial Intelligence Hub Korea. AIhub Abnormal Behavior in Residential and Public Spaces Dataset. 2021. Available online: https://aihub.or.kr/aihubdata/data/view.do?currMenu=115&topMenu=100&dataSetSn=515 (accessed on 1 April 2024).
- Cheng, M.; Cai, K.; Li, M. RWF-2000: An Open Large Scale Video Database for Violence Detection. arXiv 2019, arXiv:1911.05913. [Google Scholar]
- An, J.; Kim, J.; Lee, H.; Kim, J.; Kang, J.; Shin, S.; Kim, M.; Hong, D.; Woo, S.S. VFP290k: A large-scale benchmark dataset for vision-based fallen person detection. In Proceedings of the Thirty-Fifth Conference on Neural Information Processing Systems Datasets and Benchmarks Track (Round 2), Virtual, 6 December 2021. [Google Scholar]
- University of Rzeszow. UR Fall Detection Dataset. Available online: http://fenix.ur.edu.pl/~mkepski/ds/uf.html (accessed on 1 April 2024).


| Event | Dataset | Number of Videos | Video Length |
|---|---|---|---|
| Assault | AI Hub CCTV Abnormal Behavior [26] | 2780 | 235 h |
| AI Hub Subway [27] | 6510 | 98 h | |
| AI Hub Residential [28] | 3579 | 95 h | |
| RWF-2000 [29] | 2000 | 3 h | |
| Fall | VFP290K [30] | 178 | 2 h |
| URFD [31] | 70 | 0.1 h | |
| AI Hub Abnormal Behavior CCTV [26] | 912 | 84 h |
| Dataset | AI Hub Abnormal Behavior CCTV [26] | AI Hub Subway [27] | AI Hub Residential [28] | RWF-2000 [29] | VFP290K [30] | URFD [31] | Combined Video |
|---|---|---|---|---|---|---|---|
| Number of videos | 190 | 90 | 90 | 100 | 100 | 70 | 64 |
| Device | Engine | Processing Time | ||||
|---|---|---|---|---|---|---|
| Type | Name | Minimum Required fps | 1 Frame (ms) | Total | ||
| Time (ms) | fps | |||||
| Edge (Jetsont NX Xavier) | Decoder | NVDEC | - | 0.925 | 47.430 | 21.083 |
| Object Detection | YOLOv7-tiny TRT | - | 43.171 | |||
| Object Tracking | ByteTrack | - | 1.736 | |||
| SORT | - | 1.112 | ||||
| Abnormal Behavior Detection | Assault | 20 | 0.352 | |||
| Fall | 20 | 0.134 | ||||
| Edge (Jetson AGX Orin) | Decoder | NVDEC | - | 0.925 | 23.998 | 41.670 |
| Object Detection | YOLOv7-tiny TRT | - | 19.702 | |||
| Object Tracking | ByteTrack | - | 1.714 | |||
| SORT | - | 1.143 | ||||
| Abnormal Behavior Detection | Assault | 20 | 0.345 | |||
| Fall | 20 | 0.169 | ||||
| GPU Server | Decoder | FFmpeg | - | 1.133 | 47.163 | 21.203 |
| Object Detection | YOLOv7x | - | 7.441 | |||
| Pose Estimation | AlphaPose | - | 12.279 | |||
| Abnormal Behavior Detection | Assault | 10 | 25.293 | |||
| Fall | 10 | 1.017 | ||||
| Abnormal Behavior | Type | Number of Units | Video Length × CCTV | Proc. Time (s) | TP | FP | FN | Recall | Precision | F1 |
|---|---|---|---|---|---|---|---|---|---|---|
| Assault | Standalone Edge | 18 Edge | 313 × 20 | 294 | 288 | 70 | 32 | 0.899 | 0.803 | 0.848 |
| Standalone Server | 3 Server | 313 × 20 | 1040 | 297 | 51 | 23 | 0.929 | 0.853 | 0.889 | |
| Integrated edge–server (Ours) | 18 Edge + 3 Server | 313 × 20 | 314 | 286 | 40 | 21 | 0.932 | 0.877 | 0.904 | |
| Fall | Standalone Edge | 18 Edge | 313 × 20 | 294 | 249 | 21 | 23 | 0.915 | 0.921 | 0.918 |
| Standalone Server | 3 Server | 313 × 20 | 1040 | 241 | 15 | 21 | 0.906 | 0.941 | 0.923 | |
| Integrated edge–server (Ours) | 18 Edge + 3 Server | 313 × 20 | 314 | 225 | 10 | 18 | 0.926 | 0.958 | 0.942 |
| Abnormal Behavior | Day or Night | Type | TP | FP | FN | Recall | Precision | F1 Score |
|---|---|---|---|---|---|---|---|---|
| Assault | Day | Standalone Edge | 192 | 41 | 27 | 0.875 | 0.824 | 0.849 |
| Standalone Server | 199 | 39 | 10 | 0.954 | 0.836 | 0.891 | ||
| Integrated edge–server (Ours) | 190 | 27 | 14 | 0.931 | 0.8756 | 0.902 | ||
| Night | Standalone Edge | 96 | 29 | 5 | 0.950 | 0.764 | 0.847 | |
| Standalone Server | 98 | 12 | 13 | 0.881 | 0.888 | 0.884 | ||
| Integrated edge–server (Ours) | 96 | 13 | 7 | 0.933 | 0.880 | 0.906 | ||
| Fall | Day | Standalone Edge | 166 | 14 | 15 | 0.915 | 0.922 | 0.918 |
| Standalone Server | 157 | 12 | 16 | 0.909 | 0.929 | 0.919 | ||
| Integrated edge–server (Ours) | 146 | 5 | 18 | 0.891 | 0.967 | 0.928 | ||
| Night | Standalone Edge | 83 | 7 | 8 | 0.917 | 0.919 | 0.918 | |
| Standalone Server | 84 | 3 | 5 | 0.940 | 0.966 | 0.953 | ||
| Integrated edge–server (Ours) | 79 | 5 | 0 | 0.997 | 0.941 | 0.968 |
Disclaimer/Publisher’s Note: The statements, opinions and data contained in all publications are solely those of the individual author(s) and contributor(s) and not of MDPI and/or the editor(s). MDPI and/or the editor(s) disclaim responsibility for any injury to people or property resulting from any ideas, methods, instructions or products referred to in the content. |
© 2024 by the authors. Licensee MDPI, Basel, Switzerland. This article is an open access article distributed under the terms and conditions of the Creative Commons Attribution (CC BY) license (https://creativecommons.org/licenses/by/4.0/).
Share and Cite
Song, J.; Nang, J. Pedestrian Abnormal Behavior Detection System Using Edge–Server Architecture for Large–Scale CCTV Environments. Appl. Sci. 2024, 14, 4615. https://doi.org/10.3390/app14114615
Song J, Nang J. Pedestrian Abnormal Behavior Detection System Using Edge–Server Architecture for Large–Scale CCTV Environments. Applied Sciences. 2024; 14(11):4615. https://doi.org/10.3390/app14114615
Chicago/Turabian StyleSong, Jinha, and Jongho Nang. 2024. "Pedestrian Abnormal Behavior Detection System Using Edge–Server Architecture for Large–Scale CCTV Environments" Applied Sciences 14, no. 11: 4615. https://doi.org/10.3390/app14114615
APA StyleSong, J., & Nang, J. (2024). Pedestrian Abnormal Behavior Detection System Using Edge–Server Architecture for Large–Scale CCTV Environments. Applied Sciences, 14(11), 4615. https://doi.org/10.3390/app14114615