Abstract
The flow-induced vibration characteristic of the U-section rubber outer windshield structure of high-speed train is the key factor to limit its high-speed movement. Accurate and effective flow-induced vibration analysis of windshield structures is an important topic. In this paper, a hybrid modeling method for the analysis of flow-induced vibration of windshield structure is innovatively proposed for the U-section rubber windshield system of high-speed train. The method uses the external aerodynamic load obtained by aerodynamic simulation as the input condition of the flow-induced vibration model, and maps the aerodynamic load to the structural dynamics model characterized by the modal test data of the windshield structure. The flow-induced vibration model is established by means of modal superposition method and the time-domain response is effectively integrated by Runge Kutta method with variable step size. The results show that this method can effectively simulate the flow induced vibration of the wind baffle structure, and the real-time relationship between the aerodynamic load and the modal characteristics of the structure and the response of displacement and velocity can be obtained. On this basis, the comprehensive dynamic performance of the windshield system of high-speed trains at 400 km/h under external aerodynamic load is studied, that is, the force, displacement and velocity variation rules of the flexible structure are examined. It is determined that the displacement and velocity response curve of the measuring point near the lower side of the U-section rubber outer windshield is significantly higher than that of other parts. Moreover, the contribution of the first mode to the dynamic response of the structure is very obvious. This method provides an efficient calculation method for analyzing the flow-induced vibration characteristics of complex flexible structures.
1. Introduction
The windshield system is a flexible structure connecting the two car ends of the high-speed train, usually composed of outer windshield and inner windshield. The design of the windshield system reduces not only the aerodynamic resistance of train operation but also the aerodynamic noise of the connection between the two car ends [1,2,3,4,5,6]. According to the train operation and maintenance data, once the train operating speed increases, the aerodynamic effect surges, and the lightweight design requirements make the windshield system more sensitive to flow-induced vibration [7,8,9,10,11,12,13], which intensifies the flow-induced vibration phenomenon of the outer windshield structure, and the windshield is obviously turned out or even torn. Therefore, when designing a higher speed train, the flow-induced vibration characteristics of the windshield system are a key design consideration [3,14,15,16,17,18,19,20].
In the current study, the analysis methods related to flow-induced vibration are roughly divided into two categories [13,21,22,23,24,25,26,27,28]. (1) Means of monitoring analysis through experiments. Cai Jianming et al. [29] determined in the following test that the U-shaped rubber outer windshield of some high-speed trains had a gap between the windshield connection between the two cars due to the installation process problem. When the train runs at a high speed, high-frequency vibrations occur at the inner windshield at the end of the train where there is a gap in the outer windshield. Wang Haiyan et al. [30] conducted a modal test on the inner windshield of high-speed trains with a speed of 350 km/h, and obtained the vibration characteristics of the inner windshield. The modal test was combined with the real vehicle dynamic test to compare and analyze the dynamic influence of the outer windshield on the inner windshield under the condition of with or without gaps in the outer windshield. Li Suxuan et al. [31] studied the vibration and deformation causes of the outer windshield with a maximum speed of 350 km/h, and analyzed the abnormal vibration and high noise of the inner windshield in detail through experiments and data analysis. However, due to the relatively high cost of experimental testing, it is only suitable for testing of finished products, not for the design stage. (2) Modeling and simulation analysis with the help of commercial software. With the improvement of computer performance and the rapid development of computational mechanics, numerical calculation methods have gradually become a very important research method in train aerodynamics. The numerical calculation method can analyze the influence of a certain parameter separately, which is a very important research method in train aerodynamics. Numerical calculation methods are much more convenient, cheaper, and can consider a variety of situations separately, which is why they are the most widely used research methods. Many scholars have carried out extensive research on train aerodynamics based on numerical calculation methods. Liu Zhen et al. [32] conducted a fatigue life analysis under aerodynamic load on the CRH2-300 EMU rubber windshield, which was used to explore the problem of cracks in the rubber outer windshield. Wang et al. [33] used the FLDutil module of the fluid software SC/Tetra (version 11.0) and the input port of the analysis software Ansys (version 10.0) to analyze the load of the high-speed trains to obtain its response and analyze the vibration situation. Miao [34] used three-dimensional numerical methods to discuss the influence of four schemes: full enveloping windshield, top open windshield, bottom open windshield, and top end and low end simultaneous opening windshield on the aerodynamic performance of high-speed trains, and obtained the aerodynamic loads of the following trains under different schemes. Long [35] used the Naiver–Stokes equation and the k-ε turbulence model to numerically simulate and calculate the aerodynamic characteristics of high-speed trains on flat ground, bridges, cuttings and embankments, and obtained the aerodynamic load of high-speed trains in this driving environment. Wang [36] established a train aerodynamic model to study the aerodynamic characteristics of high-speed trains under the action of two different lateral winds: average wind and index wind. Ouyang [37] used hybrid LES/APE method to simulate the unsteady flow field and the near-field aerodynamic noise of a 1/25 scale eight-coach high-speed train in long tunnel to study the changes in sound pressure in different cases, including tunnel with fully reflective walls and tunnel with fully absorptive walls and open air. S. Maleki et al. [38] used various turbulence modeling approaches including ELES, SAS, URANS and RANS to predict the aerodynamic flow around a double-stacked freight wagon. A. Premoli [39] used computational fluid dynamics to investigate the effect of the relative motion between train and infrastructure scenario.
However, the windshield material, structure and connection are complex, which not only makes it difficult to model accurately, but also increases the number of modeling degrees of freedom. In addition, the calculation time and efficiency of this method are low, so it is difficult to apply it well to the dynamic response and fluid-structure interaction analysis of windshield system, and it is also difficult to apply it to the optimization design or selection stage. In summary, it is difficult to analyze the flow-induced vibration characteristics of the windshield system quickly and accurately according to the existing research methods.
The windshield structure in this paper is modeled by mode superposition method based on the results of modal test, which is different from the previous works based on finite element simulations. On the one hand, the current experiment-based model can represent the dynamic characteristics of the windshield structure accurately without the need for cumbersome and complicated structural modeling processes. On the other hand, by using the mode superposition method, the computational efficiency of flow-induced vibration simulation is greatly increased. At the same time, due to the application of the mode superposition method, the aerodynamic loads under different operating conditions can be mapped to the structural nodes easily. In general, this method provides an efficient and reliable tool for the simulation of flow-induced vibration of complex flexible structures.
In this paper, a method is proposed to establish a flow-induced vibration simulation model of windshield structure based on modal superposition method and then analyze the flow-induced vibration characteristics of windshield structure by using aerodynamic simulation data combined with structural modal test data as input, and the specific principle is shown in Figure 1.
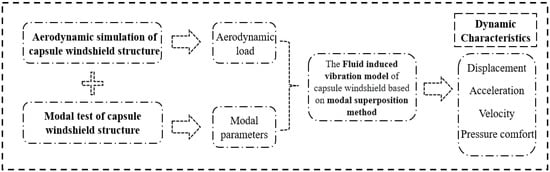
Figure 1.
Schematic diagram of U-section rubber outer windshield structure flow-induced vibration analysis.
The rest of this paper is organized as follows: Section 2 introduces the aerodynamic simulation analysis and surface aerodynamic load extraction of U-section rubber windshield. In Section 3, the modal experiment of U-section rubber outer windshield structure and the analysis of the results are briefly summarized. In Section 4, the flow-induced vibration hybrid simulation method of U-section rubber outer windshield is introduced in detail. In Section 5, based on the simulation method proposed in this paper, the dynamic response of U-section rubber windshield was analyzed. Combined with the natural frequency of the outer windshield, the vibration mechanism and vibration characteristics of the outer windshield are summarized and discussed. Finally, Section 6 summarizes this research.
2. Extraction of Aerodynamic Load on U-Section Rubber Outer Windshield
In this section, an aerodynamic model of the U-section rubber outer windshield of high-speed train is developed, and the modelling process and the analysis of the aerodynamic load characteristics on the windshield surface are briefly described. In addition to this, an integration method for the aerodynamic loads is also presented.
2.1. Geometric Model and Computational Setup
To reduce the amount of calculation, the aerodynamic simulation model of the U-section rubber outer windshield adopts a three-car marshaling test train, including the head, middle and tail trains, and two groups of outer windshield structures. The middle section of the train remains unchanged, and the shortened model has relatively little effect on the flow field structure at the first windshield of the train [40]. During the numerical simulation, the modeling is carried out in strict accordance with the installation and size of the internal and outer windshields of the test train. In addition, the train’s height H = 4.0 m is selected as the characteristic length, the width of the train is 0.8 H, and the length of the train is 20.8 H. The established model of the high-speed train is shown in Figure 2.
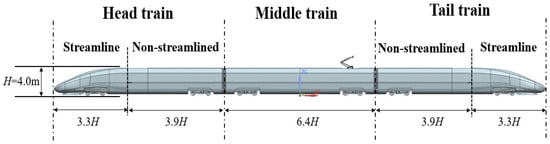
Figure 2.
Geometric model of the train.
The high-speed train adopts a U-section rubber outer windshield with two windshield opening positions at the lower end and a total of four U-section rubber elements. The U-section rubber outer windshield structure is shown in Figure 3.
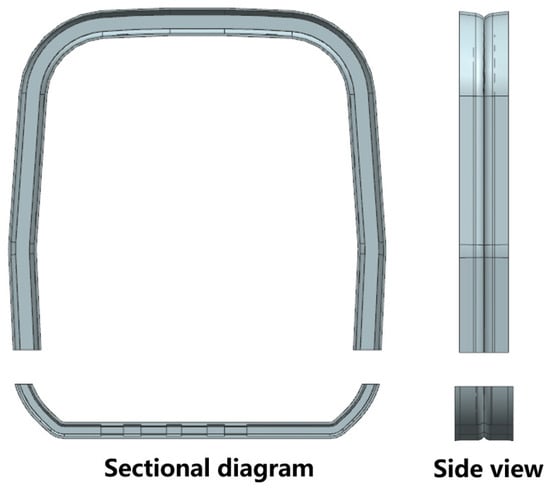
Figure 3.
Geometric model of U-section rubber outer windshield.
The commercial software STRA-CCM+ (version 2020.3) is used to simulate the flow of the high-speed train in open line. The calculation area is shown in Figure 4. The calculation domain is 66.4 H long, 20 H wide and 15 H high. The nose tip of the head train is 18 H from the entrance of the calculation domain, and the nose tip of the tail train is 30 H from the exit of the calculation domain. The train is located in the middle of the calculation domain, and the lowest point of the wheelset is 0.05 H from the ground. The size ratio of the model to the actual high-speed train is 1:8.
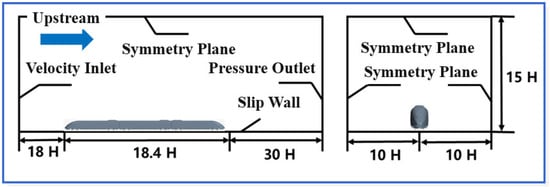
Figure 4.
Computational domain.
The velocity inlet boundary condition is adopted at the inlet of the calculation domain, and the incoming flow velocity is set as 111 m/s. Pressure outlet boundary conditions are adopted at the outlet. The ground is set as a no-slip boundary condition, the velocity is consistent with the incoming flow velocity, and the rest are set to symmetry plane boundary conditions. The entire computing area grid is divided by tetrahedral mesh, and the total number of meshes is about 75 million; Figure 5 is a grid schematic. Three layers of nested encryption areas are set near the train’s body, and the maximum grid scale is set to 200 mm, 400 mm, and 600 mm, respectively. Grid encryption is carried out on the train’s body, bogie, windshield and other areas to ensure the accuracy of calculation. A 15-layer grid is set on the surface of the train body, windshield and pantograph. The first layer grid thickness is set to 0.02 mm, with a growth rate of 1.2, and the thickness of the first layer of the other surfaces is set to 0.05 mm, with a growth rate of 1.2. Overall, y+ is around 1, which meets the requirements of turbulence calculation [41,42,43,44].
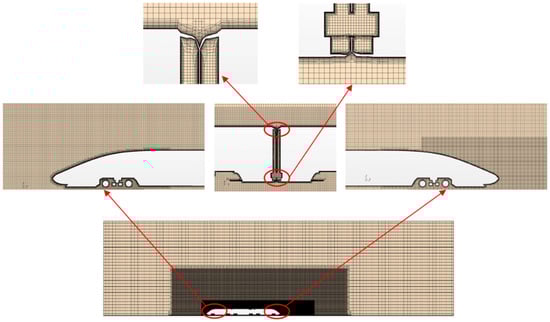
Figure 5.
Computational grids.
For high-Reynolds-number flows, as the range for time and length scales that describe the flow depends on the Reynolds number, some level of turbulence modeling is required. The air flow around the train is highly turbulent, three-dimensional and time-dependent, and appropriate turbulence modeling is essential for accurate prediction. The model of train is 1:8 scaled, the implicit solution method pressure-based is selected for the constant flow field calculation, the SSTk − ω turbulence model is selected for numerical simulation, the SIMPLE algorithm is selected for pressure–velocity coupling, the pressure adopts Standard discrete format, and the convection term and dissipation term are adopted in the second-order windward discrete format. The unsteady flow field calculation adopts the LES method, and the discrete momentum equation adopts the bounded center difference format, with a time step of 5 × 10⁻⁵ s, and each step is iterated 20 times, for a total of 10,000 time steps.
In order to obtain the time history data of pulsating wind pressure of the flow field in the windshield area, the measurement points are arranged on the outer windshield of the train, and the three-group train has a total of two windshields, and a total of 479 measurement points are arranged on the inside and outside of each windshield. The aerodynamic measurement point arrangement is shown in Figure 6.
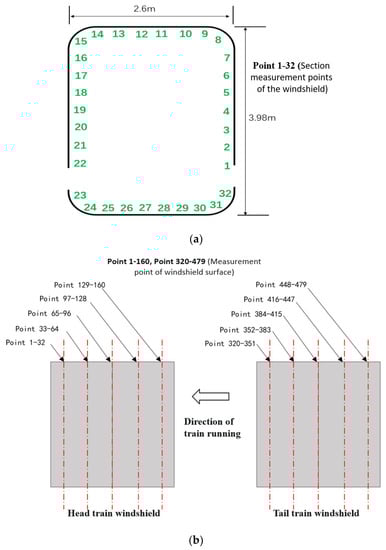
Figure 6.
Schematic diagram of outer windshield measurement points. (a) Measurement points arranged circumferentially along the windshield section. (b) Lateral arrangement of measuring points on the outer surface of windshield.
2.2. Data Analysis
This section introduces the aerodynamic pressure distribution of the windshield surface of the train and the extraction of the aerodynamic load of the surface measurement point. Pressure cloud diagram of cross-section and surface of U-section rubber outer windshield when the velocity of the train is 400 km/h in open line is shown in Figure 7 and Figure 8. Because the bottom of the windshield is close to the bogie area, and this area is similar to a groove, the speed of air decreases rapidly and the pressure value increases when the air flows through the windward side of bogie area. Through the arc connecting the wall and the train’s body, the incoming flow separates, the speed begins to increase rapidly, causing its pressure to decrease to a negative value. The upper side of the tail train is also affected by the separation of incoming flow in the pantograph area, showing partial negative pressure in the area.
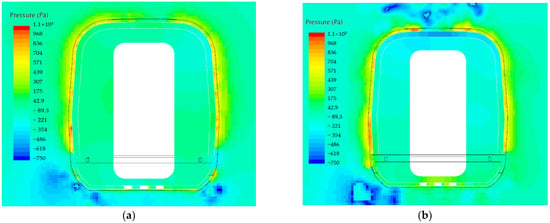
Figure 7.
Pressure diagram of outer windshield section at 400 km/h. (a) Pressure diagram of head train windshield section. (b) Pressure diagram of tail train windshield section.
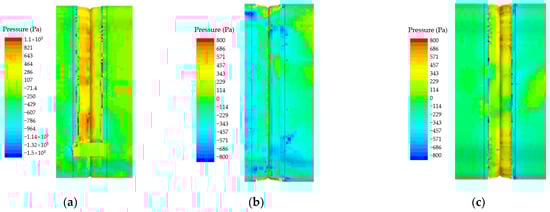
Figure 8.
Pressure diagram of U-section rubber outer windshield surface at 400 km/h. (a) Side pressure cloud. (b) Side pressure cloud. (c) Top pressure cloud.
Through the flow field simulation calculation, the time history data of aerodynamic pressure of all the windshield surface measurement points shown in Figure 6 can be obtained, and the pressure change curve of the measurement points at different positions of the head train’s windshield with time is shown in Figure 9, and it can be seen from the figure that the pressure amplitude of the bottom of the train is larger and the pressure amplitude of the top of the train is small. The pressure change curves of the measurement points at different positions of the windshield in the same horizontal plane are basically the same, and only the pressure amplitude at the peaks and troughs of the pressure wave is different.
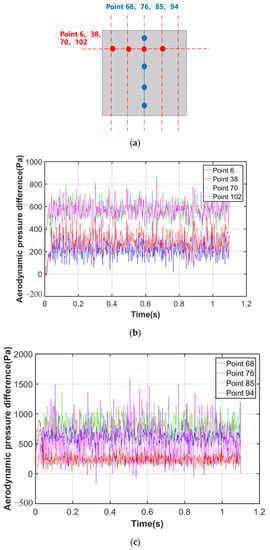
Figure 9.
Aerodynamic pressure difference between inside and outside surface at different measuring points of head train windshield. (a) The layout diagram of horizontal and longitudinal measurement points. (b) Comparison of aerodynamic pressure difference at horizontal measurement points. (c) Comparison of aerodynamic pressure difference at longitudinal measurement points.
Next, all aerodynamic data of measurement points is extracted, and the aerodynamic pressure of the measurement points is mapped to the structural modal measurement points by the method of interpolation integration.
2.3. Aerodynamic Load Integration
Flow-induced vibration analysis needs to correspond the aerodynamic load of the measurement point in the flow field analysis to the aerodynamic load of the modal test. According to the measurement point arranged during the modal test to divide the windshield structure into multiple area units, in order to ensure a more accurate description of the aerodynamic load, it is necessary to use as many measurement points as possible to study the change in the aerodynamic load of the external flow field to the structure, and load the measurement point in the aerodynamic simulation to the measurement point of the modal test through the difference integration method. The mapping is shown in Figure 10. The pressure per area unit can be obtained from the aerodynamic load and the unit area. The detailed steps are described below.
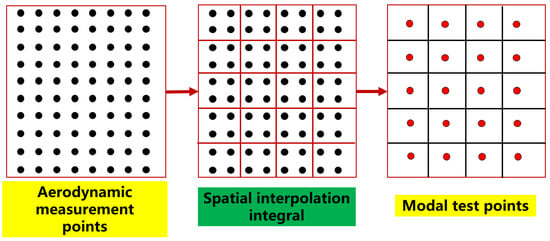
Figure 10.
Mapping between aerodynamic measuring points and modal measuring points.
The inner and outer structure of the windshield can be divided into four parts: upper, lower, left and right. Each part of the structure establishes x-y local coordinates. The coordinate positions corresponding to the aerodynamic simulation measurement points and modal test measurement points of each part are ensured. Aerodynamic measurement points are used to interpolate each area unit at different positions. Assuming n aerodynamic pressure values are interpolated within an area unit, the average pressure for that area unit is
The pressure of each area unit can be expressed as
where S is the area of the area unit.
3. Modal Experiment and Analysis of U-Section Rubber Outer Windshield Structure
In this section, the modal test method for U-section rubber outer windshield structures is presented and, based on this method, the natural frequencies, damping ratios and modal shapes of the windshield structures are obtained.
3.1. Test Object, Measurement Point and Excitation Point Arrangement
Hammer method was used to test the structural modes, and signals were collected by force sensor (force hammer) and acceleration sensor (measuring point). The lateral part of the structure of the outer windshield was selected as the main test object in this test (see Figure 11a). The thickness of the root of the U-section rubber is 18 mm, the overall width of the U-section rubber is 240 mm, and there is a pretension between the two U-section rubbers. Twenty measuring points are arranged on the side of the windshield (see red numbers Figure 11d). Three sets of tests were carried out at three different excitation points, which were above point 7, in the middle of point 14 and 15, and on the upper side of point 10, as shown by the yellow five-pointed star in Figure 11d.
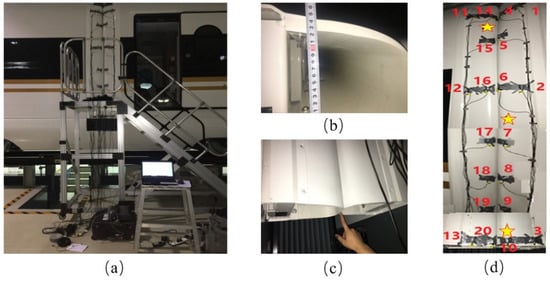
Figure 11.
U-section rubber outer windshield structure and lateral part of the measurement points (red number) and excitation points (yellow five-pointed star) schematic. (a) The layout diagram of the modal experiment of the outer windshield. (b) The bottom section of the outer windshield. (c) The bottom of outer windshield. (d) The measurement points (red number) and excitation points (yellow five-pointed star).
3.2. Modal Analysis
After data of modal test collection, LMS PolyMAX module was used for mode extraction. The peaks with relatively concentrated S value (the mode with stable frequency, damping value and vector) were selected as the mode frequency, and the corresponding mode shapes of each order were extracted. In the modal test of the lateral part of the outer windshield structure, the results of the test under three different excitation points also have a good agreement. Based on the data measured at these excitation points, the first nine natural frequencies and damping ratios of the lateral part of the outer windshield can be obtained, as shown in Table 1, and the corresponding mode shapes of the first six modes are shown in Figure 12. The common point of the first four modes is large amplitude in the middle and small amplitude on both sides (connecting with the end wall of the train).

Table 1.
Modal frequency and damping ratio of outer windshield.
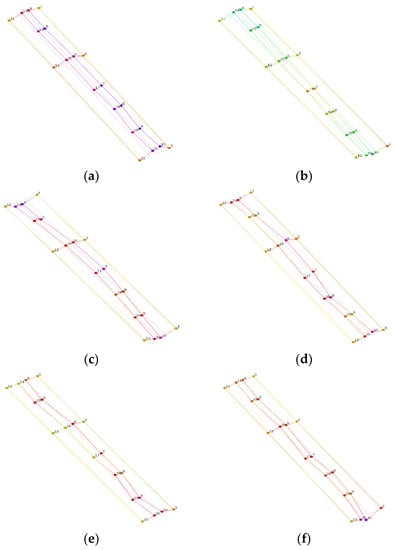
Figure 12.
The first four mode shapes of the lateral part of the outer windshield structure. (a) = 12.02 Hz. (b) = 14.25 Hz. (c) = 18.31 Hz. (d) = 23.66 Hz. (e) = 26.72 Hz. (f) = 28.41 Hz. Nodes 1–20 correspond to the modal test points in Figure 11d and different colored lines represent the outer outline of the windshield structure.
4. Establishment of U-Section Rubber Outer Windshield Flow-Induced Vibration Response Analysis Method
In this section, based on the modal superposition method, the time course curves of the aerodynamic loads on the outer windshield surface in Section 2 and the modal parameters of the outer windshield structure in Section 3 are used as inputs to build a simulation model of the flow-induced vibration of the U-section rubber outer windshield. The dynamic response of the model is solved using the Runge–Kutta method. In addition to their mathematical formulation, the advantages of using each of these methods are also presented.
4.1. Flow-Induced Vibration Model Based on Mode Superposition Method of U-Section Rubber Outer Windshield Structure
The differential equation of motion for the outer windshield system can be expressed as
where is the mass matrix, is the damping matrix, is the stiffness matrix, all of them are square matrices of order n, n is the degree of freedom of the system. is the generalized force vector, representing the force on each degree of freedom. is the generalized displacement matrix of the system, in which each parameter represents the generalized displacement on the corresponding degree of freedom of the system. and represent the generalized velocity vector and the generalized acceleration vector, respectively.
Generally, the degrees of freedom of a multi-degree-of-freedom system are coupled to each other, its mass matrix, damping matrix and stiffness matrix are not diagonal matrices, and it is not possible to convert the set of differential equations into individual differential equations to solve them; they need to be converted into independent differential equations in modal coordinates to solve them through coordinate transformation. Coordinate transformation of is as follows:
where is the coordinate transformation matrix. Substituting Equation (4) into Equation (3), the differential equations of motion are converted into the form under modal coordinates:
Both sides of Equation (5) are left multiplied by the modal transpose matrix :
The generalized mass matrix , generalized damping matrix , generalized stiffness matrix and generalized excitation are defined as
Equation (6) can be expressed as
To ensure that the transformed equations can be decoupled, , , are all diagonal matrices, and is the modal matrix. To obtain , combining Equations (7) and (9) leads to
where both and are diagonal matrices of order n. The matrixobtained by multiplying and is also a diagonal matrix, and the ith element on the diagonal of this matrix is . Then, Equation (11) can be expressed as
That is, {u} is the generalized eigenvector of the mass matrix [M] and the stiffness matrix [K], and the vector consisting of is its generalized eigenvalue. Equation (13) is the general eigenvalue problem if the mass matrix is the unit matrix, and therefore the modal vectors can be normalized. The generalized mass matrix corresponding to the ith order modal vector is
is ith order modal vector. Normalization of the modal vector results in
Equation (11) can be decomposed into n separate differential equations:
Both sides of the equation are simultaneously divided by and have
Thus, Equation (16) can be translated into
Equation (18) is the differential equation of mode shape of the ith order. The modal superposition method based on the measured modal data of the structure can effectively restore the real mechanical properties of the windshield structure and avoid the problem of oversimplification of the modal simulation model of the structure.
4.2. Dynamic Response of U-Section Rubber Outer Windshield Structure
For the motion differential Equation (19) of a system with multiple degrees of freedom, it can be expressed as a matrix as follows:
Further, Equation (19) could write
where
where is the state vector of the system, is the system matrix, is the external load vector. Equation (20) is the state equation of the system. The external load vector of each time step and the state vector of the system in the matrix form of the equation of motion can be obtained by the above derivation process.
The ode45 function in MATLAB uses the Runge–Kutta method to solve the differential equation of motion of the structure under aerodynamic load and calculate the displacement response. This method can solve nonlinear problems effectively and has the advantages of less computation and high precision. For the outer windshield structure, the displacement of each measuring point over time can be expressed as
where represents the displacement of a measuring point with coordinate (x, y) with time t, represents the ith mode of a measuring point with coordinate (x, y), and represents the displacement of a point with time t under generalized coordinates. N is the number of modes of the first N order. As the Runge–Kutta method is solved using variable step integration, the dynamic response curves obtained are not of the same time step in the time domain and the results can be post-processed using numerical interpolation methods.
5. Dynamic Response Analysis of U-Section Rubber Outer Windshield
Through the calculation and analysis of the U-section rubber outer windshield structure, it is determined that under the action of aerodynamic load, only the first three modes of the outer windshield have major contributions, and the contributions of the latter modes are negligible. In order to ensure accuracy, the first six modes are used for modal superposition in the flow-induced vibration analysis of windshield structure. Figure 13 is a schematic diagram of the selection of measuring points for the displacement response of the U-section rubber outer windshield. The left part corresponds to the left windshield in Figure 10d, and the right part corresponds to the right windshield in Figure 10d. A total of 12 measuring points are selected for analysis. On a common computer, Intel(R) Core(TM) i7-10750CPU is used. The calculation time of this example is 16.74 s, which has engineering availability.
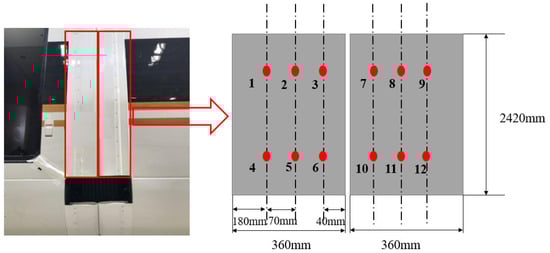
Figure 13.
Schematic diagram of displacement response measurement point selection. The red circles are the displacement response measurement point 1–12.
Figure 14 and Figure 15 show the displacement and velocity response curves of the measurement points on the left and right sides of the outer windshield within 6 s, respectively, positive in the direction toward the outside of the windshield. It can be seen from Figure 14 that the displacement and velocity amplitudes of measuring points 6 and 10 are the largest. This is due to the opening on the lower side of the outer windshield structure at points 6 and 10, which leads to lower stiffness compared with other measuring points and more obvious vibration there. On the other hand, measurement points 1, 4, 9 and 12 are closer to the connection between outer windshield and end wall. Due to the limitation of boundary conditions, their stiffness is larger than that of other measurement points, resulting in significantly smaller displacement and velocity response amplitudes than those of other measurement points.
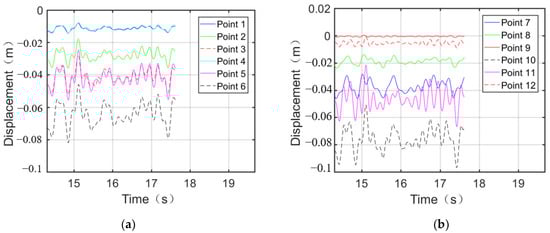
Figure 14.
The displacement response of measurement points 1–6 (a) and 7–12 (b) on both sides of the U-section rubber outer windshield.
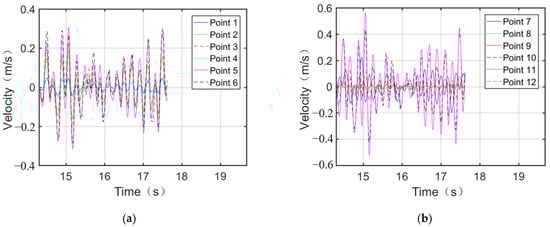
Figure 15.
The velocity response of measurement points 1–6 (a) and 7–12 (b) on both sides of the U-section rubber outer windshield.
Figure 16 shows the modal contribution of displacement at measurement points 6 (left) and 10 (right). The black solid line is the actual displacement at measurement point of outer windshield, and the dashed lines in other colors represent the contribution of each mode to the displacement of outer windshield, respectively. It can be observed that for measurement points 6 and 10, the first-order mode has a strong influence on the displacement of the outer windshield, while the other modes contribute relatively little to the displacement response.
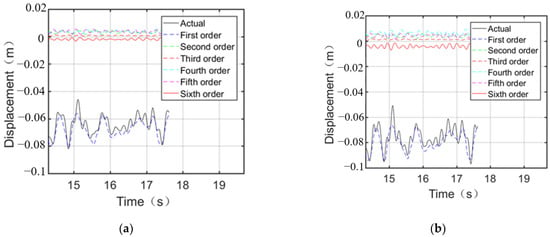
Figure 16.
The displacement modal contribution of U-section rubber outer windshield measuring point 6 (a) and measuring point 10 (b).
Next, in order to investigate the dynamic response of the measurement points for different positions of the windshield, the train is divided by direction of travel. Windshield 1 between the head car and the middle car and windshield 2 between the middle car and the tail car were selected for comparison in this paper, as shown in Figure 17. Each windshield was selected for comparison at the same measurement point locations as in Figure 13.
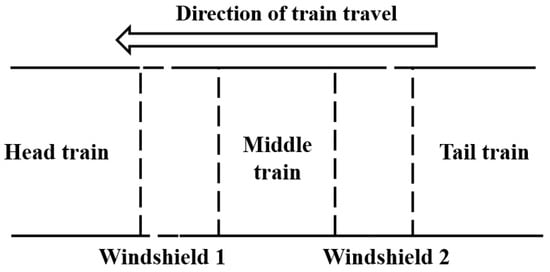
Figure 17.
Diagram of the different positions of the windshield.
Figure 18 and Figure 19 show a comparison of the maximum and mean values of the absolute values of each measurement point for different positions of the windshield at 400 km/h of the train. It can be seen that the amplitude of displacement vibrations at each measurement point on windshield 2 is higher than that of the measurement points on windshield 1, and the same is the case for the mean values. However, the difference is not very significant near the end of the car due to the constraints. It can be concluded that the outer windshield 2 vibrates more significantly under aerodynamic load excitation than windshield 1.
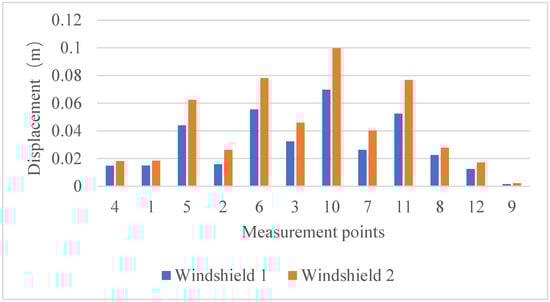
Figure 18.
Comparison of the maximum values of the displacement of windshield 1 and windshield 2.
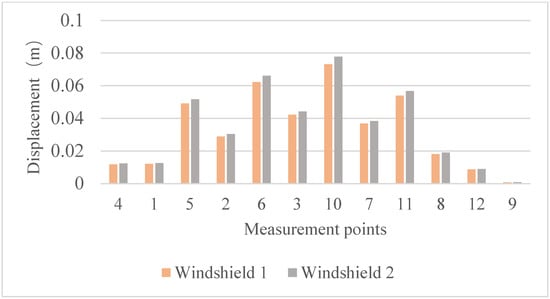
Figure 19.
Comparison of the mean values of the displacement of windshield 1 and windshield 2.
Furthermore, from Figure 13, it can be seen that the position of the measuring point on the lower side of the windshield is close to the windshield opening, and the constraint conditions at this place are weaker than the position of the measuring point on the upper side, and the stiffness is smaller. At the same time, for the measuring points on the lower side of the windshield, since both sides of the outer windshield are fixed at the end wall, points 4 and 12 near the end wall are more constrained than other measuring points at the same horizontal line (points 5, 6, 10, 11), while points 6 and 10 are more constrained than other measuring points at the same horizontal line. On the other hand, due to the opening on the lower side of the outer windshield, the airflow inside and outside the windshield is exchanged through the opening position, which increases the aerodynamic force on the surface at the lower side. Therefore, it can be seen from Figure 18 that the displacements of lower points are larger than those of upper points and displacements of points 6 and 10 are the largest.
6. Conclusions
In this paper, a new method is proposed to build a U-section rubber windshield structure flow-induced vibration model by using the external aerodynamic load and the measured modal data of the outer windshield structure as input, combined with the mode superposition method. This method can be used to analyze the dynamic response of U-section rubber outer windshield structure efficiently.
Since the aerodynamic load on the windshield surface as the input condition does not need to be iterated repeatedly, it is not limited by the computing resources required and can handle the dynamic response simulation calculation under various working conditions such as open line operation, open line intersection or tunnel operation.
The use of measured structural modal data can avoid the problem of inaccurate dynamic characteristics caused by oversimplification of U-section rubber outer windshield simulation modeling. This method is suitable for dynamic characterization of complex flexible structures.
Through the flow-induced vibration analysis of U-section rubber outer windshield structure of a 400 km/h train, it is determined that the displacement and velocity response curves of the measuring point near the windshield opening position are significantly higher than those of other parts due to the influence of the opening position. This area has a great potential for vibration reduction, and attention should be paid to the influence of the structure’s first-order mode on its response.
Author Contributions
Conceptualization, X.L. (Xiang Liu); methodology, Y.Y. and X.L. (Xiang Liu); software, X.L. (Xiao Liu); formal analysis, Y.Y., P.L. and X.L. (Xiao Liu); writing—original draft preparation, Y.Y., P.L. and X.L. (Xiao Liu); writing review and editing, Y.Y., P.L., X.L. (Xiao Liu) and X.L. (Xiang Liu); supervision, X.L. (Xiang Liu); funding acquisition, X.L. (Xiang Liu). All authors have read and agreed to the published version of the manuscript.
Funding
This research was funded by Science and Technology Research and Development Program of China National Railway Group Co., Ltd., grant number P2021J037. National Natural Science Foundation, grant number 11802345 and the Fundamental Research Funds for the Central Universities of Central South University, grant number 1053320216395.
Institutional Review Board Statement
Not applicable.
Informed Consent Statement
Not applicable.
Data Availability Statement
Not applicable.
Conflicts of Interest
The authors declare no conflict of interest.
References
- Shen, Z. Dynamic Environment of High-speed Train and Its Distinguished Technology. J. China Railw. Soc. 2006, 28, 1–5. [Google Scholar]
- Yin, T.; Cheng, H.; Shi, Z.; Dong, J. Analysis of the influence of the relative position of the end of the EMU on the internal windshield linkage. Shandong Ind. Technol. 2019, 1. [Google Scholar]
- Schetz, J.A. Aerodynamics of High-Speed Trains. Annu. Rev. Fluid Mech. 2001, 33, 371–414. [Google Scholar] [CrossRef]
- Baker, C. The flow around high speed trains. J. Wind Eng. Ind. Aerodyn. 2012, 98, 277–298. [Google Scholar] [CrossRef]
- Baker, C.J.; Dalley, S.J.; Johnson, T.; Quinn, A.; Wright, N.G. The slipstream and wake of a high-speed train. Proc. Inst. Mech. Eng. Part F J. Rail Rapid Transit 2001, 215, 83–99. [Google Scholar] [CrossRef]
- Schulte-Werning. Research of European railway operators to reduce the environmental impact of high-speed trains. Proc. Inst. Mech. Eng. Part F J. Rail Rapid Transit 2003, 217, 249–257. [Google Scholar] [CrossRef]
- Liu, H.; Wei, X.; Zeng, J.; Wang, Y. Effect of vestibule diaphragm device on train dynamic performance. J. Traffic Transp. Eng. 2003, 3, 5. [Google Scholar]
- Niu, J.; Liang, X.; Xiong, X.; Liu, F. Effect of outside vehicle windshield on aerodynamic performance of high-speed train under crosswind. J. Shandong Univ. Eng. Sci. Ed. 2016, 8, 108–115. [Google Scholar]
- Tan, L.; Su, R.; Huang, L.; Cheng, Z.; Zhu, T.; Mu, H. Investigation of white EPDM based vestibule diaphragm for high-speed train. Electr. Locomot. Urban Rail Veh. 2015, 38, 4. [Google Scholar]
- Tang, M.; Xiong, X.; Zhong, M.; Wang, Z. Influence of installation spacing of external vestibule diaphragm of high-speed train on aerodynamic characteristics of the vestibule diaphragm. J. Railw. Sci. Eng. 2019, 16, 10. [Google Scholar]
- Yang, J.; Jiang, C.; Gao, Z.; Lv, Y.; Zhang, J.; Li, C. Influence of Inter-car Wind-shield Schemes on Aerodynamic Performance of High-speed Trains. J. China Railw. Soc. 2012, 34, 7. [Google Scholar]
- Fujii, K.; Ogawa, T. Aerodynamics of high speed trains passing by each other. Comput. Fluids 1995, 24, 897–908. [Google Scholar] [CrossRef]
- Niu, J.; Wang, Y.; Zhou, D. Effect of the outer windshield schemes on aerodynamic characteristics around the car-connecting parts and train aerodynamic performance. Mech. Syst. Signal Process. 2019, 130, 1–16. [Google Scholar] [CrossRef]
- Kurita, T.; Mizushima, F. Environmental Measures along Shinkansen Lines with FASTECH360 High-Speed Test Trains. JR East Tech. Rev. 2010, 16, 47–55. [Google Scholar]
- Li, X.B.; Chen, G.; Wang, Z.; Xiong, X.H.; Yin, J. Dynamic analysis of the flow fields around single- and double-unit trains. J. Wind Eng. Ind. Aerodyn. 2019, 188, 136–150. [Google Scholar] [CrossRef]
- Peters, J.L. Optimising aerodynamics to raise IC performance. Railw. Gaz. Int. 1982, 138, 817–819. [Google Scholar]
- Bell, J.R.; Burton, D.; Thompson, M.C.; Herbst, A.H.; Sheridan, J. The effect of tail geometry on the slipstream and unsteady wake structure of high-speed trains. Exp. Therm. Fluid Sci. Int. J. Exp. Heat Transf. Thermodyn. Fluid Mech. 2017, 83, 215–230. [Google Scholar] [CrossRef]
- Shiraishi, H. Improvement of Smooth Covers between Vehicles for Shinkansen High Speed Test Trains. Foreign Roll. Stock 2010.
- Tian, H.Q. Review of research on high-speed railway aerodynamics in China. Transp. Saf. Environ. 2019, 1, 1–21. [Google Scholar] [CrossRef]
- Xia, Y.; Liu, T.; Gu, H.; Guo, Z.; Li, L. Aerodynamic effects of the gap spacing between adjacent vehicles on wind tunnel train models. Eng. Appl. Comput. Fluid Mech. 2020, 14, 835–852. [Google Scholar] [CrossRef]
- Bathe, K.-J.; Hou, Z.; Ji, S. Finite element analysis of fluid flows fully coupled with structural interactions. Comput. Struct. 1999, 72, 1–16. [Google Scholar] [CrossRef]
- Benney, M.R.J.; Stein, M.K.R.; Kalro, V.; Tezduyar, T.E.; Leonard, J.W.; Accorsi, M.L. Parachute performance simulations: A 3D fluid-structure interaction model. Comput. Methods Appl. Mech. Eng. 1992, 94, 353–371. [Google Scholar]
- Horiuchi, M. Outline of Shinkansen high-speed test train type E955 (FASTECH360Z). JR East Tech. Rev. Ser. 2006, 8, 6–10. [Google Scholar]
- Loon, R.V.; Anderson, P.D.; Vosse, F.; Sherwin, S.J. Comparison of various fluid-structure interaction methods for deformable bodies. Comput. Struct. 2007, 85, 833–843. [Google Scholar] [CrossRef]
- Luo, L.L. Aerodynamic noise radiating from the inter-coach windshield region of a high-speed train. J. Low Freq. Noise Vib. Act. Control. 2018, 37, 590–610. [Google Scholar]
- Mohmmed, A.O.; Al-Kayiem, H.H.; Sabir, O.; Ahmed, O. One-way coupled fluid-structure interaction of gas-liquid slug flow in a horizontal pipe: Experiments and simulations. J. Fluids Struct. 2020, 97, 103083. [Google Scholar] [CrossRef]
- EN 14067-4:2013; Railway Applications—Aerodynamics—Part 4: Requirements and Test Procedures for Aerodynamics on Open Track. European Standards: Plzen, Czech Republic, 2013.
- Wijesooriya, K.; Mohotti, D.; Amin, A.; Chauhan, K. Comparison between an uncoupled one-way and two-way fluid structure interaction simulation on a super-tall slender structure. Eng. Struct. 2021, 229, 111636. [Google Scholar] [CrossRef]
- Cai, J.; Zhang, S.; Wang, H.; Xiong, X.; Tang, M. Modal finite element calculation and test analysis on U-shaped rubber outer windshield structure of high speed train. J. Railw. Sci. Eng. 2020, 17, 10. [Google Scholar]
- Wang, H.; Sun, G.; She, P.; Tang, M. Experimental Study on Dynamic Characteristics of the Vehicle-end Inner Windshield in High-speed EMUs. Electr. Drive Locomot. 2020, 4, 6. [Google Scholar]
- Li, S.; Wang, J. Research on Vibration of High speed Train Windshield. Sci. Technol. Innov. Rev. 2020, 17, 2. [Google Scholar]
- Liu, Z. Research on Windshield Aerodynamic Characteristics and Pneumatic Fatigue Strength of High Speed Train. Master’s Thesis, Central South University, Changsha, China, 2014. [Google Scholar]
- Wang, Y.; Cai, X.; Zhao, W. FSI Technology and Its Application in High-Speed EMUs Structure Design. J. Dalian Jiaotong Univ. 2012, 33, 5. [Google Scholar]
- Miao, X.; Gao, G.; He, K. Wish a hundred years; KONG Fabing. Aerodynamic shape optimization of windshields on freight high-speed trains with crosswind. J. Cent. S. Univ. Nat. Sci. Ed. 2021, 52, 9. [Google Scholar]
- Long, S. Aerodynamic Characteristics Simulation of High-speed Train Running on Different Infrastructures under Cross Winds. Mechatronics 2017, 34, 3–8. [Google Scholar]
- Wang, Z.; Li, T.; Zhang, J. Research on Aerodynamic Performance of High-speed Train Subjected to Different Types of Crosswind Enhanced Publishing. J. Mech. Eng. 2018, 9. [Google Scholar] [CrossRef]
- Ouyang, M.; Chen, S.; Li, Q. Analysis of unsteady flow field and near-field aerodynamic noise of scale high-speed trains in long tunnel. Appl. Acoust. 2023, 205, 109261. [Google Scholar] [CrossRef]
- Maleki, S.; Burton, D.; Thompson, M.C. Assessment of various turbulence models (ELES, SAS, URANS and RANS) for predicting the aerodynamics of freight train container wagons. J. Wind Eng. Ind. Aerodyn. 2017, 170, 68–80. [Google Scholar] [CrossRef]
- Premoli, A.; Rocchi, D.; Schito, P.; Tomasini, G. Comparison between steady and moving railway vehicles subjected to crosswind by CFD analysis. J. Wind Eng. Ind. Aerodyn. 2016, 156, 29–40. [Google Scholar] [CrossRef]
- Sun, Z.; Wang, T.; Wu, F. Numerical investigation of influence of pantograph parameters and train length on aerodynamic drag of high-speed train. J. Cent. South Univ. 2020, 27, 1334–1350. [Google Scholar] [CrossRef]
- Dong, T.; Liang, X.; Krajnovi, S.; Xiong, X.; Zhou, W. Effects of simplifying train bogies on surrounding flow and aerodynamic forces. J. Wind Eng. Ind. Aerodyn. 2019, 191, 170–182. [Google Scholar] [CrossRef]
- Wang, S.; Bell, J.R.; Burton, D.; Herbst, A.H.; Sheridan, J.; Thompson, M.C. The performance of different turbulence models (URANS, SAS and DES) for predicting high-speed train slipstream. J. Wind Eng. Ind. Aerodyn. 2017, 165, 46–57. [Google Scholar] [CrossRef]
- Zhang, J.; Adamu, A.; Su, X.; Guo, Z.; Gao, G. Effect of simplifying bogie regions on aerodynamic performance of high-speed train. J. Cent. South Univ. 2022, 29, 1717–1734. [Google Scholar] [CrossRef]
- Zhang, J.; Guo, Z.; Han, S.; Krajnović, S.; Sheridan, J.; Gao, G. An IDDES study of the near-wake flow topology of a simplified heavy vehicle. Transp. Saf. Environ. 2022, 4, tdac015. [Google Scholar] [CrossRef]
Disclaimer/Publisher’s Note: The statements, opinions and data contained in all publications are solely those of the individual author(s) and contributor(s) and not of MDPI and/or the editor(s). MDPI and/or the editor(s) disclaim responsibility for any injury to people or property resulting from any ideas, methods, instructions or products referred to in the content. |
© 2023 by the authors. Licensee MDPI, Basel, Switzerland. This article is an open access article distributed under the terms and conditions of the Creative Commons Attribution (CC BY) license (https://creativecommons.org/licenses/by/4.0/).