
Environmental Reconstruction from the Identification of Magnetic Minerals in the Upper Sedimentary Infill of the Gran Dolina Cave (Burgos, Spain)


Abstract
1. Introduction
2. Regional Setting and Archaeological Sequence
3. Material and Methods
4. Results
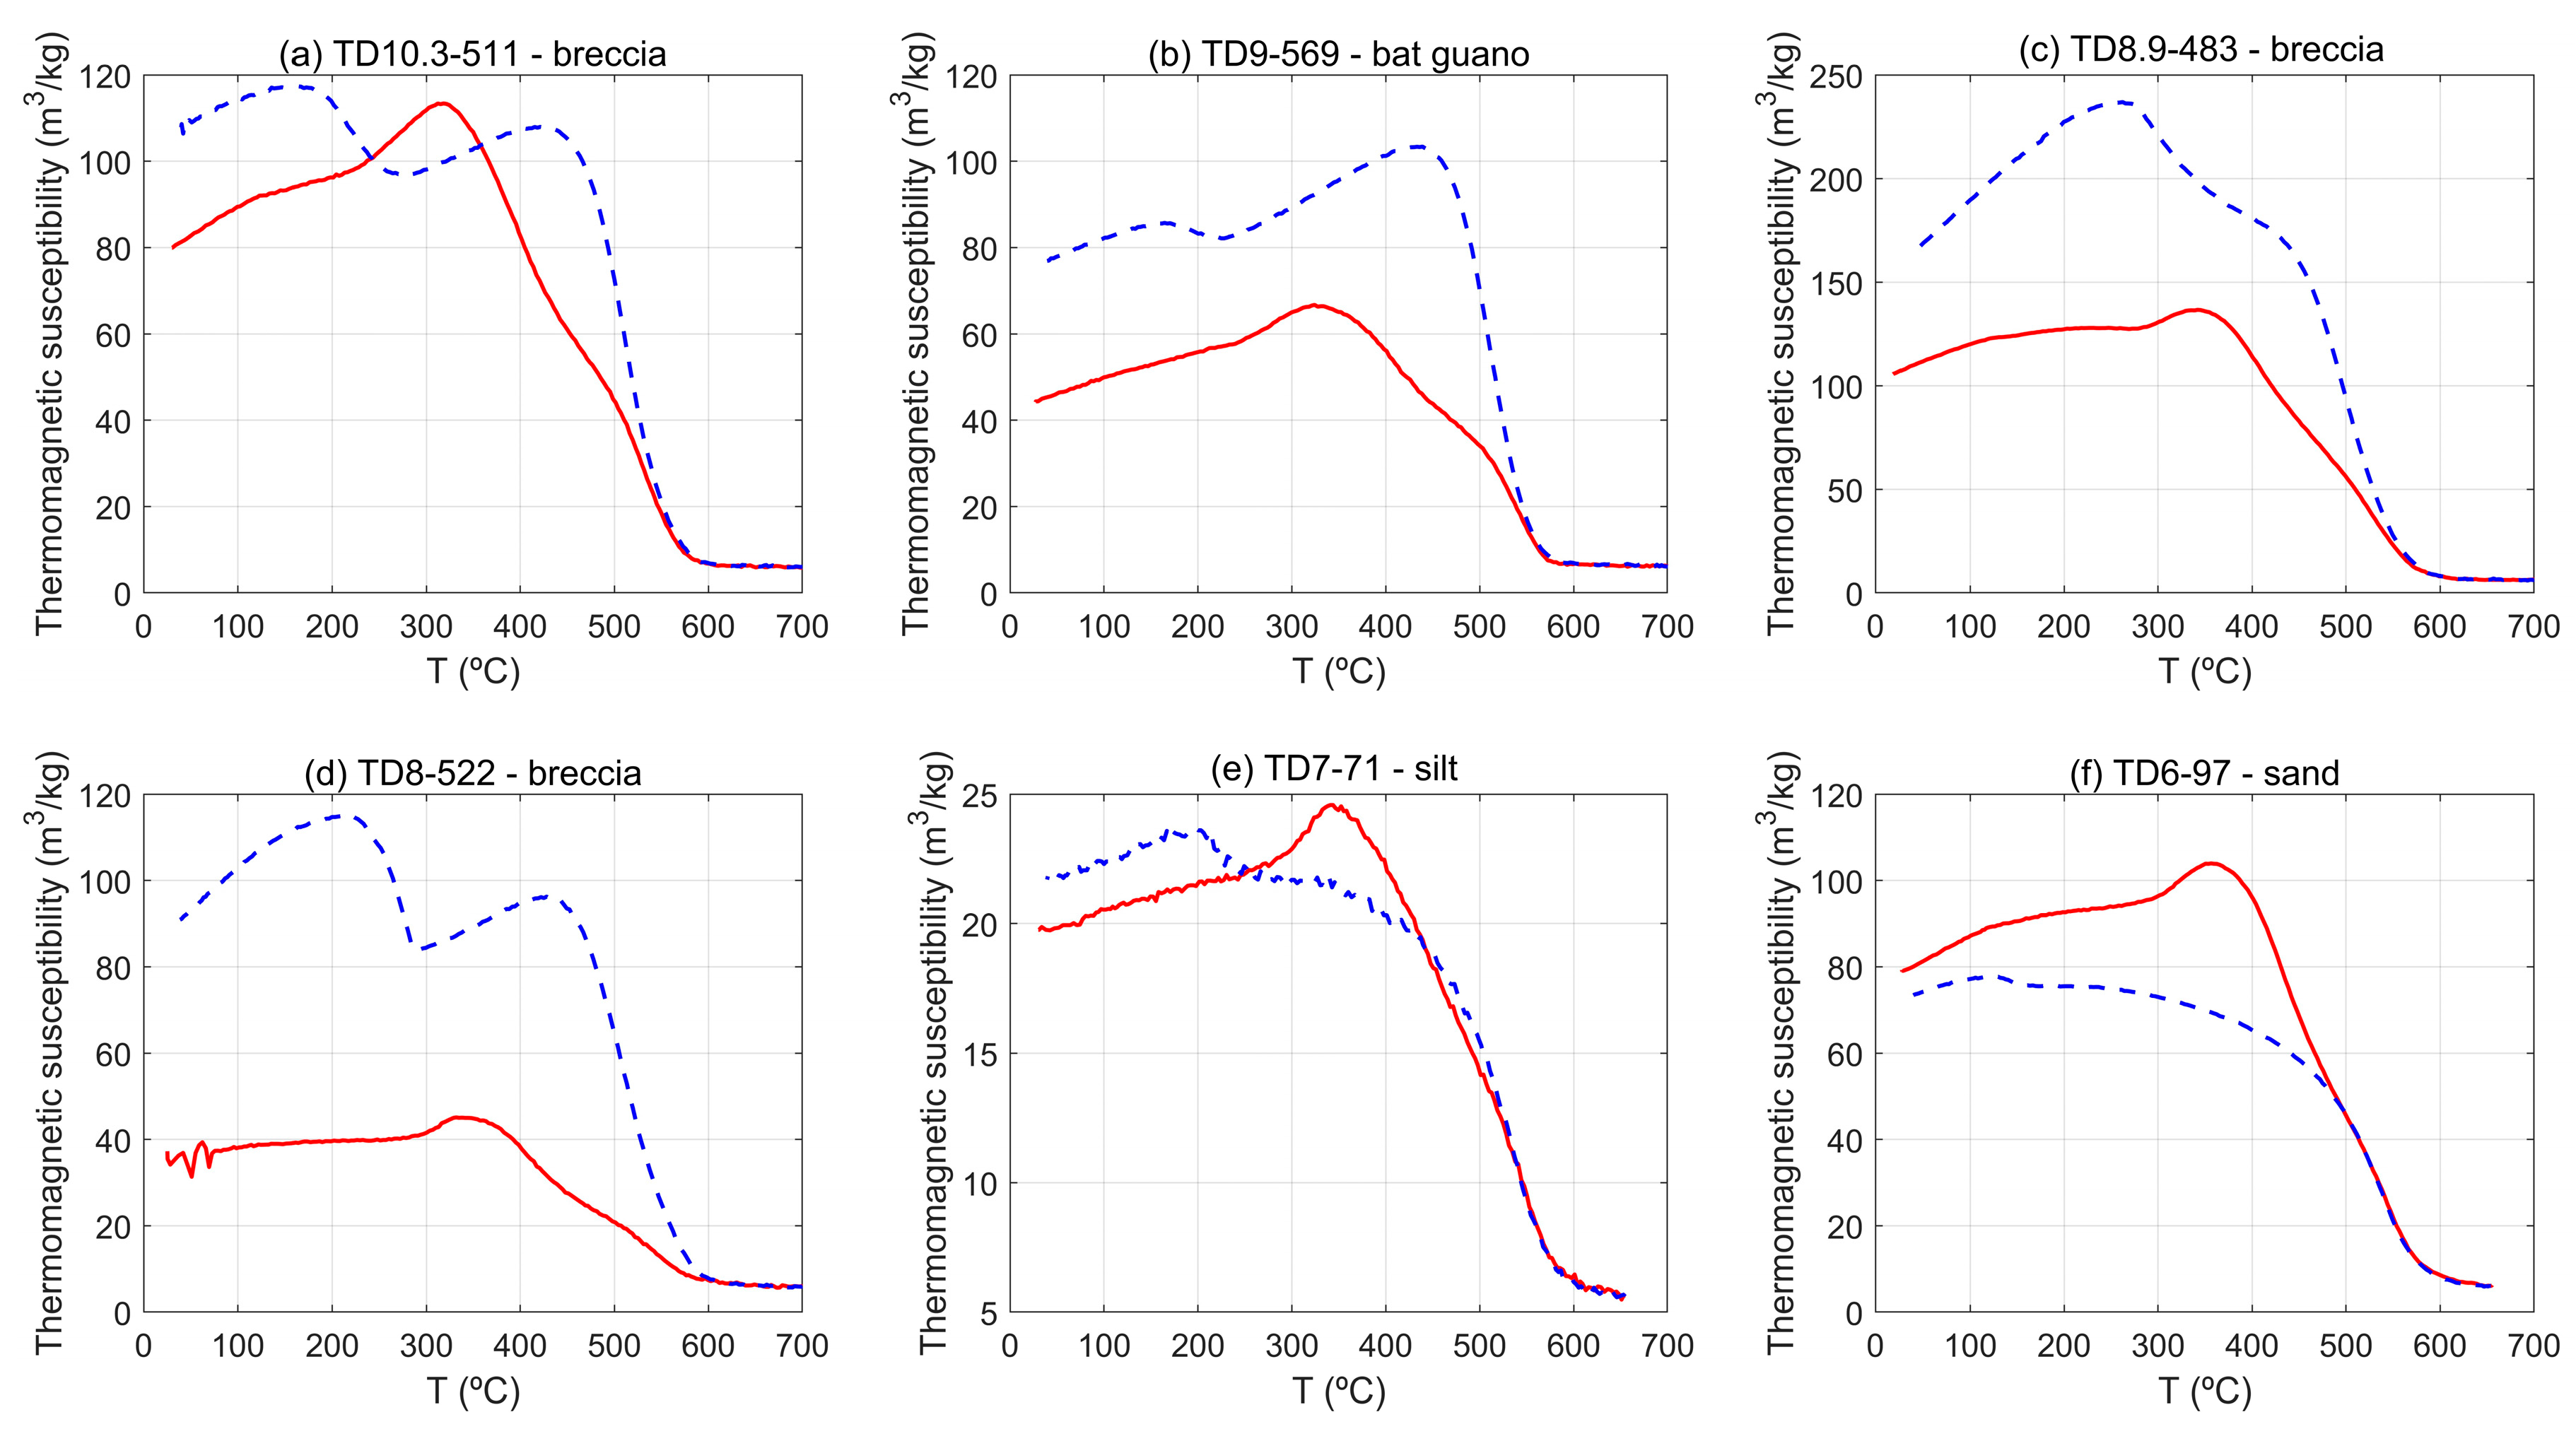
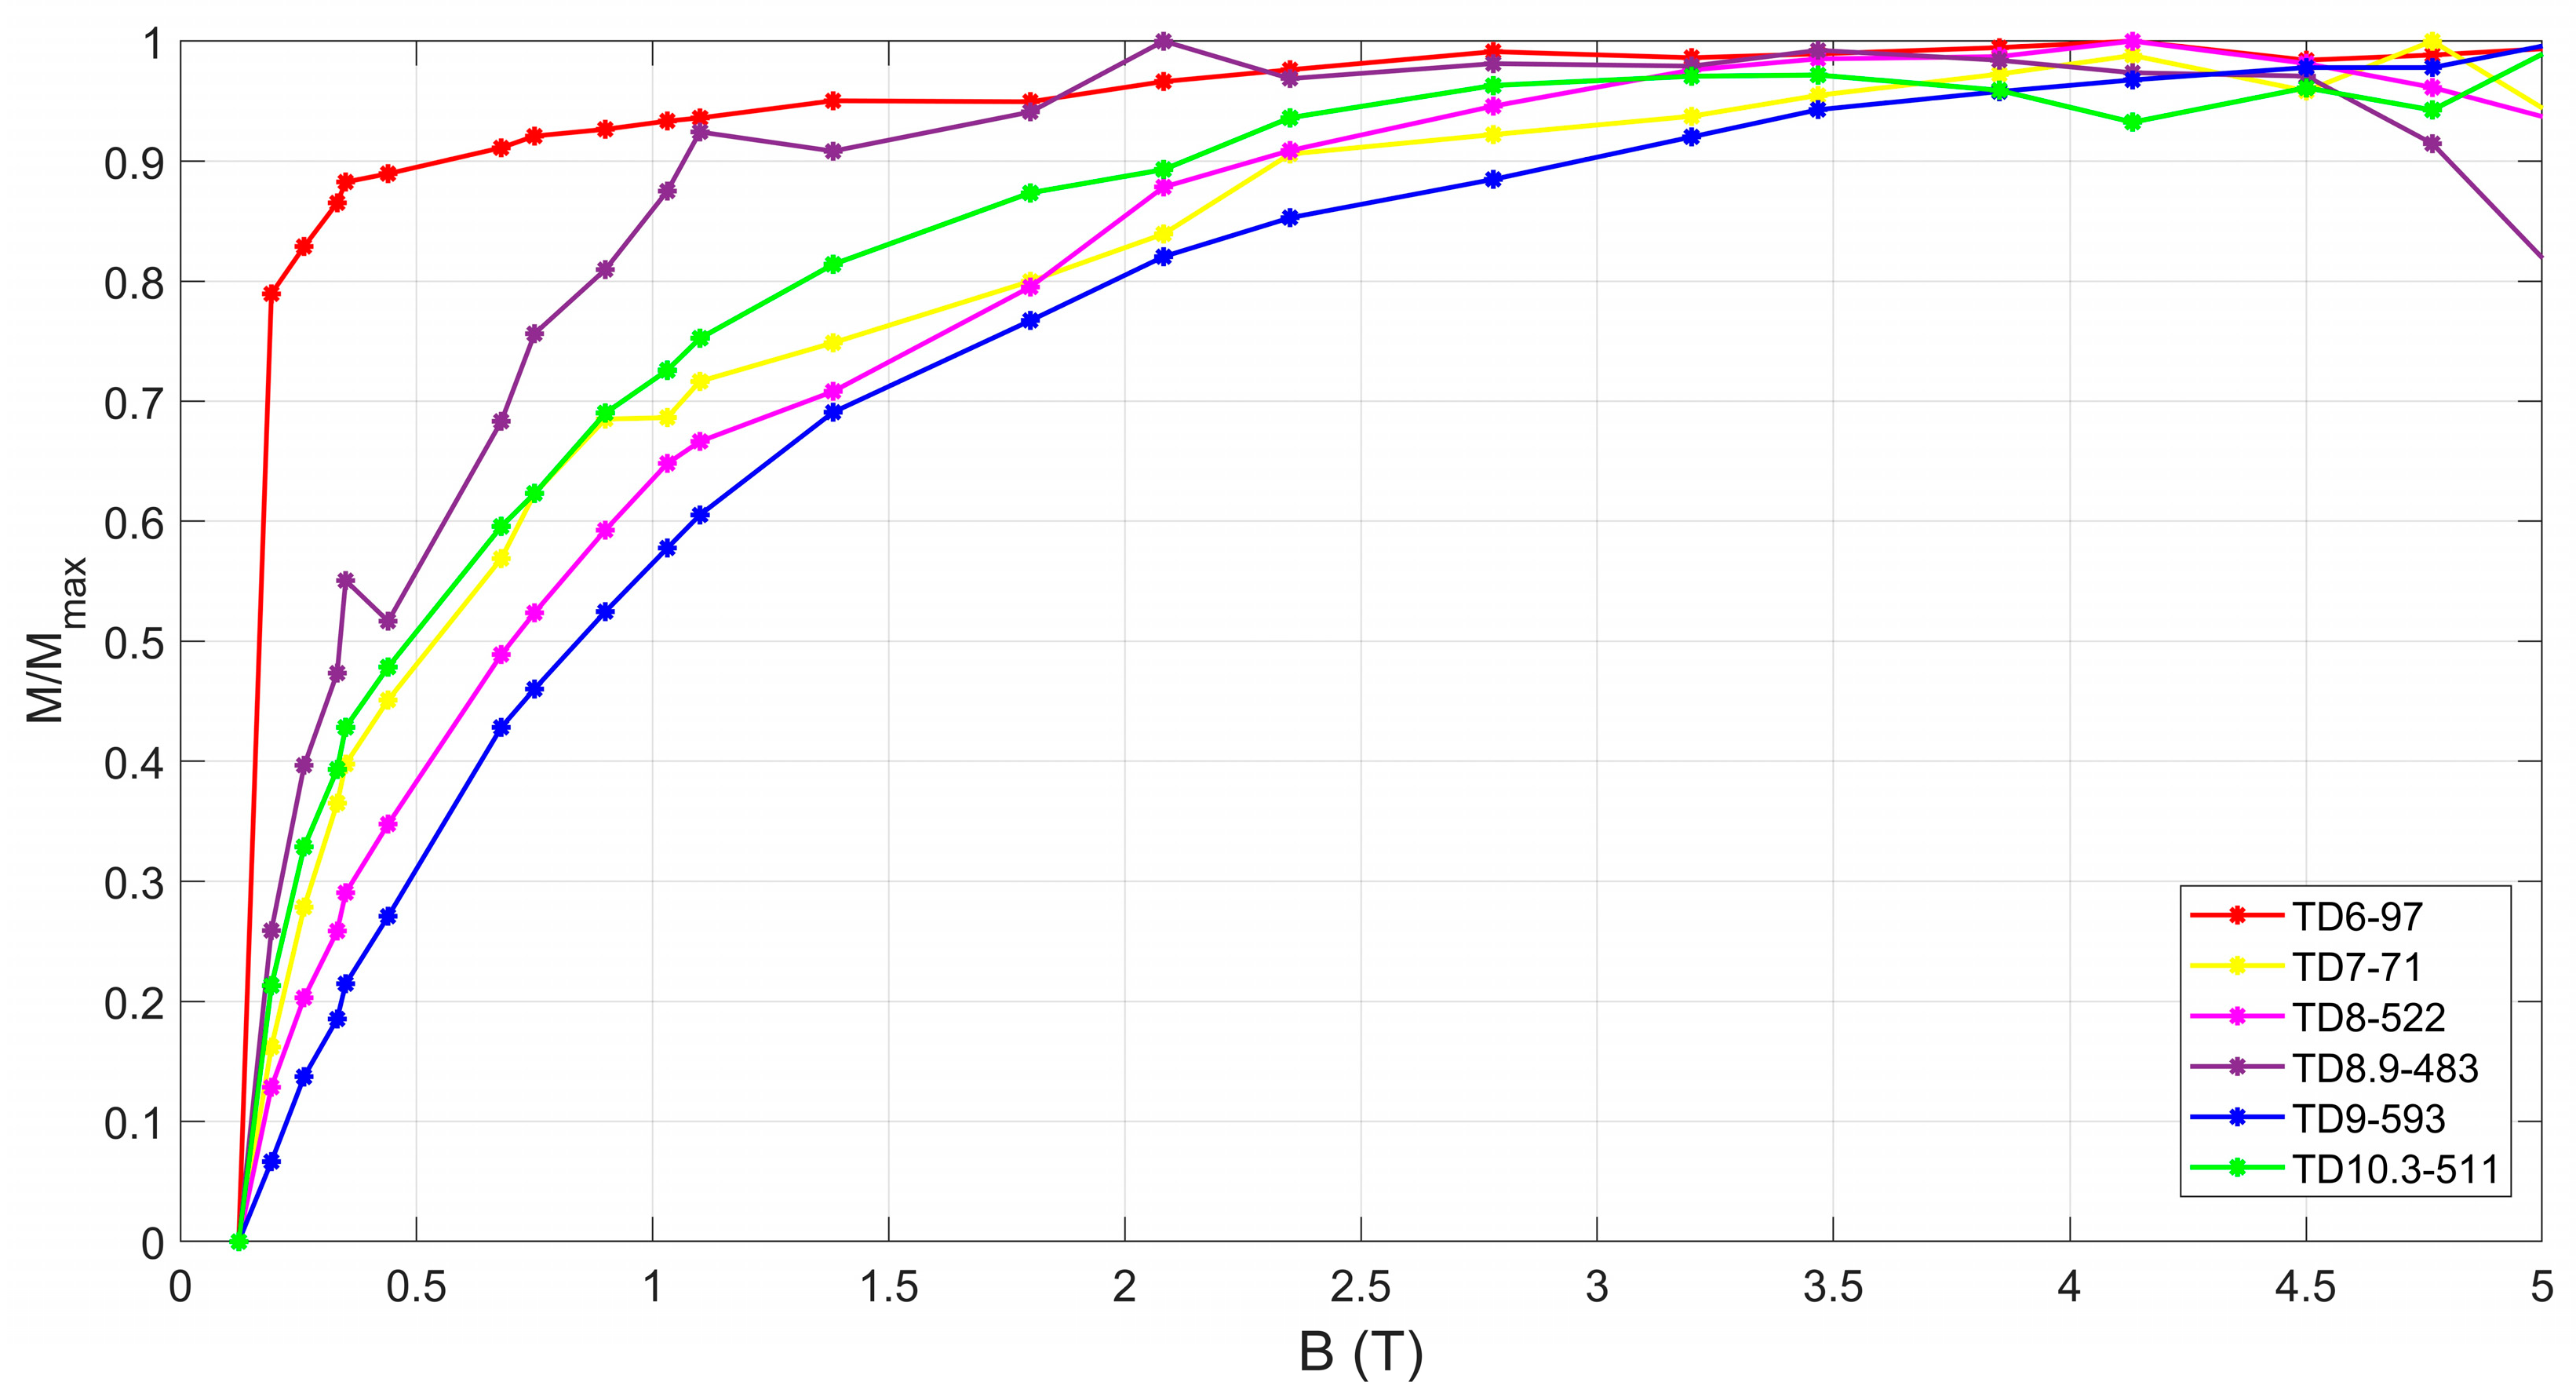
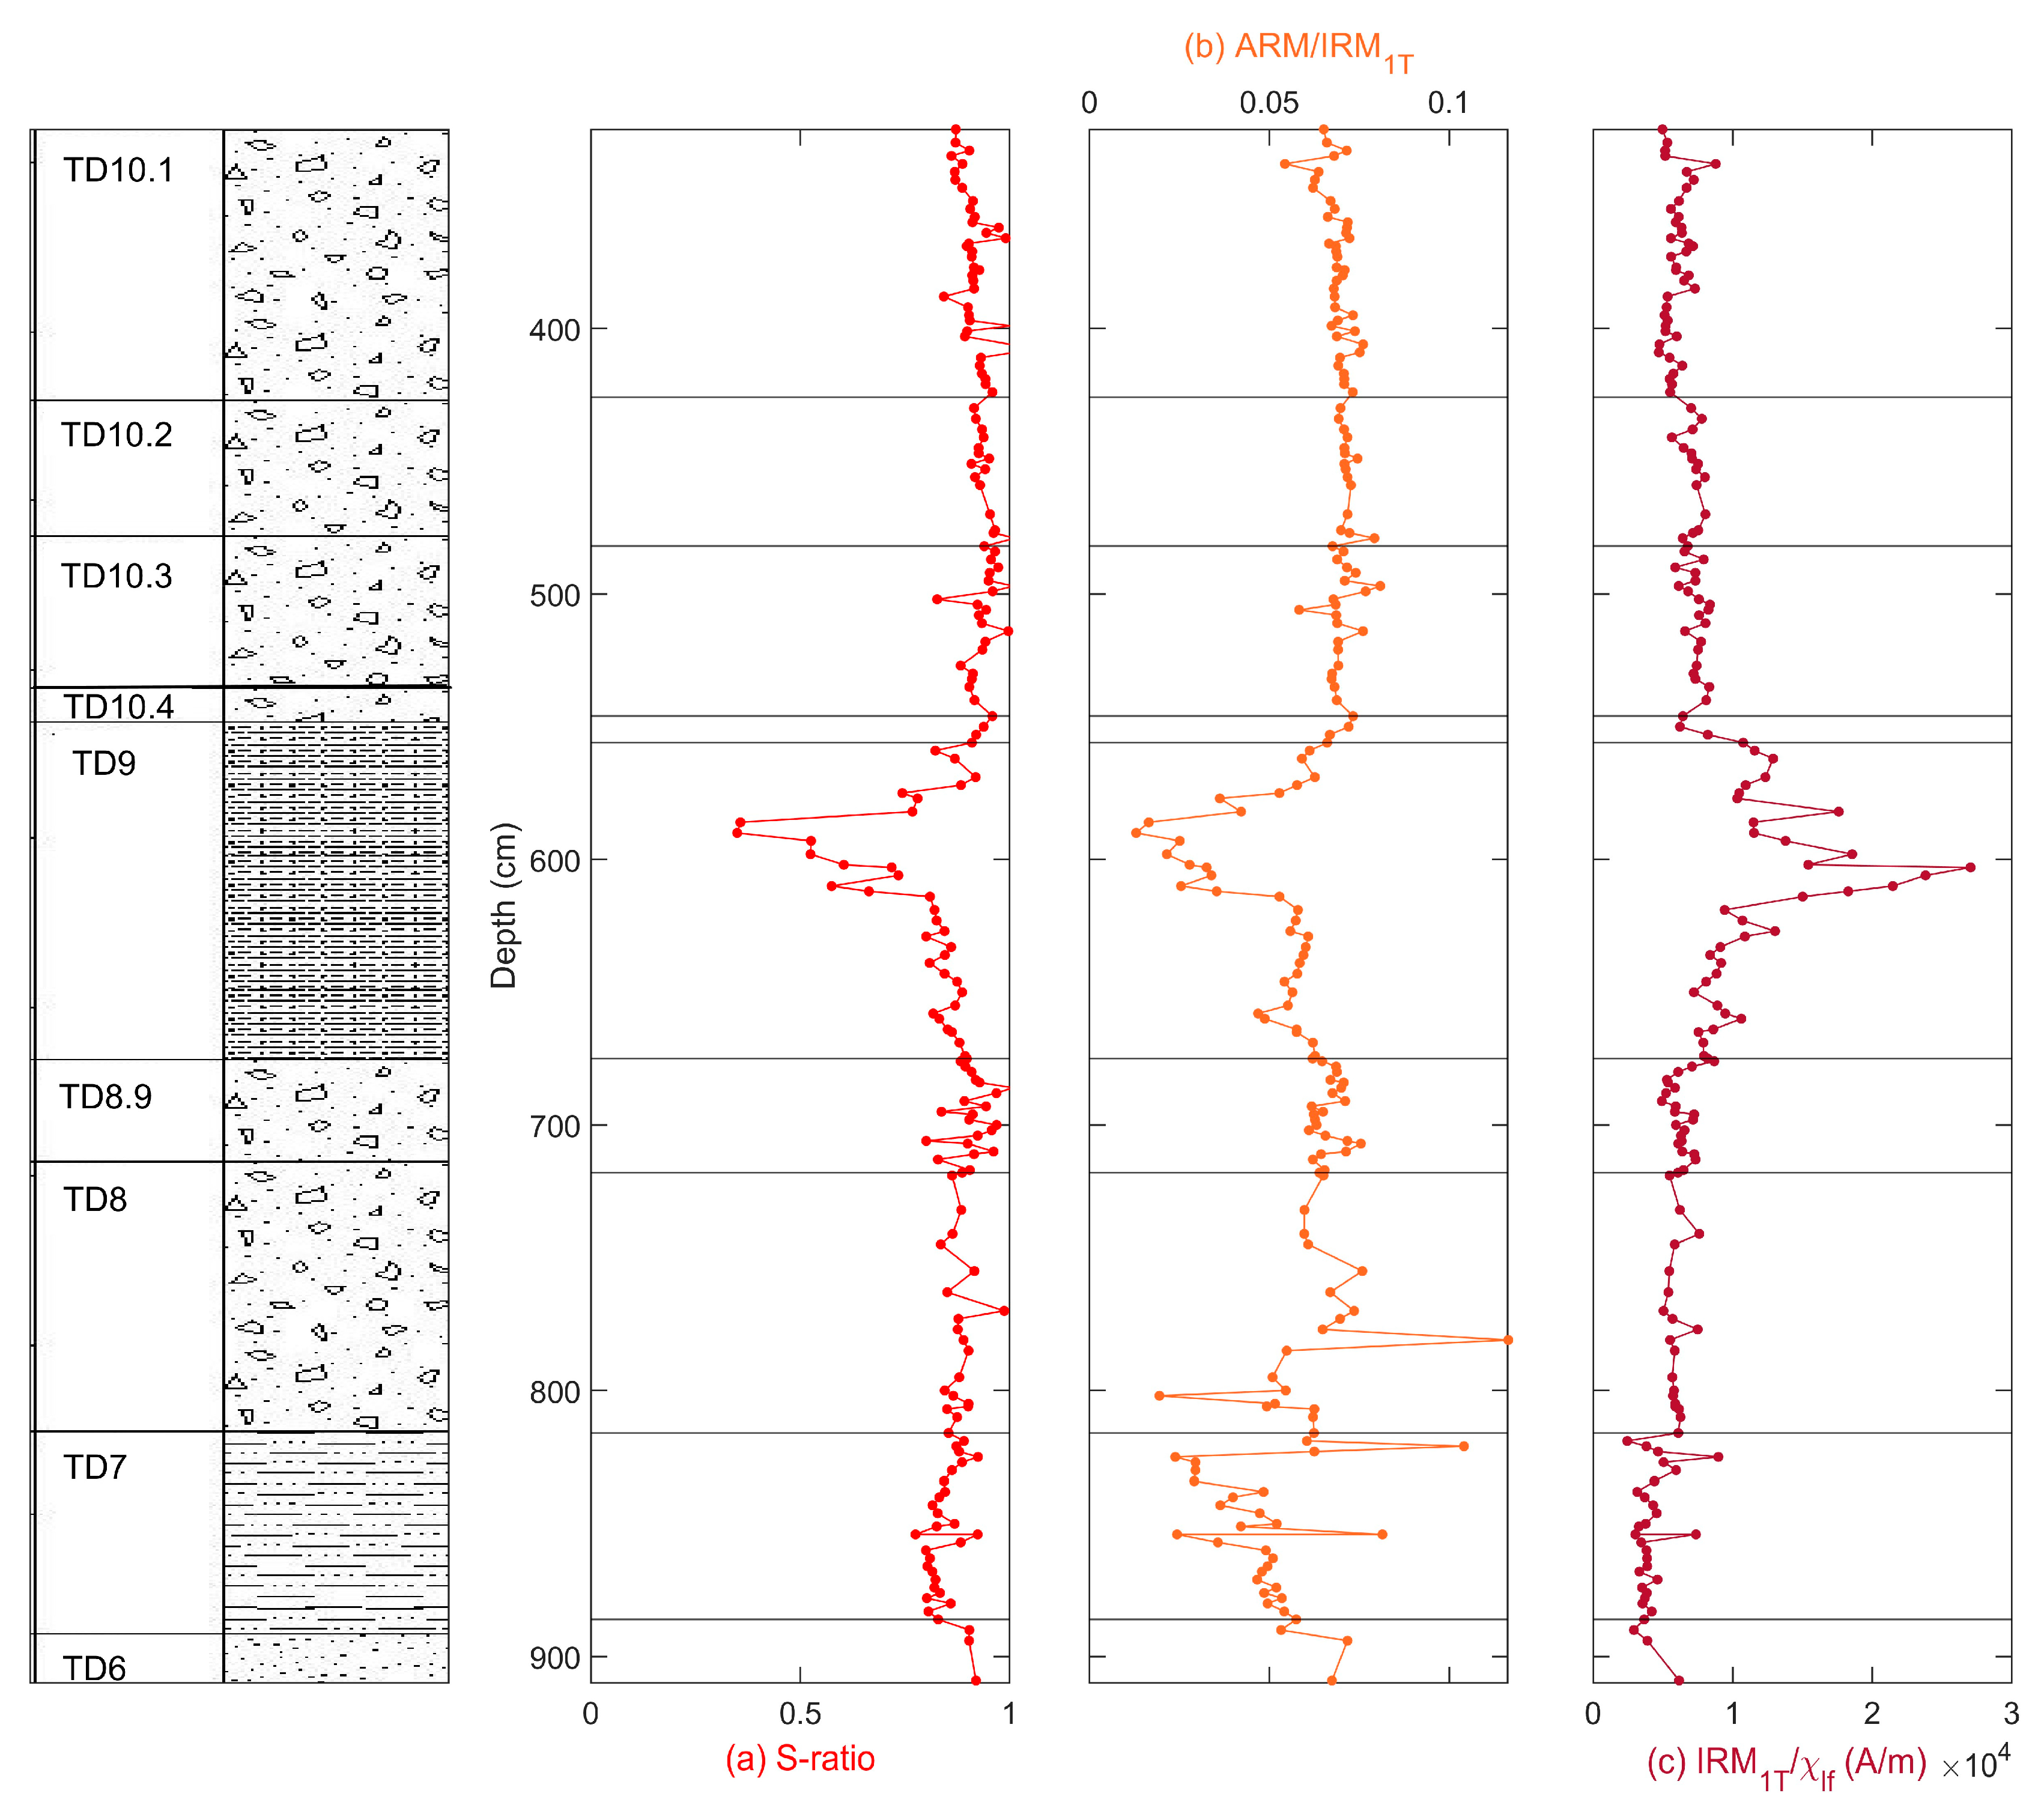
4.1. Composition Analysis
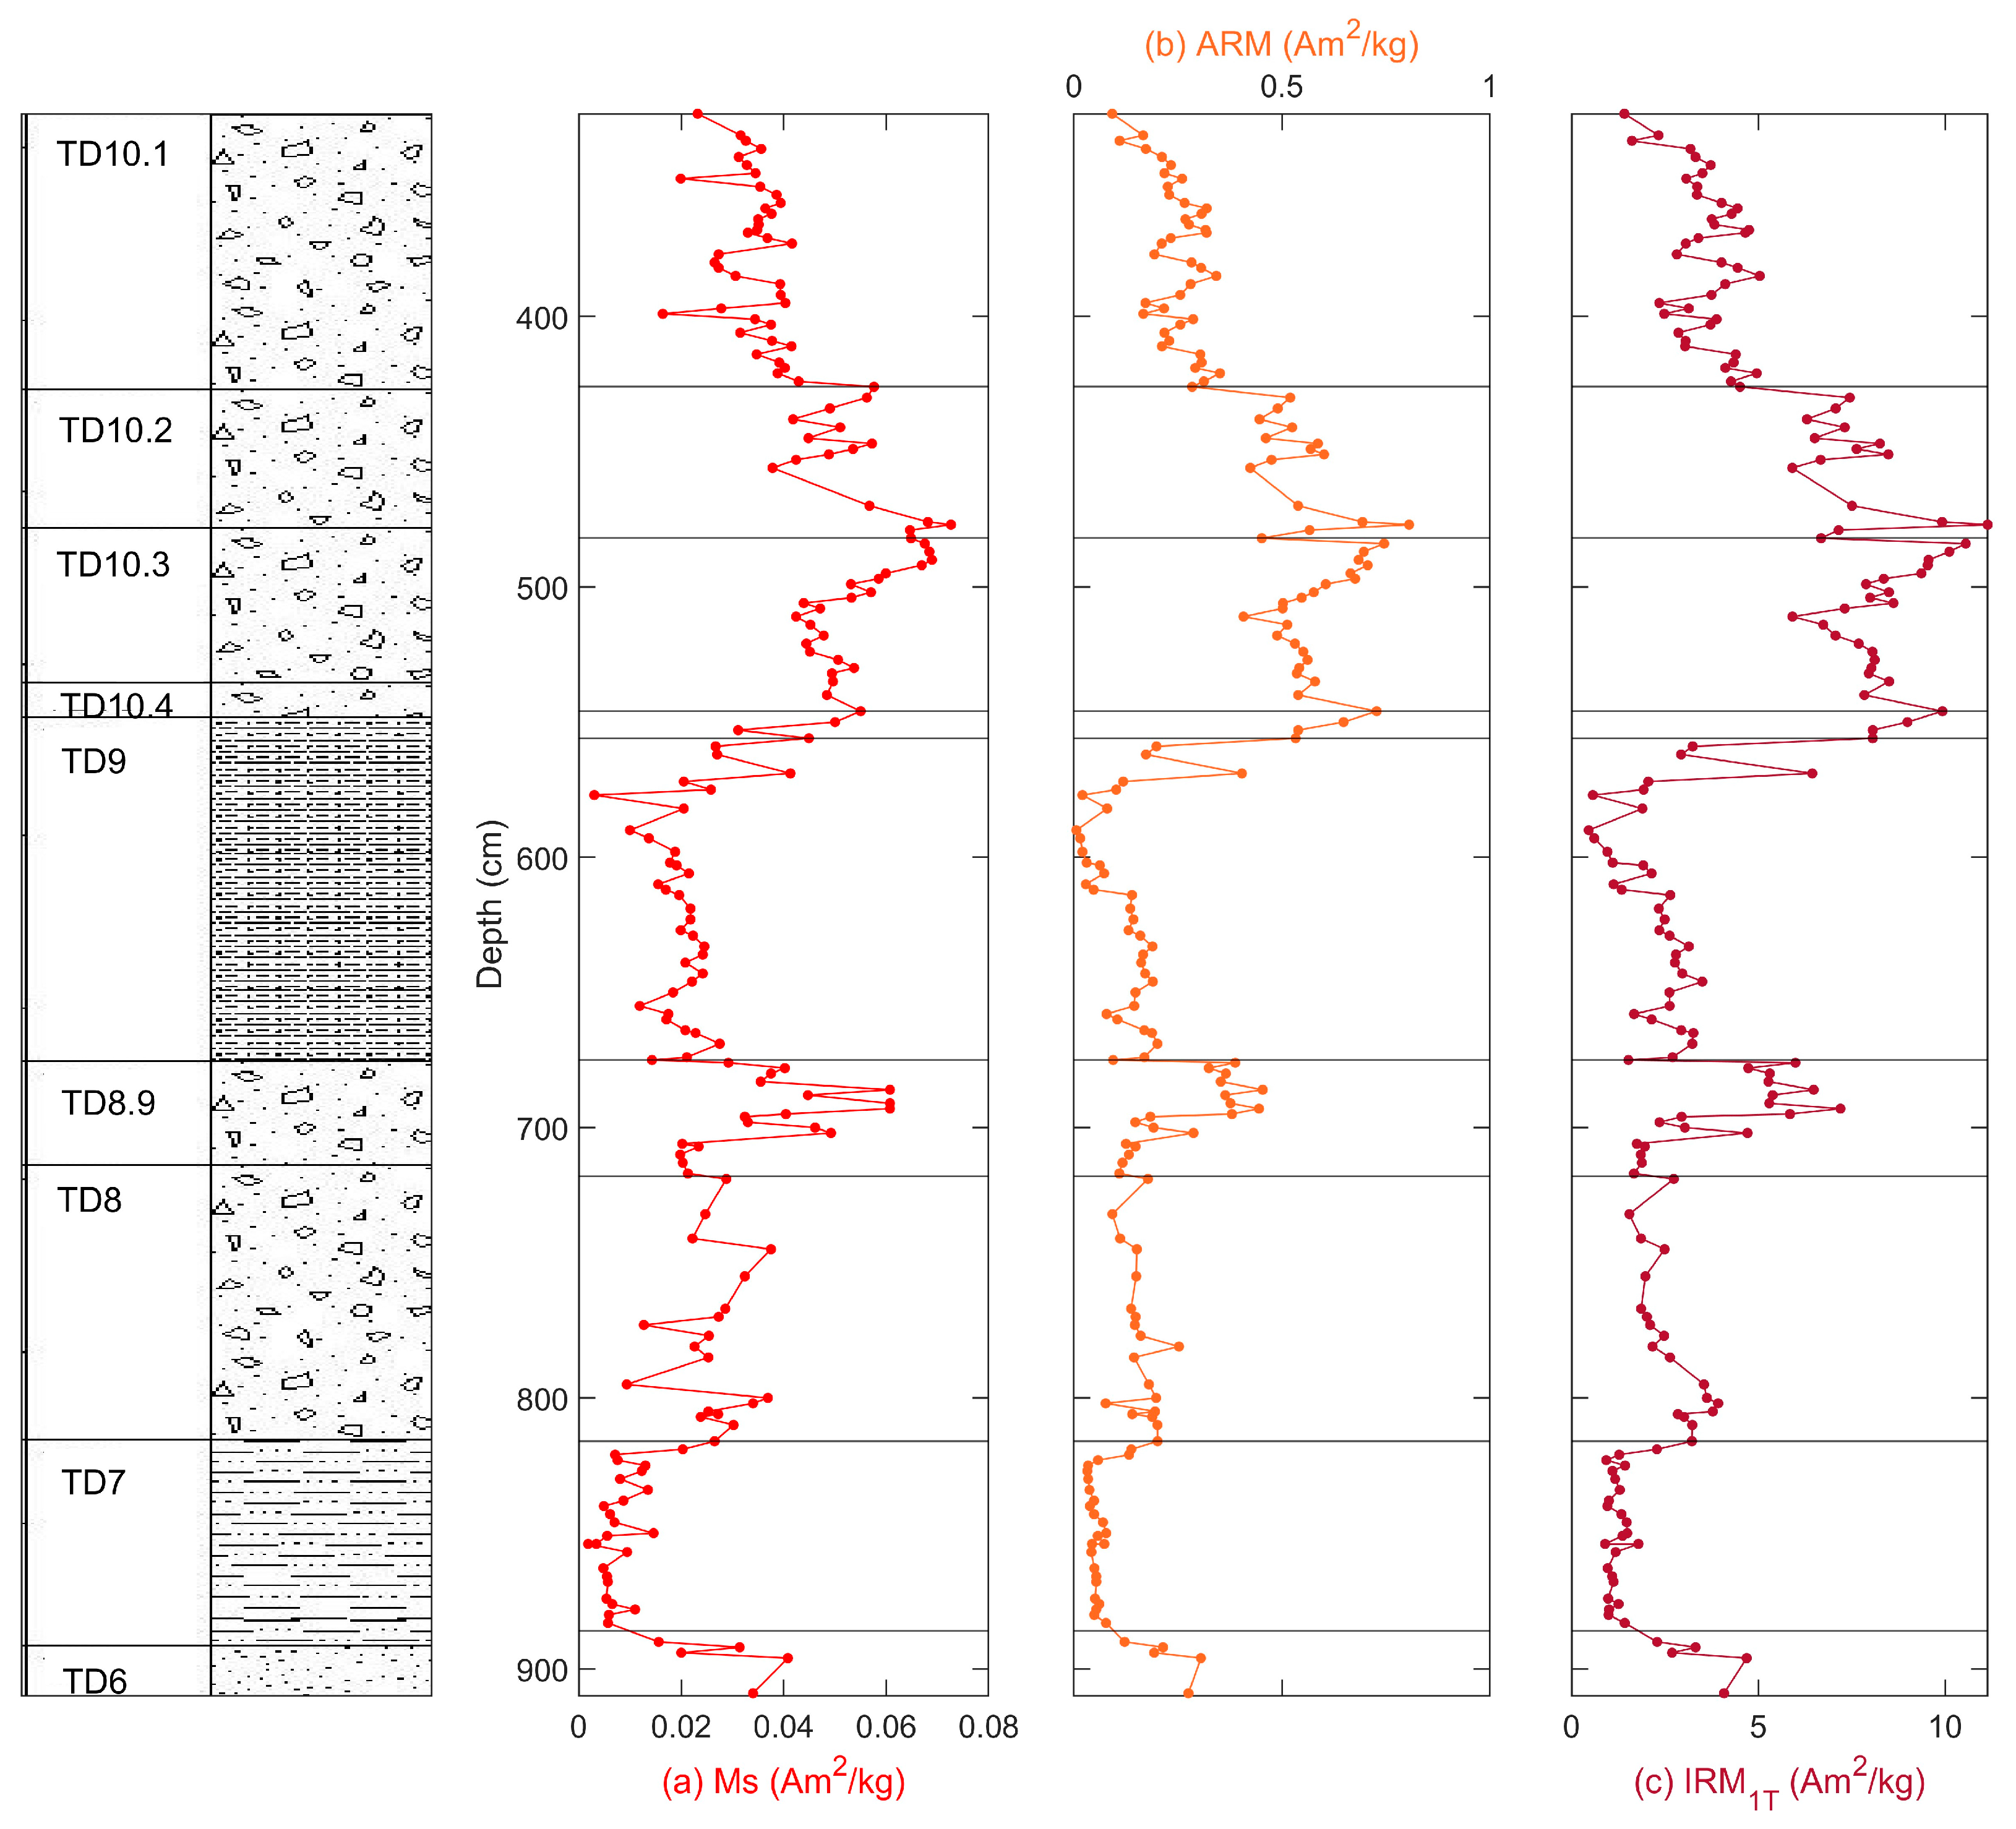
4.2. Concentration Analysis
4.3. Grain Size Analysis
5. Discussion
6. Conclusions
Author Contributions
Funding
Institutional Review Board Statement
Informed Consent Statement
Data Availability Statement
Acknowledgments
Conflicts of Interest
References
- Evans, M.E.; Heller, F. Environmental Magnetism: Principles and Applications of Enviromagnetics; International Geophysics Series; Elsevier Science: Alpharetta, GA, USA, 2003; Volume 86. [Google Scholar]
- Liu, Q.; Roberts, A.P.; Larrasoaña, J.C.; Banerjee, S.K.; Guyodo, Y.; Tauxe, L.; Oldfield, F. Environmental magnetism: Principles and applications. Rev. Geophys. 2012, 50, 393. [Google Scholar] [CrossRef]
- Thompson, R.; Oldfield, F. Environmental Magnetism; Allen & Unwin Ltd.: London, UK, 1986. [Google Scholar] [CrossRef]
- García-Antón, M. Paleovegetación del Pleistoceno Medio de Atapuerca a través del análisis polínico. In Evolución Humana en Europa y los Yacimientos de la Sierra de Atapuerca; Bermúdez de Castro, J.M., Arsuaga, J.L., Carbonell, E., Eds.; Junta de Castilla y León: Valladolid, Spain, 1995; pp. 147–165. [Google Scholar]
- Expósito, I.; Burjachs, F.; Allué, E. Filling in the gaps: The contribution of non-pollen palynomorphs to knowledge about the local environment of the Sierra de Atapuerca caves during the Pleistocene. Quat. Int. 2017, 433, 224–242. [Google Scholar] [CrossRef]
- Cuenca-Bescós, G.; Melero-Rubio, M.; Rofes, J.; Martínez, I.; Arsuaga, J.; Blain, H.-A.; López-García, J.; Carbonell, E.; De Castro, J.B. The Early–Middle Pleistocene environmental and climatic change and the human expansion in Western Europe: A case study with small vertebrates (Gran Dolina, Atapuerca, Spain). J. Hum. Evol. 2011, 60, 481–491. [Google Scholar] [CrossRef] [PubMed]
- D’Arcangelo, S.; Martín-Hernández, F.; Parés, J.M. Magnetic properties of cave sediments at Gran Dolina site in Sierra de Atapuerca (Burgos, Spain). Quat. Int. 2021, 583, 1–13. [Google Scholar] [CrossRef]
- Ortega, A.; Benito-Calvo, A.; Pérez-González, A.; Martín-Merino, M.; Pérez-Martínez, R.; Parés, J.; Aramburu, A.; Arsuaga, J.; de Castro, J.B.; Carbonell, E. Evolution of multilevel caves in the Sierra de Atapuerca (Burgos, Spain) and its relation to human occupation. Geomorphology 2013, 196, 122–137. [Google Scholar] [CrossRef]
- Gil, E.; Aguirre, E.; Hoyos, M. Contexto estratigráfico. In El Hombre Fósil de Ibeas y El Pleistoceno de la Sierra de Atapuerca; Aguirre, E., Carbonell, E., Bermúdez de Castro, J.M., Eds.; Junta de Castilla y León, Consejería de Cultura y Bienestar Social: Valladolid, Spain, 1987; pp. 47–54. [Google Scholar]
- Parés, J.; Pérez-González, A. Magnetochronology and stratigraphy at Gran Dolina section, Atapuerca (Burgos, Spain). J. Hum. Evol. 1999, 37, 325–342. [Google Scholar] [CrossRef] [PubMed]
- Duval, M.; Arnold, L.J.; Demuro, M.; Parés, J.M.; Campaña, I.; Carbonell, E.; de Castro, J.M.B. New chronological constraints for the lowermost stratigraphic unit of Atapuerca Gran Dolina (Burgos, N Spain). Quat. Geochronol. 2022, 71, 101292. [Google Scholar] [CrossRef]
- Campaña, I.; Benito-Calvo, A.; Pérez-González, A.; Ortega, A.; de Castro, J.B.; Carbonell, E. Pleistocene sedimentary facies of the Gran Dolina archaeo-paleoanthropological site (Sierra de Atapuerca, Burgos, Spain). Quat. Int. 2017, 433, 68–84. [Google Scholar] [CrossRef]
- Campaña, I.; Pérez-González, A.; Benito-Calvo, A.; Rosell, J.; Blasco, R.; de Castro, J.M.B.; Carbonell, E.; Arsuaga, J.L. New interpretation of the Gran Dolina-TD6 bearing Homo antecessor deposits through sedimentological analysis. Sci. Rep. 2016, 6, 34799. [Google Scholar] [CrossRef]
- Parés, J.M.; Ortega, A.I.; Benito-Calvo, A.; Aranburu, A.; Arsuaga, J.L.; Bermúdez de Castro, J.M.; Carbonell, E. Paleomagnetic constraints on the Atapuerca karst development (N Spain). In Caves and Karst Across Time; Feinberg, J., Gao, Y., Alexander, E.C., Jr., Eds.; The Geological Society of America: Boulder, CO, USA, 2016; Volume 516, pp. 285–300. [Google Scholar] [CrossRef]
- Álvarez-Posada, C.; Parés, J.M.; Cuenca-Bescós, G.; Van der Made, J.; Rosell, J.; de Castro, J.M.B.; Carbonell, E. A post-Jaramillo age for the artefact-bearing layer TD4 (Gran Dolina, Atapuerca): New paleomagnetic evidence. Quat. Geochronol. 2018, 45, 1–8. [Google Scholar] [CrossRef]
- Mallol, C.; i Roura, E.C. The Collapse of Gran Dolina cave, Sierra de Atapuerca, Spain: Site formation processes of layer TD10-1. Geoarchaeology 2008, 23, 13–41. [Google Scholar] [CrossRef]
- Falguères, C.; Bahain, J.-J.; Yokoyama, Y.; Arsuaga, J.L.; de Castro, J.M.B.; Carbonell, E.; Bischoff, J.L.; Dolo, J.-M. Earliest humans in Europe: The age of TD6 Gran Dolina, Atapuerca, Spain. J. Hum. Evol. 1999, 37, 343–352. [Google Scholar] [CrossRef]
- Parés, J.; Arnold, L.; Duval, M.; Demuro, M.; Pérez-González, A.; de Castro, J.B.; Carbonell, E.; Arsuaga, J. Reassessing the age of Atapuerca-TD6 (Spain): New paleomagnetic results. J. Archaeol. Sci. 2013, 40, 4586–4595. [Google Scholar] [CrossRef]
- Moreno, D.; Falguères, C.; Pérez-González, A.; Duval, M.; Voinchet, P.; Benito-Calvo, A.; Ortega, A.I.; Bahain, J.-J.; Sala, R.; Carbonell, E.; et al. ESR chronology of alluvial deposits in the Arlanzón valley (Atapuerca, Spain): Contemporaneity with Atapuerca Gran Dolina site. Quat. Geochronol. 2012, 10, 418–423. [Google Scholar] [CrossRef]
- Duval, M.; Grün, R.; Parés, J.M.; Martín-Francés, L.; Campaña, I.; Rosell, J.; Shao, Q.; Arsuaga, J.L.; Carbonell, E.; de Castro, J.M.B. The first direct ESR dating of a hominin tooth from Atapuerca Gran Dolina TD-6 (Spain) supports the antiquity of Homo antecessor. Quat. Geochronol. 2018, 47, 120–137. [Google Scholar] [CrossRef]
- Carbonell, E.; de Castro, J.M.B.; Arsuaga, J.L.; Díez, J.C.; Rosas, A.; Cuenca-Bescós, G.; Sala, R.; Mosquera, M.; Rodriguez, X.P. Lower Pleistocene Hominids and Artifacts from Atapuerca-TD6 (Spain). Science 1995, 269, 826–829. [Google Scholar] [CrossRef] [PubMed]
- Blain, H.-A.; Bailon, S.; Cuenca-Bescós, G. The Early–Middle Pleistocene palaeoenvironmental change based on the squamate reptile and amphibian proxies at the Gran Dolina site, Atapuerca, Spain. Palaeogeogr. Palaeoclim. Palaeoecol. 2008, 261, 177–192. [Google Scholar] [CrossRef]
- Blain, H.-A.; Bailon, S.; Cuenca-Bescós, G.; Arsuaga, J.L.; de Castro, J.M.B.; Carbonell, E. Long-term climate record inferred from early-middle Pleistocene amphibian and squamate reptile assemblages at the Gran Dolina Cave, Atapuerca, Spain. J. Hum. Evol. 2009, 56, 55–65. [Google Scholar] [CrossRef] [PubMed]
- Blain, H.-A.; Cuenca-Bescós, G.; Burjachs, F.; López-García, J.M.; Lozano-Fernández, I.; Rosell, J. Early Pleistocene palaeoenvironments at the time of the Homo antecessor settlement in the Gran Dolina cave (Atapuerca, Spain). J. Quat. Sci. 2013, 28, 311–319. [Google Scholar] [CrossRef]
- Blain, H.-A.; Fagoaga, A.; Ruiz-Sánchez, F.J.; García-Medrano, P.; Ollé, A.; Jiménez-Arenas, J.M. Coping with arid environments: A critical threshold for human expansion in Europe at the Marine Isotope Stage 12/11 transition? The case of the Iberian Peninsula. J. Hum. Evol. 2021, 153, 102950. [Google Scholar] [CrossRef]
- Rodríguez, J.; Burjachs, F.; Cuenca-Bescós, G.; García, N.; van der Made, J.; Pérez-González, A.; Blain, H.-A.; Expósito, I.; López-García, J.M.; García Antón, M.; et al. One million years of cultural evolution in a stable environmental at Atapuerca (Burgos, Spain). Quat. Sci. Rev. 2011, 30, 1396–1412. [Google Scholar] [CrossRef]
- Falgéres, C.; Bahain, J.-J.; Yokoyama, Y.; Bischoff, J.L.; Arsuaga, J.L.; de Castro, J.M.B.; Carbonell, E.; Dolo, J.-M. Datation par RPE et U-TH des sites pléistocénes d’Atapuerca: Sima de los Huesos, Trinchera Dolina et Trinchera Galería. bilan géochronologique. L’anthropologie 2001, 105, 71–81. [Google Scholar] [CrossRef]
- Berger, G.; Pérez-González, A.; Carbonell, E.; Arsuaga, J.; de Castro, J.-M.B.; Ku, T.-L. Luminescence chronology of cave sediments at the Atapuerca paleoanthropological site, Spain. J. Hum. Evol. 2008, 55, 300–311. [Google Scholar] [CrossRef] [PubMed]
- Moreno, D.; Falguères, C.; Pérez-González, A.; Voinchet, P.; Ghaleb, B.; Despriée, J.; Bahain, J.-J.; Sala, R.; Carbonell, E.; de Castro, J.M.B.; et al. New radiometric dates on the lowest stratigraphical section (TD1 to TD6) of Gran Dolina site (Atapuerca, Spain). Quat. Geochronol. 2015, 30, 535–540. [Google Scholar] [CrossRef]
- Rosell, J.; Blasco, R.; Campeny, G.; Díez, J.; Alcalde, R.A.; Menéndez, L.; Arsuaga, J.L.; de Castro, J.M.B.; Carbonell, E. Bone as a technological raw material at the Gran Dolina site (Sierra de Atapuerca, Burgos, Spain). J. Hum. Evol. 2011, 61, 125–131. [Google Scholar] [CrossRef] [PubMed]
- Rodríguez-Hidalgo, A.; Saladié, P.; Ollé, A.; Arsuaga, J.L.; de Castro, J.M.B.; Carbonell, E. Human predatory behavior and the social implications of communal hunting based on evidence from the TD10.2 bison bone bed at Gran Dolina (Atapuerca, Spain). J. Hum. Evol. 2017, 105, 89–122. [Google Scholar] [CrossRef]
- Maher, B.; Karloukovski, V.; Mutch, T. High-field remanence properties of synthetic and natural submicrometre haematites and goethites: Significance for environmental contexts. Earth Planet. Sci. Lett. 2004, 226, 491–505. [Google Scholar] [CrossRef]
- Néel, L. Théorie du traînage magnétique des ferromagnétiques en grains fins avec applications aux terres cuites. Ann. Geophys. 1949, 5, 99–136. [Google Scholar]
- Egli, R. Magnetic susceptibility measurements as a function of temperature and frequency I: Inversion theory. Geophys. J. Int. 2009, 177, 395–420. [Google Scholar] [CrossRef]
- Hrouda, F. Models of frequency-dependent susceptibility of rocks and soils revisited and broadened. Geophys. J. Int. 2011, 187, 1259–1269. [Google Scholar] [CrossRef]
- Dearing, J.A.; Dann, R.J.L.; Hay, K.; Lees, J.A.; Loveland, P.J.; Maher, B.; O’Grady, K. Frequency-dependent susceptibility measurements of environmental materials. Geophys. J. Int. 1996, 124, 228–240. [Google Scholar] [CrossRef]
- Kodama, K.P.; Hinnov, L.A. Rock Magnetism. In Rock Magnetic Cyclostratigraphy; Kodama, K.P., Hinnov, L.A., Eds.; John Wiley & Sons: Hoboken, NJ, USA, 2014. [Google Scholar] [CrossRef]
- Font, E.; Veiga-Pires, C.; Pozo, M.; Carvallo, C.; de Siqueira Neto, A.C.; Camps, P.; Fabre, S.; Mirao, J. Magnetic fingerprint of southern Portuguese speleothems and implications for paleomagnetism and environmental magnetism. J. Geophys. Res. Solid Earth 2014, 119, 7993–8020. [Google Scholar] [CrossRef]
- Carrancho, Á.; Villalain, J.J.; Angelucci, D.E.; Dekkers, M.J.; Vallverdú, J.; Vergès, J.M. Rock-magnetic analyses as a tool to investigate archaeological fired sediments: A case study of Mirador cave (Sierra de Atapuerca, Spain). Geophys. J. Int. 2009, 179, 79–96. [Google Scholar] [CrossRef]
- Kruiver, P.P.; Dekkers, M.J.; Heslop, D. Quantification of magnetic coercivity components by the analysis of acquisition curves of isothermal remanent magnetization. Earth Planet Sci. Lett. 2001, 189, 269–276. [Google Scholar] [CrossRef]
- Egli, R. Analysis of the field dependence of remanent magnetization curves. J. Geophys. Res. Atmos. 2003, 108, 2081. [Google Scholar] [CrossRef]
- Dankers, P. Relationship between median destructive field and remanent coercive forces for dispersed natural magnetite, titanomagnetite and hematite. Geophys. J. Int. 1981, 64, 447–461. [Google Scholar] [CrossRef]
- Chaparro, M.A.E.; Sinito, A.M.; Bidegain, J.C.; de Barrio, R.E. Magnetic studies of natural goethite samples from Tharsis, Huelva, Spain. Geofísica Int. 2006, 45, 219–230. [Google Scholar] [CrossRef]
- Özdemir, Ö.; Dunlop, D.J. Hysteresis and coercivity of hematite. J. Geophys. Res. Solid Earth 2014, 119, 2582–2594. [Google Scholar] [CrossRef]
- Ahmadzadeh, M.; Romero, C.; McCloy, J. Magnetic analysis of commercial hematite, magnetite, and their mixtures. AIP Adv. 2018, 8, 056807. [Google Scholar] [CrossRef]
- Roberts, A.P.; Cui, Y.; Verosub, K.L. Wasp-waisted hysteresis loops: Mineral magnetic characteristics and discrimination of components in mixed magnetic systems. J. Geophys. Res. Solid Earth 1995, 100, 17909–17924. [Google Scholar] [CrossRef]
- Frank, U.; Nowaczyk, N.R. Mineral magnetic properties of artificial samples systematically mixed from haematite and magnetite. Geophys. J. Int. 2008, 175, 449–461. [Google Scholar] [CrossRef]
- Day, R.; Fuller, M.; Schmidt, V.A. Hysteresis properties of titanomagnetites: Grain-size and compositional dependence. Phys. Earth Planet. Inter. 1977, 13, 260–267. [Google Scholar] [CrossRef]
- Dunlop, D.J. Theory and application of the Day plot (Mrs/Ms versus Hcr/Hc) 1. Theoretical curves and tests using titanomagnetite data. J. Geophys. Res. Atmos. 2002, 107, 486. [Google Scholar] [CrossRef]
- Roberts, A.P.; Hu, P.; Harrison, R.J.; Heslop, D.; Muxworthy, A.R.; Oda, H.; Sato, T.; Tauxe, L.; Zhao, X. Domain State Diagnosis in Rock Magnetism: Evaluation of Potential Alternatives to the Day Diagram. J. Geophys. Res. Solid Earth 2019, 124, 5286–5314. [Google Scholar] [CrossRef]
- King, J.; Banerjee, S.K.; Marvin, J.; Özdemir, Ö. A comparison of different magnetic methods for determining the relative grain size of magnetite in natural materials: Some results from lake sediments. Earth Planet. Sci. Lett. 1982, 59, 404–419. [Google Scholar] [CrossRef]
- Galán, J.; Núñez-Lahuerta, C.; Moya-Costa, R.; López-García, J.M.; Cuenca-Bescós, G. Fossil bat assemblages as palaeoenvironmental and palaeoclimatic indicators: A case study in the Lower to Middle Pleistocene Gran Dolina sequence of Sierra de Atapuerca, Northern Spain. Palaeogeogr. Palaeoclim. Palaeoecol. 2019, 535, 109365. [Google Scholar] [CrossRef]
- Blanco-Lapaz, A.; Martínez-Monzón, A.; Blain, H.-A.; Cuenca-Bescós, G. Early-Middle Pleistocene freshwater ecosystems in the Sierra de Atapuerca (northern Iberia) based on the Gran Dolina fish record. Palaeogeogr. Palaeoclim. Palaeoecol. 2021, 574, 110444. [Google Scholar] [CrossRef]
- Maher, B.; Possolo, A. Statistical models for use of palaeosol magnetic properties as proxies of palaeorainfall. Glob. Planet. Chang. 2013, 111, 280–287. [Google Scholar] [CrossRef]
- Maher, B. Characterisation of soils by mineral magnetic measurements. Phys. Earth Planet. Inter. 1986, 42, 76–92. [Google Scholar] [CrossRef]
- Hanesch, M.; Scholger, R. The influence of soil type on the magnetic susceptibility measured throughout soil profiles. Geophys. J. Int. 2005, 161, 50–56. [Google Scholar] [CrossRef]
- Torrent, J.; Guzman, R. Crystallization of Fe(III)-Oxides from ferrihydrite in salt solutions: Osmotic and specific ion effects. Clay Miner. 1982, 17, 463–469. [Google Scholar] [CrossRef]
- Antoñanzas, R.L.; Bescós, G.C. The Gran Dolina site (Lower to Middle Pleistocene, Atapuerca, Burgos, Spain): New palaeoenvironmental data based on the distribution of small mammals. Palaeogeogr. Palaeoclim. Palaeoecol. 2002, 186, 311–334. [Google Scholar] [CrossRef]
- Ellwood, B.B.; Petruso, K.M.; Harrold, F.B.; Korkuti, M. Paleoclimate Characterization and Intra-Site Correlation Using Magnetic Susceptibility Measurements: An Example from Konispol Cave, Albania. J. Field Archaeol. 1996, 23, 263–271. [Google Scholar] [CrossRef]
- Ellwood, B.B.; Zilhão, J.; Harrold, F.B.; Balsam, W.; Burkart, B.; Long, G.J.; Debénath, A.; Bouzouggar, A. Identification of the last glacial maximum in the upper Palolithic of Portugal using magnetic susceptibility measurements of Caldeirão cave sediments. Geoarchaeology 1998, 13, 55–71. [Google Scholar] [CrossRef]
- Sroubek, P.; Diehl, J.F.; Kadlec, J.; Valoch, K. A Late Pleistocene palaeoclimate record based on mineral magnetic properties of the entrance facies sediments of Kulna Cave, Czech Republic. Geophys. J. Int. 2001, 147, 247–262. [Google Scholar] [CrossRef]
- Arnold, L.J.; Demuro, M.; Parés, J.M.; Pérez-González, A.; Arsuaga, J.L.; de Castro, J.M.B.; Carbonell, E. Evaluating the suitability of extended-range luminescence dating techniques over early and Middle Pleistocene timescales: Published datasets and case studies from Atapuerca, Spain. Quat. Int. 2015, 389, 167–190. [Google Scholar] [CrossRef]
- Falguères, C.; Bahain, J.-J.; Bischoff, J.L.; Pérez-González, A.; Ortega, A.I.; Ollé, A.; Quiles, A.; Ghaleb, B.; Moreno, D.; Dolo, J.-M.; et al. Combined ESR/U-series chronology of Acheulian hominid-bearing layers at Trinchera Galería site, Atapuerca, Spain. J. Hum. Evol. 2013, 65, 168–184. [Google Scholar] [CrossRef]
- Wang, Y.; Yang, X.; Wang, Y.; Wang, Q.; Edwards, R.L. The structure of marine isotope Stage 11 and its alignment with the Holocene. Palaeogeogr. Palaeoclim. Palaeoecol. 2023, 609, 111311. [Google Scholar] [CrossRef]
- Candy, I.; Schreve, D.C.; Sherriff, J.; Tye, G.J. Marine Isotope Stage 11: Palaeoclimates, palaeoenvironments and its role as an analogue for the current interglacial. Earth-Sci. Rev. 2014, 128, 18–51. [Google Scholar] [CrossRef]


| Equations Acronyms and Symbols | |
|---|---|
| Susceptibility at low field | χlf |
| Frequency-dependent susceptibility normalized | χfn |
| Frequency-dependent susceptibility | χfd |
| High frequency | χhf |
| Low frequency | χlf |
| Absolute temperature | T |
| Magnetic Quantities | |
| Volume susceptibility | Κ |
| Mass susceptibility | χ |
| Magnetization | M |
| Magnetizing field | H |
| Magnetic induction | B |
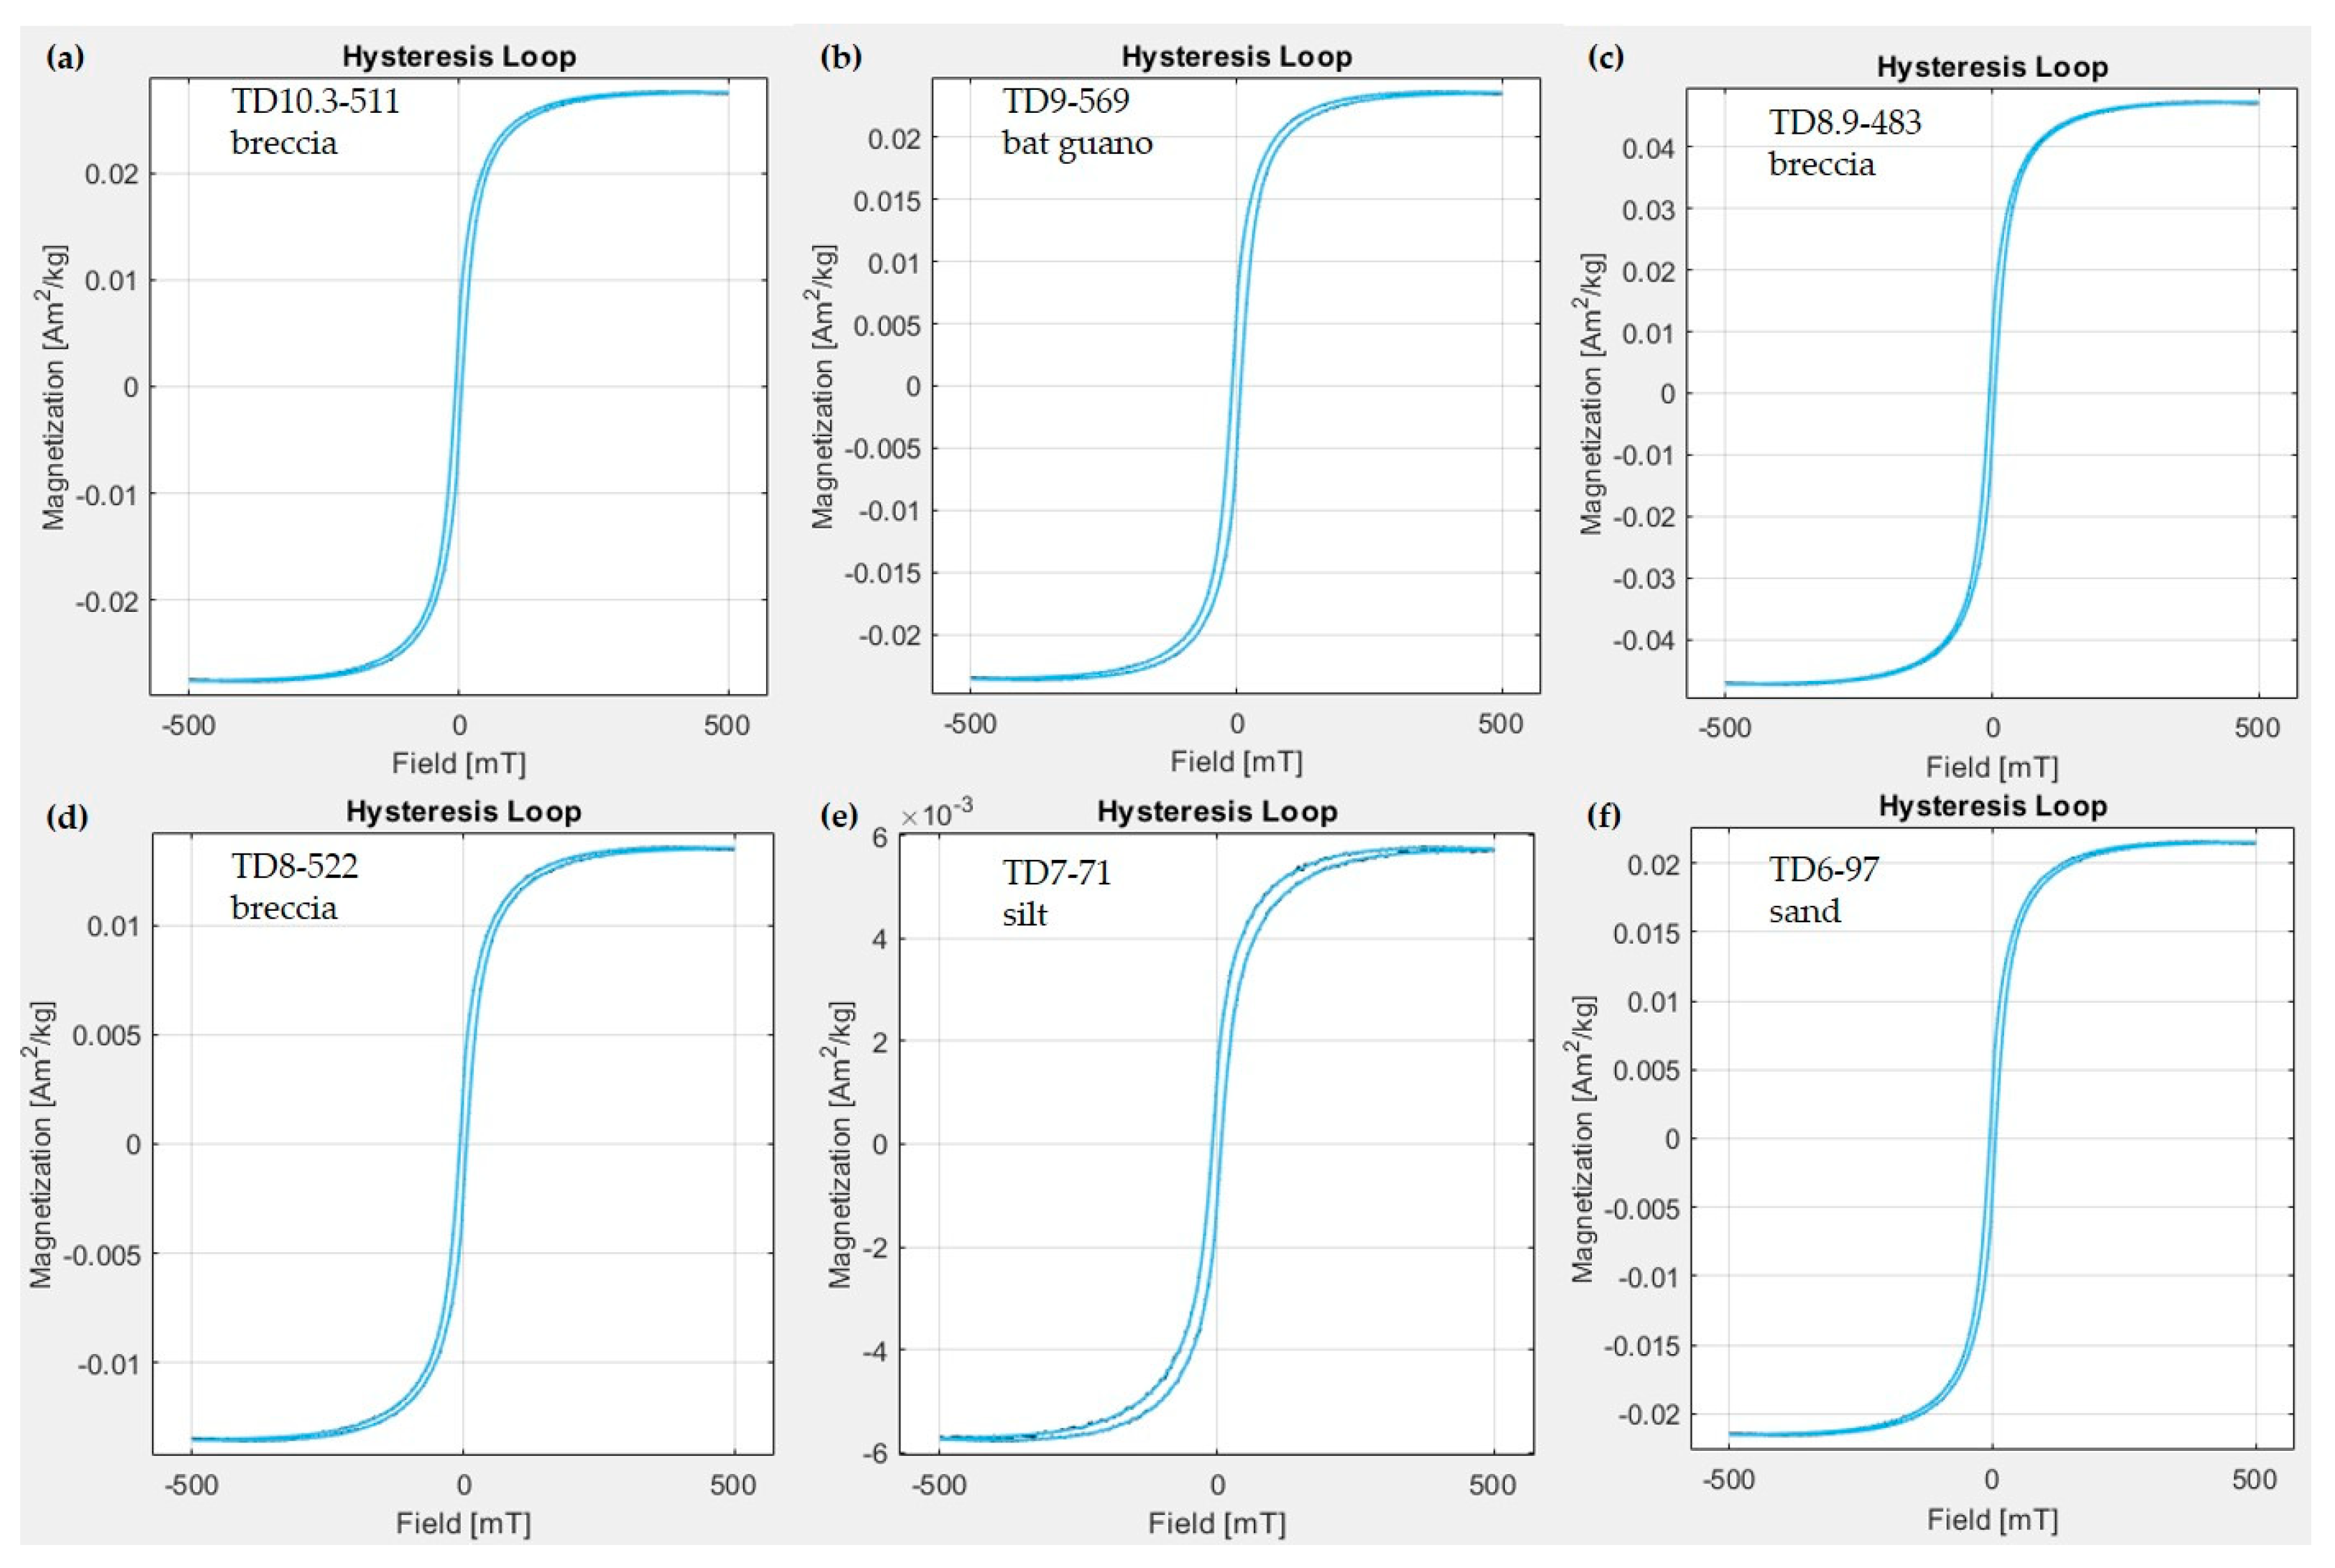
| Saturation magnetization | Ms |
| Saturation remanence magnetization | Mrs |
| Coercive force | Hc |
| Coercivity of remanence | Hcr |
| Remanent Magnetization | |
| Isothermal remanent magnetization | IRM |
| Anhysteretic remanent magnetization | ARM |
| Magnetic Grain Size | |
| Superparamagnetic particles | SP |
| Single-domain particles | SD |
| Pseudo-single domain particles | PSD |
| Multi-domain particles | MD |
| Concentration | |
|---|---|
| Magnetic susceptibility | Estimate of ferrimagnetic material |
| Frequency-dependent susceptibility | Used to indicate the presence of SP material |
| Saturation Isothermal Remanent Magnetization | Parameter sensitive to the concentration of principally ferrimagnetic material |
| Anhysteretic Remanent Magnetization | Measure of the concentration of ferrimagnetic material |
| Composition | |
| S-ratio | Estimate of the magnetic mineralogy |
| Thermomagnetic curve | Furnishes the Curie point |
| Magnetic Grain Size | |
| Frequency-dependent susceptibility | Mostly grain size dependent |
| King plot | Slope is a function of grain size |
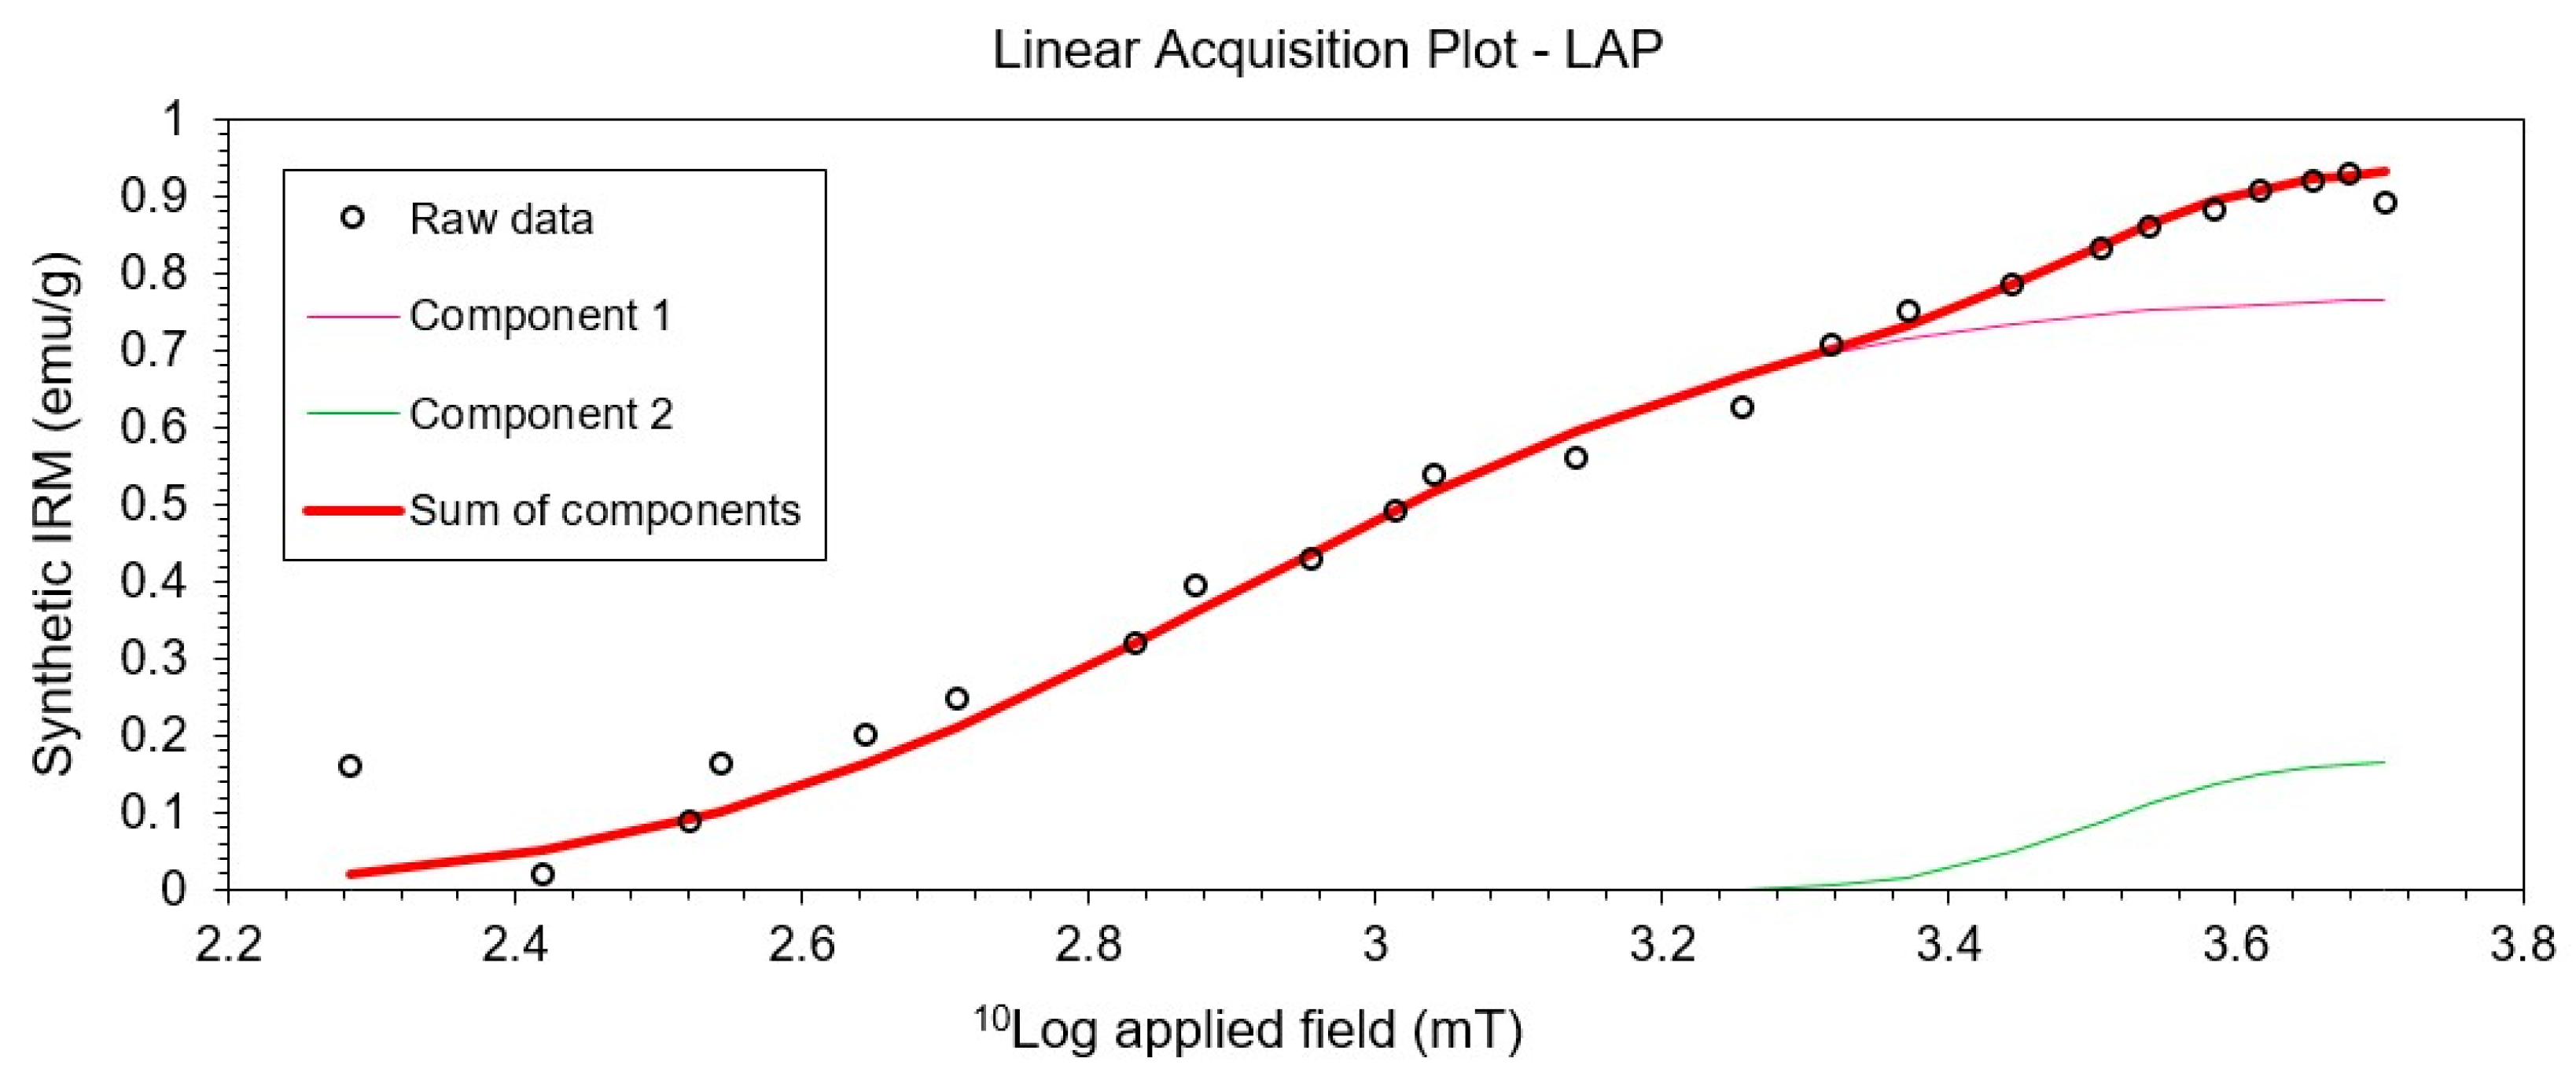
| Sample | Component 1 | Component 2 | Component 3 | ||||||||
|---|---|---|---|---|---|---|---|---|---|---|---|
| SIRM (mA/m) | B1/2 (mT) | DP (mT) | IRM (%) | SIRM (mA/m) | B1/2 (mT) | DP (mT) | IRM (%) | SIRM (mA/m) | B1/2 (mT) | DP (mT) | |
| 10.3-546 | 1.3 × 10⁻³ | 338.84 | 1.8 | 65 | 7.1 × 10⁻⁴ | 1258.93 | 1.8 | 35 | |||
| 10.3-511 | 7.8 × 10⁻⁴ | 218.78 | 2.0 | 55 | 6.5 × 10⁻⁴ | 1258.93 | 2.0 | 45 | |||
| 10.2-477 | 8.4 × 10⁻⁴ | 316.23 | 2.0 | 53 | 7.6 × 10⁻⁴ | 794.33 | 2.0 | 48 | |||
| 9-586 | 7.7 × 10⁻¹ | 794.33 | 2.1 | 82 | 1.7 × 10⁻¹ | 3162.28 | 1.3 | 18 | |||
| 9-569 | 1 × 10⁻³ | 281.84 | 2.1 | 61 | 6.5 × 10⁻⁴ | 1122.02 | 2.0 | 39 | |||
| 8.9-492 | 5.5 × 10⁻⁴ | 251.19 | 1.8 | 55 | 3.7 × 10⁻⁴ | 1412.54 | 1.7 | 37 | 8.5 × 10⁻⁵ | 1584.9 | 1.9 |
| 8.9-483 | 5.3 × 10⁻⁴ | 165.96 | 1.9 | 37 | 5 × 10⁻⁴ | 416.87 | 1.9 | 35 | 3.9 × 10⁻⁴ | 794.33 | 2.0 |
| 8-522 | 5.2 × 10⁻⁴ | 338.84 | 1.9 | 53 | 4.7 × 10⁻⁴ | 1412.54 | 1.9 | 47 | |||
| Unit | Pollen [4] | Non-Pollen Palynomorphs [5] | Small Vertebrates [6] | Bats [52] | Fish [53] |
|---|---|---|---|---|---|
| TD10 | Dry and cold conifers woodland | Oscillations of moisture in typical Mediterranean summer | Dry and cold conditions | Low diversity woodland | Decrease in the open-dry habitats and in open humid and woodland ones |
| TD9 | Faeces and other decaying organic material | ||||
| TD8.9 | Early traces of later aridity phase | Open-dry areas with sparse forests | Medium diversity of open woodland | ||
| TD8 | Warm, humid and wooded conditions | High humidity and decay wood or vegetative remains | Colder climate | High diversity open woodland | |
| TD7 | Woodland | Humid and forested areas | |||
| TD6.1 | Temperate climate | Decrease in local humidity | Water-edge habitat | Top of the coldest period of the entire sequence |
| Unit | ESR/U-Series (ka) [17] | TL and IRSL (ka) [28] | U-Series TIMS (ka) [63] | ESR-OB (ka) [29] | TT-OSL (ka) [62] |
|---|---|---|---|---|---|
| TD10 | 372 ± 33 | 244 ± 26 430 ± 59 | 301 ± 40 458 ± 39 | ||
| TD9 | 480 ± 130 | 418 ± 113 427 ± 267 | 544 ± 94 565 ± 56 566 ± 81 | ||
| TD8 | 602 ± 52 | 820 ± 140 | 520 ± 129 473 ± 26 525 ± 26 | ||
| TD7 | 960 ± 140 | 734 ± 128 852 ± 144 | |||
| TD6 | 856 ± 75 |
Disclaimer/Publisher’s Note: The statements, opinions and data contained in all publications are solely those of the individual author(s) and contributor(s) and not of MDPI and/or the editor(s). MDPI and/or the editor(s) disclaim responsibility for any injury to people or property resulting from any ideas, methods, instructions or products referred to in the content. |
© 2023 by the authors. Licensee MDPI, Basel, Switzerland. This article is an open access article distributed under the terms and conditions of the Creative Commons Attribution (CC BY) license (https://creativecommons.org/licenses/by/4.0/).
Share and Cite
D’Arcangelo, S.; Martín-Hernández, F.; M. Parés, J. Environmental Reconstruction from the Identification of Magnetic Minerals in the Upper Sedimentary Infill of the Gran Dolina Cave (Burgos, Spain). Appl. Sci. 2023, 13, 4580. https://doi.org/10.3390/app13074580
D’Arcangelo S, Martín-Hernández F, M. Parés J. Environmental Reconstruction from the Identification of Magnetic Minerals in the Upper Sedimentary Infill of the Gran Dolina Cave (Burgos, Spain). Applied Sciences. 2023; 13(7):4580. https://doi.org/10.3390/app13074580
Chicago/Turabian StyleD’Arcangelo, Serena, Fátima Martín-Hernández, and Josep M. Parés. 2023. "Environmental Reconstruction from the Identification of Magnetic Minerals in the Upper Sedimentary Infill of the Gran Dolina Cave (Burgos, Spain)" Applied Sciences 13, no. 7: 4580. https://doi.org/10.3390/app13074580
APA StyleD’Arcangelo, S., Martín-Hernández, F., & M. Parés, J. (2023). Environmental Reconstruction from the Identification of Magnetic Minerals in the Upper Sedimentary Infill of the Gran Dolina Cave (Burgos, Spain). Applied Sciences, 13(7), 4580. https://doi.org/10.3390/app13074580