Abstract
A commonly adopted dehumidification system on a suspension bridge is the desiccant wheel dehumidification system (DWDS), which demonstrates ineffectiveness and energy-intensiveness in high temperature and humidity scenarios. This paper proposes a suspension bridge hybrid dehumidification system (HDS) as a better alternative for corrosion protection. A numerical model of HDS was first established. Then, the effects of the main operating parameters on HDS were analyzed, and the dehumidification performance of HDS and DWDS was further compared to illustrate the superiority of HDS to apply on a suspension bridge. In addition, the air supply parameter was discussed, and a low-energy operation strategy of HDS in summer cases was proposed. Finally, limitations and adaptations of heat pump dehumidification system (HPDS) and DWDS on suspension bridges were discussed. The results showed that: (1) HDS realizes the utilization of waste energy from suspension bridges, enhancing the system efficiency. Its specific moisture extraction rate () reaches 3.16 kg kW−1 h−1 in a high-temperature and -humidity environment (35 °C, 30.82 g kg−1) of the suspension bridge. (2) In the same inlet air conditions, HDS has greater dehumidification capacity than DWDS, and this advantage is enlarged with the increment of inlet air temperature and moisture content. In addition, HDS can strengthen dehumidification ability by decreasing the evaporation temperature and increasing the regeneration temperature to meet peak moisture loads of the suspension bridge. (3) Considering the anti-corrosion effects, energy consumption and drying time, the authors recommend that the moisture content corresponding to the atmospheric temperature and RH of 45% be used for air supply on a suspension bridge. (4) HPDS has poor adaptability to temperatures below 20 °C, while DWDS has poor adaptability to some high temperatures of 24~40 °C and high humidities of 19~30 g kg−1. None of them can meet the air supply requirements of a suspension bridge’s main cable alone.
1. Introduction
The main cable of suspension bridges usually consists of high-tensile galvanized steel wires, which are under severe corrosion environments due to the water and high temperature inside the cable [1,2,3]. Studies have shown that there are two main sources of moisture within the main cable: one is the penetration of moisture in the atmosphere and the other is the accumulation of moisture during cable erection [4,5]. The conventional anti-corrosion method is to form a protective layer on the surface of the main cable to block the penetration of moisture in the atmosphere, but it cannot solve the corrosion caused by the water trapped during cable erection [6,7]. Through studies on the mechanism of corrosion, researchers have proven that when the relative humidity (RH) is below 40%, the corrosion rate of steel is very low. When the RH is between 40% and 60%, the corrosion rate rises slowly. When the RH is higher than 60%, the corrosion rate rises sharply [8,9,10,11].
Based on this principle, Japan took the lead in proposing the main cable dehumidification system and conducted various engineering explorations [12]. In the early 1990s, the main cable dehumidification system was first implemented on the Akashi Kaikyo Bridge in Japan, which injected dry air into the main cable to control the RH inside the main cable to lower than 60% [13,14]. 
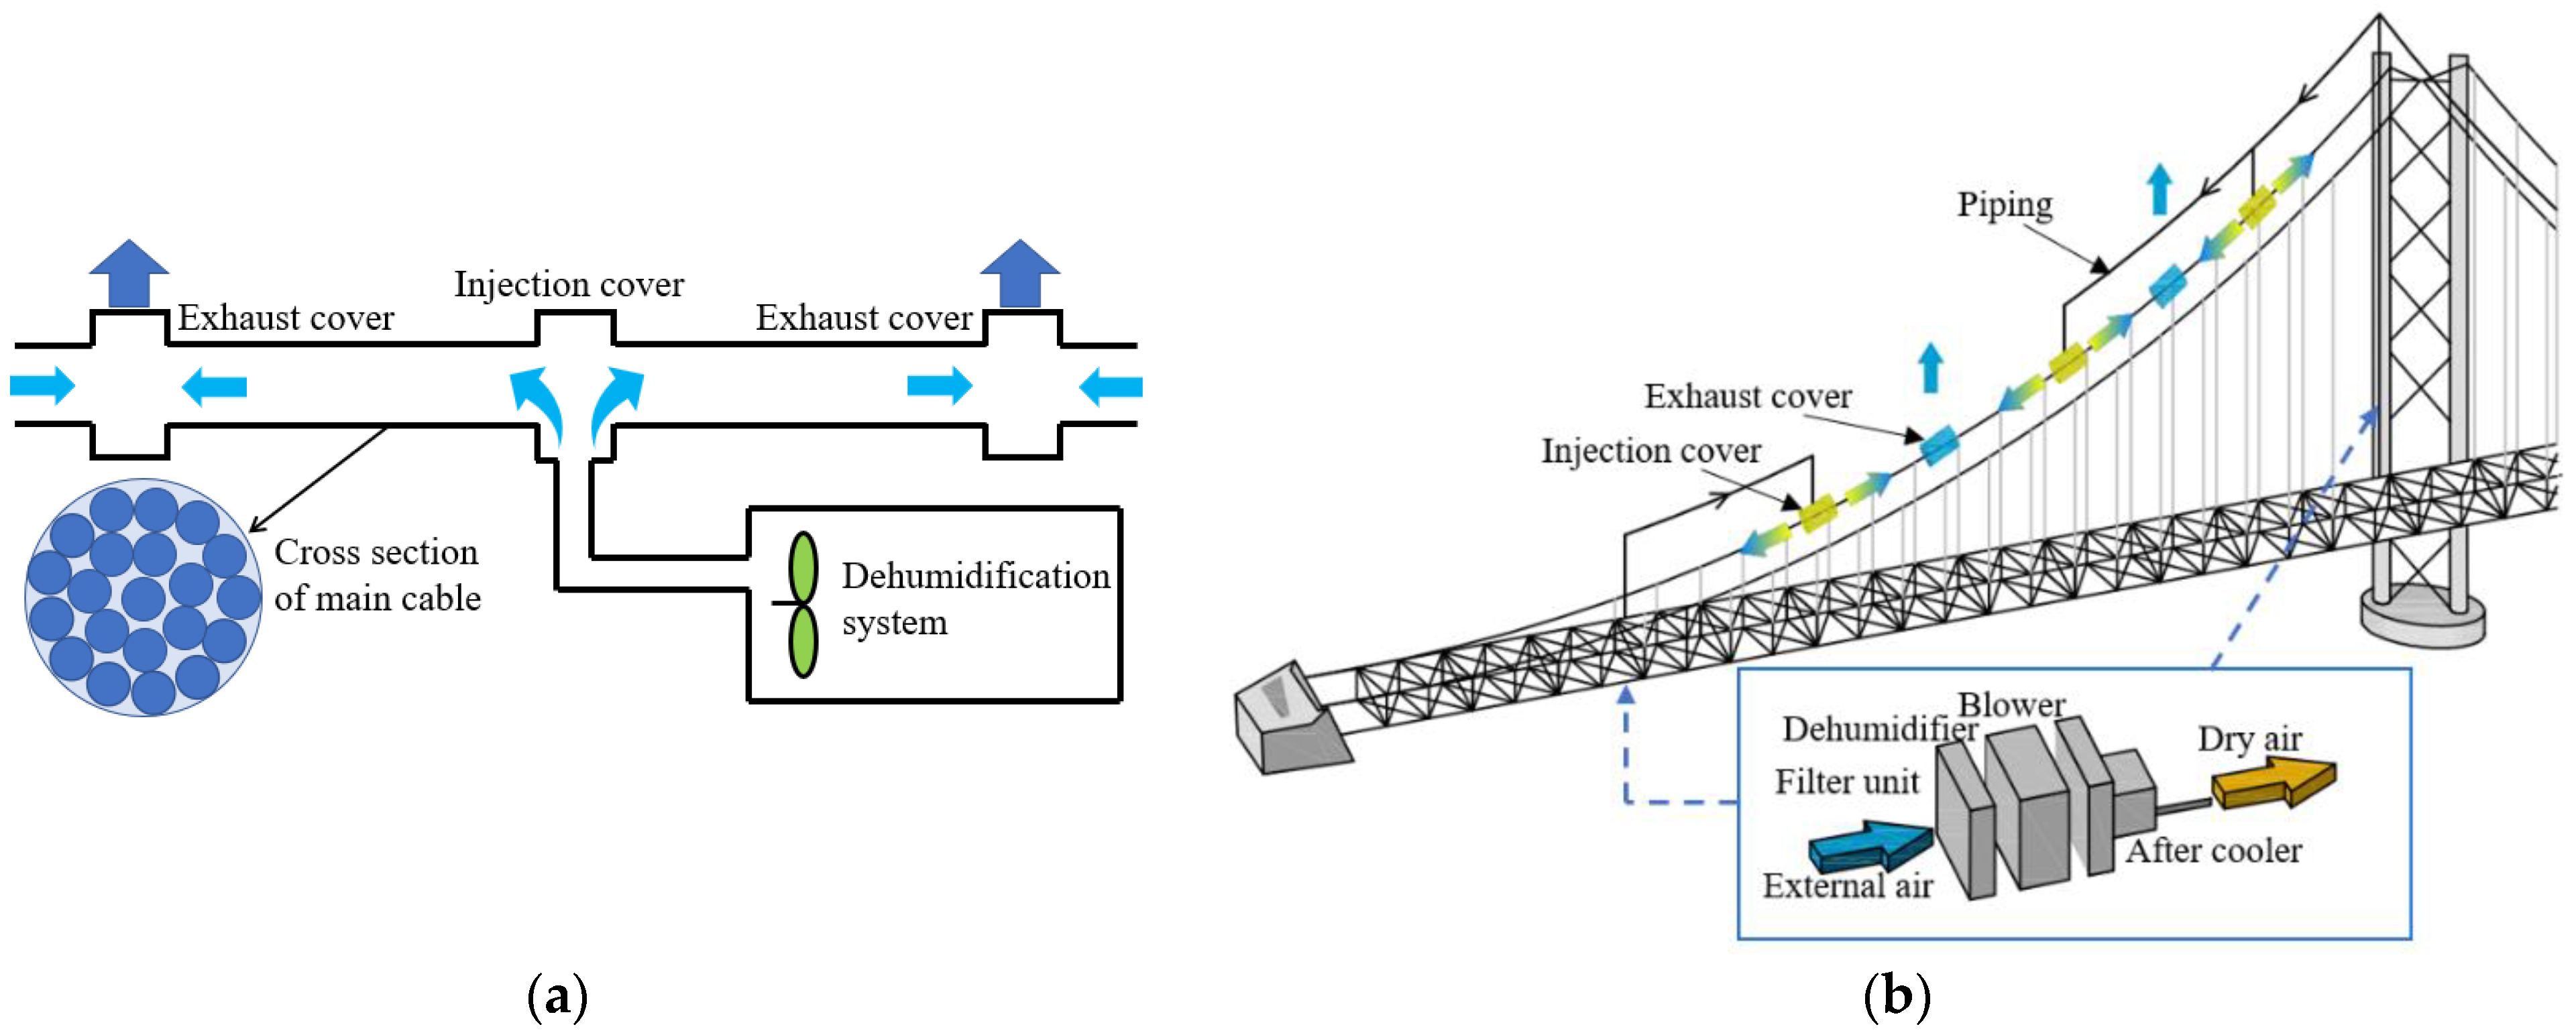
Figure 1b shows the layout of the cable dehumidification system [12]. It is mainly composed of a filter unit to remove impurities, a dehumidification plant to remove moisture from the air, a blower that supplies air to the main cable and an aftercooler unit to chill the dry air. Figure 1a shows the flow of air inside the main cable.
Figure 1.
The principle of main cable dehumidification. Reprinted/adapted with permission from Ref. [12]. 2021, Elsevier. (a) The flow of air inside the main cable. (b) Layout of the cable dehumidification system.
Among these components, the dehumidification unit is critical because it directly determines the humidity of the dry air. In most of the existing suspension bridges, the desiccant wheel dehumidification system (DWDS) based on solid desiccant adsorption is the sole dehumidification plant [7,11]. However, DWDS are often unable to meet peak wet loads because of the severe and rapidly changing temperature and humidity in the summer. Moreover, the electric heating energy consumption of the regeneration process is high [15,16]. In addition, there is a lack of discussion on air supply parameters in the field of main cable dehumidification, which is not conducive to the selection and performance evaluation of the dehumidification plant. Therefore, the research on dehumidification plants for main cables is of great significance.
For main cable dehumidification systems, previous studies mainly focused on control and monitoring systems, air supply systems and sealing systems. Gao [17] proposed that optimizing the detection and control system of the main cable dehumidification system could reduce energy consumption and improve dehumidification efficiency. Chen et al. [18] designed a dehumidification system in which dry air was delivered from the center of the main cable section. It could reduce the gas flow loss during the air delivery process and improve the dehumidification efficiency of the main cable delivery. Betti et al. [13] presented a corrosion monitoring system that could be embedded in the main cable of the suspension bridge and measured temperature, RH and corrosion rate at various points in the cable cross-section. Tan et al. [19] proposed that the main cable dehumidification system combined with the traditional anti-corrosive system could improve the durability of the main cable. Matthew et al. [5] designed a sensor network to monitor the environmental conditions and corrosion activity within the main cable.
In recent years, researchers conducted studies on improving the performance of dehumidification plants based on acquired running data. Gao [17] indicated that the combination of dehumidification plants based on different methods to form an energy-efficient system was the development direction of the main cable dehumidification system. Christodoulou et al. [20] recommended that, as the cable dried out, the set of the initial RH of the dry air should be increased to reduce long-term running costs. Peng et al. [21] proposed a heat recovery-based anti-corrosive dehumidification system for the main cable, which would recover the waste heat after the roots blower by adding a heat exchanger, and would save about 40% on energy consumption. Bloomstine [22] recommended developing an integrated system using one set of dehumidification plants to provide dry air for all parts of the suspension bridge could significantly reduce construction costs and maintenance costs. Kitagawa et al. [6] suggested that operating dehumidification plants only during specified periods could reduce running costs. Sun et al. [23] set up a heat exchanger auxiliary system in the main cable dehumidification system to preheat the regenerative air with the treated air, which saves about 30% on energy consumption. These studies reduce the energy consumption of dehumidification plants to a certain extent but fail to fundamentally solve the problem of insufficient dehumidification capacity of the existing plants on suspension bridges.
The combination of a heat pump drying system (HPDS) and DWDS can effectively improve the dehumidification capacity. Although this has been widely studied in the field of building, it is difficult to apply the existing research results directly to a suspension bridge because there are many differences between suspension bridges and buildings in dehumidification demand. For instance, the temperature and humidity of suspension bridges are more severe and rapidly changing than that of buildings. The total dehumidification capacity required is exceptionally high for suspension bridges compared with buildings. An array of varied outdoor parameters will necessitate the use of sophisticated system controls and strategies. Therefore, currently available dehumidification technologies should be improved to adapt to suspension bridges. In addition, using separated heat pipes to preheat the regenerated air can improve the energy efficiency of dehumidification systems. However, this has been ignored in existing studies. In conclusion, the research aiming at the characteristics of suspension bridges to improve the dehumidification system is not comprehensive. Therefore, it is necessary to study the performance of a hybrid dehumidification system (HDS), which could be a better alternative for corrosion protection of the main cable.
Our previous studies [12,24] explored a potential development of a multi-stage dehumidification system using condensing dehumidification and solid desiccant dehumidification. It could contribute to the multi-stage utilization of waste energy and improve system efficiency. Based on the previous conceptual design, a further numerical study would be followed. Hence, we proposed the HDS adapted for suspension bridge corrosion protection. A numerical model of HDS was first established. Then, the effects of the main operating parameters on HDS were analyzed, and the dehumidification performance of HDS and DWDS was further compared to illustrate the superiority of HDS to apply on a suspension bridge. In addition, the air supply parameter was discussed, and a low-energy operation strategy of HDS in summer cases was proposed. Finally, limitations and adaptations of HPDS and DWDS on suspension bridges were discussed.
2. System Description of the HDS
HDS is mainly composed of an HPDS and a DWDS, which includes a dehumidification process, regeneration process, pressurization process and aftercooling process. Figure 2 shows the schematic of the HDS. Figure 3 shows the state of air in HDS. The dehumidification process first cools the air from 1 to 2 in evaporation, which reduces air temperature and moisture content. Then, the air is further dried from 2 to 3 in a desiccant wheel. During the regeneration process, after being preheated by a condenser from 1 to 6, the air enters a heat pipe condenser section, in which it is further preheated from 6 to 7. Then, the preheated air is heated from 7 to 8 in a heater. Finally, the air enters the regeneration area of the desiccant wheel for desorption, as shown in processes 8 to 9. Following dehumidification, the air is pressurized with a blower. During this process, the air is heated from 3 to 5 due to the generated heat from the compressed air of the blower and from the friction of the fan rotor. Then, the air is cooled from 5 to 4 by a heat pipe evaporator and finally cooled from 4 to 10 by an aftercooler. The pressurization system is to provide the power for dry air to flow through the main cable, while the aftercooling system is to cool the high-temperature dry air to below 60 °C to prevent damage to the polyethylene transmission pipeline.
Figure 2.
Schematic of the hybrid dehumidification system (HDS).
Figure 3.
State of air in HDS.
3. Numerical Modeling of HDS
The components of the HDS are mainly composed of an evaporator, condenser, compressor, desiccant wheel, separated heat pipe and roots fans. The numerical model of each component is established by MATLAB software.
3.1. Compressor
The working process of the compressor is complex. The following assumptions are made to facilitate analysis. (1) The compression process is adiabatic. (2) Pressure loss during the inspiratory and exhaust processes can be neglected. (3) Adiabatic exponent of refrigerant is constant.
Based on the above assumptions, the compression process of the refrigerant can be described by the following equations [25].
where and are the exhaust temperature and inlet temperature, respectively. and are the condensation pressure and evaporation pressure, respectively. is the mass flow of the refrigerant. is the specific volume of suction. is the volumetric efficiency, and the in this system is 0.9. is the theoretical exhaust volume of the compressor. is the energy consumption per unit mass. is the adiabatic exponent of the refrigerant. The refrigerant in this system is R22, and the of R22 is 1.16.
3.2. Heat Exchangers
When the heat exchanger operation is stable, the air and refrigerant achieve stationary energy balance, and heat transfer capacity can be calculated by the refrigerant heat transfer capacity, air import and export state parameters, or according to convective heat transfer capacity. It should be noted that there is water vapor condensing on the evaporator, so the air sensible heat is not equal to all the heat exchange of the evaporator. Therefore, the heat transfer capacity of the evaporator and condenser can be calculated by the following equations:
where subscript indicates the property for the evaporator and subscript indicates the property for the condenser. The subscripts and indicate inlet and outlet, respectively. The subscripts and indicate refrigerant and air, respectively. is the temperature. is the heat transfer capacity. is the mass flow of air. is enthalpy. and A are the heat transfer coefficient and area of the heat exchanger. is the logarithmic mean temperature difference between the air and the refrigerant. is the specific heat at a constant pressure.
The formula for the and is shown in the literature [26].
The finned tube heat exchanger is used in this system, and its structural parameters are shown in Table 1.
Table 1.
Structural parameters of evaporator and condenser.
3.3. Desiccant Wheel
Some general assumptions are as follows. (1) The length of the airflow direction far exceeds the thickness of the runner wall so that the model can be simplified to one dimension. (2) The axial heat conduction and mass diffusion inside the solid desiccant is much lower than the wall thickness direction and can be ignored. (3) The size of the airflow channel is evenly distributed. (4) The thermophysical properties of the desiccant can be treated as constant.
According to the conservation laws of energy and mass, and the heat and mass transfer between the air and the desiccant wheel, the following control equation can be obtained [27].
where indicates time. is the channel cross-sectional area, and is the boundary length of a channel. is the density. The and are the specific desiccant mass and specific matrix material mass, respectively. is the velocity of airflow. is the temperature. is the heat transfer coefficient. is the mass transfer coefficient. is the air moisture content on the surface of the desiccant. is the air moisture content. is the desiccant water content. , , , and are the specific heat at a constant pressure of air, water vapor, silica gel, saturated water and matrix materials, respectively. The subscript indicates the property of the matrix material. is the water/silica adsorption heat.
and are calculated by the following equations [28]:
where is the thermal conductivity of air, and is the mass diffusion coefficient of water vapor in the air. and are Nusselt numbers and Sherwood numbers, respectively.
The water/silica adsorption heat is calculated by Equation (13) [29]:
where the is the evaporation’s latent heat.
RH of the silica gel surface can be calculated by Equation (14) [30]:
The Antonine equation gives the pressure of saturated water vapor [31]:
The relationship between moisture content and RH can be described by Equation (16) [28]:
The values of the parameters used in the numerical calculation of the desiccant wheel are shown in Table 2.
Table 2.
The parameters used in the numerical calculation of the desiccant wheel.
3.4. Separated Heat Pipe
A separate heat pipe consists of an evaporator, a condenser, a rising pipe and a falling pipe. The working fluid in the separate heat pipe is R134a [32]. The flow on the refrigerant side and the air side is evenly distributed, assuming a one-dimensional flow in the refrigerant heat exchanger. The evaporator and condenser in this system are finned tube type, and the structural parameters are shown in Table 3. The power of the working fluid cycle in the heat pipe can be calculated by Equation (17).
where is the density of saturated liquid working fluid, is the gas–liquid two-phase density in the evaporator, the gas–liquid two-phase density in the condenser, is the density of the saturated gaseous working fluid, is the acceleration of gravity, and , and are the height of the evaporator, the height of the condenser and the height difference between the two, respectively.
Table 3.
Structural parameters of separated heat pipe.
The density of the two-phase zone can be calculated by Equation (18).
where is the dryness of the two-phase zone.
The pressure drop of the refrigerant can be calculated by Equation (19).
where and are the pressure drop of the refrigerant in the evaporator and condenser, respectively, and can be calculated by the formula of Friedel [33]. and are the pressure drop of the refrigerant in the rising and falling pipes, respectively, and can be calculated by the formula of Gnielinski [34].
The heat transfer between air and refrigerant can be calculated by Equation (20).
The heat transfer coefficient of the inner tube of the evaporator is calculated by the formula of Cooper [35], and the heat transfer coefficient in the condenser is shown in the literature [36].
3.5. Roots Fans
The exhaust temperature of the roots fan can be calculated by the following equations.
where is the gas adiabatic index. and are the exhaust temperature and suction temperature, respectively. and are the exhaust pressure and suction pressure, respectively. is the volumetric efficiency of the fan, and the in this system is 0.85. is the temperature deviation caused by heat dissipation, = 5–20 °C.
3.6. System Performance Indices
The dehumidification capacity () reflecting the ability of the dehumidification plant can be calculated by Equation (23).
where and represent the air moisture content of the inlet and outlet, respectively.
The total energy consumption () of HDS can be calculated by Equation (24).
where is the compressor’s energy consumption. is the fan’s energy consumption. is the heater’s energy consumption.
The specific moisture extraction rate () is a comprehensive index to evaluate the dehumidification ability and energy consumption of the dehumidification system and can be calculated by Equation (25).
4. Results and Discussion
4.1. Performance Analysis of HDS
The following parts will discuss the effects of evaporation temperature and regeneration temperature on the performance of HDS.
4.1.1. Evaporation Temperature
As illustrated by Figure 4a,c, the gradually increases and then reduces with the evaporation temperature increasing, and the evaporation temperature corresponding to the optimal is marked in Figure 4a,c. The optimal rises up with the increment of moisture content, reaching a maximum of 3.16 kg kW−1 h−1. This indicates that HDS has a more efficient moisture load handling capacity as the humidity near the suspension bridge increases. As shown in Figure 4c, when inlet air temperature increases, the optimal slightly decreases, reaching a minimum of 2.45 kg kW−1 h−1. The main reason is that the increment of evaporator sensible heat load as inlet air temperature rises. When the cooling capacity is constant, the dehumidification capacity decreases, which leads to a slight decrease in optimal . Although the high temperature near the suspension bridge is not conducive to the work of the dehumidification plant, the HDS can weaken the negative effects, resulting in only a slight decrease in optimal .
Figure 4.
The effects of evaporation temperature on performance. (a) Specific moisture extraction rate (). (b) and . (c) . (d) and .
Above all, HDS can improve the by reducing the evaporation temperature. This fundamentally overcomes the problem of DWDS lacking dehumidification ability and strengthens the protective effects of the main cable in severe cases. Figure 4b,d show the change in and with the evaporation temperature. In the five simulated inlet air cases, the of the HDS rises up with the decrease in evaporation temperature. Although it is accompanied by an increase in , the improvement of main cable protection reliability due to the increment of is more important.
Figure 5 shows the optimal cooling capacity in different cases. Although the inlet air cases are different, the optimal cooling capacity is about 3.5 kW. For structurally defined systems, neither low load operation nor overload operation can optimize the . As a result, for HDS designed in this paper, will be optimal as long as the cooling capacity of the evaporator is controlled to 3.5 kW. This result can be used for the optimal control of HDS in various cases of suspension bridges.
Figure 5.
Optimal cooling capacity in different cases.
4.1.2. Regeneration Temperature
Figure 6a shows the relationship between regeneration temperature and . When the regeneration temperature increases, the decreases. Figure 6b shows the effects of regeneration temperature on and . When the regeneration temperature increases, the increases, but the rate slows down and increases roughly linearly. It could be due to the increment of desiccant wheel temperature, which hinders the mass transfer between air and desiccant. As a result, increased at a slowed rate. HDS can also improve by increasing the regeneration temperature, but the range of adjustment is limited due to the maximum regeneration temperature generally below 140 °C and comes at the cost of high . This is also the problem exposed by the DWDS of the suspension bridge.
Figure 6.
The effects of regeneration temperature on performance. (a) . (b) and .
Based on the above analysis, HDS should primarily regulate the evaporation temperature and regeneration temperature secondarily to adapt for the suspension bridge’s corrosion protection in various cases.
4.2. Performance Comparison Analysis
The following will be a comparative analysis of HDS, DWDS and HDS without a separated heat pipe to better reflect the superiority of HDS performance and the beneficial effects of a separated heat pipe on performance. Figure 7 shows the schematic of DWDS and HDS without a separated heat pipe.
Figure 7.
Desiccant wheel dehumidification system (DWDS) and HDS without a separated heat pipe. (a) DWDS. (b) HDS without a separated heat pipe.
Figure 8 shows and of three dehumidification systems under in inlet air cases. The operating parameters of the three systems are consistent. Process air volume is 400 m3 h−1, the regeneration air volume is 133 m3 h−1 and regeneration temperature is 100 °C. It can be seen from Figure 8a,c that the of HDS is significantly higher than that of DWDS and the ratio of rises up with the increment of inlet air temperature and moisture content. This shows that HDS has better case adaptability than DWDS in high-temperature and -humidity cases of s suspension bridge. It can be seen from Figure 8b,d that, in different air inlet cases, the of HDS is always the highest, followed by the HDS without heat pipe and, finally, DWDS, which reflects the excellent energy conservation of HDS.
Figure 8.
and of three dehumidification systems. (a) . (b) . (c) . (d) .
The cooling capacity required for the aftercooler directly reflects the energy consumption of the aftercooler. As shown in Figure 9, the aftercooler energy consumption of HDS is lower than that of HDS without s separated heat pipe. The of HDS is higher than that of HDS without a separated heat pipe, as shown in Figure 8b,d. Thus, separated heat pipes have a positive effect on reducing the energy consumption of HDS and improving . On the one hand, a separated heat pipe recovers the high-temperature heat of the exhaust at the evaporator section, which reduces the energy consumption of the aftercooler. On the other hand, the regenerative air is preheated at the condenser section, reducing the energy consumption of the heater.
Figure 9.
Cooling capacity required for the aftercooler of three dehumidification systems. (a) Inlet air temperature. (b) Inlet air moisture content.
In summary, HDS facilitates the utilization of waste energy and enhances the system’s efficiency, which contributes to its application in the field of suspension bridge main cable protection.
4.3. Operation Strategy
Based on the above performance discussion of HDS, this section will give a low-energy operation strategy of HDS in the summer. Moreover, the determination of the HDS air supply parameter is the premise of designing the operation strategy.
At present, the main cable protection requires less than 60% RH inside it, but RH is affected by temperature and moisture content. Given that moisture content is the fundamental driver of mass transfer, it should be considered a key parameter for the air supply of the main cable. When the moisture content of the air supply decreases, it will shorten the drying time and improve the effects of main cable protection. However, the moisture load and the energy consumption of the dehumidification plant will increase, accompanying a decrease in the moisture content of the supply air. The following is the calculation of the drying time in different air supply moisture contents.
Some assumptions are made. (1) The void of the main cable is 20%. (2) The water content of the main cable is 5% of the void. (3) The leakage rate of air inside the main cable is constant at 0.005. (4) Exhaust temperature of the main cable is 18.3 °C, the exhaust RH is 80% and the exhaust moisture content is 10.3 g kg−1, which refers to the annual average temperature and annual average RH in Suzhou, China.
The water content per unit length of the main cable can be calculated by Equation (26).
where is the diameter of the main cable, = 0.721 m. is the void of the main cable. is the water content of the main cable. is the density of water.
Figure 10 is a schematic diagram of air leakage in the main cable. The airflow at different locations of the main cable is calculated by Equation (27).
where is the initial airflow, = 12 m3 h−1. is the distance from the injection cover, and is the leakage rate of the air.
Figure 10.
Schematic diagram of air leakage in the main cable.
The time of the drying phase can be calculated by Equation (28).
where is the air supply distance. is the exhaust moisture content of the main cable. is moisture content of the main cable’s air supply. is the airflow rate.
The results of the calculations are shown in Table 4. When the external sheath of the main cable is partially broken, the dry air will leak to the outside. As a result, the flow rate gradually decreases in the main airflow direction, which will reduce the dehumidification efficiency and extend the drying time of the main cable. Therefore, when air leakage occurs, the airflow rate should be increased to ensure the dehumidification effect. Drying time is generally one year, based on the design experience of the suspension bridge dehumidification system. Therefore, considering the anti-corrosion effects, energy consumption and drying time, the moisture content corresponding to the exhaust temperature and RH of 45% should be used for the air supply on a suspension bridge.
Table 4.
Drying time of the main cable.
Based on the air supply parameters and the analysis of performance in Section 4.1, the low-energy operation strategy of HDS in summer cases of a suspension bridge is shown in Table 5.
Table 5.
Low-energy operation strategy of HDS in summer cases.
4.4. Limitations and Adaptations of the Standalone Dehumidification System
This section will discuss the limitations and adaptations of HPDS and DWDS, aiming to indirectly demonstrate the necessity of an HDS.
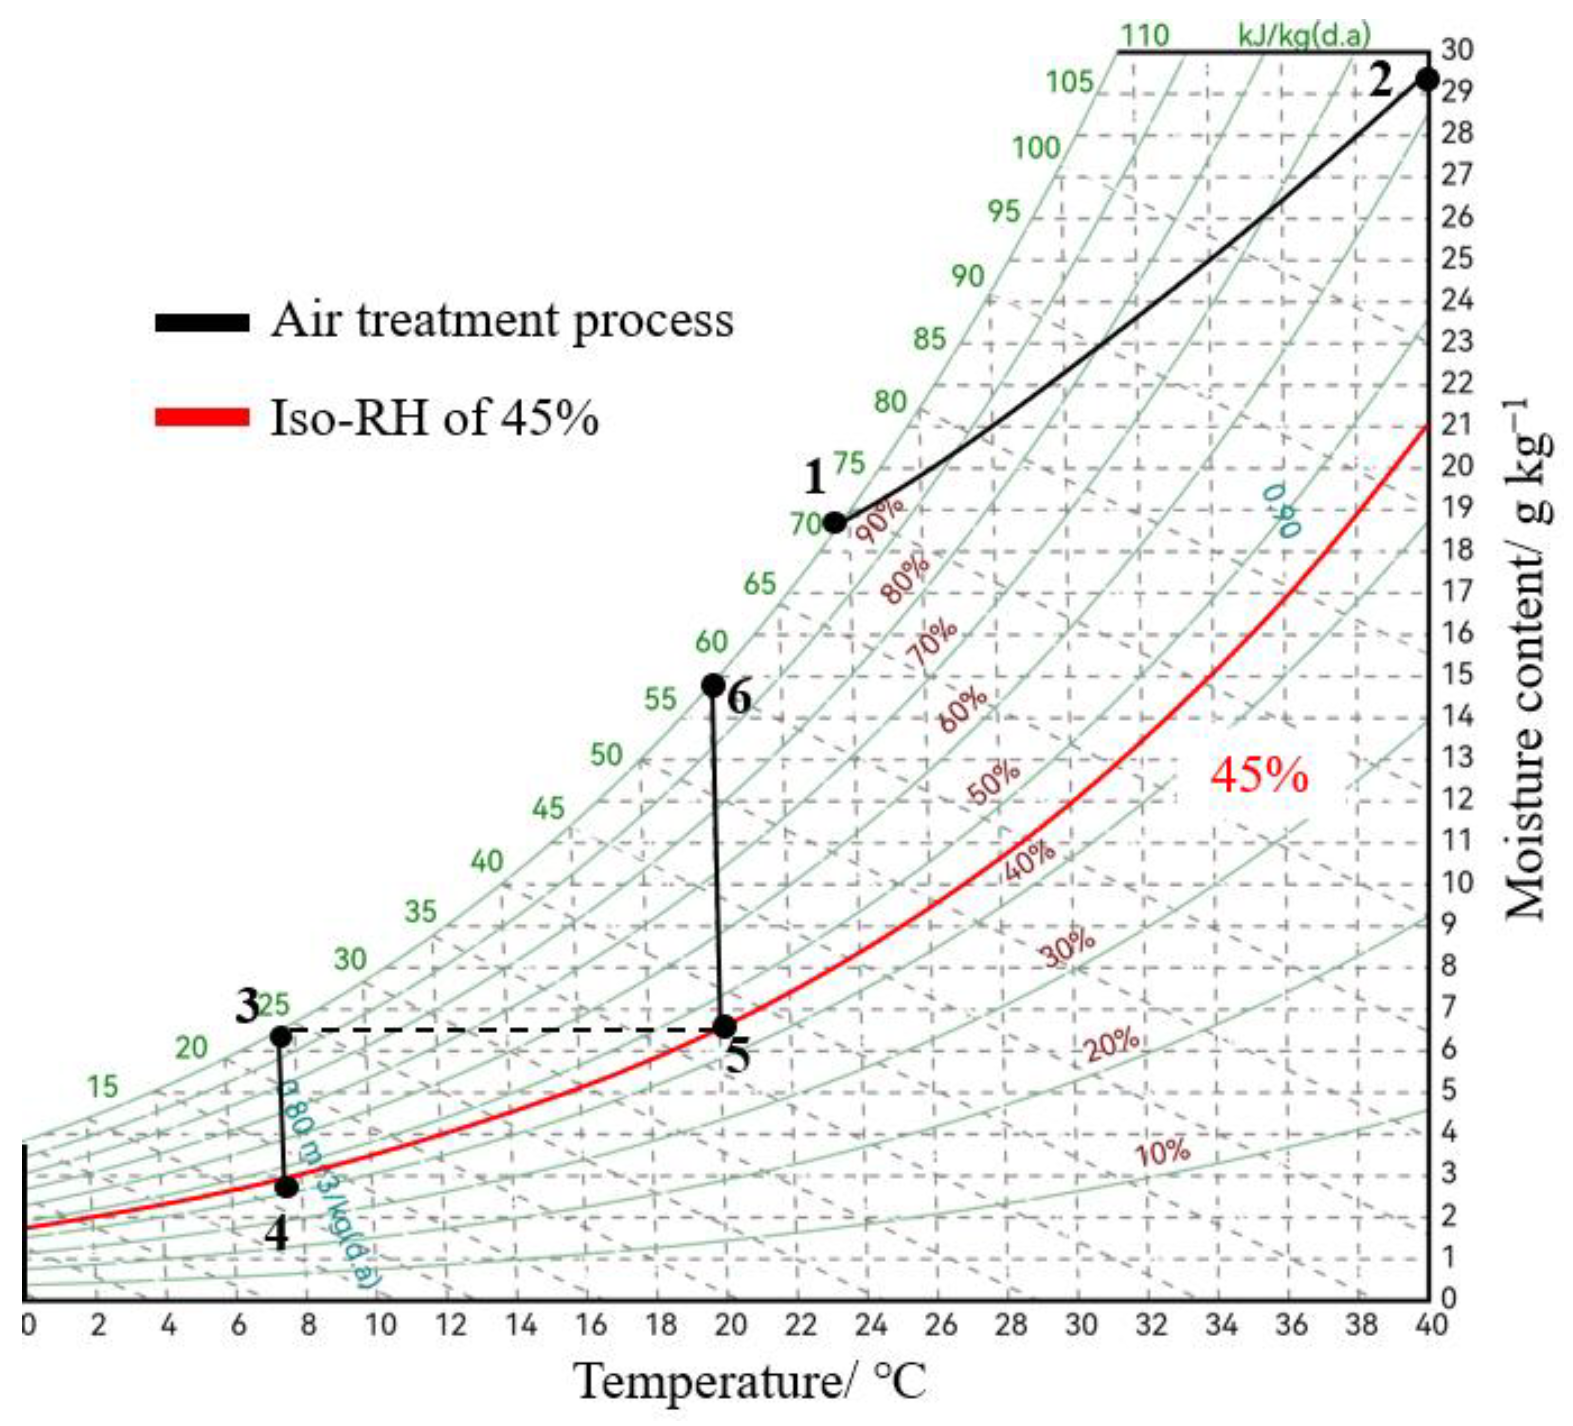
For HPDS, the evaporation temperature should be greater than 0 °C to avoid freezing. Three indicate outlet air status with a temperature of 7.5 °C, RH of 100% and moisture content of 6.5 g kg−1 is in Figure 11. This shows that the HPDS can only reduce the moisture content to 6.5 g kg−1. Pass three to draw an iso-moisture content line intersecting the line with 45% RH at five, and the temperature of five is 20 °C. This indicates that the minimum inlet air temperature of HPDS to meet the main cable air supply requirements is 20 °C. Therefore, when the inlet air condition is located in areas 3-4-5-6, the HPDS cannot meet the air supply requirements of the main cable.
Figure 11.
Limitations and adaptations of a standalone dehumidification system.
Figure 12 shows the inlet and outlet status of the DWDS. One and two are the inlet and outlet air of the dehumidification process, and three and four are the inlet and outlet air of the regeneration process. Table 6 lists the parameters for each status. Two is the intersection of the iso-enthalpy line of the dehumidification process inlet air and the iso-RH line of the regeneration process inlet air. Four is the intersection of the iso-enthalpy line of the regeneration process inlet air and the iso-RH line of the dehumidification process inlet air. Therefore, the air outlet state of the dehumidification process should fall in areas 1-2-3, and the air outlet state of the regeneration process should fall in areas 1-3-4. For the desiccant wheel, the change in air moisture content can be described by Equation (29).
Figure 12.
The state of the inlet and outlet air for the desiccant wheel dehumidification system.
Table 6.
Inlet and outlet status parameters.
Therefore, the maximum dehumidification capacity is one-third of the maximum desorption capacity, that is, 30.3/3 = 10.1 g kg−1. The moisture content corresponding to lines 7–8 is the lowest outlet moisture content of the DWDS. However, when the inlet air state is one, the moisture content of the air supply should be the moisture content corresponding to lines 5–6, which indicates DWDS cannot meet the air supply requirements.
According to the above calculation method, nine air inlet conditions are calculated, and the results are shown in Appendix A, Table A1, Table A2 and Table A3. Figure 11 shows the limitations and adaptations of DWDS. When the air inlet state is in the area above lines 1–2, DWDS cannot meet the air supply requirements of the main cable.
In summary, HPDS has poor adaptability to temperatures below 20 °C, while DWDS has poor adaptability to some high temperatures of 24~40 °C and high humidity of 19~30 g kg−1. None of them can meet the air supply requirements of the suspension bridge main cable in various cases alone.
5. Conclusions
This paper proposed an HDS adapted for suspension bridge corrosion protection. A numerical model of HDS was first established. Then, the effects of the main operating parameters on HDS were analyzed and the dehumidification performance of HDS and DWDS was further compared to illustrate the superiority of HDS to apply on a suspension bridge. In addition, the air supply parameter was discussed, and a low-energy operation strategy of HDS in summer cases was proposed. Finally, limitations and adaptations of HPDS and DWDS on suspension bridges were discussed. The key findings are listed below.
HDS realizes the utilization of waste energy from suspension bridges, enhancing the system’s efficiency. Its reaches 3.16 kg kW−1 h−1 in a high-temperature and -humidity environment (35 °C, 30.82 g kg−1) of the suspension bridge.
In the same inlet air cases, HDS has greater dehumidification capacity than DWDS, and this advantage is enlarged with the increment of inlet air temperature and moisture content. In addition, HDS can strengthen dehumidification ability by cutting down the evaporation temperature and raising the regeneration temperature to meet the peak moisture load of the suspension bridge.
Considering the anti-corrosion effects, energy consumption and drying time, the authors recommend that the moisture content corresponding to the atmospheric temperature and RH of 45% be used for air supply on a suspension bridge.
HPDS has poor adaptability to temperatures below 20 °C, while DWDS has poor adaptability to some high temperatures of 24~40 °C and high humidity of 19~30 g kg−1. None of them can meet the air supply requirements of the suspension bridge’s main cable alone.
Author Contributions
Concepts: X.Z.; writing—original draft: D.X. and Y.S.; writing—review and editing: J.L. All authors have read and agreed to the published version of the manuscript.
Funding
This research was funded by [National Natural Science Foundation of China] grant number [52142803].
Data Availability Statement
Some or all data, models or code that support the findings of this study are available from the corresponding author upon reasonable request.
Acknowledgments
We appreciate the contributions of Yingjian Hu and Peng Li to this study.
Conflicts of Interest
The authors declare no conflict of interest.
Nomenclature
| A | Heat exchange area, m2 |
| Duct cross-sectional area of the airflow channel, m2 | |
| Cp | Specific heat at constant pressure, kJ kg−1 K−1 |
| Dehumidification capacity, kg h−1 | |
| Mass diffusion coefficient of water vapor in the air, m−2 s−1 | |
| DWD | Desiccant wheel dehumidification |
| f | Mass per unit length of one air channel, kg m−1 |
| h | Enthalpy, kJ kg−1 |
| HD | Hybrid dehumidification |
| HPD | Heat pump drying |
| K | Heat transfer coefficient of the heat exchanger, W m−2 K−1 |
| Mass transfer coefficient, kg m−2 s−1 | |
| The mass flow rate of the compressor, kg s−1 | |
| Nusselt number | |
| p | Pressure, Pa |
| Q | Heat transfer capacity, kW |
| RH | Relative humidity |
| 𝑠 | The boundary length of a channel, m |
| Sherwood number | |
| Specific moisture extraction rate, kg kW−1 h−1 | |
| T | Temperature, K |
| t | Temperature, °C |
| Theoretical exhaust volume of the compressor, m3 s−1 | |
| vi | Specific volume, m3 kg−1 |
| W | Energy consumption, kW |
| Desiccant water content, kg kg−1 | |
| Air moisture content, kg kg−1 | |
| The moisture content of the air in equilibrium with the desiccant, kg kg−1 | |
| Greek symbols | |
| Δt | Logarithmic mean temperature difference, °C |
| Heat transfer coefficient, W m−1 K−1 | |
| Thermal conductivity, W m−2 K−1 | |
| Time, s | |
| ρ | Density, kg m−3 |
| Volumetric efficiency of the compressor | |
| Subscript | |
| a | Air |
| c | Condenser |
| d | Silica gel |
| e | Evaporator |
| et | Electric heating |
| fan | Fan |
| i | Inlet |
| l | Saturated water |
| m | Matrix materials |
| o | Outlet |
| r | Refrigerant |
| tot | Total energy consumption of hybrid dehumidification system |
| v | Water vapor |
Appendix A
Table A1.
Calculation result at inlet air temperature of 35°C.
Table A1.
Calculation result at inlet air temperature of 35°C.
| Points | Temperature/°C | RH/% | Moisture Content/g kg−1 | Enthalpy/kJ kg−1 |
|---|---|---|---|---|
| 1 | 35.0 | 90.0 | 32.7 | 119.2 |
| 80.0 | 28.9 | 109.4 | ||
| 70.0 | 25.2 | 99.8 | ||
| 2 | 88.72 | 2.4 | 10 | 119.2 |
| 85.45 | 2.1 | 7.68 | 109.4 | |
| 81.63 | 1.8 | 5.64 | 99.8 | |
| 3 | 120.0 | 2.4 | 32.7 | 209.8 |
| 2.1 | 28.9 | 199.5 | ||
| 1.8 | 25.2 | 189.4 | ||
| 4 | 46.5 | 90.0 | 63.0 | 209.8 |
| 47.5 | 80.0 | 58.5 | 199.5 | |
| 48.7 | 70.0 | 54.0 | 189.4 | |
| Maximum desorption capacity | 30.2 | |||
| 29.6 | ||||
| 28.8 | ||||
| Lowest outlet moisture content (L7–8) | 22.7 | |||
| 19.1 | ||||
| 15.5 | ||||
| The moisture content required by the air supply of the main cable (L5–6) | 15.9 |
Table A2.
Calculation result at inlet air temperature of 30°C.
Table A2.
Calculation result at inlet air temperature of 30°C.
| Points | Temperature/°C | RH/% | Moisture Content/g kg−1 | Enthalpy/kJ kg−1 |
|---|---|---|---|---|
| 1 | 30.0 | 90.0 | 24.4 | 92.5 |
| 80.0 | 21.6 | 85.3 | ||
| 70.0 | 18.8 | 78.2 | ||
| 2 | 73.73 | 1.8 | 4.7 | 92.5 |
| 69.43 | 1.5 | 3.39 | 85.3 | |
| 77.18 | 1.3 | 2.44 | 78.2 | |
| 3 | 120.0 | 1.8 | 24.4 | 187.2 |
| 1.5 | 21.6 | 179.6 | ||
| 1.3 | 18.8 | 171.9 | ||
| 4 | 45.3 | 90.0 | 55.2 | 187.2 |
| 46.6 | 80.0 | 51.7 | 179.6 | |
| 44.2 | 70.0 | 48.2 | 171.9 | |
| Maximum desorption capacity | 30.8 | |||
| 30.2 | ||||
| 29.4 | ||||
| Lowest outlet moisture content (L7–8) | 14.6 | |||
| 11.3 | ||||
| 8.7 | ||||
| The moisture content required by the air supply of the main cable (L5–6) | 11.9 |
Table A3.
Calculation result at inlet air temperature of 25°C.
Table A3.
Calculation result at inlet air temperature of 25°C.
| Points | Temperature/°C | RH/% | Moisture Content/g kg−1 | Enthalpy/kJ kg−1 |
|---|---|---|---|---|
| 1 | 25.0 | 90.0 | 18.0 | 71.0 |
| 80.0 | 16.0 | 65.8 | ||
| 70.0 | 13.9 | 60.6 | ||
| 2 | 63.96 | 1.3 | 1.91 | 71.0 |
| 60.38 | 1.1 | 1.37 | 65.8 | |
| 56.3 | 1.0 | 1.03 | 60.6 | |
| 3 | 120.0 | 1.3 | 18.0 | 169.8 |
| 1.1 | 16.0 | 164.3 | ||
| 1.0 | 13.9 | 158.6 | ||
| 4 | 42.2 | 90.0 | 49.3 | 169.8 |
| 43.4 | 80.0 | 46.6 | 164.3 | |
| 44.8 | 70.0 | 43.8 | 158.6 | |
| Maximum desorption capacity | 31.3 | |||
| 30.7 | ||||
| 29.8 | ||||
| Lowest outlet moisture content (L7–8) | 8.1 | |||
| 5.5 | ||||
| 3.7 | ||||
| The moisture content required by the air supply of the main cable (L5–6) | 8.9 |
References
- Guo, S.; Si, R.; Dai, Q.; You, Z.; Ma, Y.; Wang, J. A critical review of corrosion development and rust removal techniques on the structural/environmental performance of corroded steel bridges. J. Clean. Prod. 2019, 233, 126–146. [Google Scholar] [CrossRef]
- Lazorenko, G.; Kasprzhitskii, A.; Nazdracheva, T. Anti-corrosion coatings for protection of steel railway structures exposed to atmospheric environments: A review. Constr. Build. Mater. 2021, 288, 123115. [Google Scholar] [CrossRef]
- Wang, Y.; Zheng, Y. Research on Corrosion Fatigue Performance and Multiple Fatigue Sources Fracture Process of Corroded Steel Wires. Adv. Civ. Eng. 2019, 2019, 4914359. [Google Scholar] [CrossRef]
- Nakamura, S.; Suzumura, K. Experimental Study on Repair Methods of Corroded Bridge Cables. J. Bridge Eng. 2012, 17, 720–727. [Google Scholar] [CrossRef]
- Sloane, M.J.D.; Betti, R.; Marconi, G.; Hong, A.L.; Khazem, D. Experimental Analysis of a Nondestructive Corrosion Monitoring System for Main Cables of Suspension Bridges. J. Bridge Eng. 2013, 18, 653–662. [Google Scholar] [CrossRef]
- Kitagawa, M.; Suzuki, S.; Okuda, M. Assessment of cable maintenance technologies for Honshu-Shikoku Bridges. J. Bridge Eng. 2001, 6, 418–424. [Google Scholar] [CrossRef]
- Sun, J.; Manzanarez, R.; Nader, M. Suspension Cable Design of the New San Francisco-Oakland Bay Bridge. J. Bridge Eng. 2004, 9, 101–106. [Google Scholar] [CrossRef]
- Jensen, J.L.; Lambertsen, J.; Zinck, M.; Stefansson, E. Challenges of water ingress into bridge cable systems. Steel Constr.-Des. Res. 2017, 10, 200–206. [Google Scholar] [CrossRef]
- Yanaka, Y.; Kitagawa, M. Maintenance of steel bridges on Honshu-Shikoku crossing. J. Constr. Steel Res. 2002, 58, 131–150. [Google Scholar] [CrossRef]
- Furuya, K.; Saeki, S.; Haruki, A. Corrosion Protection for the Main Cable of Suspension Bridges. IABSE Rep. 1998, 79, 341. [Google Scholar] [CrossRef]
- Bloomstine, M.L. Main cable corrosion protection by dehumidification: Experience, optimization and new developments. In Proceedings of the 6th New York City Bridge Conference, New York, NY, USA, 25–26 July 2011; pp. 39–54. [Google Scholar]
- Zhang, M.; Huang, S.; Li, P.; Shah, K.W.; Zhang, X. Application of dehumidification as anti-corrosion technology on suspension bridges: A review. Appl. Therm. Eng. 2021, 199, 117549. [Google Scholar] [CrossRef]
- Betti, R.; Sloane, M.J.D.; Khazem, D.; Gatti, C. Monitoring the structural health of main cables of suspension bridges. J. Civ. Struct. Health Monit. 2016, 6, 355–363. [Google Scholar] [CrossRef]
- Furuya, K.; Kitagawa, M.; Nakamura, S.-I.; Suzumura, K. Corrosion mechanism and protection methods for suspension bridge cables. Struct. Eng. Int. J. Int. Assoc. Bridge Struct. Eng. (IABSE) 2000, 10, 189–193. [Google Scholar] [CrossRef]
- Chen, C.; Fan, L.; Feng, Z.; Guanzhong, P. Energy conservation research of dehumidification system for main cable anticorrosion of suspension bridge. Strateg. Study CAE 2011, 9, 74–77. [Google Scholar]
- Ge, F.; Wang, C. Exergy analysis of dehumidification systems: A comparison between the condensing dehumidification and the desiccant wheel dehumidification. Energy Convers. Manag. 2020, 224, 113343. [Google Scholar] [CrossRef]
- Gao, Y. Dehumidification control system of the suspension bridge main cable. China ITS J. 2021, 9, 139–142. [Google Scholar]
- Chen, W.; Wan, T.; Wang, Z.; Li, X.; Shen, R. Design and performance of internal air supply conduit for dehumidification in main cables of suspension bridges. J. Jilin Univ. Eng. Technol. Ed. 2021, 51, 1749–1755. [Google Scholar]
- Tan, Y.; Chen, L.; Zhang, Z. Overall design of main bridge of Xinghai Bay Sea-Crossing Bridge in Dalin. Bridge Constr. 2015, 43, 6–10. [Google Scholar]
- Christodoulou, C.; Bulmer, M.; Cocksedge, C.; Wilkinson, D.; Cooper, J.; Hill, P.; Austin, S.; Goodier, C. Humber Bridge—Suppressing main cable corrosion by means of dehumidification. In Proceedings of the 18th International Corrosion Congress 2011, Perth, Australia, 20–24 November 2011; Volume 1, pp. 35–46. [Google Scholar]
- Peng, G.; Miao, X.; Fan, L.; Jia, D.; Liu, W.; Ma, X. Analysis and experiment research on dehumidification and anti-corrosion system of main cable of suspension bridge based on waste heat recovery. Build. Sci. 2011, 27, 33–37. [Google Scholar]
- Bloomstine, M.L.; Melen, J.F. Optimizing main cable dehumidification systems. In Proceedings of the 10th New York City Bridge Conference, New York, NY, USA, 26–27 August 2019; pp. 34–46. [Google Scholar]
- Sun, H.; Guo, Q. Design and construction of the main cable dehumidification system of the Fourth Yangtze River Bridge in Nanjing. China ITS J. 2013, S2, 98–100. [Google Scholar]
- Song, Y.; Zhang, M.; Huang, S.; Zhang, X. Integrated Condensation and Rotating Wheel Dehumidification System and Control Method on Suspension Bridge. Patent CN112742060A, 4 May 2021. [Google Scholar]
- Donggen, P.; Zhuo, C.; Danting, L. Modeling and performance analysis of the liquid dehumidification and heat pump hybrid system with heat recovery. Renew. Energy Resour. 2020, 38, 1460–1469. [Google Scholar]
- Huang, S.; Zuo, W.; Lu, H.; Liang, C.; Zhang, X. Performance comparison of a heating tower heat pump and an air-source heat pump: A comprehensive modeling and simulation study. Energy Convers. Manag. 2019, 180, 1039–1054. [Google Scholar] [CrossRef]
- Zhang, X.J.; Dai, Y.J.; Wang, R.Z. A simulation study of heat and mass transfer in a honeycombed rotary desiccant dehumidifier. Appl. Therm. Eng. 2003, 23, 989–1003. [Google Scholar] [CrossRef]
- Weidao, S.; Zhimin, J. Engineering Thermodynamics; Higher Education Press: Beijing, China, 1982; p. 440. [Google Scholar]
- San, J.-Y. Heat and mass transfer in a two-dimensional cross-flow regenerator with a solid conduction effect. Int. J. Heat Mass Transf. 1993, 36, 633–643. [Google Scholar] [CrossRef]
- Pesaran, A.A.; Mills, A.F. Moisture transport in silica-gel packed-beds. 2. Experimental-study. Int. J. Heat Mass Transf. 1987, 30, 1051–1060. [Google Scholar] [CrossRef]
- Changsun, S. Advanced Engineering Thermodynamics; Higher Education Press: Beijing, China, 1987; p. 704. [Google Scholar]
- Lemmon, E.W.; Bell, I.H.; Huber, M.L. NIST Standard Reference Database 23: Reference Fluid Thermodynamic and Transport Properties-REFPROP. Version 10.0, National Institute of Standards and Technology; Standard Reference Data Program: Gaithersburg, MD, USA, 2018. [Google Scholar]
- Friedel, L. Improved Friction Pressure Drop Correlation for Horizontal and Vertical Two-Phase Pipe Flow. In Proceedings of the European Two-Phase Flow Group Meeting, Ispra, Italy, 1 January 1979; Volume 18, pp. 485–491. [Google Scholar]
- Gnielinski, V. New Equations for Heat and Mass Transfer in Turbulent Pipe and Channel Flows. Int. Chem. Eng. 1976, 16, 359–368. [Google Scholar]
- Cooper, M.G. Saturation Nucleate Pool Boiling—A Simple Correlation. Inst. Chem. Eng. Symp. Ser. 1984, 86, 785–793. [Google Scholar]
- Keisen, E.B.Y. Refrigeration Technology for Air Conditioning; China Architecture and Architecture Press: Beijing, China, 1981; p. 175. [Google Scholar]
Disclaimer/Publisher’s Note: The statements, opinions and data contained in all publications are solely those of the individual author(s) and contributor(s) and not of MDPI and/or the editor(s). MDPI and/or the editor(s) disclaim responsibility for any injury to people or property resulting from any ideas, methods, instructions or products referred to in the content. |
© 2023 by the authors. Licensee MDPI, Basel, Switzerland. This article is an open access article distributed under the terms and conditions of the Creative Commons Attribution (CC BY) license (https://creativecommons.org/licenses/by/4.0/).