Abstract
Since the flat serve (FS) minimizes the ball spin and kick serve (KS) combined topspin and sidespin, this systematic review aimed to explore the ball impact location (BI) within the FS and KS at the professional men, junior men, and women tennis players. The PRISMA guideline was used, and the original articles were searched in Scopus, Web of Science, and PubMed. The means and standard deviations computed from the distance of BI from the origin within the FS and KS on the x, y, and z axes (global coordinate system) were normalized by the participants’ height and weighted by the number of participants in one-way ANOVA. Ten articles with a pooled sample of 133 males and 51 females aged 11–25 were included. The professional men had more stable BI on the x-axis within the FS by 56% (p < 0.001), within the KS by 58% (p < 0.001), and on the y-axis within the KS by 90% (p < 0.001) than junior men. The professional and junior men had the BI more leftwards from the origin on the x-axis within the KS by 188% (p < 0.001) and 88% (p < 0.001), respectively than within the FS.
1. Introduction
Tennis serve and return are the two most essential strokes in tennis, and their level improves with professional ranking [1,2]. Tennis serves are usually classified into three technique categories based on the angle of the racket face and velocity vector relative to the ball at impact. (i) flat technique that maximizes ball speed and minimizes ball spin, (ii) slice technique that emphasizes sidespin, (iii) twist technique that emphasizes combined topspin and sidespin [3,4] also known as kick serve [5,6]. Since it has been shown that these tennis serves have different technique execution, researchers have examined the kinematics of the body segments, tennis racket, and the tennis ball toss [4,7].
Concerning the tennis racket, the forward component of racket velocity is prominent for the flat technique of the serve, the lateral velocity of the racket is larger than the forward velocity in a slicing technique of the serve, and the vertical velocity of the racket is larger than forward and lateral velocity in the twist technique of the serve [8]. The contribution of the body segment for these velocities was examined for the flat serve and it found that the ulnar flexion at the wrist joint produced 30.6% of the final velocity [9,10]. Although there is a relationship between serve type technique and racket velocity related to the racket position (racket face angel) at the moment of the impact [3,8] and differences in BI height [11], there is no clear classified whether there is a typical position of the ball at the moment of impact with the strings/racket within the ball toss in relation to different technique types of services across gender and performance level of the tennis players.
Ball toss kinematics are characterized by the position of the ball relative to the player and the court at three main events/points during the serve delivery: release, peak vertical height, and impact with the strings/racket. To represent the ball’s position at the moment of impact (one frame prior to a racket-ball contact), the term ball impact (BI) is used [12,13,14,15]. The BI location is calculated in the global coordinate system relative to the origin on the x-axis (mediolateral), y-axis (anterior-posterior), and z-axis (vertical). The origin is usually defined, in the case of considering the BI location within the serve, in the global coordinative system at the point of the first metatarsal joint of the front foot [14,15,16]. In this context, not only the BI location from the origin is found but also its variability or stability. The analysis of the variability of the three points (on the x, y, and z axes) of the BI location is conducted axis by axis, that is, in a one-dimensional way. The stability is measured using the standard deviation and the coefficient of variation [17].
Regarding the BI location, although the players should not use visible differences in the BI location relative to the target and the type of serve, in order to hide their intentions from the perspective of the opponent [18], studies found differences position of the BI location from the origin on the x, y, and z axes among different technique serve types related to the target zone [14,16,19].
Concerning the professional men’s tennis players, the differences in the BI location within the serve were found for the first serve related to the target zone (center and wide service from the deuce side) on the x-axis, where the BI location within the twist serve was more leftwards from the origin than slice serve [17] and on the y-axis, where the BI location within the flat serve was more forwards from the origin than the twist serve [14]. The junior men’s tennis players had the BI location within the twist and flat serve closer to the origin on the y-axis and more leftwards from the origin on the x-axis than the junior women tennis players [20]. Professional women’s tennis players had the BI location within the second service closer to the origin on the x-axis than professional men’s tennis players [3]. Less experienced women performed the BI location within the flat serve closer to the origin on the y-axis than their more experienced counterparts [15]. The BI location within the first and second serve can be related to the experience level of participants and gender.
Therefore, this systematic review compared the distance BI spatial location from the origin and stability (cluster around the mean) of the BI (on the x, y, and z axes in the global coordinate system) among serve types of professional and junior men and women tennis players. We hypothesize that professional men’s tennis players have more stable BI (cluster around the mean of the ball impact location on the x, y, and z axes) than junior men’s tennis players within the FS and KS.
2. Materials and Methods
This article is a systematic review. The PRISMA methodology [21,22] was used to select the articles included in this review (Figure 1). This review protocol was prospectively registered online with PROSPERO (registration number: CRD42022315098).
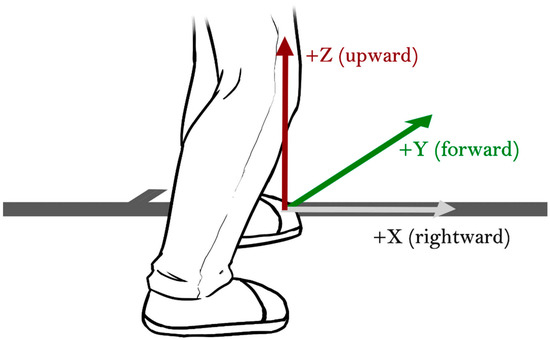
Figure 1.
Orientation and origin of the global coordinate system.
2.1. Search Strategy
The search was performed on 13 January 2022 using the Web of Science, PubMed, and Scopus search engines within the title, abstract, and keywords. The search strategy combined terms related to the ball toss and serve (tennis, ball toss, serve, and kinematic). Table S1 shows the full Boolean syntax used in Web of Science, PubMed, and Scopus. Additional records were added based on the scanned reference list of selected articles. The chosen studies from the database search were sent to an excel file where one author removed duplicates.
2.2. Study Selection
One author screened the titles and abstracts to remove the articles unrelated to tennis. Two authors independently screened the titles and abstracts for exclusion of the articles which did not examine the ball toss and serve. The full text was reviewed for articles that met the eligibility criteria, and then articles suitable for systematic review were selected. In case of disagreement between the two reviewers, a third reviewer decided to include or not the article. Finally, the reference lists were analyzed to include potentially relevant articles.
2.3. Eligibility Criteria
The following inclusion criteria were applied during the title and abstract screening: (i) at least one outcome of BI location (x, y, or z axes in a global coordinate system) was reported related to service; (ii) the data of the BI location was obtained by a hi-speed camera system; (iii) manuscript was published in English.
2.4. Assessment of Methodological Quality and Risk of Bias
All articles included in this systematic review were evaluated concerning methodological quality. Two evaluators performed the evaluation. A scale was compiled to assess each article based on the evaluation tool STROBE [23]. The checklist consists of 11 items which were scored 2 points for “yes”, 1 point for “unclear”, and 0 points for “no” or “not applied.” The questions are as follows:
(1) Was an informative and balanced summary of what was carried out and what was found provided in the abstract? (2) Was the scientific background of the study reported? (3) Were the specific objectives stated, including any pre-specified hypotheses? (4) Were the eligibility criteria, sources, and methods of selecting participants stated? (5) Was the condition measured in a standard, reliable way for all participants in the study? (6) Was the execution of the measurement of kinematics described in sufficient detail to permit its replication? (7) Was the data collection described? (8) Were all relevant results described? (9) Were any efforts to address potential sources of bias described? (10) Were key results summarised with reference to study objectives? (11) Were all outcomes and conclusions clearly defined?
The maximum possible number of points was 22. Studies were classified as excellent, good, fair, and poor methodological quality if they scored 20–22 points, 17–19 points, 14–16 points, and ≤14 points, respectively.
2.5. Terminology
The terminology for different labeling tennis serves among studies has been unified using the following rules. Only data for serves performed from the deuce side were used. Flat serve (serve with maximal ball speed and minimal intended spin) was marked FS. Kick serve (serve with a combined twist and sidespin) was marked KS. Other serve types were not examined due to the lack of comparable data. The ball’s position at the moment of contact with the strings/racket was defined as the “ball impact” (BI) location. The position of the BI location was determined in the global coordinate system with the origin of the player’s front foot metatarsophalangeal joint (Figure 1). The distance of the ball impact location from the origin was analyzed in the planes where (x-axis) represented mediolateral direction, (y-axis) represented anteroposterior direction, and (z-axis) represented vertical direction [13].
3. Data Treatment and Analysis
Data of the BI location from the chosen articles were divided into categories by experience, gender, and service types using the following rules: (i) Data of the participants younger than 16 were put into the junior group, whereas data of the participants older than 16 were put into the professional group [24]. (ii) Participants and their data were put into groups (M) and (W) according to their gender. (iii) Participants and their data were put into two groups according to the type of service (FS and KS). Since the anthropometric parameters of the participants could bias the comparison ball impact location among participants [25], the means and standard deviations were normalized by the participants’ height (Supplementary Materials, Table S2).
The statistical analysis of the results was conducted using Statistica 14 (Tibco Software Inc., Palo Alto, CA, USA), R version 4.1.0 (R Core Team, 2021), and Microsoft Excel (Microsoft Corporation, Redmond, Washington, DC, USA). The mean and standard deviation (the distance BI location from the origin on the x, y, and z axes) within FS and KS were normalized by the participants’ height and weighted by the number of participants. The aggregate forest plots presented the normalized mean and 95% confidence interval of the BI location of the individual chosen studies and the normalized weighted mean and 95% confidence interval of the BI location computed from the studies included in individual groups (Professional men, Junior men, Professional women, and Junior women). The one-way ANOVA with Tukey’s post hoc test was used to analyze differences among groups within the FS and KS; a significance level was 5%. A partial eta square (η2) and Cohen’s d were used to estimate the effect sizes. Levene’s test performed the assumption of data equality of variance. The normalized weighted mean BI location was used to compare ball position among individual groups (serve type FS and KS x professional and junior tennis players) separately for the x, y, and z axes. The BI location’s stability analysis was computed separately for the x, y, and z axes comparing the normalized weighted standard deviation among the individual groups within the FS and KS.
3.1. Results
The search in the systematic literature resulted in 386 records and six additional articles from referent lists. After removing 62 duplicates, 324 articles were screened at the title and abstract levels. There were 250 articles rejected since they did not meet the subject of research. For full text, 74 studies were accessed; however, 64 were excluded since they did not contain the BI location at least on one of the coordinate axes. The search process according to PRISMA is shown in Figure 2. The records of the remaining ten articles, with a pooled sample of 133 males and 51 females aged 11–25, were included for systematic review (Table 1 and Table 2). However, there were not enough data for women and therefore it was not possible to relevantly compare differences in the stability and position of the BI within the FS and KS.
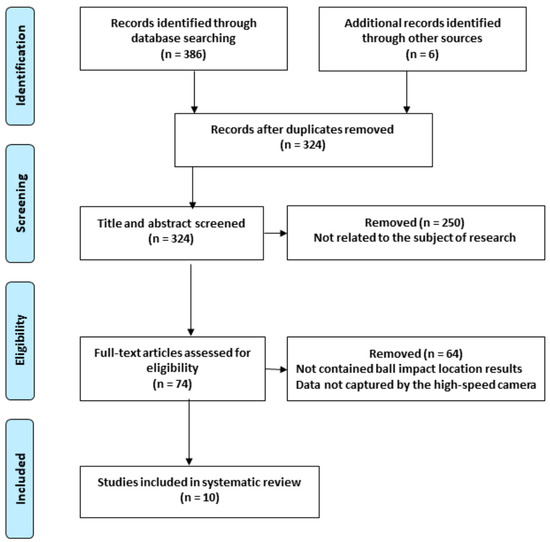
Figure 2.
The flow chart of the systematic approach to the retrieval articles relevant to the ball impact location within the tennis serve.

Table 1.
Characteristics of the chosen studies for systematic review.
Table 2.
The mean and standard deviation of the distance ball impact location from the origin within the tennis serve.
The graphical presentations of the pooled data from the individual studies are presented in two forest plots, one for FS and one for KS, each with three subgraphs for the x, y, and z axes (Figure 3). Comparing the normalized weighted mean (Supplementary Materials, Table S2) of the BI location among the individual groups within FS; on the x-axis: the most leftwards BI location from the origin was performed by junior men; on the y-axis: professional women performed the BI location the most forwards from the origin; on the z-axis: junior men performed the BI location the lowest from the origin. For KS on the x-axis: the least leftwards BI location from the origin was performed by the junior women; on the y-axis: the junior women performed the least forward BI location from the origin, and on the z-axis: the lowest BI location from the origin was performed by junior men.
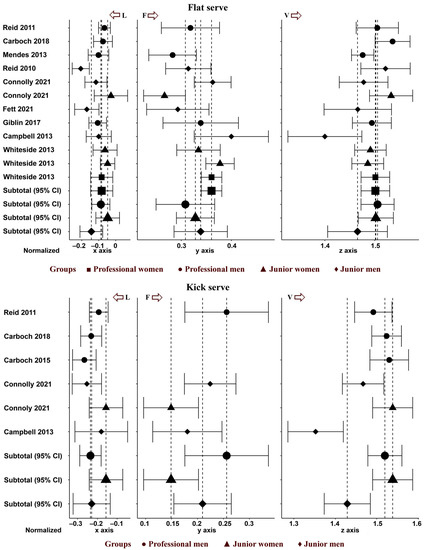
Figure 3.
The forest plots present the ball impact location. There are presented the normalized mean and 95% confidence interval of the ball impact location in chosen studies. The subtotal presented a normalized weighted mean and their 95% CIs of the groups divided according to the serve type (upper part = Flat serve and lower part = Kick serve). Note: ← L (leftwards from the origin on the x–axis); F → (forwards from the origin on the y–axis; V → (upwards from the origin on the z–axis. References: [14,17,19,20,26,27,28,29,30,31].
3.2. Assessment of Methodological Quality
The assessment of methodological quality, which consisted of the STROBE tool, resulted in an average score of 91% ± 5% ranging from 82% to 100%, where three studies showed moderate and seven low risks of bias (Supplementary Materials—Table S3). The researchers’ level of agreement about the methodological quality of the observed articles was 95%. The disagreements were discussed and solved to reach the final agreement of 100% between researchers. The highest limitations of the studies were lack of effort to find the potential source of bias (Item 9), unclear description of objectives and pre-specified hypothesis (Item 3), and missing eligibility criteria for selecting the participants (Item 4).
3.3. Subgroup Analysis
The assumption of data normality and equality of variance was not violated. There were differences in the normalized weighted mean of the BI location on the x-axis among professional and junior, and serve types of the men tennis players, F3,123 = 17.3, p = 0.0001, μ2 = 0.3; Figure 4A, where post hoc testing revealed that BI location of the KSjunior men was more leftwards from the origin than FSjunior men and FSprofessional men (p < 0.001, d = 0.9; p < 0.001, d = 1.23, respectively), KSprofessional men was more leftwards from the origin than FSprofessional men and FSjunior men (p < 0.001, d = 1.88; p < 0.001, d = 1.31, respectively), and FSjunior men was more leftwards from the origin than FSprofessional men (p < 0.05, d = 0.4). There were differences in the normalized weighted standard deviation of the BI location on the x-axis among experience and serve types of the male tennis players, F3,123 = 79.74, p = 0.0001, μ2 = 0.66, Figure 4B, where post hoc testing revealed that BI location of the KSjunior men was less closely clustered around the mean than FSprofessional men, FSjunior men, and KSprofessional men groups (p < 0.001, d = 3.9; p < 0.001, d = 3.42; p < 0.001, d = 3.19, respectively).
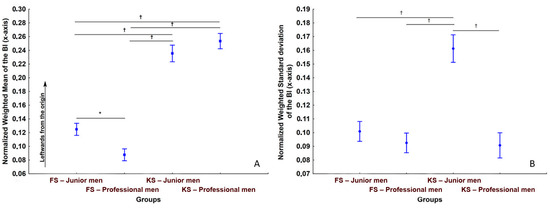
Figure 4.
Differences in the ball impact location on the x-axis (professional and junior men). Note: FS—flat serve; KS—kick serve; * Significant differences, p < 0.05.; † Significant differences, p < 0.01; Vertical bars denote 95% CIs. Note: (A) normalized weighted mean of the ball impact, (B) normalized weighted standard deviation of the ball impact.
There were differences in the normalized weighted mean of the BI location on the y-axis among professional and junior, and serve types of the men tennis players, F3,93 = 5.503, p = 0.002, μ2 = 0.15; Figure 5A, where post hoc testing revealed that BI location of the KS junior men was less forwards from the origin than KSprofessional men, FSprofessional men, and FS junior men (p < 0.01, d = 0.53; p < 0.01, d = 0.99 and p < 0.01, d = 1.03, respectively). There were differences in the normalized weighted standard deviation of the BI location on the y-axis among professional and junior, and serve types of the men tennis players, F3,93 = 31.153, p = 0.001, μ2 = 0.5, Figure 5B, where post hoc testing revealed that BI location of the FSjunior men was more clustered closely around the mean than FSprofessional men, KS junior men, and KSprofessional men (p < 0.01, d = 1.22; p < 0.001, d = 1.28; and p < 0.0001, d = 8.4, respectively), FSadult men was more clustered closely around the mean than KSprofessional men (p < 0.001, d = 3.52), and KSjunior men was more clustered closely around the mean than KSprofessional men (p < 0.001, d = 1.48).
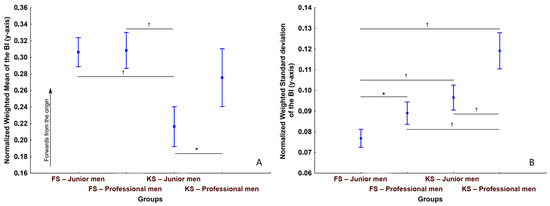
Figure 5.
Differences in the ball impact location on the y-axis (professional and junior men). Note: FS—flat serve; KS—kick serve; * Significant differences between professional and junior men and the serve type, p < 0.05.; † Significant differences between professional and junior men and the serve type, p < 0.01 Vertical bars denote 95% CIs. Note: (A) normalized weighted mean of the ball impact, (B) normalized weighted standard deviation of the ball impact.
There were differences in the normalized weighted mean of the BI location on the z-axis among experience and serve types of the male tennis players, F3,123 = 63.180, p = 0.0001, μ2 = 0.61; Figure 6A, where post hoc testing revealed that BI location of the FSless-experienced was less high from the origin than FSprofessional men, KSjunior men, and KSprofesional men (p < 0.001, d = 2.85; p < 0.001, d = 1.92; and p < 0.001, d = 2.68, respectively). There were differences in the normalized weighted standard deviation of the BI location on the z-axis among experience and serve types of the male tennis players, F3,123 = 59.645, p = 0.001, μ2 = 0.59, Figure 6B, where post hoc testing revealed that BI location of the FShigh-experienced was more clustered closely around the mean than FSjunior men, KSprofessional men, and KSjunior men (p < 0.001, d = 3.27; p < 0.05, d = 0.72; and p < 0.001, d = 2.66, respectively), and KSprofessional men was more clustered closely around the mean than FSjunior men and KSjunior men (p < 0.001, d = 1.5; p < 0.001, d = 1.64, respectively). There was not enough data to compare differences in the BI location between gender.
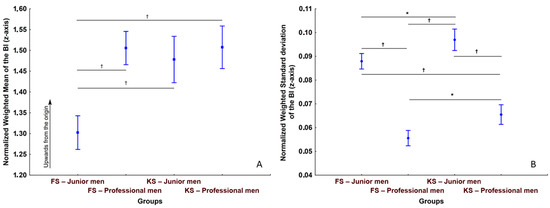
Figure 6.
Differences in the ball impact location on the z-axis (professional and junior men). Note: FS—flat serve; KS—kick serve; * Significant differences between professional and junior men and the serve type, p < 0.05.; † Significant differences between professional and junior men and the serve type, p < 0.01 Vertical bars denote 95% CIs. Note: (A) normalized weighted mean of the ball impact, (B) normalized weighted standard deviation of the ball impact.
4. Discussion
The main finding confirmed our hypothesis that the professional men had a more stable BI location on the z-axis by 56% in FS and 58% in KS than junior men (Figure 6B), which concurs with previous studies [14,17,27]. In addition, the professional men had a more stable BI location on the x-axis by 90% in KS than junior men (Figure 4B). On the other hand, the junior men had more stable BI locations on the y-axis by 17% in FS and 27% in KS than professional men (Figure 5B). Our findings may be most related to the FS and KS performed from the deuce side and targeting the T (the perpendicular center mark on the court or the middle serve line) and body zone of an opponent.
Practically, professional men hit the ball more at the same height within FS and KS than junior tennis players. The average ball hitting height within the FS was 272 cm and KS was 276 cm at professional men and 252 cm and 276 cm, respectively at junior men. This was also related to the higher personal height of professional men than junior men, however, the standard deviation from the average ball-hitting height was 7 cm greater in junior men within FS and 5 cm greater within KS than in professional men. Additionally, the largest differences were found in the mediolateral plane for KS, where junior men had a 13 cm greater standard deviation than professional men. Since better stability of the ball impact locations within the serve has a positive influence on the serve coordination [30], the junior men should focus primarily on a stable ball toss in the vertical and mediolateral planes.
4.1. What Is Known: Summary of the Chosen Studies
- Professional men had the BI location within FS more forwards on the y-axis and less leftwards from the origin on the x-axis than KS [14,19].
- Junior men had the BI location within FS more forwards on the y-axis and less leftwards the origin on the x-axis than KS [20,30], and both serves (FS and KS) more forwards on the y-axis and less leftwards from the origin on the x-axis than junior women [20].
- Junior women had the BI location within FS less forwards from the origin on the y-axis than professional women [31,32], and both serves (FS and KS) had higher from the origin on the z-axis than junior men [20].
4.2. The Main Findings on the x-Axis
In line with previous studies [14,15,26], we found that professional men players have not had more stable BI location on the x-axis within the FS than junior men players. On the other hand, the professional men had a more stable BI location on the x-axis than junior men within KS by 90% (Figure 4B). However, this finding for junior men could be influenced by their tendency to combine the slice serve and the twist serve [31] and a heightened need to impart spin to the ball within the second serve [20]. The identified higher variability in the junior men within KS is consistent with the claim that it is more important for players to learn how to perceive and respond to the varying BI location [32]. The junior men should nevertheless focus on improving the BI location stability within KS.
Concerning the position, junior men performed the BI more leftwards from the origin by 43% than professional men within the FS. On the other hand, the professional men had more leftwards the BI location from the origin than junior men within the KS (by 8%, not significantly different).
Different position of the BI on the x-axis was found to be related to serve types. The professional and junior men had the BI location more leftwards from the origin within the KS by 188% and 88% than FS (Figure 4A), as reported in previous findings [14,20]. It is probably related to the racket’s kinematics since the racket’s lateral and vertical components are higher for KS than FS, and the more leftwards position of the racket together with more leftwards BI location from the origin on the x-axis allows more peak velocity of the racket. Moreover, there have been proven differences between ball impact performed from the position of the deuce court (right from center) and the position of the ad court (left from center) on the mediolateral axis at the junior players [28], whereas in our study we compared only ball impact from the deuce position.
4.3. The Main Findings on the y-Axis
The studies investigating the BI location on the y-axis reported that the junior players performed the BI location more forward within FS than KS [33]. We found that the professional men players had a less stable BI location on the y-axis than junior men within FS (by 17%) and KS (by 27%) (Figure 5B). This more stability in the junior men is probably related to the lower ability to vary the serve for tactical purposes (choosing between safety and speed) than professional men. It is in line with the study [17], which reported that professional players tend to present more variability on the y-axis than on the z-axis within the serve. Concerning the BI location, we found no difference between professional and junior men players within the FS. On the other hand, the professional men performed the BI location by 29% more forwards from the origin than junior men within the KS (Figure 5A). The more forward BI location allows hitting faster serve but is riskier, and therefore it is used by more experienced players.
4.4. The Main Findings on the z-Axis
As mentioned above, the professional men had more stability in the BI location than junior men within FS (56%) and KS (58%) (Figure 6B). Concerning the position of the BI, the junior men performed the BI less upwards from the origin on the z-axis by 15% than professional men (Figure 6A). However, the disparity of the BI location in the vertical position of the professional and junior men may relate to more leftward BI from the origin on the x-axis to impart more spin [13] and different knee flexion during the preparation phase within the FS in junior players [34].
Concerning the women, although the women group could not be included to compare due to the lack of studies that we selected for this review that professional women had a similar normalized vertical position of the BI on the z-axis as junior women; performed the BI location more leftwards on the x-axis and a more forwards on the y-axis than junior women within FS (Figure 3).
4.5. Limitations of the Study
The main study limitation was an impossible comparison of differences between men and women due to the lack of women’s data and eligibility criteria of English articles from only three databases. Another limitation is dividing the category of players’ experience only into professional and junior, instead of more common competition differentiation to beginner, intermediate, advanced, and elite players. This was conducted due to the reported categories in the original studies in the original studies. Other limitations are in limiting tennis movement analyses [35] such as volley [36], forehand, backhand, and muscle activation comparison [37].
5. Conclusions
The main finding of the systematic review was that professional men had a more stable height (upward, z-axis) and mediolateral position (leftward/rightward, x-axis) of the ball impact within the ball toss for both FS and KS than junior men. On the other hand, professional men had less stability anterior-posterior position (forward/backward, y-axis) of the ball impact within the ball toss for both FS and KS than junior men. Therefore, we recommend that junior men focus more on the same height of the ball impact but, on the contrary, do not be afraid to vary the anterior-posterior plane of the ball impact, where they can use higher racket speeds when hitting the ball more forward or more control when hitting the ball more backward. For further conducted research, it would be appropriate to focus more on the differences in hitting the ball during the ball toss in the anterior-posterior plane (forward/backward on the y-axis) and find out if there is a clear connection with the placement of the ball on the court (T body or wide location).
Supplementary Materials
The following supporting information can be downloaded at: https://www.mdpi.com/article/10.3390/app13063586/s1, Table S1: The search terms used in the review to identify ball impact location title; Table S2: The normalized data of the ball impact extracted from the chosen articles; Table S3: Assessment of methodological quality. References [3,14,15,17,19,20,26,27,28,29,30,31,32] are cited in Supplementary Materials.
Author Contributions
Design, J.V. and M.V.; Methodology, J.V. and M.V.; Validation, P.S. and D.J.C.; Formal Analysis, M.V.; Investigation, J.V.; Resources, J.V.; Data Curation, J.V. and M.V.; Writing—Original Draft Preparation, M.V. and J.V.; Writing—Review & Editing, P.S. and D.J.C.; Visualization, M.V.; Supervision, P.S. and D.J.C.; Funding Acquisition, P.S. All authors have read and agreed to the published version of the manuscript.
Funding
This article was supported by a student grant GAUK 88121, and the Cooperation Program, research area SPOB. Each of them is an internal funding opportunity, so the funding agency did not play a role in the creation of this article.
Institutional Review Board Statement
Not applicable.
Informed Consent Statement
Not applicable.
Data Availability Statement
All data generated or analyzed during this study are included in this published article and Supplementary Materials.
Conflicts of Interest
The authors declare no conflict of interest.
References
- Avilés, C.; Navia, J.A.; Ruiz, L.M.; de Quel, M. Do expert tennis players actually demonstrate anticipatory behavior when returning a first serve under representative conditions? A systematic review including quality assessment and methodological recommendations. Psychol. Sport Exerc. 2019, 43, 16–26. [Google Scholar] [CrossRef]
- Chang, C.-W.; Qiu, Y.-R. Constructing a Gaming Model for Professional Tennis Players Using the C5.0 Algorithm. Appl. Sci. 2022, 12, 8222. [Google Scholar] [CrossRef]
- Chow, J.; Carlton, L.; Lim, Y.-T.; Chae, W.-S.; Shim, J.-H.; Kuenster, A.; Kokubun, K. Comparing the pre- and post-impact ball and racquet kinematics of elite tennis players’ first and second serves: A preliminary study. J. Sports Sci. 2003, 21, 529–537. [Google Scholar] [CrossRef]
- Sheets, A.L.; Abrams, G.D.; Corazza, S.; Safran, M.R.; Andriacchi, T.P. Kinematics Differences Between the Flat, Kick, and Slice Serves Measured Using a Markerless Motion Capture Method. Ann. Biomed. Eng. 2011, 39, 3011–3020. [Google Scholar] [CrossRef] [PubMed]
- Sakurai, S.; Reid, M.; Elliott, B. Ball spin in the tenniFigures serve: Spin rate and axis of rotation. Sports Biomech. 2013, 12, 23–29. [Google Scholar] [CrossRef] [PubMed]
- Cross, R. A double pendulum model of tennis strokes. Am. J. Phys. 2011, 79, 470–476. [Google Scholar] [CrossRef]
- Mourtzios, C.; Athanailidis, I.; Arvanitidou, V.; Kellis, E. Ankle and Knee Joint Kinematics Differ between Flat, Slice and Topspin Serves in Young Tennis Players. Eur. J. Sport Sci. 2022, 1, 16–22. [Google Scholar] [CrossRef]
- Reid, M.; Elliott, B.; Alderson, J. Shoulder joint loading in the high performance flat and kick tennis serves. Br. J. Sports Med. 2007, 41, 884–889. [Google Scholar] [CrossRef]
- Gordon, B.J.; Dapena, J. Contributions of joint rotations to racquet speed in the tennis serve. J. Sports Sci. 2006, 24, 31–49. [Google Scholar] [CrossRef]
- Elliott, B.C.; Marshall, R.N.; Noffal, G.J. Contributions of Upper Limb Segment Rotations during the Power Serve in Tennis. J. Appl. Biomech. 1995, 11, 433–442. [Google Scholar] [CrossRef]
- Chow, J.; Carlton, L.; Chae, W.S.; Lim, Y.T.; Shim, J.H. Pre- and post-impact ball and racquet characteristics during tennis serves performed by elite male and female players. In Proceedings of the ISBS-Conference Proceedings Archive 1999, Perth, WA, Australia, 30 June–6 July 1999. [Google Scholar]
- Bahamonde, R.E. Changes in angular momentum during the tennis serve. J. Sports Sci. 2000, 18, 579–592. [Google Scholar] [CrossRef]
- Martin, C.; Kulpa, R.; Delamarche, P.; Bideau, B. Professional tennis players’ serve: Correlation between segmental angular momentums and ball velocity. Sports Biomech. 2013, 12, 2–14. [Google Scholar] [CrossRef]
- Reid, M.; Whiteside, D.; Elliott, B. Serving to different locations: Set-up, toss, and racket kinematics of the professional tennis serve. Sports Biomech. 2011, 10, 407–414. [Google Scholar] [CrossRef]
- Whiteside, D.; Giblin, G. Reid Redefining the Spatial Consistency in the Ball Toss of the Professional Female Tennis Serve. In Proceedings of the 32nd International Conference of Biomechanics in Sports 2014, Johnson City, TN, USA, 12–16 July 2014; pp. 181–185. [Google Scholar]
- Abrams, G.D.; Sheets, A.L.; Andriacchi, T.P.; Safran, M.R. Review of tennis serve motion analysis and the biomechanics of three serve types with implications for injury. Sports Biomech. 2011, 10, 378–390. [Google Scholar] [CrossRef] [PubMed]
- Mendes, P.C.; Fuentes, J.P.; Mendes, R.; Martins, F.M.L.; Clemente, F.M.; Couceiro, M.S. The variability of the serve toss in tennis under the influence of artificial crosswind. J. Sports Sci. Med. 2013, 12, 309–315. [Google Scholar] [PubMed]
- Navia, J.A.; Avilés, C.; Dicks, M.; Ruiz-Pérez, L.M. The spatiotemporal control of expert tennis players when returning first serves: A perception-action perspective. J. Sports Sci. 2021, 40, 16–23. [Google Scholar] [CrossRef]
- Carboch, J.; Tufano, J.J.; Süss, V. Ball toss kinematics of different service types in professional tennis players. Int. J. Perform. Anal. Sport 2018, 18, 881–891. [Google Scholar] [CrossRef]
- Connolly, M.; Middleton, K.; Spence, G.; Cant, O.; Reid, M. Effects of Lumbar Spine Abnormality and Serve Types on Lumbar Kinematics in Elite Adolescent Tennis Players. Sports Med.—Open 2021, 7, 7. [Google Scholar] [CrossRef]
- Liberati, M.; Tetzlaff, J.; Altman, D.G.; PRISMA Group. Preferred reporting items for systematic reviews and meta-analyses: The PRISMA statement. PLoS Med. 2009, 6, e1000097. [Google Scholar] [CrossRef]
- Moher, D.; Stewart, L.; Shekelle, P. Implementing PRISMA-P: Recommendations for prospective authors. Syst. Rev. 2016, 5, 15. [Google Scholar] [CrossRef]
- Vandenbroucke, J.P.; von Elm, E.; Altman, D.G.; Gøtzsche, P.C.; Mulrow, C.D.; Pocock, S.J.; Poole, C.; Schlesselman, J.J.; Egger, M. Strengthening the Reporting of Observational Studies in Epidemiology (STROBE): Explanation and Elaboration. Epidemiology 2007, 18, 805–835. [Google Scholar] [CrossRef] [PubMed]
- Hizan, H.; Whipp, P.; Reid, M. Comparison of serve and serve return statistics of high performance male and female tennis players from different age-groups. Int. J. Perform. Anal. Sport 2011, 11, 365–375. [Google Scholar] [CrossRef]
- Jannah, M.; Hidayatullah, M.F.; Syaifullah, R. Anthropometric and biomotor factors that determine the ability of field tennis service. J. Phys. Educ. Health Sport 2021, 11, 167–174. [Google Scholar] [CrossRef]
- Carboch, J.; Süss, V. Toss differences between the slice serve and the kick serve in tennis. Acta Gymnica 2015, 45, 93–97. [Google Scholar] [CrossRef]
- Reid, M.; Whiteside, D.; Elliott, B. Effect of skill decomposition on racket and ball kinematics of the elite junior tennis serve. Sports Biomech. 2010, 9, 296–303. [Google Scholar] [CrossRef] [PubMed]
- Fett, J.; Oberschelp, N.; Vuong, J.-L.; Wiewelhove, T.; Ferrauti, A. Kinematic characteristics of the tennis serve from the ad and deuce court service positions in elite junior players. PLoS ONE 2021, 16, e0252650. [Google Scholar] [CrossRef] [PubMed]
- Giblin, G.; Whiteside, D.; Reid, M. Now you see, now you don’t… The influence of visual occlusion on racket and ball kinematics in the tennis serve. Sport. Biomech. 2017, 16, 23–33. [Google Scholar] [CrossRef]
- Campbell, A.; Straker, L.; O’Sullivan, P.; Elliott, B.; Reid, M. Lumbar Loading in the Elite Adolescent Tennis Serve: Link to Low Back Pain. Med. Sci. Sports Exerc. 2013, 45, 1562–1568. [Google Scholar] [CrossRef]
- Whiteside, D.; Elliott, B.; Lay, B.; Reid, M. The Effect of Age on Discrete Kinematics of the Elite Female Tennis Serve. J. Appl. Biomech. 2013, 29, 573–582. [Google Scholar] [CrossRef]
- Whiteside, D.; Elliott, B.C.; Lay, B.; Reid, M. Coordination and variability in the elite female tennis serve. J. Sports Sci. 2015, 33, 675–686. [Google Scholar] [CrossRef]
- Xavier, A.P.; Ivo, F.F.; Neto, L.B.; Ervilha, U.F. Ball Position during the Tennis Serve Toss Performed by Junior Athletes: Comparison between the First and Second Service. J. Phys. Edu. Sport 2017, 17, 424–430. [Google Scholar] [CrossRef]
- Hornestam, J.; Souza, T.; Magalhães, F.; Begon, M.; Santos, T.; Fonseca, S. The Effects of Knee Flexion on Tennis Serve Performance of Intermediate Level Tennis Players. Sensors 2021, 21, 5254. [Google Scholar] [CrossRef] [PubMed]
- Perri, T.; Reid, M.; Murphy, A.; Howle, K.; Duffield, R. Prototype Machine Learning Algorithms from Wearable Technology to Detect Tennis Stroke and Movement Actions. Sensors 2022, 22, 8868. [Google Scholar] [CrossRef] [PubMed]
- Martínez-Gallego, R.; Ramón-Llin, J.; Crespo, M. A Cluster Analysis Approach to Profile Men and Women’s Volley Positions in Professional Tennis Matches (Doubles). Sustainability 2021, 13, 63–70. [Google Scholar] [CrossRef]
- Ikenaga, M.; Okuma, N.; Nishiyama, H.; Chiba, S.; Nishino, K.; Omori, G.; Nunome, H. Influence of Ball Impact Location on Racquet Kinematics, Forearm Muscle Activation and Shot Accuracy during the Forehand Groundstrokes in Tennis. Proceedings 2020, 49, 89. [Google Scholar] [CrossRef]
Disclaimer/Publisher’s Note: The statements, opinions and data contained in all publications are solely those of the individual author(s) and contributor(s) and not of MDPI and/or the editor(s). MDPI and/or the editor(s) disclaim responsibility for any injury to people or property resulting from any ideas, methods, instructions or products referred to in the content. |
© 2023 by the authors. Licensee MDPI, Basel, Switzerland. This article is an open access article distributed under the terms and conditions of the Creative Commons Attribution (CC BY) license (https://creativecommons.org/licenses/by/4.0/).