Abstract
It is important to apply the Length types of Processed Rebar Simplification (LPRS) to rebar work for improving work efficiency and reducing labor in construction fields. However, when used excessively, LPRS can also bring about adverse results, as the increase in the amount of wasted rebars can scale with the cutting process, leading to an increase in material cost. Therefore, it is crucial to find a proper level of simplification for considering labor and material cost together. In this study, various simplification tests were conducted based on BIM software to quantitatively validate the variation of the amount of rebar and LPRS according to the simplification. These tests were conducted for each member and the shape of the building, using the data of five projects, by dividing the unit of simplified rebar length into three cases. The research analysis showed that simplifying the unit of rebar lengths to 500 mm and 1000 mm increased the amounts of materials at a greater rate, making them undesirable. Further, it was recognized that irregular slabs, compared to regular slabs, more efficiently reduced the number of LPRS when adopting simplification methods. This study is expected to contribute to preventing material costs from increasing excessively by quantitatively analyzing the impact level of simplification on the amount of rebar materials and LPRS.
1. Introduction
Rebar work is a representative labor-intensive construction project [1,2,3]. Moreover, it is very important work from the perspective of project cost management and process management, because it takes a lot of working hours on site [1]. Due to the nature of labor-intensive and field-intensive rebar work [1,3], the increase in work efficiency can be greatly helpful to reduce overall construction costs. Rebar installation is commonly performed by a crew of experienced and skilled workers, who usually work in pairs [4], and it is time-consuming work [5]. Therefore, if the rebar itself is designed to be easily processed and installed in the field, the work efficiency of workers will be improved. In particular, if the number of rebar types handled in the field is reduced, repetitive work performance will be facilitated, increasing the work efficiency of workers. Therefore, these matters need to be considered in advance in the Quantity Take-Off (QTO) stage. QTO incurs a significant impact on the overall construction cost and construction period, as it supports estimation, cost management, and construction project planning [6,7]. When automated through the implementation of BIM, QTO becomes an extremely useful task, which enables cost and schedule benefits by providing simple and accurate estimates for projects [8].
Meanwhile, substantial time and labor are wasted on distinguishing suitable rebars for use in rebar work in construction fields due to the diversity of rebar types, meaning that simplification of the rebar types can help to reduce this wasted time and labor. Due to the labor-intensive nature of rebar work, in which the labor cost accounts for 65% of the overall cost, increased labor consumption directly impacts the project costs [1]. Thus, most construction projects in Korea perform simplification of the length types of processed rebar, and there are three common simplification methods: (1) simplifying the length to 100 mm units; (2) simplifying by rounding up to the smallest deviation among 300 mm, 500 mm, 700 mm, and 1000 mm; and (3) simplifying by rounding up to 500 mm and 1000 mm.
The simplification methods of (1) and (2) are most commonly used, while method (3) is occasionally considered in the case of large-scale projects. Through this simplification method, it is possible to reduce the number of Length types of Processed Rebar Simplification (LPRS), which means the length types rounded up to a multiple of units (e.g., 300 mm, 600 mm, or 900 mm, etc.). Reducing the number LPRS affects rebar construction work productivity. O’Connor et al. [9] and Alshawi et al. [10] discussed the negative effects of variability in element size on the complexity of the configuration process. Furthermore, Jarkas, A. M. [4] illustrated that the increase in the number of member sizes of rebars undermines the continuity of the work and adversely affects efficiency. The research findings from previous work prove that the simplification of rebar size can lead to an improvement in work efficiency through a decrease in the number of rebar LPRS, thereby reducing working hours and labor costs.
However, after cutting the simplified rebars into the actual lengths required, the amount that gets cut out is wasted. This can lead to a large loss of material costs because the accumulation of such wasted rebars can lead to an overall increase in material costs, as rebar work accounts for about 9.8% of the total construction costs [1]. Moreover, the price of rebar has more than doubled over the past 20 years [11]. In other words, the application of LPRS can increase the amount of wasted rebars due to the cutting process, leading to an increase in material cost, while increasing work efficiency and reducing labor. This means that it is important to find a proper level of simplification for considering labor cost and material cost together. Therefore, it is necessary to accurately analyze the effect of applying LPRS on the amount of rebar actually ordered.
As repetitive work can be required in this step, 3D BIM-based QTO is suitable because of its high precision and convenience. However, even though previous works explored rebar QTO and BIM-based QTO as theoretical studies, only a few studies have considered both an increase in the amount of rebars and a decrease in LPRS by simplification among case studies. Therefore, based on the status quo of the research, this study aims to find solutions to the following research questions by conducting a case study on various building design cases of several construction projects to collect data on the simplification method:
- (Q1) How much does the amount of required rebar materials increase and the number of LPRS decrease accordingly by simplifying the length units of rebar?
- (Q2) What can be considered in the QTO results by building?
The major contributions of this study include the following:
- The results of this study can contribute to preventing material costs from increasing excessively by quantitatively analyzing the impact level of simplification on the amount of rebar materials and LPRS.
- The results of this study can be used as an indicator for efficient design in the simplification method when performing rebar construction in future construction projects.
2. Literature Review
Numerous studies have been conducted in relation to 3D-BIM-based QTO including rebar materials. For instance, Pratoom et al. [12] demonstrated the efficiency of BIM software-based QTO by comparing the amount of rebar produced through traditional QTO and BIM software-based QTO. Jo et al. [13] suggested a method of performing rebar QTO using a ratio of amounts (rebar material input to concrete).
Meanwhile, various studies have also been conducted considering the reduction in the waste of rebar length. Park et al. [14] conducted a study to establish a system development foundation for QTO more accurately and quickly, considering the joint and settlement, along with work efficiency, according to the processing type by reinforcement member/distribution. Lee et al. [15] analyzed the rebar material amount according to factors such as the member type, size of the main bar, building size and scale, calculation item, and order length using the BuilderHub software. Kim et al. [16] developed an automatic estimation tool called AutoES. When conducting QTO, AutoES helps calculate to find the rebar combination with the least loss of wasted rebar. This tool can be used for both special orders and market orders. Khosakitchalert et al. [17] proposed a new method, “BIM-based compound element quantity takeoff improvement” (BCEQTI), using information from BIM-based clash detection to eliminate excess quantities and add missing quantities. Rahimi et al. [18] suggested a Column-Generation-based approach that provides the most cost-effective arrangement of rebar based on the customer-specified maximum heterogeneity. Khondoker et al. [19] optimized the use of available market-length rebars for generating the least possible waste using BIM modeling and mixed-integer linear programming. The materials are rebars used for RC structures. However, these studies considered only the reduction of wasted rebar, not work efficiency or LPRS, and they can only be used for the field processing method.
Meanwhile, Zheng et al. [20] proposed an optimal procurement and cutting plan for rebar and presented an optimization solution for rebar cost and volume loss. In this study, the Pareto optimization technique was applied to simultaneously reduce overall cost and lower material waste. Although it considers the length of wasted rebar together with labor, it can be used only for field processing methods, too. Furthermore, this study is about the optimization of rebar detailing design and installation planning, and it can be said that the direct relationship with QTO is small.
Numerous studies have been conducted related to 3D BIM-based QTO including rebar materials. In addition, it was confirmed that research related to the reduction of wasted of rebars has been actively conducted until recently. In particular, most of this type of research was conducted with the aim of minimizing material costs or securing sustainability. On the other hand, few studies have been conducted considering work efficiency or LPRS along with the reduction of wasted of rebar regarding 3D BIM-based QTO. In the case of minimizing the waste of rebar, work efficiency decreases due to the increase in the number of LPRS, so these various factors should be considered at the same time. In addition, most of the existing studies are related to the field processing method of rebars, and it is difficult to apply them to the factory processing method.
Therefore, this study considered the decrease in LPRS with the increase in the amount of rebars due to the simplification of the length of rebars and the applicability for the factory processing method. Previous studies related to QTO and the calculation of rebar loss reviewed in this section are summarized in Table 1 below.

Table 1.
Previous studies related to 3D BIM-based QTO and minimizing rebar materials.
3. Methodology & Results
3.1. Construction Site Overview of Case Studies
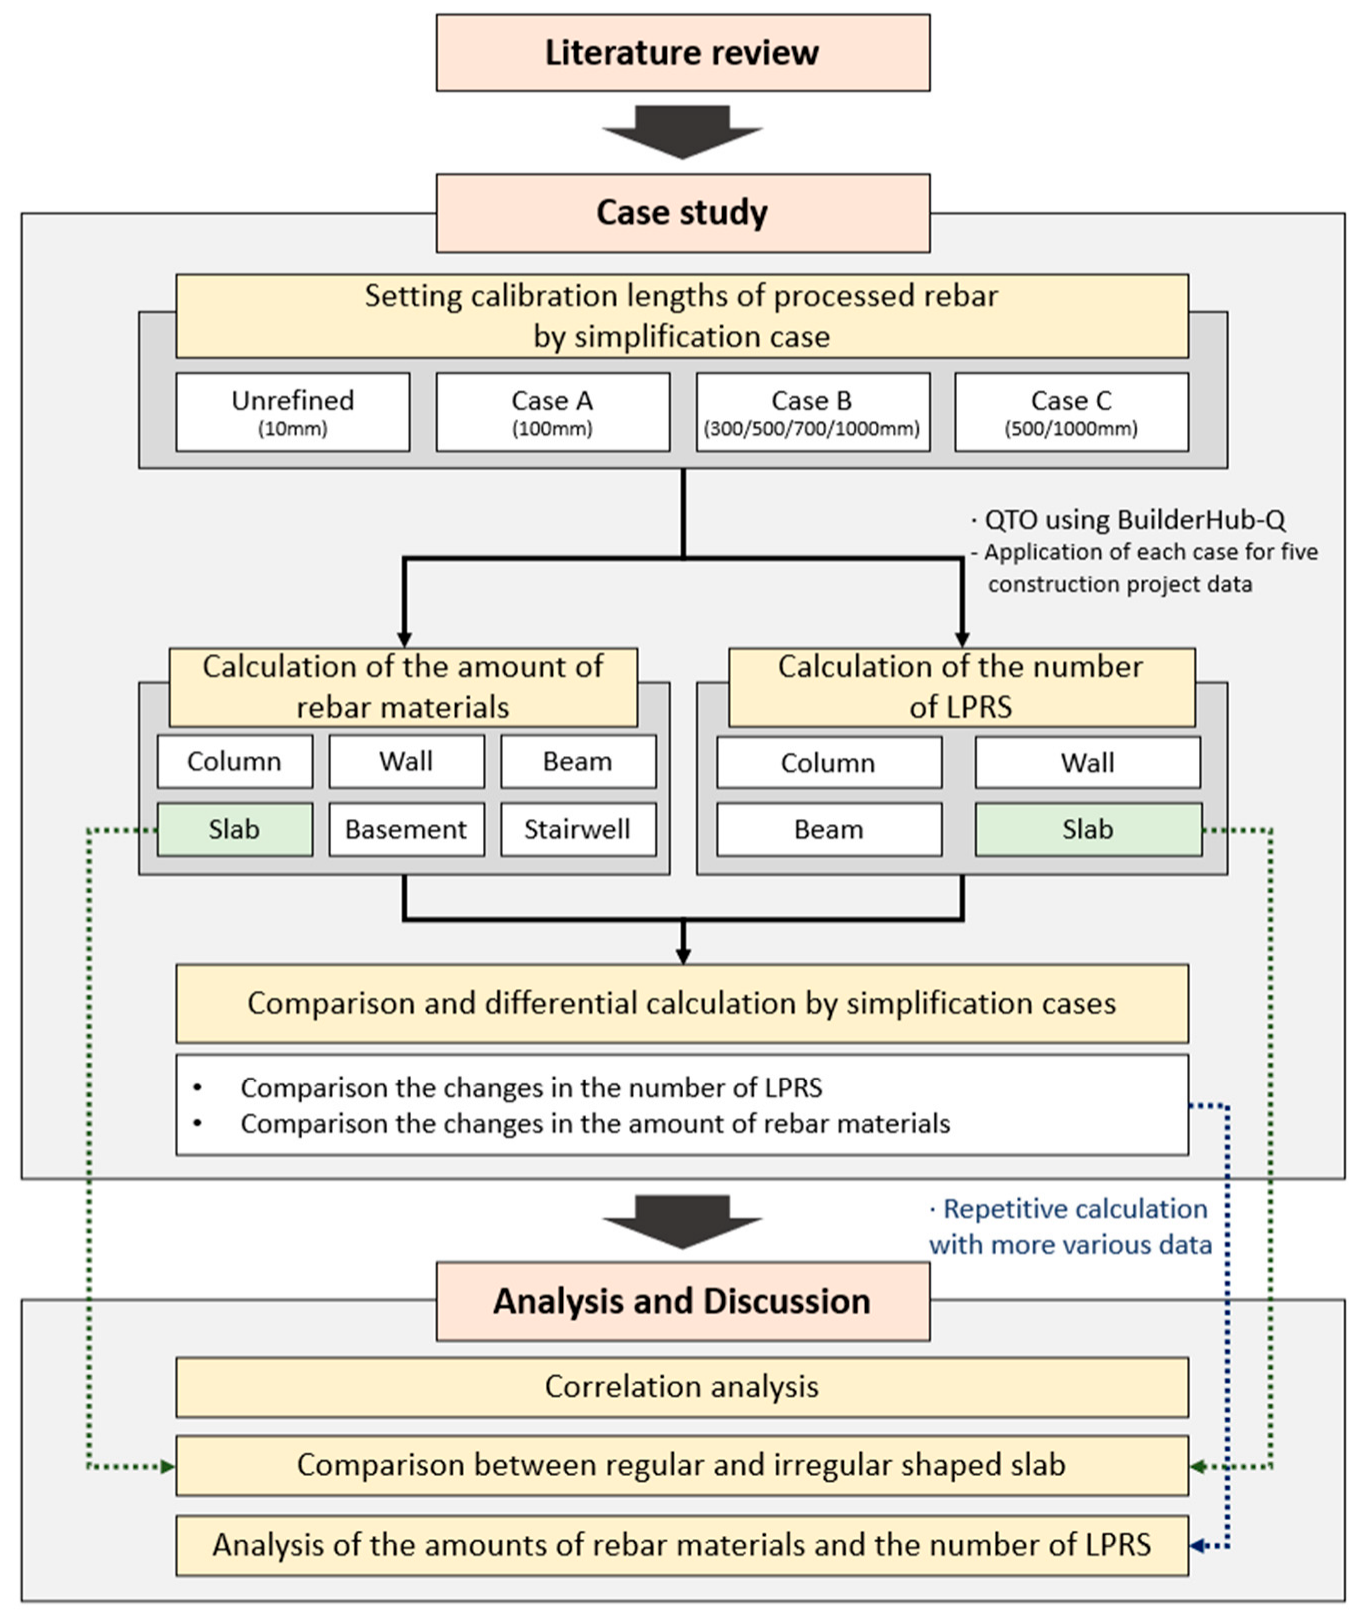
The research procedure of this study is shown in Figure 1 below. In the case study section, the calibration lengths are set for each simplification case first. Among the various simplification cases, the unrefined length means the case of applying the real length of the rebar, which is not rounded up in this study. Then, the simplification test is performed on five construction projects’ data based on BuilderHub-Q, which is a commercial 3D BIM tool specialized in the Korean Design Standard (KDS). In this study, there are a total of five construction sites composed of 27 buildings used for QTO, and an overview of each project appears as an appendix (Table A1, Table A2, Table A3, Table A4 and Table A5). The project overview illustrates the type and structure of the building, the size of each building, and information about the floor area. As a result of the simplification test and QTO, the amount of rebar materials and the number of LPRS for various members are calculated for each simplification case of each set of field project data. In the case of LPRS, rebar arrangement was conducted based on the AutoCAD Add-on software 2DShopPro, using rebar drawings generated by BuilderHub-Q. 2DShopPro is a software that can conduct the design of rebar arrangement based on 2D CAD drawings and calculate the types of rebar, such as the shape, length, and thickness. As a result of the case study section, a comparison of the amount of rebar materials and the number of LPRS is performed between the simplification cases.
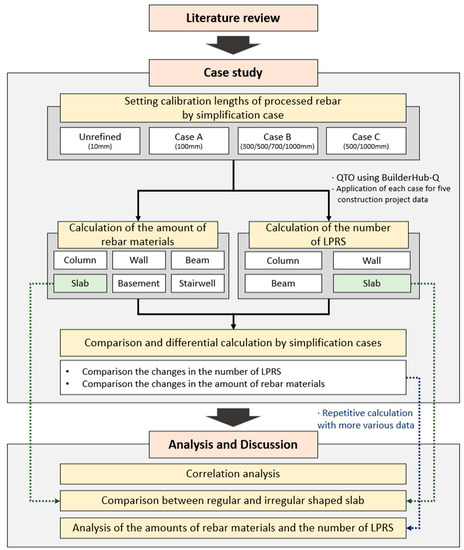
Figure 1.
Research procedure of this study.
In the analysis and discussion section, correlation analysis was conducted to confirm a linear correlation between the total floor area of the building and (1) the change in rebar material amounts and (2) the number of LPRS calculated through 3D BIM-based QTO. Additionally, the slab member data in the case study stage are divided into regular and irregularly shaped slabs and compared for analysis in terms of their shape. In addition, analysis of the amounts of rebar materials and the number of LPRS is performed on 27 individual sets of building data because only five sets of construction project data were analyzed overall in the case study stage. Finally, synthesizing all of these results, the discussion is conducted.
3.2. Selection of Calibration Lengths and Quantity Take-Off
In this study, QTO was conducted by calibrating the length of processed rebar into four cases, as follows:
- (1)
- unrefined length of processed rebar,
- (2)
- simplified length to 100 mm units,
- (3)
- simplified length to 300 mm, 500 mm, 700 mm, and 1000 mm units, and
- (4)
- simplified length to 500 mm and 1000 mm units.
The calibration length of processed rebar for each member is illustrated in Table 2.
Table 2.
Calibration Lengths of Processed Rebar by Case.
In domestic construction sites, the lengths of processed rebar were 100 mm for columns and walls (vertical rebars only), and the unit of horizontal rebars for walls is uniform in length at 10 mm. Thus, only the lengths of processed rebars used for basements, stairwells, beams, and slabs were divided into 10 mm (unrefined), 100 mm (Case A), 300 mm/500 mm/700 mm/1000 mm (Case B), and 500 mm/1000 mm (Case C). When PC columns were among the members used, the arrangement of rebar was meaningless, and it was excluded from the QTO. In addition, in the case of basements and stairwells, the software did not provide an output function for basement rebar arrangement drawings; only the quantity was calculated, without the corresponding LPRS. All rebar work arrangement using BIM software was performed according to the “Design Criteria for Concrete Structures (KDS 14 20 00) [21]” and “Standard Specification for Concrete Structures (KCS 14 20 00) [22]”, standards released by the Ministry of Land, Infrastructure, and Transport in the Republic of Korea.
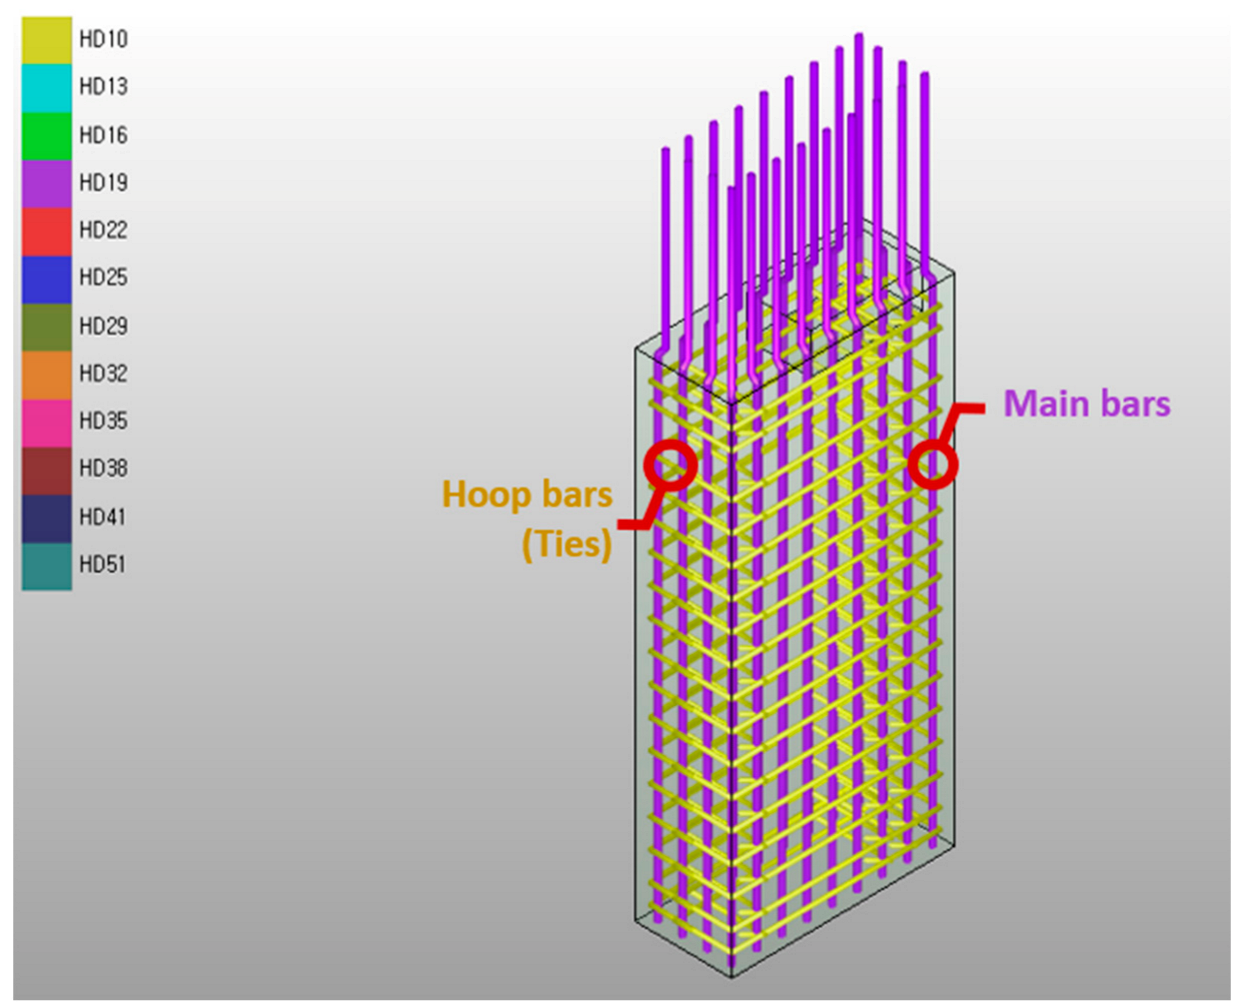
3.2.1. Columns
The column consists of main bars arranged in the axial direction and hoop bars (ties) arranged in the horizontal direction, and two arrangement drawings (top-view and side-view) are generated when using 2DShopPro, as the axial arrangement of the rebar is the Z-axis. Figure 2 below shows an example of the rebar arrangement of column members and the name of the rebar for each part.

Figure 2.
Example of the rebar arrangement of column members and the name of the rebar for each part (1F, Building #101 of construction project A).
For columns, as the length of processed rebar was calibrated equally in 100 mm units in two cases, LPRS calculations were performed only once. Since most apartment construction in Korea is of a bearing wall structure, the column arrangement of rebar was conducted only in specific areas, such as the basement floors and parking lots. In the case of the lowest floor of the building, additional calculations were performed for columns and walls, as the dowel bar exists in the basement. The results of the rebar arrangements and QTOs for column members are displayed in Table 3; buildings without a rebar column arrangement were excluded. Due to the bearing wall structure, it was confirmed that both the calculated amount of rebar and the number of LPRS were not large in the column member.
Table 3.
The amounts of rebar material and the number of rebar LPRS for column members.
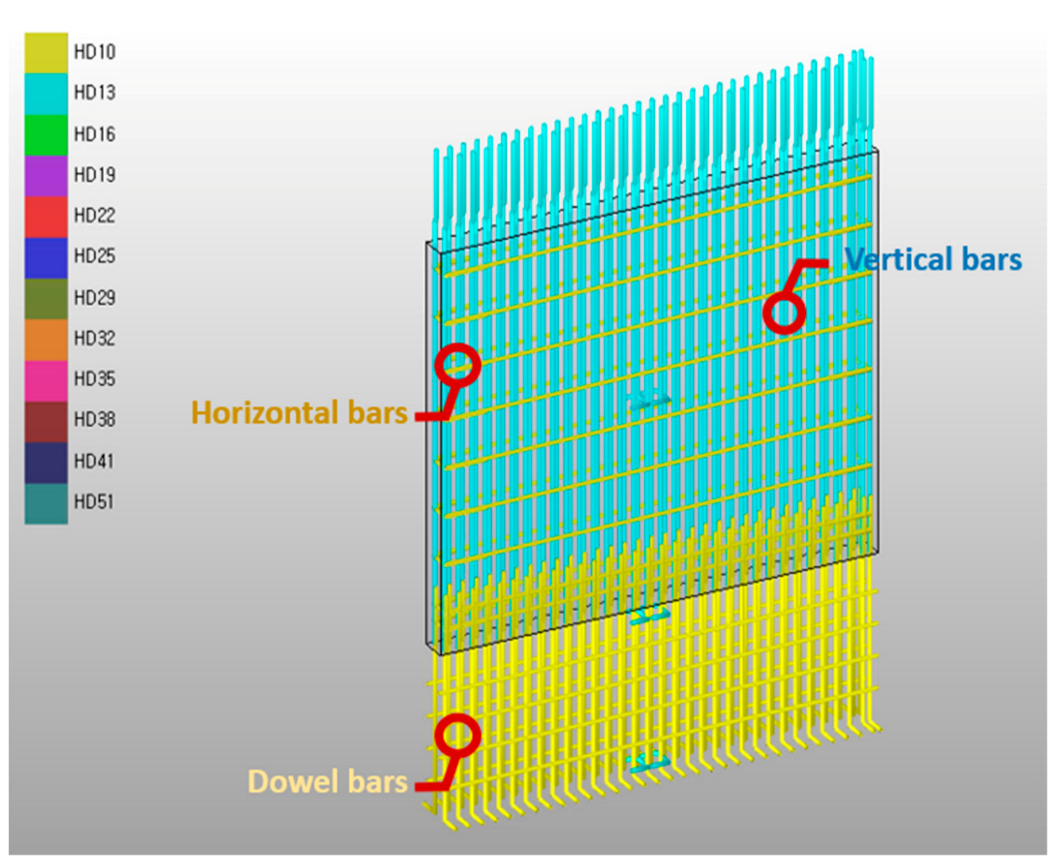
3.2.2. Walls
The main walls of domestic bearing wall structures are generally designed to simultaneously serve as both bearing and shear walls (for vertical and horizontal loads, respectively) [23]. A typical wall is arranged surrounding the outside of the vertical rebar with horizontal rebar. Figure 3 below shows an example of the rebar arrangement of wall members and the name of the rebar for each part.

Figure 3.
Example of the rebar arrangement of wall members and the name of the rebar for each part (B2F, Building #101 of construction project A).
As for the wall member, the length of processed rebar was calibrated by cases equally, so the quantity and LPRS calculation was performed only once. As in the case of the columns, a dowel bar connected to the base was calculated additionally. Table 4 exhibits the results of the rebar arrangements and QTOs for wall members. In the case of underground parking lots, a small number of LPRS were calculated compared to the amount of rebar material calculated. The number of the type of horizontal rebar was calculated as less than that of apartment buildings due to the large floor area.
Table 4.
The amounts of rebar material and the number of LPRS for wall members.
3.2.3. Beams
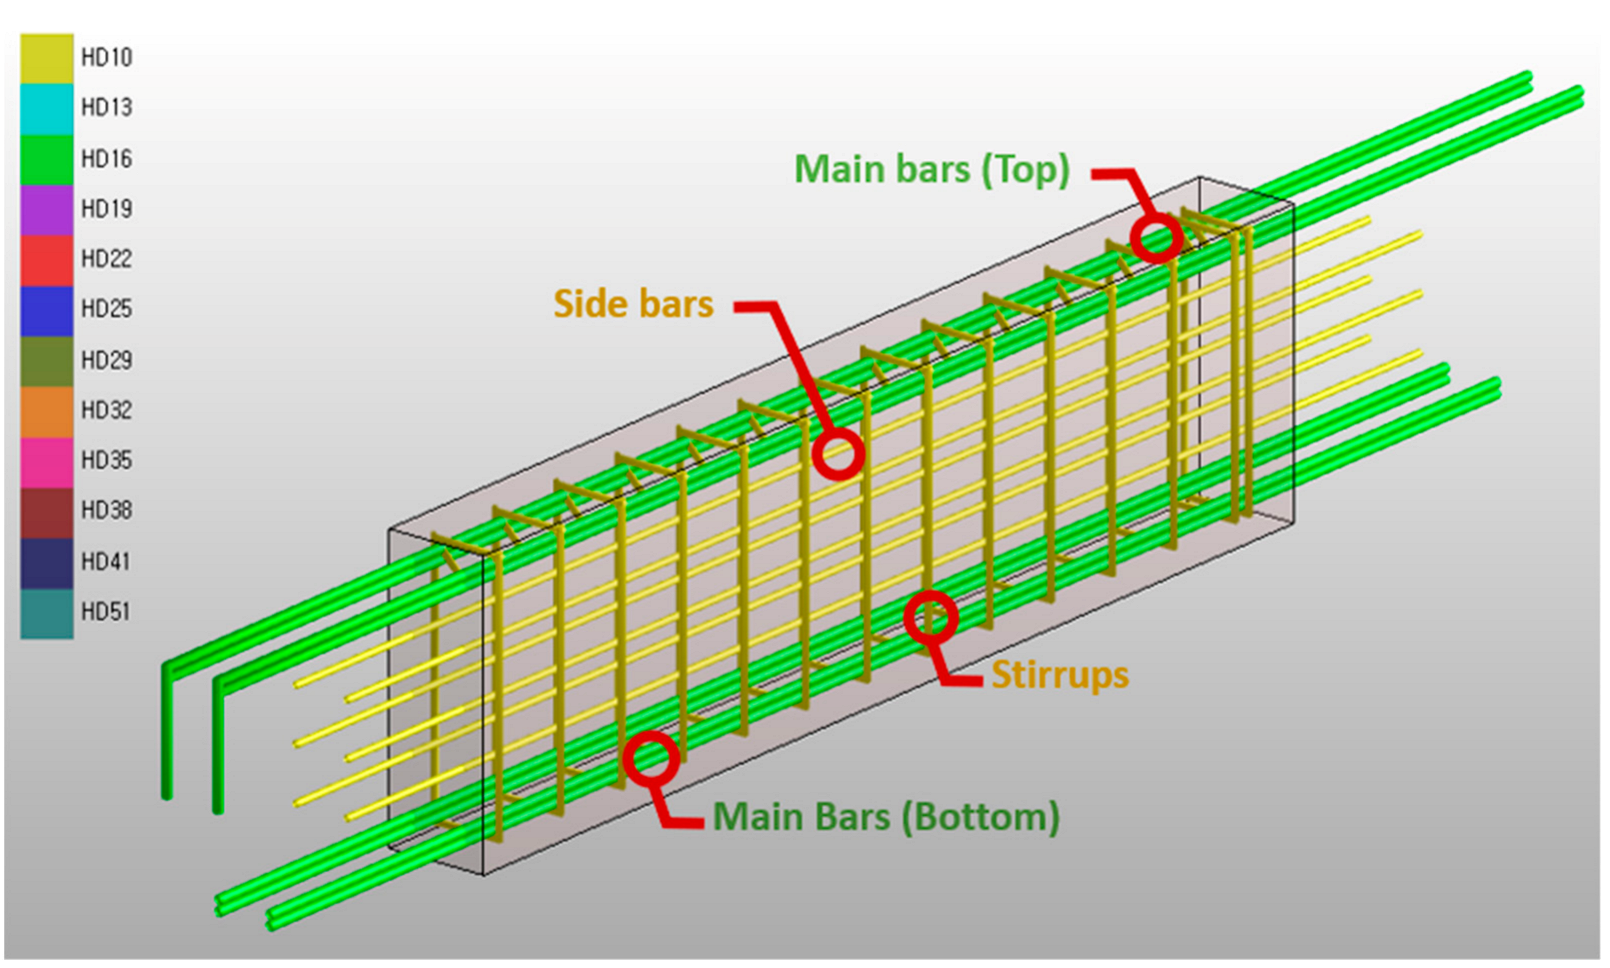
The beam consists of main bars, arranged axially to resist bending moments, and stirrups surrounding the main bars, in the lateral direction to resist shear forces. The main bars consist of a combination of top, bottom, and side bars (skin reinforcement), depending on the direction of the bending moment acting on the beam. In that case, the bending moment changes and is distributed by sections; thus, the beam is designed to be divided into the external, center, and internal sections. Figure 4 below shows an example of the rebar arrangement of beam members and the name of the rebar for each part.
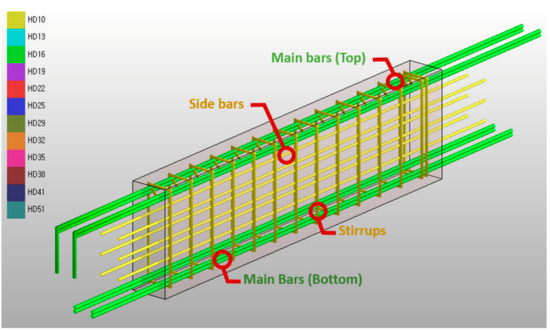
Figure 4.
Example of the rebar arrangement of beam members and the name of the rebar for each part (RF, Building #101 of construction project A).
The lengths of the beam member’s processed rebar were calibrated by segregating them into the cases of unrefined length and simplified lengths A, B, and C. Table 5 and Table 6 depict the results of the rebar arrangements and QTOs, as follows. The result values of QTO for the buildings of the project were summed, and the differential for each case was calculated for each project. In the case of Project H, the increase rate in the amounts of rebar (+4.67%) and the decrease rate in the number of LPRS (−41.24%) were the largest based on Case C. The QTO results and differentials for each building of each project are included in Table A6 and Table A7 in Appendix A. Table A6 shows the calculated amount of rebar by building for beam members by case. The “Diff.” specified in each case means the differential with the unrefined case. Table A7 shows the calculated number of LPRS in the same way.
Table 5.
Amounts of Rebar Materials for Beam Members and Differentials by Cases.
Table 6.
Numbers of LPRS for Beam Members and Differentials by Cases.
3.2.4. Slabs
The slab is arranged in both the short-side and the long-side directions (X- and Y-axis respectively). In addition, depending on the location of the beam, the deformation increases as the distance from the beam increases. As a result, the beam is divided into the column and middle strip sections to design the rebar arrangement for slabs. Furthermore, additional rebar arrangements for slabs must be performed for relatively vulnerable areas, such as openings. The QTO of slabs requires six types of design drawings, including arrangement drawings for the top and bottom X-axis, the top and bottom Y-axis, and the top/bottom reinforcement drawings. Figure 5 below shows an example of the rebar arrangement of slab members and the name of the rebar for each part.
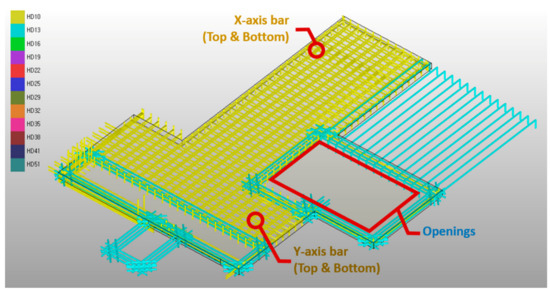
Figure 5.
Example of the rebar arrangement of slab members and the name of the rebar for each part (1F, Building #101 of construction project A).
The lengths of the processed rebar of the slab member were calibrated by allocating them into the unrefined case (10 mm), Case A (100 mm), Case B (300 mm/500 mm/700 mm/1000 mm), and Case C (500 mm/1000 mm). The results of the arrangements of the rebar and QTOs are captured in Table 7 and Table 8, as follows. As in the case of the beam, the results of QTO for the buildings of the project were summed. In addition, the differential was calculated for each case for the unrefined case. Based on Case C, Project C (+2.16%) showed the largest increase rates in the amounts of rebar materials, and Project G (−53.08%) showed the largest decrease in the number of LPRS. The QTO results and differentials for each building of each project are included in Table A8 and Table A9 in Appendix A. Table A8 shows the calculated amounts of rebar materials by building for slab members by case, and Table A9 shows the calculated number of LPRS.
Table 7.
Amounts of Rebar Materials for Slab Members and Differentials by Cases.
Table 8.
Numbers of LPRS for Slab Members and Differentials by Cases.
3.2.5. Basements and Stairwells
In the previously mentioned case of basements and stairwells, the 3D BIM software BuilderHub-Q supports the calculation function of rebar material amounts, but not the design of rebar arrangement in 2DShopPro. Therefore, only the amount of rebar material was calculated for each case and member. The total amounts of rebar materials calculated and the differentials from unrefined cases are referenced in Table 9, as follows. In the case of the basement, the increase rate of the amount of rebar of Case C compared to Case B was large (+0.39%p), and in the case of the stairwell, the increase rate of Case B compared to Case A was large (+0.98%p). The results of QTO for the basements and stairwells in each building are attached as Table A10 and Table A11 in Appendix A. Since the number of LPRS was not calculated, only the amount of rebar materials and the increasing rate compared to the unrefined case are shown.
Table 9.
Total amounts of rebar materials calculated and differentials from unrefined cases.
4. Analysis & Discussion
4.1. Correlation Analysis
In this section, an analysis was performed to confirm a linear correlation between the total floor area of the building and (1) the change in rebar material amounts and (2) the number of LPRS calculated through QTO. In the construction industry, design changes are often inevitable due to industrial characteristics [24], which means that QTO must be performed and revised repeatedly according to design changes. If the correlation analysis verifies that the linear correlation between each factor and the total floor area of the building is high, the results can contribute to predicting the change of these factors through the total floor area of the building in construction projects where frequent QTO works are challenging. Therefore, the correlation analysis between these factors and the floor area is important. Correlation analysis measures the strength of an association between two (or more) quantitative variables [25]. The correlation analysis was conducted according to Equation (1). The correlation coefficient values computed by the correlation analysis range from −1 to 1, which indicates that the two variables are strongly related in a linear manner if the absolute value of the correlation coefficient is closer to 1.
The resultant correlation coefficients are strong, as demonstrated in Table 10. These include the amounts of rebars calculated from the wall, beam, and slab members, other than column members that may not be included in the building composition due to the bearing wall system. This proves that the total amounts of rebar materials produced for each member reflect a strong positive correlation with the total floor areas of the building.
Table 10.
Correlation analysis between the amount of rebar and total floor area by members.
In the case of simplification, the differential in the number of LPRS for the unrefined case was aggregated by buildings. Only the values for beam and slab members that can measure the number of LPRS in the simplified case were aggregated, and correlation analysis was performed by corresponding to the total floor area of each building. Unlike in the case of Table 10, Table 11 captures low correlation coefficients (absolute values) between the total floor area and the number of LPRS in each simplification case for the length of processed rebar.
Table 11.
Correlation analysis between the results of the simplifications and total floor area.
The resultant low correlation coefficients occur because other factors, such as the arrangement of rebars, floor shape, and surrounding member location, are more influential than the total area of the building. The distributions of the amounts of rebar by total floor areas by members (Figure A1) and the reduction rates of the number of LPRS by total floor area by the case (Figure A2) are attached as an appendix.
4.2. A Study on the Irregular Shape of Slab
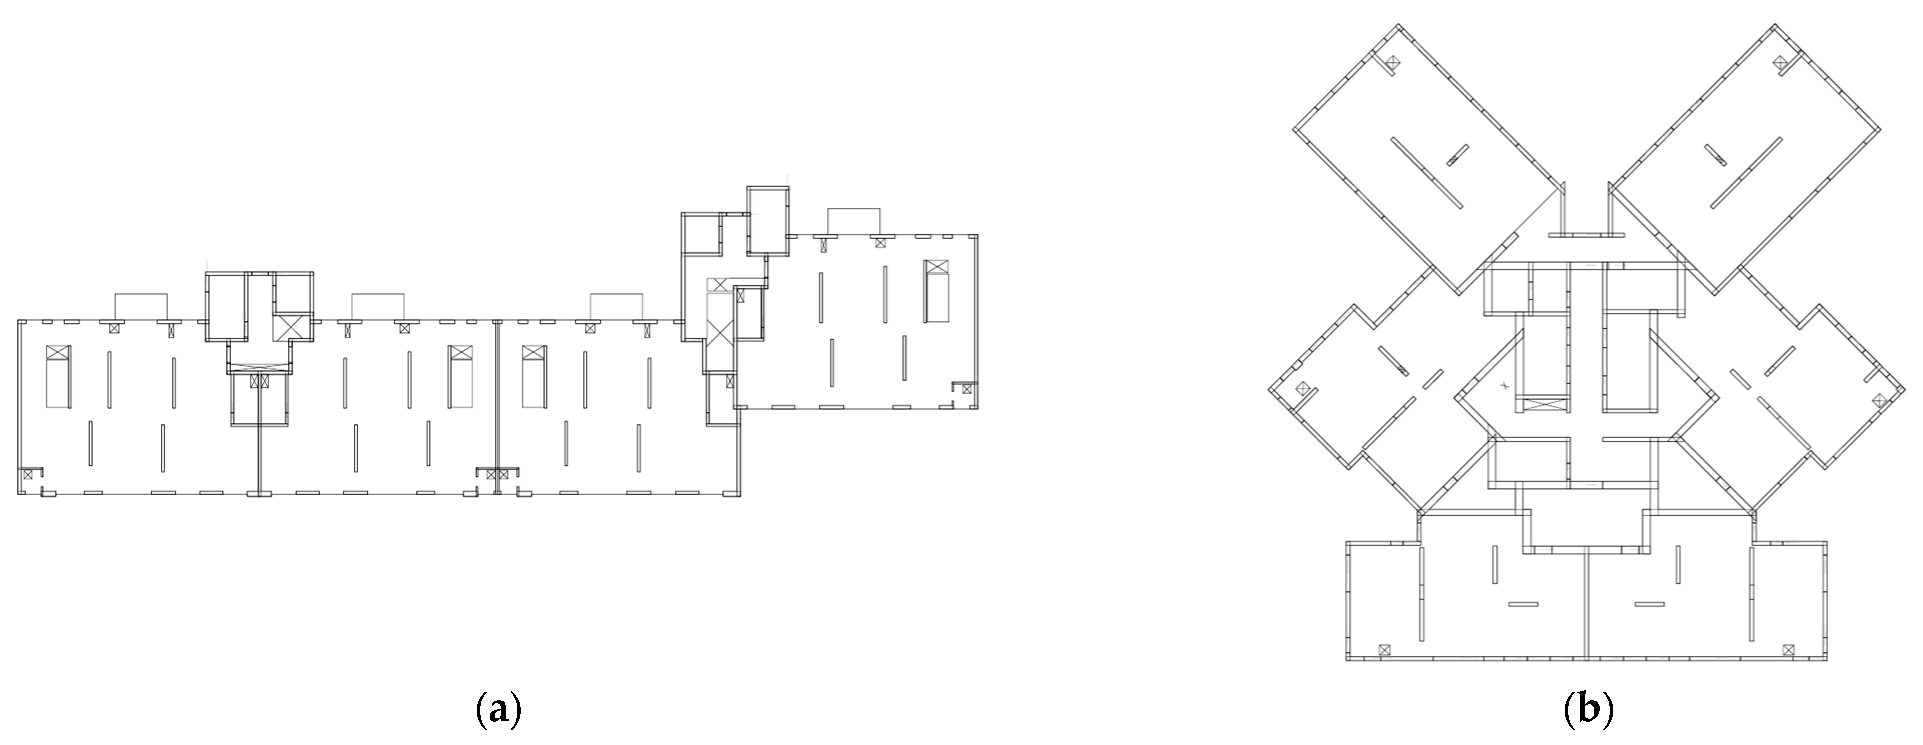
In performing rebar arrangement on the slab members of a building, square-shaped slabs are arranged in the longitudinal direction using long rebars of 8 m or more in length. However, in the case of irregular slabs that are not based on rectangular shapes (or with other shapes added), long rebars are not used frequently because they may suffer interference due to different axial directions. In addition, in case the slab’s long and short sides are not perpendicular, various types of LPRS are produced because different rebar lengths must be arranged at each point. In this environment, the efficiency of processed rebar length simplification was expected to be high. Thus, this study divided the slab shape into regular and irregular shapes to compare the reduction rates of the number of LPRS by simplification. Buildings consisting of only square slabs were classified as conventional shapes, as shown in Figure 6a, and the rest shown in Figure 6b were classified as irregular shapes. The comparison was conducted only on high-rise buildings, such as apartments and offices, whereas low-rise structures, such as security offices or underground parking lots, were excluded. The results of classifying each slab of the building into a regular or irregular shape are described in Table 12.
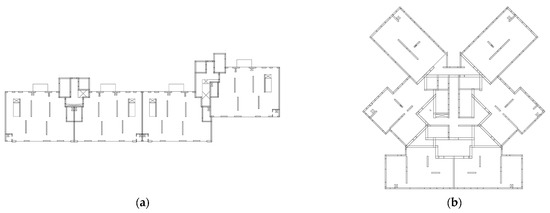
Figure 6.
Examples of each classification according to the shape of the slab: (a) regular shape of slab; (b) irregular shape of slab.
Table 12.
Results of classifying each slab of a building into a regular or irregular shape.
Table 13 exhibits a comparison of the calculated values of the rebar amount for regular and irregular slab shapes. Significantly, the amounts of rebar materials calculated per unit area are 0.018 t/m2 and 0.016 t/m2 for regular and irregular shapes, respectively; there is a slight difference, depending on the slab’s shape. However, in the case of the number of LPRS per unit area, the amounts were calculated to be 0.619 units/m2 for the irregular shape slab and 0.332 units/m2 for the regular shape slab (a 187% increase from the latter to the former). In addition, the proportions of the LPRS reduced through the simplification of the length of the processed rebar were −33.0%, −44.4%, and −51.2% in Cases A, B, and C, respectively, for irregular shape slabs. This corresponds to reductions of 18.5%p, 16.7%p, and 14.3%p (Case A, B, and C, respectively) when compared to regular shape slabs. Thus, more types of rebars are needed for rebar arrangement in the case of irregular slabs than in the case of regular slabs, and the type of rebars is reduced more effectively by simplifying the length of processed rebar.
Table 13.
Comparison of the calculated values of regular and irregular shapes of slabs.
4.3. Analysis of the Amounts of Rebar Materials and the Number of LPRS
The previous section confirmed that simplifying the length of processed rebars reduces the LPRS required for rebar arrangement, and in particular, that simplification efficiency is higher for irregular slab members. However, as the length of processed rebar is simplified to a larger unit, the amount of rebar material ordered also increases, resulting in higher costs of rebar materials in the construction project. Therefore, understanding the rates of increase (amount of rebar calculated) and decrease (LPRS for each unit of simplified length) becomes paramount. Figure 7 shows the distributions of the fluctuating rates of the amount of rebar and the number of LPRS calculated, by each case and member.
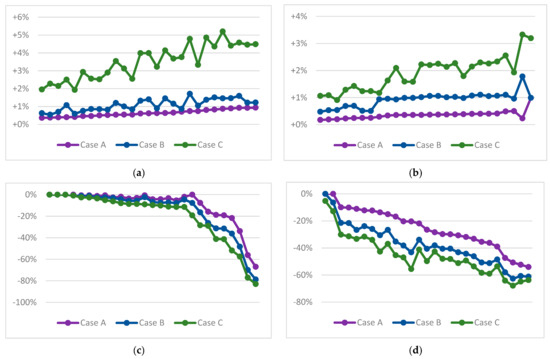
Figure 7.
Distributions of the changing rates for: (a) amounts of rebars by cases for beam members; (b) also for slab members; (c) number of LPRS by cases for beam members; (d) also for slab members.
Referring to Figure 7a, there is no significant differential in the amount of rebar calculated in Case A (average value: +0.62%, deviation: 0.17%) and Case B (average: +1.09%, deviation: 0.33%) in the case of the beam member, but a tangible increase is visible in Case C (average: +3.49%, deviation: 0.96%). In the case of slab members per Figure 7b, there is one value (+2.20%) that exceeds +2% in Case B (average: +0.97%, deviation: 0.36%), whereas the average is +2.00% and the deviation 0.80% in Case C, revealing a significant difference between the cases. Further, some cases revealed that the reduction rate of the number of LPRS was less when simplifying from Case B to Case C than from Case A to Case B. These were confirmed in 9 and 25 out of 27 cases in beams and slabs, respectively. Since this links directly to project construction costs, the reduction by simplifying the length of processed rebar lacks efficiency compared to Case A or B, and simplifying the length of processed rebar to Case C should be avoided in general construction projects.
Referring to Figure 7a, there is no significant differential in the amount of rebar calculated in Case A (average value: +0.62%, deviation: 0.17%) and Case B (average: +1.09%, deviation: 0.33%) in the case of the beam member, but a tangible increase is visible in Case C (average: +3.49%, deviation: 0.96%). In the case of slab members per Figure 7b, there is one value (+2.20%) that exceeds +2% in Case B (average: +0.97%, deviation: 0.36%), whereas the average is +2.00% and the deviation 0.80% in Case C, revealing a significant difference between the cases. Moreover, some cases revealed that the reduction rate of the number of LPRS was less when simplifying from Case B to Case C than from Case A to Case B. These were confirmed in 9 and 25 out of 27 cases in beams and slabs, respectively. Since this links directly to project construction costs, reduction by simplifying the length of processed rebar lacks efficiency compared to Case A or B, and simplifying the length of processed rebar to Case C should be avoided in general construction projects.
4.4. Discussion
The results of the case study for five construction projects, which include 27 structures, are as follows. In the case of the beam member, when the length of processed rebar is not simplified (unrefined case), the average amount of rebar materials per unit area is 0.0110 t/m2, and the deviation is 0.0116 t/m2. For each case, the amounts of rebar increase for the simplified length of processed rebar are as follows:
- Case A: average +0.62%, deviation 0.17%;
- Case B: average +1.09%, deviation 0.33%; and
- Case C: average +3.49% deviation 0.96%.
In addition, the average number of LPRS per unit area of the unrefined case is 0.49 units/m2, and the deviation is 0.33 units/m2. The ratio of the number of rebar LPRS de-creased for each case is as follows:
- Case A: average –25.54%, deviation 14.84%;
- Case B: average –37.79%, deviation 15.34%; and
- Case C: average −45.26%, deviation 14.80%.
In case C, on average, the increasing rate in the amount of rebar compared to case A and case B was large, so if the decreasing rate of the number of LPRS was not significantly large, it was reasoned that selection should be avoided in terms of cost. In addition, the average value of the standard deviation of LPRS for the three cases is 14.99%, and there is no significant difference from each other, even though only 27 sets of data were used in this study. Therefore, even if the sample data are added for each case, it is considered that the LPRS-related result values will not change significantly.
In this study, the slabs were divided into regular and irregular according to shape. When the length of processed rebar was simplified, reducing the number of LPRS for irregular slabs is more efficient as compared to regular slabs (cases A, B, and C for irregular slabs were reduced by 18.5%p, 16.7%p, and 14.3%p more than regular, respectively).
The existing studies have limitations in that work efficiency or LPRS were not considered together with minimizing the waste of rebar, and almost all of them were difficult to apply to the factory processing method. On the other hand, in this study, a more practical analysis was conducted by simultaneously considering the simplification of the length of rebar related to work efficiency and the amount of rebar materials that fluctuated accordingly. The results of this study are expected to contribute to preventing material costs from increasing excessively by quantitatively analyzing the impact level of simplification on the amount of rebar materials and LPRS. In particular, it is considered that it can be useful for construction projects, to which the factory processing method of rebars is applied.
Even though the analysis on the simplification of the length of rebar was conducted in this study, it cannot be said that optimization was performed. For instance, the work efficiency that fluctuated according to the number of LPRS can be converted into labor costs. Similarly, the quantity of rebar materials can be converted into material costs. Likewise, both costs of this inverse relationship are integrated in terms of cost and can be used to derive an optimal simulation of the length of rebars. Therefore, in future studies, the optimization of simplifying the rebar length will be conducted to minimize overall construction costs.
5. Conclusions
Although several studies have been conducted to minimize the waste of rebar using 3D BIM-based QTO, it was not considered together with work efficiency or LPRS, which can be fluctuated accordingly. On the other hand, this study considered the simplification of the length of rebar related to work efficiency together with the amount of required rebar materials that fluctuated accordingly. Additionally, this study differs from previous studies in that it analyzes the effect of the simplification of the length of processed rebar in rebar construction based on factory processing.
Considering the research questions, the simplification test conducted in this study, in each case by dividing the calibrated length into Case A, Case B, and Case C, analyzed the increase in the amounts of rebar materials and the decrease in the number of LPRS due to the simplification method. As a result of the study, the change in the amount of rebar and the number of LPRS, according to the cases of the simplified method, was analyzed. Furthermore, in the case of Case C, it was confirmed that the amounts of increased rebar were relatively large compared to the degree to which the number of LPRS decreased. It was considered that simplifying the length based on Case C in the average domestic rebar construction should be avoided in terms of cost. In this study, through correlation analysis, the total amount of rebar calculated from each member (wall, beam, and slab) demonstrated a high positive correlation with the total floor area of the building. Conversely, the change in the amount of rebar and number of LPRS as the length of processed rebar simplified exhibited a low linear correlation with the total floor area.
The results of this study can contribute to preventing material cost from increasing excessively by quantitatively analyzing the impact level of simplification on the amount of rebar materials and LPRS. Further, the results of this study can be used as an indicator to predict 3D BIM-based QTO changes when the simplified length of the processed rebar is applied in practice to future construction projects.
Author Contributions
Conceptualization, U.-Y.P.; Methodology, H.C.; Formal analysis, W.K.; Resources, C.K.K.; Data curation, H.K.; Writing—original draft, W.K.; Writing—review & editing, W.K. and H.A.; Supervision, H.C. All authors have read and agreed to the published version of the manuscript.
Funding
This work is supported by the Korea Agency for Infrastructure Technology Advancemen (KAIA) grant funded by the Ministry of Land, Infrastructure and Transport (Grant 23ORPS-B158109-04 and 23AATD-C163269-03).
Institutional Review Board Statement
Not applicable.
Informed Consent Statement
Not applicable.
Data Availability Statement
The data that has been used is confidential.
Conflicts of Interest
The authors declare no conflict of interest.
Appendix A
Table A1.
Overview of Construction Project A.
Table A1.
Overview of Construction Project A.
| Project Name | Apartment Construction in Daegu (Project A) | ||
|---|---|---|---|
| Structure | Reinforced Concrete(RC) | ||
| Site Area | 12,204.80 m2 | Building Area | 3027.85 m2 |
| Building Coverage | 29.8381% | Floor Area Ratio | 279.0116% |
| Total Floor Area | Ground Floor | 28,312.98 m2 | |
| Basement Floor | 13,606.12 m2 | ||
| Total | 41,919.10 m2 | ||
| Overviews by Buildings | |||
| Building No. | Number of Floors | Floor Area | |
| Apartment | 101 | 29F/B2 | 18,290.23 m2 |
| 102 | 24F/B2 | 8231.75 m2 | |
| NeighborhoodLiving Facilities | #1 | 1F | 816.62 m2 |
| #2 | 1F | 335.88 m2 | |
| #3 | 1F | 173.05 m2 | |
| Security Office | 1F | 30.59 m2 | |
| Underground Parking Lot | B2 | 11,897.87 m2 | |
Table A2.
Overview of Construction Project B.
Table A2.
Overview of Construction Project B.
| Project Name | Apartment and Office Construction in Daegu (Project B) | ||
|---|---|---|---|
| Structure | Reinforced Concrete(RC) Bearing Wall + Rigid Frames Structure | ||
| Site Area | 3323.40 m2 | Building Area | 1968.55 m2 |
| Building Coverage | 61.8885% | Floor Area Ratio | 621.9575% |
| Total Floor Area | Ground Floor | 20,549.00 m2 | |
| Basement Floor | 9685.95 m2 | ||
| Total | 30,234.95 m2 | ||
| Overviews by Buildings | |||
| Building No. | Number of Floors | Floor Area | |
| Apartment& Office | 101 | 25F/B1 | 9017.67 m2 |
| 102 | 25F/B1 | 9018.27 m2 | |
| Underground Parking Lot | B2 | 7832.88 m2 | |
Table A3.
Overview of Construction Project C.
Table A3.
Overview of Construction Project C.
| Project Name | Apartment Construction in Dongducheon (Project C) | ||
|---|---|---|---|
| Structure | Reinforced Concrete(RC) Bearing Wall Structure | ||
| Site Area | 16,074.80 m2 | Building Area | 3519.54 m2 |
| Building Coverage | 21.8900% | Floor Area Ratio | 219.6800% |
| Total Floor Area | Ground Floor | 35,312.69 m2 | |
| Basement Floor | 11,780.89 m2 | ||
| Total | 47,093.58 m2 | ||
| Overviews by Buildings | |||
| Building No. | Number of Floors | Floor Area | |
| Apartment | 101 | 18F/B1 | 7143.66 m2 |
| 102 | 20F/B1 | 8667.11 m2 | |
| 103 | 16F/B1 | 6354.38 m2 | |
| 104 | 20F/B1 | 8449.42 m2 | |
| 105 | 20F/B1 | 4243.55 m2 | |
| Security Office | 1F | 184.44 m2 | |
| Underground Parking Lot | B2 | 10,615.60 m2 | |
Table A4.
Overview of Construction Project G.
Table A4.
Overview of Construction Project G.
| Project Name | Apartment Construction in Yeoju (Project G) | ||
|---|---|---|---|
| Structure | Reinforced Concrete(RC) | ||
| Site Area | 29,218.00 m2 | Building Area | 3625.05 m2 |
| Building Coverage | 18.3900% | Floor Area Ratio | 201.7900% |
| Total Floor Area | Ground Floor | 39,786.04 m2 | |
| Basement Floor | 17,783.74 m2 | ||
| Total | 57,569.78 m2 | ||
| Overviews by Buildings | |||
| Building No. | Number of Floors | Floor Area | |
| Apartment | 101 | 20F | 3373.78 m2 |
| 102 | 17F | 6010.21 m2 | |
| 103 | 15F | 6278.95 m2 | |
| 104 | 15F | 6125.56 m2 | |
| 105 | 20F | 10,517.40 m2 | |
| 106 | 20F | 7054.76 m2 | |
| Security Office | 1F | 146.18 m2 | |
| Underground Parking Lot | B2 | 16,286.50 m2 | |
Table A5.
Overview of Construction Project H.
Table A5.
Overview of Construction Project H.
| Project Name | Mixed-use Apartment Construction in Icheon (Project H) | ||
|---|---|---|---|
| Structure | Reinforced Concrete(RC) | ||
| Site Area | 5572.00 m2 | Building Area | 4423.20 m2 |
| Building Coverage | 79.3826% | Floor Area Ratio | 1285.0280% |
| Total Floor Area | Ground Floor | 71,879.96 m2 | |
| Basement Floor | 33,793.72 m2 | ||
| Total | 105,673.68 m2 | ||
| Overviews by Buildings | |||
| Building No. | Number of Floors | Floor Area | |
| Mixed-useApartment | 1BL | 49F/B8 | 51,912.30 m2 |
| 2BL | 49F/B8 | 51,935.78 m2 | |
Table A6.
Amounts of Rebar Materials for Beam Members and Differentials by Cases.
Table A6.
Amounts of Rebar Materials for Beam Members and Differentials by Cases.
| Building No. | Amount of Rebar Material (Ton) | ||||||||
|---|---|---|---|---|---|---|---|---|---|
| Unrefined | Case A | Case B | Case C | ||||||
| Val. | Diff. | Val. | Diff. | Val. | Diff. | ||||
| Project A | Apartment | 101 | 67.97 | 68.47 | +0.74% | 69.18 | +1.05% | 70.23 | +3.33% |
| 102 | 70.35 | 70.79 | +0.63% | 71.43 | +0.90% | 72.62 | +3.22% | ||
| Security Office | 0.556 | 0.559 | +0.54% | 0.565 | +1.00% | 0.574 | +3.12% | ||
| Neighborhood Living Facilities | #1 | 25.14 | 25.23 | +0.37% | 25.39 | +0.63% | 25.63 | +1.96% | |
| #2 | 2.53 | 2.54 | +0.40% | 2.57 | +1.08% | 2.59 | +2.50% | ||
| #3 | 1.89 | 1.89 | +0.46% | 1.91 | +0.86% | 1.93 | +2.56% | ||
| Underground Parking Lot | 44.45 | 44.63 | +0.41% | 44.90 | +0.59% | 45.30 | +1.93% | ||
| Project B | Apartment & Office | 101 | 14.00 | 14.13 | +0.93% | 14.30 | +1.22% | 14.63 | +4.46% |
| 102 | 13.99 | 14.12 | +0.93% | 14.29 | +1.22% | 14.61 | +4.49% | ||
| Underground Parking Lot | 239.96 | 241.16 | +0.50% | 243.21 | +0.85% | 246.00 | +2.52% | ||
| Project C | Apartment | 101 | 52.83 | 53.16 | +0.62% | 53.87 | +1.40% | 54.94 | +3.99% |
| 102 | 51.43 | 51.75 | +0.63% | 52.49 | +1.45% | 53.56 | +4.14% | ||
| 103 | 45.25 | 45.49 | +0.54% | 46.01 | +1.20% | 46.85 | +3.54% | ||
| 104 | 52.19 | 52.62 | +0.83% | 53.38 | +1.51% | 54.46 | +4.35% | ||
| 105 | 25.81 | 25.96 | +0.61% | 26.29 | +1.32% | 26.83 | +3.98% | ||
| Security Office | 0.953 | 0.958 | +0.46% | 0.965 | +0.76% | 0.981 | +2.93% | ||
| Underground Parking Lot | 590.33 | 593.55 | +0.54% | 598.53 | +0.84% | 605.38 | +2.55% | ||
| Project G | Apartment | 101 | 14.43 | 14.56 | +0.87% | 14.77 | +1.46% | 15.18 | +5.20% |
| 102 | 22.45 | 22.65 | +0.89% | 22.97 | +1.46% | 23.44 | +4.41% | ||
| 103 | 22.48 | 22.66 | +0.80% | 22.96 | +1.37% | 23.57 | +4.85% | ||
| 104 | 35.73 | 35.99 | +0.71% | 36.30 | +0.87% | 37.08 | +3.76% | ||
| 105 | 56.66 | 57.03 | +0.66% | 57.67 | +1.16% | 58.74 | +3.68% | ||
| 106 | 62.53 | 62.85 | +0.52% | 63.37 | +0.82% | 64.34 | +2.90% | ||
| Security Office | 0.461 | 0.462 | +0.38% | 0.465 | +0.54% | 0.471 | +2.28% | ||
| Underground Parking Lot | 336.60 | 337.92 | +0.39% | 340.29 | +0.70% | 343.83 | +2.15% | ||
| Project H | Mixed-use Apartment | 1BL | 795.51 | 801.30 | +0.73% | 814.05 | +1.59% | 831.83 | +4.57% |
| 2BL | 788.74 | 794.58 | +0.74% | 808.16 | +1.71% | 826.47 | +4.78% | ||
Table A7.
Numbers of LPRS for Slab Members and Differentials by Cases.
Table A7.
Numbers of LPRS for Slab Members and Differentials by Cases.
| Building No. | Types of Rebar Lengths (Unit(s)) | ||||||||
|---|---|---|---|---|---|---|---|---|---|
| Unrefined | Case A | Case B | Case C | ||||||
| Val. | Diff. | Val. | Diff. | Val. | Diff. | ||||
| Project A | Apartment | 101 | 802 | 797 | −0.62% | 783 | −2.37% | 730 | −8.98% |
| 102 | 595 | 583 | −2.02% | 568 | −4.54% | 527 | −11.43% | ||
| Security Office | 13 | 13 | - | 13 | - | 13 | - | ||
| Neighborhood Living Facilities | #1 | 166 | 130 | −21.69% | 106 | −36.14% | 80 | −51.81% | |
| #2 | 38 | 32 | −15.79% | 28 | −26.32% | 27 | −28.95% | ||
| #3 | 26 | 26 | - | 24 | −7.69% | 21 | −19.23% | ||
| Underground Parking Lot | 183 | 169 | −7.65% | 153 | −16.39% | 131 | −28.42% | ||
| Project B | Apartment & Office | 101 | 309 | 307 | −0.65% | 305 | −1.29% | 301 | −2.59% |
| 102 | 306 | 304 | −0.65% | 302 | −1.31% | 298 | −2.61% | ||
| Underground Parking Lot | 1044 | 691 | −33.81% | 540 | −48.28% | 444 | −57.47% | ||
| Project C | Apartment | 101 | 394 | 373 | −5.33% | 363 | −7.87% | 349 | −11.42% |
| 102 | 360 | 347 | −3.61% | 339 | −5.83% | 329 | −8.61% | ||
| 103 | 333 | 322 | −3.30% | 309 | −7.21% | 296 | −11.11% | ||
| 104 | 307 | 294 | −4.23% | 284 | −7.49% | 276 | −10.10% | ||
| 105 | 313 | 311 | −0.64% | 305 | −2.56% | 297 | −5.11% | ||
| Security Office | 6 | 6 | - | 6 | - | 6 | - | ||
| Underground Parking Lot | 718 | 315 | −56.13% | 216 | −69.92% | 165 | −77.02% | ||
| Project G | Apartment | 101 | 478 | 478 | - | 474 | −0.84% | 474 | −0.84% |
| 102 | 584 | 569 | −2.57% | 566 | −3.08% | 548 | −6.16% | ||
| 103 | 400 | 395 | −1.25% | 390 | −2.50% | 386 | −3.50% | ||
| 104 | 417 | 409 | −1.92% | 399 | −4.32% | 384 | −7.91% | ||
| 105 | 775 | 742 | −4.26% | 722 | −6.84% | 700 | −9.68% | ||
| 106 | 695 | 674 | −3.02% | 656 | −5.61% | 635 | −8.63% | ||
| Security Office | 4 | 4 | - | 4 | - | 4 | - | ||
| Underground Parking Lot | 1183 | 391 | −66.95% | 252 | −78.70% | 202 | −82.92% | ||
| Project H | Mixed-use Apartment | 1BL | 7622 | 6192 | −18.76% | 5235 | −31.32% | 4485 | −41.16% |
| 2BL | 7562 | 6112 | −19.17% | 5181 | −31.49% | 4437 | −41.33% | ||
Table A8.
Amounts of Rebar Materials for Slab Members and Differentials by Cases.
Table A8.
Amounts of Rebar Materials for Slab Members and Differentials by Cases.
| Building No. | Amount of Rebar Material (Ton) | ||||||||
|---|---|---|---|---|---|---|---|---|---|
| Unrefined | Case A | Case B | Case C | ||||||
| Val. | Diff. | Val. | Diff. | Val. | Diff. | ||||
| Project A | Apartment | 101 | 290.79 | 291.77 | +0.34% | 293.56 | +0.95% | 295.53 | +1.63% |
| 102 | 131.36 | 131.87 | +0.39% | 132.65 | +0.98% | 133.71 | +1.79% | ||
| Security Office | 0.519 | 0.524 | +0.99% | 0.524 | +0.99% | 0.535 | +3.19% | ||
| Neighborhood Living Facilities | #1 | 9.62 | 9.64 | +0.20% | 9.67 | +0.54% | 9.71 | +0.91% | |
| #2 | 16.03 | 16.11 | +0.50% | 16.19 | +0.96% | 16.34 | +1.93% | ||
| #3 | 4.32 | 4.33 | +0.29% | 4.36 | +0.94% | 4.37 | +1.17% | ||
| Underground Parking Lot | 346.57 | 347.17 | +0.17% | 348.22 | +0.48% | 350.25 | +1.06% | ||
| Project B | Apartment & Office | 101 | 146.29 | 146.81 | +0.36% | 147.73 | +0.99% | 148.62 | +1.59% |
| 102 | 145.85 | 146.37 | +0.36% | 147.29 | +0.99% | 148.16 | +1.58% | ||
| Underground Parking Lot | 223.40 | 223.83 | +0.19% | 224.60 | +0.53% | 225.83 | +1.09% | ||
| Project C | Apartment | 101 | 142.11 | 142.63 | +0.37% | 143.62 | +1.06% | 145.24 | +2.20% |
| 102 | 166.08 | 166.70 | +0.38% | 167.78 | +1.03% | 169.85 | +2.27% | ||
| 103 | 128.60 | 129.07 | +0.37% | 129.96 | +1.06% | 131.49 | +2.25% | ||
| 104 | 162.25 | 162.86 | +0.37% | 163.89 | +1.01% | 165.72 | +2.14% | ||
| 105 | 83.89 | 84.19 | +0.36% | 84.74 | +1.01% | 85.76 | +2.23% | ||
| Security Office | 0.318 | 0.319 | +0.23% | 0.324 | +1.78% | 0.329 | +3.33% | ||
| Underground Parking Lot | 43.59 | 43.69 | +0.23% | 43.89 | +0.69% | 44.16 | +1.29% | ||
| Project G | Apartment | 101 | 49.59 | 49.83 | +0.49% | 50.14 | +1.10% | 50.86 | +2.55% |
| 102 | 91.06 | 91.42 | +0.40% | 92.06 | +1.10% | 93.15 | +2.30% | ||
| 103 | 107.40 | 107.83 | +0.40% | 108.56 | +1.07% | 109.71 | +2.14% | ||
| 104 | 102.56 | 102.92 | +0.36% | 103.51 | +0.93% | 104.70 | +2.09% | ||
| 105 | 165.16 | 165.84 | +0.41% | 166.93 | +1.07% | 169.01 | +2.33% | ||
| 106 | 112.39 | 112.84 | +0.40% | 113.58 | +1.05% | 114.93 | +2.26% | ||
| Security Office | 0.466 | 0.469 | +0.56% | 0.476 | +2.20% | 0.488 | +4.69% | ||
| Underground Parking Lot | 128.73 | 129.04 | +0.24% | 129.63 | +0.69% | 130.57 | +1.43% | ||
| Project H | Mixed-use Apartment | 1BL | 806.59 | 808.62 | +0.25% | 810.66 | +0.50% | 816.58 | +1.24% |
| 2BL | 806.92 | 808.94 | +0.25% | 811.05 | +0.51% | 816.89 | +1.24% | ||
Table A9.
Numbers of Rebar LPRS for Slab Members and Differentials by Cases.
Table A9.
Numbers of Rebar LPRS for Slab Members and Differentials by Cases.
| Building No. | Types of Rebar Lengths (EA) | ||||||||
|---|---|---|---|---|---|---|---|---|---|
| Unrefined | Case A | Case B | Case C | ||||||
| Val. | Diff. | Val. | Diff. | Val. | Diff. | ||||
| Project A | Apartment | 101 | 4224 | 3645 | −13.71% | 2932 | −30.59% | 2421 | −42.68% |
| 102 | 3460 | 2543 | −26.50% | 2055 | −40.61% | 1739 | −49.74% | ||
| Security Office | 38 | 38 | - | 38 | - | 36 | −5.26% | ||
| Neighborhood Living Facilities | #1 | 162 | 129 | −20.37% | 92 | −43.21% | 72 | −55.56% | |
| #2 | 471 | 304 | −35.46% | 232 | −50.74% | 196 | −58.39% | ||
| #3 | 119 | 99 | −16.81% | 77 | −35.29% | 65 | −45.38% | ||
| Underground Parking Lot | 2313 | 1475 | −36.23% | 1128 | −51.23% | 948 | −59.01% | ||
| Project B | Apartment & Office | 101 | 7907 | 5553 | −29.77% | 4700 | −40.56% | 4108 | −48.05% |
| 102 | 7874 | 5521 | −29.88% | 4681 | −40.55% | 4081 | −48.17% | ||
| Underground Parking Lot | 3664 | 1745 | −52.37% | 1439 | −60.73% | 1288 | −64.85% | ||
| Project C | Apartment | 101 | 2033 | 1827 | −10.13% | 1594 | −21.59% | 1395 | −31.38% |
| 102 | 2211 | 1938 | −12.35% | 1637 | −25.96% | 1459 | −34.01% | ||
| 103 | 1903 | 1617 | −15.03% | 1396 | −26.64% | 1199 | −36.99% | ||
| 104 | 3692 | 2884 | −21.89% | 2440 | −33.91% | 2171 | −41.20% | ||
| 105 | 1969 | 1773 | −9.95% | 1546 | −21.48% | 1376 | −30.12% | ||
| Security Office | 31 | 31 | - | 29 | −6.45% | 27 | −12.90% | ||
| Underground Parking Lot | 1021 | 503 | −50.73% | 381 | −62.68% | 328 | −67.87% | ||
| Project G | Apartment | 101 | 1293 | 1135 | −12.22% | 984 | −23.90% | 884 | −31.63% |
| 102 | 1791 | 1427 | −20.32% | 1107 | −38.19% | 949 | −47.01% | ||
| 103 | 4124 | 2170 | −47.38% | 1734 | −57.95% | 1478 | −64.16% | ||
| 104 | 5179 | 3529 | −31.86% | 2886 | −44.27% | 2626 | −49.30% | ||
| 105 | 7678 | 4686 | −38.97% | 3953 | −48.52% | 3564 | −53.58% | ||
| 106 | 4994 | 3576 | −28.39% | 3092 | −38.09% | 2861 | −42.71% | ||
| Security Office | 45 | 40 | −11.11% | 33 | −26.67% | 30 | −33.33% | ||
| Underground Parking Lot | 5750 | 2641 | −54.07% | 2231 | −61.20% | 2085 | −63.74% | ||
| Project H | Mixed-use Apartment | 1BL | 11,781 | 8163 | −30.71% | 6693 | −43.19% | 5746 | −51.23% |
| 2BL | 11,908 | 7950 | −33.24% | 6410 | −46.17% | 5518 | −53.66% | ||
Table A10.
Amounts of Rebar Materials for Basement Members and Differentials by Cases.
Table A10.
Amounts of Rebar Materials for Basement Members and Differentials by Cases.
| Building No. | Amount of Rebar Material (Ton) | ||||||||
|---|---|---|---|---|---|---|---|---|---|
| Unrefined | Case A | Case B | Case C | ||||||
| Val. | Diff. | Val. | Diff. | Val. | Diff. | ||||
| Project A | Apartment | 101 | 65.36 | 65.48 | +0.18% | 65.48 | +0.18% | 65.65 | +0.45% |
| 102 | 35.11 | 35.18 | +0.20% | 35.18 | +0.20% | 35.37 | +0.74% | ||
| Underground Parking Lot | 154.79 | 155.19 | +0.26% | 155.88 | +0.70% | 156.84 | +1.32% | ||
| Project B | Underground Parking Lot | 258.70 | 258.95 | +0.10% | 259.62 | +0.36% | 260.16 | +0.56% | |
| Project C | Apartment | 101 | 57.78 | 57.92 | +0.24% | 58.10 | +0.56% | 58.43 | +1.13% |
| 102 | 58.25 | 58.39 | +0.24% | 58.59 | +0.57% | 58.94 | +1.18% | ||
| 103 | 64.44 | 64.59 | +0.23% | 64.85 | +0.64% | 65.19 | +1.15% | ||
| 104 | 63.33 | 63.47 | +0.22% | 63.72 | +0.62% | 64.20 | +1.38% | ||
| 105 | 33.04 | 33.16 | +0.34% | 33.31 | +0.81% | 33.51 | +1.40% | ||
| Security Office | 0.21 | 0.21 | +0.39% | 0.22 | +1.04% | 0.22 | +2.34% | ||
| Underground Parking Lot | 340.08 | 340.54 | +0.13% | 341.49 | +0.41% | 342.80 | +0.80% | ||
| Project G | Apartment | 101 | 11.08 | 11.11 | +0.30% | 11.18 | +0.86% | 11.25 | +1.53% |
| 102 | 24.29 | 24.33 | +0.17% | 24.42 | +0.56% | 24.56 | +1.11% | ||
| 103 | 29.54 | 29.59 | +0.15% | 29.72 | +0.61% | 29.86 | +1.07% | ||
| 104 | 29.75 | 29.80 | +0.15% | 29.89 | +0.46% | 30.02 | +0.92% | ||
| 105 | 38.51 | 38.61 | +0.27% | 38.75 | +0.63% | 39.07 | +1.46% | ||
| 106 | 28.61 | 28.67 | +0.20% | 28.76 | +0.50% | 28.89 | +0.98% | ||
| Security Office | 2.02 | 2.03 | +0.57% | 2.04 | +0.92% | 2.08 | +2.69% | ||
| Underground Parking Lot | 304.11 | 304.51 | +0.13% | 305.21 | +0.36% | 306.27 | +0.71% | ||
| Project H | Mixed-use Apartment | 1BL | 376.88 | 377.41 | +0.14% | 378.30 | +0.38% | 379.73 | +0.76% |
| 2BL | 375.24 | 375.77 | +0.14% | 376.67 | +0.38% | 377.72 | +0.66% | ||
Table A11.
Amounts of Rebar Materials for Stairwell Members and Differentials by Cases.
Table A11.
Amounts of Rebar Materials for Stairwell Members and Differentials by Cases.
| Building No. | Amount of Rebar Material (Ton) | ||||||||
|---|---|---|---|---|---|---|---|---|---|
| Unrefined | Case A | Case B | Case C | ||||||
| Val. | Diff. | Val. | Diff. | Val. | Diff. | ||||
| Project A | Apartment | 101 | 13.08 | 13.41 | +2.53% | 13.47 | +2.99% | 13.23 | +1.15% |
| 102 | 5.65 | 5.84 | +3.32% | 5.85 | +3.49% | 5.70 | +0.74% | ||
| Neighborhood Living Facilities | #1 | 0.45 | 0.45 | +1.27% | 0.45 | +1.27% | 0.46 | +3.83% | |
| Underground Parking Lot | 0.79 | 0.79 | +0.34% | 0.79 | +0.54% | 0.80 | +1.22% | ||
| Project B | Apartment & Office | 101 | 7.11 | 7.17 | +0.85% | 7.21 | +1.41% | 7.21 | +1.41% |
| 102 | 7.11 | 7.17 | +0.85% | 7.21 | +1.41% | 7.21 | +1.41% | ||
| Underground Parking Lot | 7.91 | 7.94 | +0.45% | 8.01 | +1.25% | 8.01 | +1.25% | ||
| Project C | Apartment | 101 | 18.23 | 18.28 | +0.24% | 18.49 | +1.40% | 18.69 | +2.53% |
| 102 | 21.32 | 21.37 | +0.24% | 21.62 | +1.40% | 21.86 | +2.55% | ||
| 103 | 16.23 | 16.26 | +0.22% | 16.45 | +1.38% | 16.63 | +2.50% | ||
| 104 | 19.38 | 19.43 | +0.25% | 19.59 | +1.09% | 19.79 | +2.11% | ||
| 105 | 10.15 | 10.18 | +0.24% | 10.30 | +1.42% | 10.41 | +2.57% | ||
| Underground Parking Lot | 0.54 | 0.55 | +0.18% | 0.55 | +0.84% | 0.55 | +1.25% | ||
| Project G | Apartment | 101 | 10.25 | 10.29 | +0.41% | 10.39 | +1.37% | 10.61 | +3.50% |
| 102 | 16.22 | 16.32 | +0.61% | 16.58 | +2.19% | 16.69 | +2.89% | ||
| 103 | 14.57 | 14.66 | +0.60% | 14.88 | +2.14% | 14.99 | +2.86% | ||
| 104 | 13.95 | 14.02 | +0.55% | 14.20 | +1.81% | 14.30 | +2.50% | ||
| 105 | 28.43 | 28.59 | +0.56% | 28.99 | +1.96% | 29.30 | +3.06% | ||
| 106 | 18.65 | 18.76 | +0.63% | 19.07 | +2.25% | 19.18 | +2.86% | ||
| Underground Parking Lot | 3.11 | 3.12 | +0.27% | 3.14 | +0.93% | 3.14 | +1.04% | ||
| Project H | Mixed-use Apartment | 1BL | 31.49 | 31.59 | +0.29% | 31.70 | +0.66% | 31.84 | +1.11% |
| 2BL | 31.18 | 31.27 | +0.31% | 31.41 | +0.76% | 31.58 | +1.29% | ||
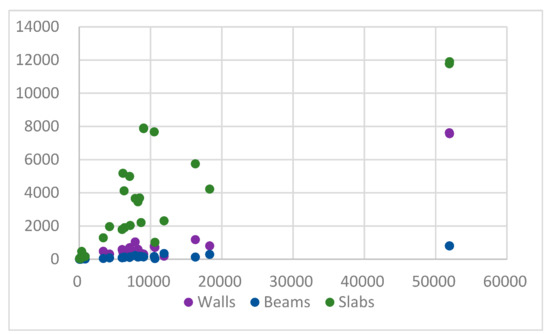
Figure A1.
Distributions of the amounts of rebar by total floor areas by members.
Figure A1.
Distributions of the amounts of rebar by total floor areas by members.
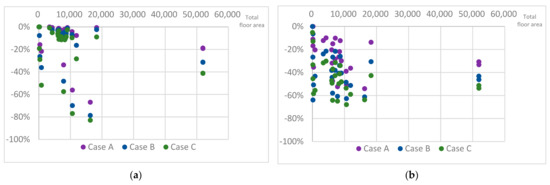
Figure A2.
Distributions of reduction rates for: (a) the number of LPRS by total floor area by cases for beam member; (b) also for slab members.
Figure A2.
Distributions of reduction rates for: (a) the number of LPRS by total floor area by cases for beam member; (b) also for slab members.

References
- Cho, H.-H.; Kang, T.-K.; Park, H.-Y.; Yun, S.-H.; Hur, Y.-K.; Park, U.-Y. Analysis of re-bar manufacturing system in plant and its facilitate method. Korean J. Constr. Eng. Manag. 2007, 8, 57–65. [Google Scholar]
- Mun, J.-M.; Kim, C.-D. Productivity Improvement through the Waste Elimination of Construction Process. Korean J. Constr. Eng. Manag. 2002, 3, 93–103. [Google Scholar]
- Lien, L.C.; Zhang, P.C.; Chen, S.B.; Liao, Z.C.; Liu, Y.N. Study on BIM family self-create for steel reinforcing bar detail construction design and information extraction. In Proceedings of the 34th International Symposium on Automation and Robotics in Construction—ISARC 2017, Taipei, Taiwan, 28 June–1 July 2017; pp. 430–436. [Google Scholar] [CrossRef]
- Jarkas, A.M. Influence of Buildability Factors on Rebar Installation Labor Productivity of Columns. J. Constr. Eng. Manag. 2012, 138, 258–267. [Google Scholar] [CrossRef]
- Momeni, M.; Relefors, J.; Pettersson, L.; Papadopoulos, A.V.; Nolte, T. On the Bar Installation Order for the Automated Fabrication of Rebar Cages. In Proceedings of the International Symposium on Automation and Robotics in Construction, Bogotá, Colombia, 13–15 July 2022; pp. 508–511. [Google Scholar] [CrossRef]
- Liu, H.; Lu, M.; Al-Hussein, M. Ontology-Based Semantic Approach for Construction-Oriented Quantity Take-off from BIM Models in the Light-Frame Building Industry. Adv. Eng. Inform. 2016, 30, 190–207. [Google Scholar] [CrossRef]
- Tran, T.A.; Park, J.Y. Development of Integrated Design Methodology for Various Types of Product—Service Systems. J. Comput. Des. Eng. 2014, 1, 37–47. [Google Scholar] [CrossRef]
- Tiwari, S.; Odelson, J.; Watt, A.; Khanzode, A.; Model Based Estimating to Inform Target Value Design. “AECBytes” Building the Future. 2009. Available online: http://www.aecbytes.com/ (accessed on 18 January 2023).
- O’Connor, J.T.; Rusch, S.E.; Schulz, M.J. Constructability Concepts for Engineering and Procurement. J. Constr. Eng. Manag. 1987, 113, 235–248. [Google Scholar] [CrossRef]
- Alshawi, M.; Underwood, J. Improving the Constructability of Design Solutions through an Integrated System. Eng. Constr. Archit. Manag. 1996, 3, 47–67. [Google Scholar] [CrossRef]
- Ministry of Trade, Industry and Energy. Price Trend of Steel Raw Materials 2022; Ministry of Trade, Industry and Energy: Sejong, Republic of Korea, 2022. [Google Scholar]
- Pratoom, W.; Tangwiboonpanich, S. A Comparison of Rebar Quantities Obtained by Traditional vs BIM-based Methods. Suranaree J. Sci. Technol. 2016, 23, 5–10. [Google Scholar]
- Jo, Y.-H.; Yun, S.-H. A Study on the Simplification of Quantity Calculation of Reinforcing Bar. J. Korea Inst. Build. Constr. 2019, 19, 521–527. [Google Scholar] [CrossRef]
- Park, H.-Y.; Lee, S.-H.; Kang, T.-K.; Lee, Y.-S. Developing an Automatic System for Making a Placing Drawing and Quantity taking-off Cut and Bent Re Bar with Work Zone Information. J. Korea Inst. Build. Constr. 2008, 8, 63–70. [Google Scholar] [CrossRef]
- Lee, J.-C. A Study on the Effective Calculation of Rebar QTO in the Early Design Phase through the Application of BIM Model. J. Archit. Inst. Korea Struct. Constr. 2019, 35, 145–152. [Google Scholar] [CrossRef]
- Kim, D.; Lim, C.; Liu, Y.; Kim, S. Automatic Estimation System of Building Frames with Integrated Structural Design Information (AutoES). Iran. J. Sci. Technol. Trans. Civ. Eng. 2020, 44, 1145–1157. [Google Scholar] [CrossRef]
- Khosakitchalert, C.; Yabuki, N.; Fukuda, T. Improving the Accuracy of BIM-Based Quantity Takeoff for Compound Elements. Autom. Constr. 2019, 106, 102891. [Google Scholar] [CrossRef]
- Rahimi, Z.; Maghrebi, M. Minimizing Rebar Cost Using Design and Construction Integration. Autom. Constr. 2023, 147, 104701. [Google Scholar] [CrossRef]
- Khondoker, M.T.H. Automated Reinforcement Trim Waste Optimization in RC Frame Structures Using Building Information Modeling and Mixed-Integer Linear Programming. Autom. Constr. 2021, 124, 103599. [Google Scholar] [CrossRef]
- Zheng, C.; Yi, C.; Lu, M. Integrated Optimization of Rebar Detailing Design and Installation Planning for Waste Reduction and Productivity Improvement. Autom. Constr. 2019, 101, 32–47. [Google Scholar] [CrossRef]
- Ministry of Land, Infrastructure and Transport. Design Criteria for Concrete Structures (KDS 14 20 00); Ministry of Land, Infrastructure and Transport: Sejong, Republic of Korea, 2022. [Google Scholar]
- Ministry of Land, Infrastructure and Transport. Standard Specification for Concrete Structures (KCS 14 20 00); Ministry of Land, Infrastructure and Transport: Sejong, Republic of Korea, 2022. [Google Scholar]
- Han, S.W.; Oh, Y.H.; Lee, L.H. Structural Performance of Shear Wall with Sectional Shape in Wall-Type Apartment Building. J. Korea Concr. Inst. 2000, 12, 3–14. [Google Scholar]
- Lee, M.-J.; Park, B.-J.; Im, K.-S. A Study on the Estimation of Change Orders Impact for the Public Construction. KSCE J. Civ. Environ. Eng. Res. 2008, 28, 363–369. [Google Scholar]
- Gogtay, N.; Thatte, U. Principles of Correlation Analysis. J. Assoc. Physicians India 2017, 65, 78–81. [Google Scholar] [PubMed]


Disclaimer/Publisher’s Note: The statements, opinions and data contained in all publications are solely those of the individual author(s) and contributor(s) and not of MDPI and/or the editor(s). MDPI and/or the editor(s) disclaim responsibility for any injury to people or property resulting from any ideas, methods, instructions or products referred to in the content. |
© 2023 by the authors. Licensee MDPI, Basel, Switzerland. This article is an open access article distributed under the terms and conditions of the Creative Commons Attribution (CC BY) license (https://creativecommons.org/licenses/by/4.0/).