Abstract
Casing is one of the most important components of an aircraft engine. However, due to its thin wall thickness and difficult-to-cut materials, it is difficult to process with a conventional mechanical method. Counter-rotating electrochemical machining (CRECM) is a special electrochemical machining method, which is very suitable for machining aircraft engine casing parts. However, for the convex structure with large surface height and a complex shape of the casing, is sometimes difficult for CRECM to obtain the desired design accuracy. Local electrochemical machining is proposed under this background, which is used for after-machining of the pre-shaped convex structure by CRECM. In order to predict the local electrochemical machining result accurately and improve the machining precision, this paper establishes a multi-physical field coupling simulation model of the local electrochemical machining considering the influence of gas–liquid two-phase flow and temperature field. The influence of a gas–liquid two-phase flow field and temperature field on the conductivity distribution were simulated and analyzed, the reason for simulation error with pure electric field and the influence of cathode end width L on machining accuracy was analyzed, and it was found that the gas–liquid two-phase flow field played a major role in the simulation results of local electrochemical machining. The experimental results show that there is a significant error between the pure electric field simulation results and the experimental results, and the multi-physical field coupling simulation results are basically consistent with the experimental results. The multi-physical field coupling simulation can predict the results of local electrochemical machining with high accuracy and has important significance for improving the precision of local electrochemical machining.
1. Introduction
Casing is one of the most important parts of an aeroengine. It is a large thin-walled rotary part, on which there are many isolated convex structures distributed [1,2,3]. Moreover, this kind of component is usually made of difficult-to-cut materials, such as nickel-based superalloy and titanium alloy [4,5]. Therefore, a series of problems, such as large tool loss, long processing cycle, and workpiece deformation will occur in traditional machining, which was always a difficult manufacturing problem in the aerospace field [6,7,8].
In recent years, electrochemical machining (ECM) was more and more applied in the field of aerospace, because it can ignore the physical characteristics of processed materials, remove materials with chemical energy, with no tool wear, no cutting force, and high processing efficiency [9,10,11]. As a special ECM method, counter-rotating electrochemical machining (CRECM) is mainly used for machining thin-wall rotary parts with a complex concave and convex surface, so it is very suitable for machining casing [12,13]. The principle of CRECM is shown in Figure 1. A cylindrical cathode tool with an inner insulated window rotates inversely with the anode workpiece at the same speed. At the same time, the cathode tool is normally fed along the surface of the anode at a constant feed rate, and the high-speed electrolyte flows between the two electrodes. During the counter-rotation of the electrodes, the material on the surface of the anode workpiece begins to dissolve under the action of electrolysis, while the material on the corresponding part of the cathode window is retained. Compared with ordinary electrochemical machining, because the material is removed layer by layer in electrochemical machining, there is no joint mark on the machining surface, and the uniformity of wall thickness can be effectively controlled [14,15].
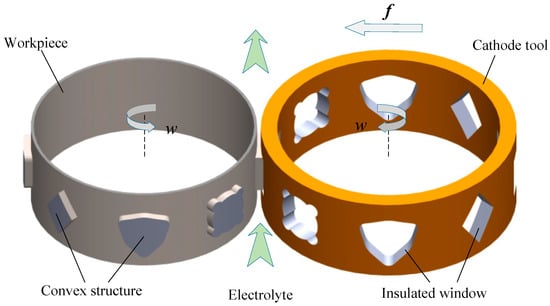
Figure 1.
The principle of CRECM.
However, with the development of CRECM technology, some problems were also found. For the high convex structure of the casing surface, CRECM is sometimes difficult to obtain the desired design accuracy in one machining. The sidewall taper of the convex will decrease with the increase in convex width. Thus, to achieve a uniform straight sidewall and obtain desired machining accuracy, a subsequent local machining process is necessary. Local electrochemical machining is proposed under this background, it is a method to process the local area around the pre-shaped convex structure by CRECM, which can effectively improve the pre-shaped convex side wall.
In order to predict the ECM result accurately, improve the machining precision, the ECM process simulation was the focus of research at home and abroad. Riggs et al. developed a mathematical model to predict the geometry evolution of workpieces in electrochemical cavity sinking [16]. However, that mathematical model is based on a simplified electric field model, which often had significant errors with the actual machining results. In the actual process of ECM, there are often a variety of physical and chemical phenomena, including electric field, multiphase flow field, electrochemical dissolution, etc. With the development of research, multi-physical field coupling simulation began to appear. Hinduia and Kunieda presented the potential models and moving boundary models to simulate the current density distribution and anodic dissolution in ECM considering the temperature field [17]. Chang and Hourng developed a two-dimensional two-phase numerical model to predict the thermal fluid field [18]. Gomez Gallegos et al. developed a 3D coupled multi-physics field finite element model to simulate the ECM craftsmanship [19]. Li et al. researched the influence of the coupling influence of the magnetic field, electric field, and electrolyte flow in ECM on the accuracy of ECM [20]. However, for local electrochemical machining, there is an obvious gas–liquid interface in the processing process, so the simulation model must consider the influence of gas–liquid two-phase flow, and previous scholars did not study the influence of gas–liquid two-phase flow on ECM.
In this paper, the simulation of local electrochemical machining of a pre-shaped convex structure by CRECM is studied. In Section 2, a multi-physical field coupling simulation model considering a gas–liquid two-phase flow field and temperature field is established. In Section 3, the influence of a gas–liquid two-phase flow field and temperature field on the conductivity distribution in the simulation process is studied, the reason for simulation error with pure electric field and the influence of cathode end width L on machining accuracy was analyzed. It was found that the gas–liquid two-phase flow field played a major role in the simulation results of local electrochemical machining, and there is a significant error with the simulation results of the pure electric field. In Section 4, the local electrochemical machining experiment was carried out. The experimental results show that there is a significant error between the pure electric field simulation results and the experimental results, and the multi-physical field coupling simulation results are basically consistent with the experimental results, the accuracy of multi-physical field coupling simulation is verified successfully, and a convex meeting the accuracy requirements is successfully machined based on the multi-physical field coupling simulation results.
2. Materials and Methods
2.1. Principle Introduction
Figure 2 is the schematic diagram of local electrochemical machining. During the machining process, the workpiece is stationary and only the cathode tool carries out vertical feed motion, and the initial convex structure of the workpiece is the pre-shaped convex structure by CRECM (Figure 2a). The side wall of the convex is an inverted cone, which does not meet the accuracy requirements of the target side wall. After local electrolytic machining, the final convex obtains a vertical convex side wall. From the sectional view (Figure 2b), it can be seen that the high-speed electrolyte passes through the narrow gap between the inner wall of the cathode tool and the insulating cavity, and then flows through the processing area. The external insulating layer of the cathode can prevent the stray corrosion of the cathode tool on the workpiece surface, and the internal insulating cavity can prevent the stray corrosion of the convex to ensure the final taper of the convex. Under the continuous feed of the cathode tool, the excess material on the side wall of the convex is dissolved by electrochemical corrosion and fed to the final position to obtain a convex that meets the target.
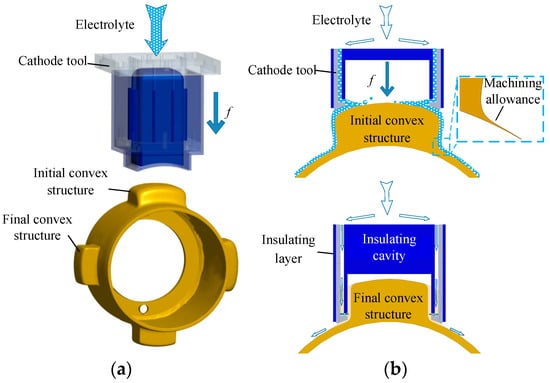
Figure 2.
Principle of local electrochemical machining of pre-shaped convex structure: (a) overall view, (b) sectional view.
In order to ensure that the contour near the root of the machining convex coincides with the contour of the target circle, the shape of the cathode end is designed according to the traditional cathode design method “cosθ method”. The principle is shown in Figure 3. The machining gap at angle θ is:
where is the equilibrium gap along the feed direction.
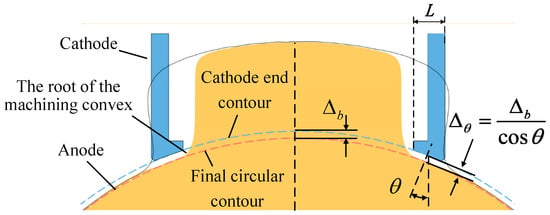
Figure 3.
cosθ method.
The width L of the cathode end is the key to affect the final machining accuracy. It can be seen from the local magnification of Figure 2 that the machining allowance at the root of the pre-shaped convex structure by CRECM is uneven, and it is difficult to determine the optimal width L. Cathode ends that are too narrow or too wide will produce joint marks. Therefore, it is necessary to obtain the optimal cathode end width L through accurate simulation.
The simulation is based on COMSOL Multiphysics software. The processing object is the pre-shaped rectangular convex structure by CRECM, which has the same shape in different cross sections, so it can be simplified into a 2D section model, mainly because the calculation amount of 3D model simulation is much larger than that of a 2D model. Figure 4 shows the machining area of the local electrochemical machining, and the width L of the cathode end is initially set at 3.3 mm, Γ1 is the initial anode workpiece surface and is also the pre-shaped convex contour by CRECM, Γ5Γ9 is the surface of the cathode end, Γ4Γ7Γ10 is the insulating boundary through which no current passes, Γ6Γ8 is the inlet of the electrolyte, and Γ2Γ3Γ11Γ12 is the outlet of the electrolyte.
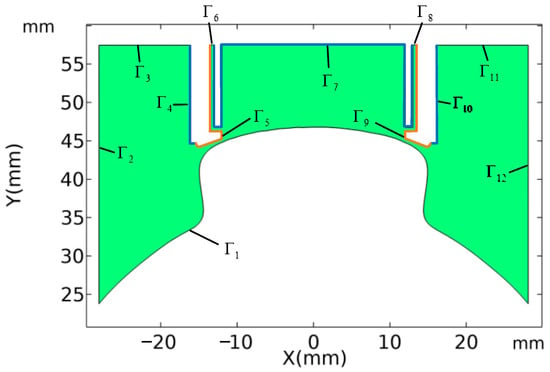
Figure 4.
Local electrochemical machining area.
2.2. Mathematical Model
2.2.1. Electric Field
To simulate the local electrical machining process, a physical model of the electric potential domain is established. The distribution of electric potential can be described by the Laplace equation [21]:
The electric field strength is the negative gradient of the electric potential. According to Ohm’s law, the relationship between the current density in the machining area and the electric field strength and potential is:
where is the conductivity of the processing area.
For the node on the anode surface Γ1 (Figure 4), in the actual electrochemical craftsmanship, the speed of ECM is usually expressed in terms of the dissolution speed in the direction normal to the metal surface of the workpiece anode:
where is the current efficiency, is the volumetric electrochemical equivalent, which is determined by the anodic dissolution behavior of material.
2.2.2. Two-Phase Flow Field
Level set is a numerical technique used for interface tracking and shape modeling. It is mainly used to describe the dynamic changes of the two-phase flow interface, and to determine the fluid interface by tracing the contour lines of the level set function. The equation controlling the transfer and reinitialization of the level set variable (bubble rate) is:
where γ is the reinitialization parameter, usually the maximum velocity of fluid flow in the model. ε is the interface thickness control parameter. In order to ensure high stability in the calculation of the level set equation, ε = hc/2 is usually adopted, where hc is the mesh size of the interface region.
The global density and dynamic viscosity are:
where and are the constant density and viscosity of the electrolytic liquid phase, respectively, and are the constant density and viscosity of air, respectively.
To simplify the simulation process, the two-phase fluid is assumed to be a continuous incompressible Newtonian fluid, and the mass and momentum conservation equations are as follows [22]:
where is the ith component of the electrolyte velocity vector, is the ith spatial coordinate, p is the pressure of electrolyte, is the ijth element of the stress tensor, Fi is the ith component of the volume force.
Due to the high velocity and complex flow field distribution in local electrochemical machining, the realizable k-ε turbulence model is adopted for simulation. The turbulence kinetic energy equation and dissipation rate equation are as follows:
where k is the turbulence kinetic energy, ε is the dissipation rate, Gk is the turbulent kinetic energy generated by the average velocity gradient, is the coefficient of turbulence viscosity, the value of the constants are , , , , , , and .
2.2.3. Temperature Field
In the process of ECM, a lot of heat will be generated in the processing zone, and the heat will be taken away by the high-speed electrolyte flowing through. The convection heat transfer equation of the processing zone is as follows [23]:
where T is the temperature of the fluid, is the specific heat capacity of the fluid, kt is the heat conduction coefficient, and is Joule heat.
2.2.4. Mathematical Model for Multi-Physical Field Coupling
During ECM, the electric field, flow field and temperature field will interact with each other, and the flow field and temperature field will affect the distribution of electrical conductivity, thus affecting the electric field distribution. Electric field and flow field will affect the distribution of the temperature field. The coupling equation between them is as follows [24]:
where l is the fluid flow length, is the initial electrolyte conductivity, a is the conductivity temperature coefficient, a = 0.025, and n is the index of the influence of gas volume fraction on the conductivity; n = 1.5.
2.3. Boundary Condition Settings
As shown in Figure 5, the simulation model module covers a two-phase flow field, electric field, temperature field, and deformation geometry, and the corresponding boundary conditions of each module are as follows:
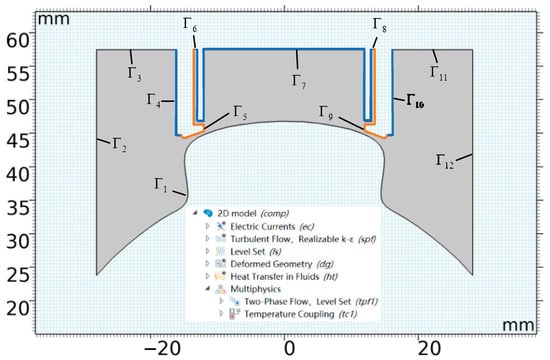
Figure 5.
Simulation models and modules.
(1) For the boundary conditions of the electric field, the workpiece surface voltage , the cathode tool surface voltage , and the insulating layer boundary conditions are .
(2) For the boundary conditions of the two-phase flow field, the inlet pressure of the fluid , and the outlet pressure . In the initial state, the processing area is filled with air, and the inlet electrolyte bubble flow is 0 electrolyte.
(3) For the boundary conditions of the temperature field, the initial temperature of the entire processing area and the temperature of the inlet electrolyte are both , and the heat source is the electromagnetic heat generated by the entire processing area.
(4) For the boundary conditions of the deformed geometry, the cathode and the insulation layer are fed vertically downward, and the feed speed is .
3. Simulation Result Analysis
3.1. The Influence of Two-Phase Flow Field and Temperature on the Conductivity Distribution
3.1.1. Two-Phase Flow Field and Temperature Field Distribution
According to Formula (16), the conductivity of the electrolyte is the result of the combined influence of the bubble rate and temperature T of the electrolyte. With the increase in the bubble rate , the conductivity will decrease, and when the bubble rate is 1, the conductivity will be 0. With the increase in the temperature T, the conductivity will increase, so it is necessary to analyze the two-phase flow field and temperature field distribution in the machining process.
Figure 6 shows the two-phase flow field distribution and the evolution process of the local electrochemical machining of the pre-shaped convex contour at different processing times of 1 s, 250 s, 500 s, and 744 s. The legend represents the volume fraction of the electrolyte, also equal to (1 − ), the dark red represents the electrolyte, and the dark blue represents the air. It can be seen that there is an obvious gas–liquid two-phase interface in the simulation process, the electrolyte always flows close to the workpiece wall, and the rest is air. Since the conductivity is not zero only in the region where the electrolyte is present, therefore, the two-phase flow field plays a major role in the conductivity distribution.


Figure 6.
Gas–liquid two-phase flow field distribution: (a) t = 1 s, (b) t = 250 s, (c) t = 500 s, and (d) t = 744 s.
Figure 7 shows the temperature field distribution and the evolution process of local electrochemical machining of the pre-shaped convex contour at different processing times of 1 s, 250 s, 500 s, and 744 s. The legend represents the temperature, the yellow area represents the high temperature, and the dark red represents the initial temperature. As can be seen from the figure, the distribution of temperature field is basically consistent with that of two-phase flow field. The main reason is that the heat generated in the processing zone is mainly taken away by the electrolyte. When the electrolyte flows through the machining gap, the electrolyte temperature rises from the initial 293.15 K to about 296 K, and slowly rises with the feed depth. When the feed reaches the final position, the maximum temperature of the machining gap reaches about 299 K. The temperature rise of surrounding air is very small because the heat conduction coefficient of air is far less than that of the electrolyte. The temperature field plays a minor role in the conductivity distribution and only determines the maximum conductivity of the machining area.
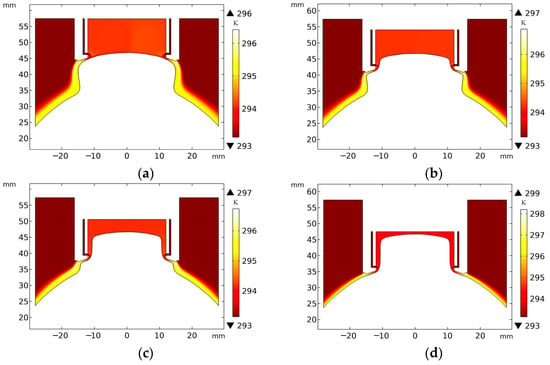
Figure 7.
Temperature field distribution: (a) t = 1 s, (b) t = 250 s, (c) t = 500 s, and (d) t = 744 s.
3.1.2. Conductivity Distribution
Figure 8 shows the conductivity distribution and the evolution process of local electrochemical machining of the pre-shaped convex contour at different processing times of 1 s, 250 s, 500 s, and 744 s. The legend represents the conductivity. As only the region where the electrolyte is present has a conductivity that is not zero, the distribution of conductivity is similar to the distribution of a two-phase field. As the temperature in the processing area has a certain increase compared with the initial temperature, the maximum conductivity of the electrolyte will be greater than 13 S/m, and it increases slowly with the feed depth. The maximum electrical conductivity of the four time points is, respectively, 13.7 S/m, 13.8 S/m, 13.9 S/m, and 14.1 S/m, which are usually distributed in the machining gap and the insulating cavity, because the bubble rate here is 0 and the temperature is higher than the initial temperature. Due to the high bubble rate of the electrolyte flowing on the smooth surface of the workpiece, the electrical conductivity is often less than 13 S/m. For the surrounding air, the conductivity is 0 S/m.
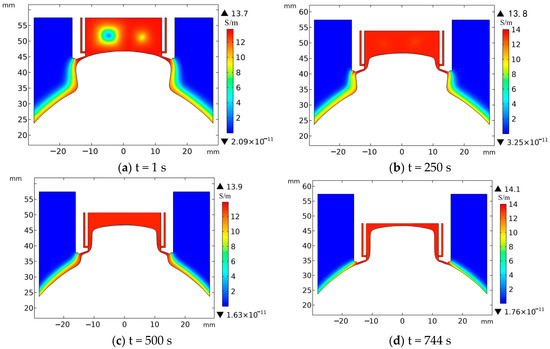
Figure 8.
Conductivity distribution: (a) t = 1 s, (b) t = 250 s, (c) t = 500 s, and (d) t = 744 s.
3.2. Comparison with Pure Electric Field Simulation Results
Figure 9 shows the comparison between the pure electric field simulation and the coupled simulation considering the gas–liquid two-phase flow field and temperature field when L = 3.3 mm. It can be seen from the Figure 9 that the convex contour produced by two kinds of simulation is basically consistent, and the error is controlled within a small range. However, there is a significant error at the joint area, and the maximum error is 0.22 mm. There is basically no raised joint mark in pure electric field simulation, while there is an obvious raised joint mark in multi-physical field simulation.
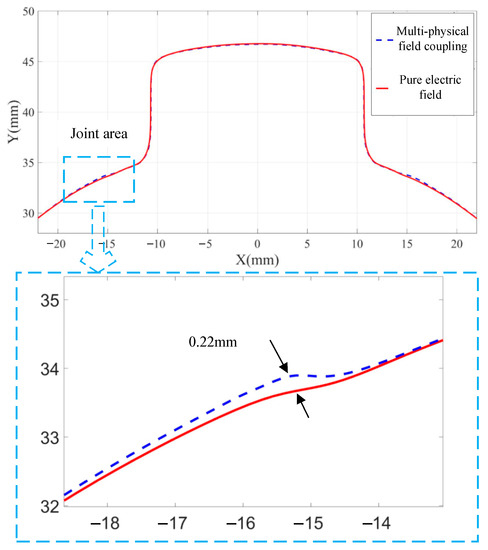
Figure 9.
Pure electric field simulation and multi-physical field coupling simulation results, L = 3.3 mm.
The error is mainly caused by the difference of conductivity distribution, which leads to the difference of current density distribution. For the pure electric field simulation, in order to simplify the simulation process, the whole machining area is assumed to be a constant conductivity, which leads to a significant error with the actual machining process. Figure 10 is the current arrow distribution diagram of multi-physical field coupling simulation and pure electric field simulation. It can be seen from the enlarged view of multi-physical field coupling simulation that the current is mainly distributed in the processing area during the machining process because the air is insulated to the current (Figure 10a). However, it can be seen from the enlarged view of pure electric field simulation (Figure 10b) that the workpiece smooth surface far away from the cathode and the transition area at the convex root will also generate a stray current, resulting in stray corrosion, and the raised area near the convex root will be slowly eroded away. Figure 11 is a comparison of the current density distribution of the two simulations along the workpiece surface arc. For the multi-physical field coupling simulation, there is basically no stray current in the smooth area during the machining process, which will not cause stray corrosion, while for the pure electric field simulation, there is stray current in the smooth area during the machining process.
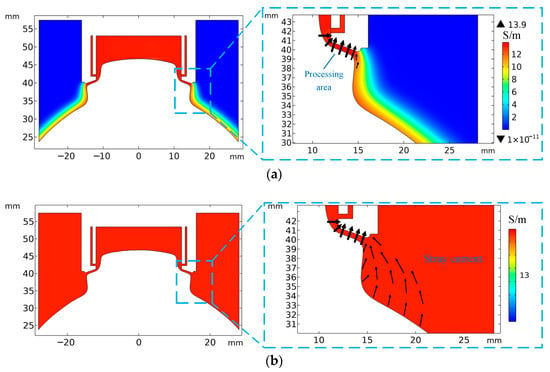
Figure 10.
The current arrow distribution: (a) multi-physical field coupling simulation, (b) pure electric field simulation.
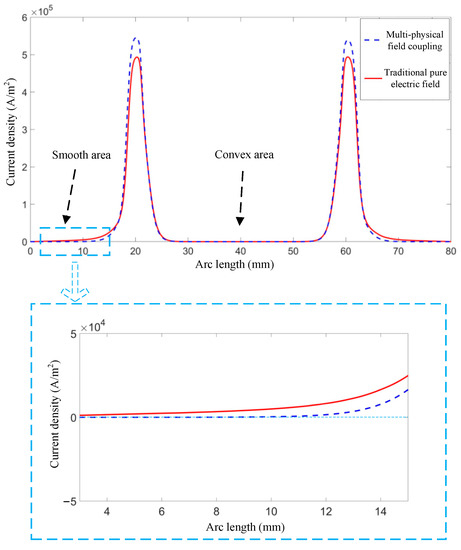
Figure 11.
The current density distribution along the workpiece surface arc.
3.3. The Influence of Cathode End Width on Machining Accuracy
The purpose of simulation is to improve machining accuracy. For local electrochemical machining, one essential issue that needs to be addressed is controlling the joint marks, and the choice of cathode end width L is the key to reduce the joint mark. According to Figure 12a, for L = 3.3 mm, the cathode is fed to the final position when t = 744 s, but the raised joint mark is still retained on the joint area due to the width L of the cathode end being narrow.

Figure 12.
Localized electrochemical machining results when L = 3.3 mm.
In order to reduce the joint mark and improve the machining accuracy, the anode shaping processes of the cathode end with different widths L was simulated. Figure 13 shows the final convex contour obtained by simulation under different cathode end widths L (3.4 mm–3.9 mm). It can be seen that the raised area rapidly decreases with the increase in cathode end width. When L = 3.7 mm, the raised area basically disappears. However, when the width L exceeds 3.7 mm, there will be a certain sunken area, which will continue to grow larger as the width L continues to increase. Figure 14 shows the up and down deviation between the simulated contours at the joint area with the target circle contour under different cathode end widths L (3.4 mm–3.9 mm). When L = 3.7 mm, the maximum deviation at the joint area can be controlled at about 0.02 mm, which is the best cathode end width.

Figure 13.
Convex contour at the joint area with different widths of cathode end.
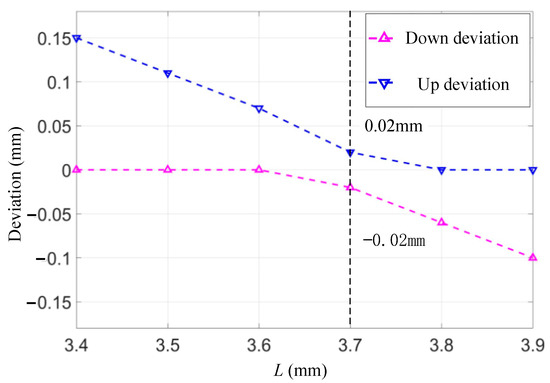
Figure 14.
Deviation at the joint area with different widths of cathode end.
4. Experimental Verification
4.1. Experimental Procedure
The experimental set-up is shown in Figure 15. The anode workpiece and cathode tool are fixed on two shafts. During the machining process, the electrolyte is pumped into the cathode tool from one side, and the cathode tool feeds towards the anode workpiece along the radial direction at a constant feed rate. It can be seen from the actual picture of the workpiece that the side wall of the initial convex by CRECM is an inverted cone, which does not meet the accuracy requirements of the target side wall. Based on the simulation results, when L = 3.7 mm, the workpiece basically does not have the joint mark, while when L = 3.3 mm, the workpiece will remain at an obvious raised joint mark, so the cathodes with end width L = 3.3 mm and 3.7 mm are fabricated, respectively, for the control experiment. To avoid stray current attack of the non-processing area, both the outer and inner sidewalls are shielded using 3D-printed insulators. The detail machining parameters are shown in Table 1.
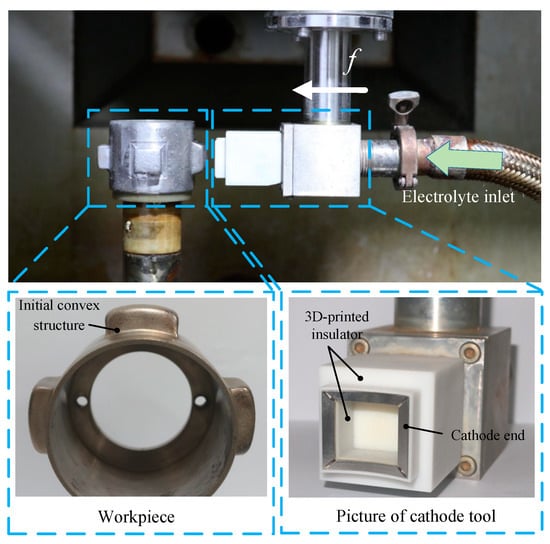
Figure 15.
Experimental set-up for the localized electrochemical machining.

Table 1.
Experimental parameters.
4.2. Experimental Result
Figure 16a,b show the results of local electrochemical machining when L = 3.3 mm and 3.7 mm, respectively. For L = 3.3 mm, there will be a ring of protrusion around the machined convex and there is an obvious joint mark. For L = 3.7 mm, there is no obvious joint mark. Figure 17 shows the contour comparison of the experimental contour measured by a three-dimensional measuring machine, multi-physical field coupling simulation, and pure electric field simulation. It can be seen from the enlarged view at the joint area that there is a large error between the pure electric field simulation contour and the experimental contour, and the maximum error is 0.28 mm and 0.32 mm, respectively. The contours of the multi-physical field coupling simulation results are basically consistent with the experimental contours, and there are slight deviations (<0.06 mm). Considering the errors of cathode fabrication and experimental installation, the correctness of the multi-physical field coupling simulation results can be verified.
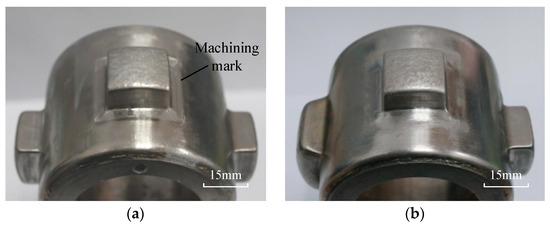
Figure 16.
Local electrochemical machining experimental results: (a) L = 3.3 mm, (b) L = 3.7 mm.
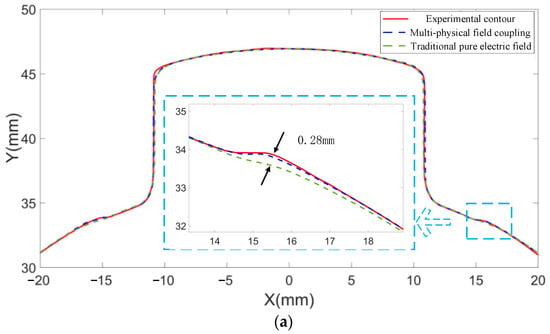
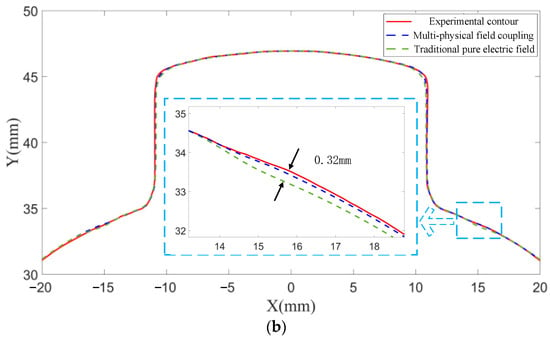
Figure 17.
Comparison of simulated contour and test contour: (a) L = 3.3 mm, (b) L = 3.7 mm.
Figure 18 and Figure 19 are the convex comparison before and after local electrochemical machining with GOM scanning, respectively. The legend represents the distance from the center wheelbase. From the 3D view, it can be seen that the sidewall taper of the convex improved significantly. From the front view, the convex sidewall taper changes from −8° to 0.15°, and as you can see from the side view, the convex sidewall taper decreases from 14.5° to 0.25°, reaching the target’s sidewall taper requirements.
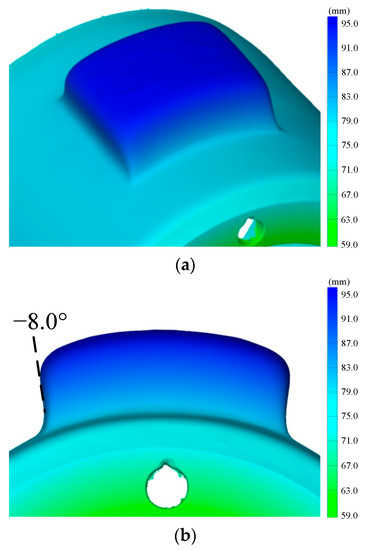
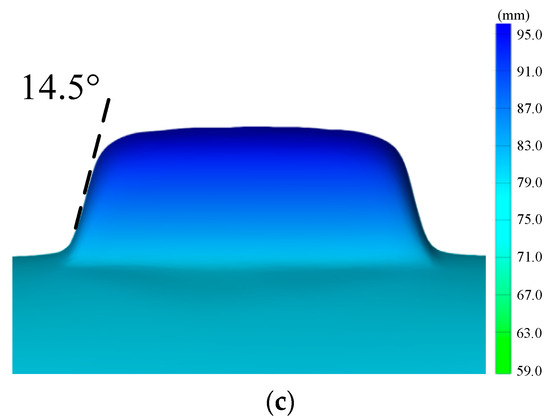
Figure 18.
The original convex of the GOM scan: (a) 3D view, (b) front view, and (c) lateral view.
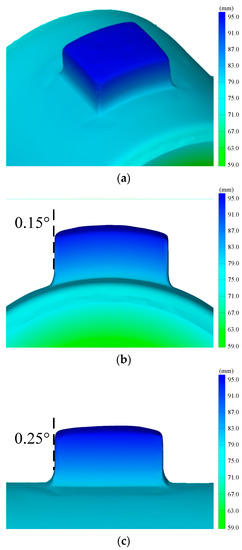
Figure 19.
Modified convex of the GOM scan: (a) 3D view, (b) front view, and (c) lateral view.
5. Conclusions
In this paper, a simulation model of local electrochemical machining considering the gas–liquid two-phase flow field and temperature field was established. The influence of the gas–liquid two-phase flow field and temperature field on the conductivity distribution in the simulation process was studied, and the reason for simulation error with pure electric field and the influence of cathode end width L on machining accuracy was analyzed. According to simulation and experimental results, the following conclusions can be drawn:
(1) For local electrochemical machining, the two-phase flow field and temperature field jointly affect the conductivity distribution in the machining area. Due to the obvious gas–liquid two-phase interface in the processing process, the two-phase flow field plays a major role in the conductivity distribution, and the temperature field plays a minor role, which only determines the maximum conductivity of the machining area.
(2) There are significant errors between the pure electric field simulation results and the multi-physical coupling simulation results, mainly due to the difference in conductivity distribution. For the pure electric field simulation, in order to simplify the simulation process, the conductivity of the machining area is assumed to be constant, which does not meet the actual processing conditions.
(3) The choice of the cathode end width L plays a key role in the final machining accuracy. With the increase in cathode end width L, the raised joint mark will gradually decrease until it basically disappears. With the continuous increase in the width of the cathode end, the sunken joint mark will be produced.
(4) The pure electric field simulation results have a significant error with the experimental results, and the maximum error is 0.28 mm and 0.32 mm, respectively. The multi-physical field coupling simulation results are basically consistent with the experimental results, the deviation is within 0.06 mm, and it is proved that the multi-physical coupling simulation can predict the local electrochemical machining results with high precision, which is of great significance to improve the precision of local electrochemical machining. When the cathode end width L = 3.7 mm, a casing convex meeting the target requirements is successfully machined. Its side taper changes from the initial −8° and 14.5° to 0.15° and 0.56°, respectively. The practical application value of local electrochemical machining is proved.
Author Contributions
Conceptualization, J.Y.; methodology, D.W.; COMSOL Multiphysics software, J.Y.; experiment, J.Y.; writing—original draft preparatio, J.Y.; writing—review and editing, D.W.; All authors have read and agreed to the published version of the manuscript.
Funding
This work was supported by the National Natural Science Foundation of China (no.52175414), National Natural Science Foundation of China for Creative Research Groups (51921003), Natural Science Foundation of Jiangsu Province of China (No. BK20220134) and China Postdoctoral Science Foundation (2019M661833).
Institutional Review Board Statement
Not applicable.
Informed Consent Statement
Not applicable.
Data Availability Statement
Not applicable.
Conflicts of Interest
The authors declare that they have no conflict of interest.
References
- Mir-Haidari, S.-E.; Behdinan, K. Advanced test protocols for rapid detection and quantification of nonlinear dynamic responses in aeroengine casing assemblies. Nonlinear Dyn. 2021, 104, 2219–2239. [Google Scholar] [CrossRef]
- Zhai, X.; Fei, C.; Wang, J. Parametric modeling and updating for bolted joints of aeroengine casings. Proc. Inst. Mech. Eng. Part C J. Mech. Eng. Sci. 2016, 230, 2940–2951. [Google Scholar] [CrossRef]
- Mir-Haidari, S.-E.; Behdinan, K. Nonlinear effects of bolted flange connections in aeroengine casing assemblies. Mech. Syst. Signal Process. 2022, 166, 108433. [Google Scholar] [CrossRef]
- Sabesan, R.; Leen, S.B.; Hyde, T.H. Simplified method to predict elastic-plastic behaviour of aeroengine casings. Key Eng. Mater. 2003, 245, 373–380. [Google Scholar] [CrossRef]
- Zhang, J.; Jie, Z.; Huang, T. Research and Development of Equiaxed Grain Solidification and Forming Technology for Nickel-Based Cast Superalloys. Acta Metall. Sin. 2019, 55, 1145–1159. [Google Scholar]
- Guo, L.; Yang, F.; Li, T. Vibration suppression of aeroengine casing during milling. Int. J. Adv. Manuf. Technol. 2021, 113, 295–307. [Google Scholar] [CrossRef]
- Polvorosa, R.; Suarez, A.; Wu, B. Tool wear on nickel alloys with different coolant pressures: Comparison of Alloy 718 and Waspaloy. J. Manuf. Process. 2017, 26, 44–56. [Google Scholar] [CrossRef]
- Sun, H.; Peng, F.; Zhao, S. Uncertainty calibration and quantification of surrogate model for estimating the machining distortion of thin-walled parts. Int. J. Adv. Manuf. Technol. 2022, 120, 719–741. [Google Scholar] [CrossRef]
- Klocke, F.; Zeis, M.; Klink, A. Experimental research on the electrochemical machining of modern titanium- and nickel-based alloys for aero engine components. Procedia CIRP 2013, 6, 368–372. [Google Scholar] [CrossRef]
- Liu, J.; Liu, Y.; Zhang, Z.; Wang, H. Parameter Optimization and Experimental Study on Tool-Vibration-Assisted Pulsed Electrochemical Machining of γ—TiAl TNM Blades. Appl. Sci. 2022, 12, 8042. [Google Scholar] [CrossRef]
- Rajurkar, K.P.; Sundaram, M.M.; Malshe, A.P. Review of Electrochemical and Electrodischarge Machining. Procedia CIRP 2013, 6, 13–26. [Google Scholar] [CrossRef]
- Wang, D.; Zhu, Z.; Wang, H. Convex shaping process simulation during counter-rotating electrochemical machining by using the finite element method. Chin. J. Aeronaut. 2016, 29, 534–541. [Google Scholar] [CrossRef]
- Wang, D.; Zhu, Z.; He, B. Counter-rotating electrochemical machining of a combustor casing part using a frustum cone-like cathode tool. J. Manuf. Process. 2018, 35, 614–623. [Google Scholar] [CrossRef]
- He, B.; Wang, D.; Zhu, Z. Research on counter-rotating electrochemical machining of convex structures with different heights. Int. J. Adv. Manuf. Technol. 2019, 104, 3119–3127. [Google Scholar] [CrossRef]
- Wang, D.; Li, J.; Zhu, D. Counter-Rotating Electrochemical Machining of a Convex Array Using a Cylindrical Cathode Tool with Multifold Angular Velocity. J. Electrochem. Soc. 2019, 166, 412–419. [Google Scholar] [CrossRef]
- Riggs, J.B.; Muller, R.H.; Tobias, C.W. Prediction of work piece geometry in electrochemical cavity sinking. Electrochim. Acta 1980, 26, 961–969. [Google Scholar] [CrossRef]
- Hinduja, S.; Kunieda, M. Modelling of ECM and EDM processes. CIRP Ann. 2013, 62, 775–797. [Google Scholar] [CrossRef]
- Chang, C.S.; Hourng, L.W. Two-dimensional two-phase numerical model for tool design in electrochemical machining. J. Appl. Electrochem. 2001, 31, 145–154. [Google Scholar] [CrossRef]
- Gomez-Gallegos, A.; Mill, F.; Mount, A.R.; Duffield, S.; Sherlock, A. 3D multiphysics model for the simulation of electrochemical machining of stainless steel (SS316). Int. J. Adv. Manuf. Technol. 2018, 95, 2959–2972. [Google Scholar] [CrossRef]
- Li, L.; Baoji., M.A.; Wang, R.F.; Du, L.Q. The coupled effect of magnetic field, electric field, and electrolyte motion on the material removal amount in electrochemical machining. Int. J. Adv. Manuf. Technol. 2017, 91, 2995–3006. [Google Scholar]
- Wang, H.; Liu, J.; Zhu, D. A Study of Precision Current Efficiency Curve Measurement with a Casing-Type Anode. Appl. Sci. 2021, 11, 1425. [Google Scholar] [CrossRef]
- Zhang, J.; Li, X.; Wang, J.; Qiao, L. CFD–DEM Simulation of Dust Deposition on Solar Panels for Desert Railways. Appl. Sci. 2022, 13, 4. [Google Scholar] [CrossRef]
- Li, G.; Du, Y.; Yang, L. Simulation Study on Thermal Wake Characteristics of Underwater Vehicle under Rotary Motion. Appl. Sci. 2023, 13, 1531. [Google Scholar] [CrossRef]
- Li, Z.; Li, W.; Dai, Y. Experimental Research and Multi-Physical Field Coupling Simulation of Electrochemical Machining Based on Gas-Liquid Two-Phase Flow. Micromachines 2022, 13, 246. [Google Scholar] [CrossRef]
Disclaimer/Publisher’s Note: The statements, opinions and data contained in all publications are solely those of the individual author(s) and contributor(s) and not of MDPI and/or the editor(s). MDPI and/or the editor(s) disclaim responsibility for any injury to people or property resulting from any ideas, methods, instructions or products referred to in the content. |
© 2023 by the authors. Licensee MDPI, Basel, Switzerland. This article is an open access article distributed under the terms and conditions of the Creative Commons Attribution (CC BY) license (https://creativecommons.org/licenses/by/4.0/).