Abstract
The Internet of things (IoT) has opened new dimensions of novel services and computing power for modern living standards by introducing innovative and smart solutions. Due to the extensive usage of these services, IoT has spanned numerous devices and communication entities, which makes the management of the network a complex challenge. Hence it is urgently needed to redefine the management of the IoT network. Software-defined networking (SDN) intrinsic programmability and centralization features simplify network management, facilitate network abstraction, ease network evolution, has the potential to manage the IoT network. SDN’s centralized control plane promotes efficient network resource management by separating the control and data plane and providing a global picture of the underlying network topology. Apart from the inherent benefits, the centralized SDN architecture also brings serious security threats such as spoofing, sniffing, brute force, API exploitation, and denial of service, and requires significant attention to guarantee a secured network. Among these security threats, Distributed Denial of Service (DDoS) and its variant Low-Rate DDoS (LR-DDoS), is one of the most challenging as the fraudulent user generates malicious traffic at a low rate which is extremely difficult to detect and defend. Machine Learning (ML), especially Federated Learning (FL), has shown remarkable success in detecting and defending against such attacks. In this paper, we adopted Weighted Federated Learning (WFL) to detect Low-Rate DDoS (LR-DDoS) attacks. The extensive MATLAB experimentation and evaluation revealed that the proposed work ignites the LR-DDoS detection accuracy compared with the individual Neural Networks (ANN) training algorithms, existing packet analysis-based, and machine learning approaches.
1. Introduction
The internet of things (IoT) has emerged as the leading technology to make life elegant and smarter by connecting billions of devices and interconnectivity. IoT is also capable of potentially interconnecting various technologies like cloud computing, edge/fog computing, big data analytics, and many more. The marvelous benefits of IoT result in the massive production of data, which can be stored, processed, and used for any decision-making criteria. The massive data requires delicate attention regarding its storage, transmission during communication, and management. Software-defined networking (SDN), steps forward as a promising solution to manage and handle the network management issues of the IoT network [1]. Aiming to provide flexible, secure, and reliable network management, SDN has gotten significant attention from academia and the industrial sector in recent years. The SDN architecture includes (1) a centralized control plane, (2) a data plane, and (3) an end user (host devices). The decoupled control plane and the data plane provide flexible programmability and less complexity of network nodes. The controller manages and controls all the network intelligence while the in-network devices (such as switches and routers) in the data plane are responsible for only packet forwarding and can be configurable via southbound interfaces (SBI) using OpenFlow (OF) protocol. SBI is the interface between the control plane and the data plane. OF provides the network topology, interface, and traffic status information to the controller and SBI allows the controller to inject flow rules in the OF table. All this information is maintained in the Network Information Base (NIB) [2].
Meaning that all the forwarding logic is implemented in the networking devices, whereas the control and management decision-making policies are handled by the controller. The controller acts as an administrator on top of the IoT controller and instructs the underlying devices with the new policies to manage the network and serve the application layer as shown in Figure 1 [3].
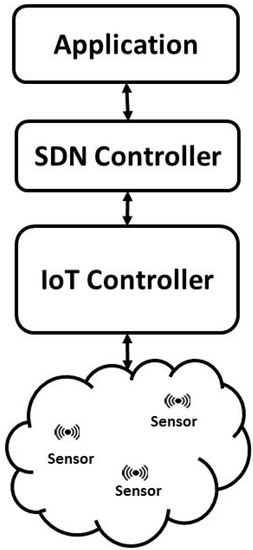
Figure 1.
SDN based managed IoT network.
SDN architecture is mainly comprised of SDN controllers, switches, and end-user devices. The switches follow the OpenFlow protocol, which allocates the memory against each arrived packet in the buffer flow. The switch works on the rules created by the SDN control plane and is only responsible for forwarding the packets by matching the packets with flow rules. When a new packet arrives, which does not match the rules, the switch forwards this packet to the flow controller to create the rule for this packet. The flow controller of the control plane provides a complete grip on the flow of packets in the network; however, it brings some severe threats to the SDN control plane and requires special attention to against any cyber attack. The biggest threat is the launch of Distributed Denial of Service (DDoS) attack, which can in initiated by sending unseen small-sized packets to the targeted network. The switch cannot find any matched rules against these packets and is required to forward the unseen packets to the SDN control plane. These unseen packets will help attackers to consume bandwidth, produce network delays, and, most important is to hurdle the legitimate user in the network connection. The unseen packets will saturate the flow buffer capacity of the flow controller, which will be resulting in the failure to forward the correct packets to the destination and eventually cause dissatisfaction to the user [4].
In SDN, upon any packet reception, the switch flow table check is performed, and the packet is forwarded to the destination if the flow matches successfully. If a match is not found, the OpenFlow-enabled networking device (i.e., switch) forwards a control packet (i.e., packet_in) to the controller to make an appropriate decision against the packet. The controller, in return, forwards the packet_out message to program the new forwarding rules in the switches. The controller is usually capable of managing numerous flow tables maintained by an OpenFlow switch to achieve programmability. The programmability feature results in the handling of the IoT network. As per the controller’s policy, the flow tables can perform their duties as a switch, firewall, or router, which exhibits identical or similar roles [5]. The only limitation of the OpenFlow switches is limited to the packet header matching while deep packet inspection is not supported.
Despite having all the impressive benefits, the SDN-based IoT network architecture faces various severe security challenges and prompts several questions. What are the most threatening intrusions and their advanced variants? How we can provide a safe a reliable networking and management environment? How to provide a robust intrusion detection system (IDS), which can accommodate the distributed network, and privacy of data, and not burden the network in terms of data transmission?
Amongst the security challenges to the SDN controller, Distributed Denial of Service (DDoS) is one of the major security threats that mainly attempt to make computational resources unreachable to legitimate users. A DDoS attack mainly involves various online connected devices (often named a botnet) which aim to overwhelm a target with fake traffic. The DDoS attack has advanced to a low-rate traffic structure from traditional high-rate attack transmission. This transformation in DDoS attacks has introduced a new variant of attack named low-rate DDoS (LR-DDoS) [6,7].
LR-DDoS attacks mainly focus on TCP’s congestion-control vulnerability by transmitting the malicious traffic at a low constant rate lowering throughput by making use of the re-transmission time-out mechanism. Attackers launch such types of attacks from smartphones using various tools such as Slow Droid [8] and exploit the application layer weaknesses via various application layer protocols e.g., Slow Next [9]. Such attacks spread quickly and massively damage the SDN controller, resulting in unresponsive to the IoT network, and the remedial procedure is extremely difficult to perform in real-time. It is essential to secure the SDN controller from such malicious attacks so that SDN can facilitate and manage the IoT network efficiently [10].
A plethora of state-of-the-art mathematical and machine learning (ML) based LR-DDoS detection techniques have been developed, which have shown remarkable results. The former has shown better performance in terms of good detection rate, while the latter detects the LR-DDoS accurately with higher time complexity. In conventional ML-based detection schemes, the data gathered by the end hosts are usually kept on the cloud and utilized in the model training process and the trained model is further utilized for classification and prediction purposes. Although ML-based LR-DDoS detecting algorithms have shown high intrusion detection accuracy, these schemes give rise to several research questions. The huge amount of generated data by the consumer’s devices and their transmission towards the centralized compute station (i.e., Cloud) can cause increased transmission delays, latency, and bandwidth consumption. In addition, the confidentiality of end-user data is a big question regarding data security and privacy [11,12,13].
To tackle the aforementioned issues, Google introduced Federated learning (also known as collaborative learning) that mainly trains the ML algorithms on local devices (handheld devices and/or Edge servers) without exchanging any data, thus effectively handling the issues such as data privacy, data security, data access rights and access to heterogeneous data [14].
Various FL especially distributed FL-based LR-DDoS detection techniques [15,16] have been proposed, showing remarkable results. Authors in [15] adopted distributed federating learning and proposed an intrusion detection mechanism in a vehicular environment where the participating vehicles perform local training on collected data and share the trained model weights with the federated server, where the locally trained weights are aggregated to develop a global model. The proposed work allocates equal preference to all the locally trained model weights, reducing the overall efficiency of a final global model. Authors in [16] proposed the Federated learning-based chained anomaly detection system, which assigns an average preference mechanism to prioritize the received model weights from different participants. The proposed scheme shows high performance compared with the [15]; however, assigning average preference may never produce the optimal global model and it is highly needed to assign the optimized preferences to each the locally trained model.
Taking the aforementioned challenges into consideration, this work proposes a Weighted Federated learning-based LR-DDoS detection mechanism for SDN controllers that not only considers the benefits of Federated learning but also assigns appropriate preference to the received locally trained model weights. Meaning, the received locally trained model with high accuracy is assigned a high preference compared with the low accuracy models. The finally aggregated model developed based on several locally trained models with no-identical preference factors highly increases the accurate LR-DDoS detection frequency compared with the benchmark schemes.
The main contributions of our work are summarized as follows.
- We proposed a WFL-enabled LR-DDoS detection mechanism that develops a global federated learning model based on the performance accuracy of a locally trained Neural network model.
- We developed a robust preference assignment mechanism where the federated server assigns the preferences to the received locally trained models based on their overall performance accuracy.
- We evaluated the performance of the proposed mechanism in terms of Confusion Matrix, Classification Accuracy (CA), Misclassification Rate (MCR), Sensitivity, Specificity, F1-Score, NPV, False Positive Rate (FPR), and False Negative Rate (FNR) and compare the efficiency of the proposed work with the existing state of the art conventional and machine learning based low-rate DDoS detection schemes.
The rest of this paper is organized as follows: Section 2 outlines the related work in the literature regarding the detection of LR-DDoS, and Section 3 describes in detail the building blocks of the proposed model. Evaluation parameters are discussed in Section 4 and Simulation and Results are briefly discussed in Section 5. Finally, Section 6 provides the conclusion and future directions are given in Section 7.
2. Related Work
This section summarizes some work related to LR-DDoS attack detection in the literature regarding the SDN controller. In the following, we provide some existing and most relevant schemes which mainly focus to mitigate DDoS attacks.
Dehkordi et al. proposed a three-layer-based approach to detect the DDoS attack, including three collectors, entropy, and a classification-based section using the UNB-ISCX, CTU-13, and ISOT datasets. The author implemented a module using the Floodlight controller to detect the DDoS attack, especially to identify the low-volume DDoS and high-volume DDoS attacks in a time window of 10–240 s, but the author only considers 15–45 s range as best, as detection of DDoS can be done better in shorter window time. The author attains a detection accuracy of 97.65% for low-volume DDoS attacks in the period of 30 s, using a static threshold in low-volume and for a dynamic threshold, the detection accuracy is 73.96% for the same time [11].
An SVM-based classification algorithm was used to detect LR-DDoS in an SDN environment, which was simulated using Mininet and floodlight. The author extracted the six-tuple characteristics of DDoS attacks based on the flow status information and analyzed the change in the relevant characteristics. Based on these flow characteristics, the proposed model has achieved an average accuracy of 95.24% [17].
Similarly, another SVM-based model was used to detect the attack in the SDN control plane, and SVM parameters were optimized using a genetic algorithm (GA) to boost the detection accuracy. The author also deployed Kernel Principal Component Analysis (KPCA) for feature extraction, which along with the GA boosted the detection accuracy from 94.41% to 98.03% [18].
Xiao-Dong Zang et al. [19] proposed a comprehensive metric set to characterize IP traffic behavior: temporal, spatial, category, and intensity. The author proposed an ant colony optimization (ACO) based traffic profile for normal traffic and an updating strategy to reduce the false positive ratio. The proposed method achieves an accuracy rate of 97.4% and a false positive rate of 1.7%.
In [20], the author proposed a defensive mechanism using variation in entropy between normal and anomaly traffic. The proposed system consists of an SDN-Cloud environment, and simulation was carried out in a Mininet emulator with a POX controller. The proposed system elevates the detection rate and mitigation ability while simultaneously minimizing the false positive rate and achieving a 98.2% detection rate along with a 0.04% false positive rate.
A Generative Adversarial Network (GAN) was proposed to detect DDoS attacks by continuous monitoring of the IP flow. The author applies adversarial training to make the system less to such attacks. The proposed system was first validated on the emulated scenario, built in an SDN environment to act as a real-time system, and secondly validated on the public dataset CICDDoS 2019. The author optimized the GAN framework and attained a detection accuracy of 94.38% using publicly available CICDDoS 2019 data [21].
In [22], a multi-feature DDoS attack detection scheme was proposed based on a factorization machine. In the proposed scheme, initially, the features of flow rules were extracted then these features are used in the factorization machine learning algorithm to detect the LR-DDoS attack. Based on features extraction and FM algorithm, the detection accuracy reaches 95.80%.
Wei Liang et al. [23] proposed data fusion-based federated learning to detect anomaly intrusion detection. Identifying the abnormal characteristics in the Blockchain is the primary concern of the proposed model. The proposed model has achieved a detection accuracy of 97%.
In [24] author proposed a Real-Time Sequential Deep Extreme Learning Machine Cyber Security Intrusion Detection System (RTS-DELM-CSIDS) security model. The model not only detects the intrusion but first-rate the security aspects, which contributes to their significance. The author validates the proposed model result by evaluating the performance in terms of training and validation accuracy and has achieved a training accuracy of 96.22% and a validation accuracy of 92.73%. The NSL-KDD dataset was used for the performance evaluation.
A MapReduce-based machine learning model was proposed in [25], in which intrusion in cyber networks is detected intelligently with multiple data classification tasks. The proposed model uses multiple network sources in real-time and predicts unknown test scenarios. The proposed scheme was validated using the NSL-KDD dataset and a training accuracy of 97.6% and validation accuracy of 95.7% were achieved.
Dan Tang et al. [26] proposed a lightweight real-time Performance and Feature (P&F) algorithm to extract the feature of low-rate DDoS attack. P&F also tries to locate the source of the LR-DDoS attack and identify the victims according to the flow features using time-frequency analysis. P&F can be deployed on the SDN controller to achieve real-time detection with less system cost (in terms of time and memory). In the proposed model, the detection is performed using supervised learning by deploying the Gradient Boosted Decision Trees (GBDT) algorithm. The achieved results show that the P&F framework has achieved a 98.06% success mitigation rate.
Kalman backpropagation neural network was adopted in the IoT dynamic environment to detect and mitigate the DDoS attack [27]. The author validates the framework through simulations using up to date CICDDoS2019 dataset and attains the 97.49% detection rate. The proposed mechanism is intelligent intrusion detection against the biggest threat to the data traffic in IoT networks.
In [28], the author proposed the multi-layer recurrent neural network (ML-RNN) to secure the end user and IoT devices in Fog computing. The proposed model was validated using the NSL-KDD and two additional metrics are added to evaluate the performance of the proposed system namely, (i) Mathew correlation and (ii) Cohen’s Kappa Coefficient. The proposed model was based on the two-layer of RNN, on the first layer, the model attains the detection accuracy of DoS attacks up to 97.8%, and on the second layer, it achieves the detection accuracy of 98.27%.
The existing work has achieved an excellent milestone in the detection of LR-DDoS attacks; however, some areas still need true attention, which includes the support to the distributed system, network overhead consideration, distributed-based local devices capabilities as well as the interaction with the centralized global model. Our proposed work mainly deals with the support of distributed learning, which can provide many benefits and support to the existing issues of malicious attack detection systems.
3. WFL-Based Proposed Model
This section briefly describes the detailed description of the WFL-based proposed model for SDN-based managed IoT network along with a complete mathematical explanation of the Neural Network (NN) as a building block of the WFL. Table 1 comprises all variables used in the paper for a better understanding of the reader.

Table 1.
Nomenclature.
3.1. Proposed SDN-Based IoT Network Model Flow Chart
Figure 2 shows the flowchart of the proposed system, in which an IoT sensor field is being managed by an SDN controller. SDN centralized controller can be a target of some attackers to occupy the resources of the controller and tries to damage the normal routine of the SDN controller. The flow chart can be stated in the following steps.
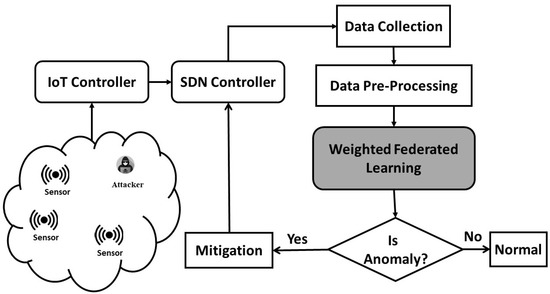
Figure 2.
Proposed WFL-based model flow chart for SDN-based managed IoT networks.
- Data Collection: At first, data is collected from the SDN controller to record the legitimate traffic flow and attack traffic flow. To mainly focus on the security of the SDN controller, the simulations are performed using a publicly available dataset, namely, CAIDA [29]. The dataset contains 78 features as input and 1 feature as output, in which the normal traffic records are labeled with 0 and attack traffic records are labeled with 1. The detailed information of the dataset is given in Table A1 in Appendix A.
- Data Pre-Processing: In preprocessing phase, if there is any missing value, that should be filled before the training phase.
- Data Splitting: The dataset used for the simulation of the proposed model consists of 150,000 instances, out of which 105,000 instances were used for the training phase, which is 70% of the dataset. During the training phase, the training data is partitioned into 70% Training, 20% Validation, and 10% Testing. The aforementioned partition is used to avoid over-fitting and under-fitting issues in the training phase. For validation purposes, 45,000 instances were used, which is 30% of the dataset.
- Holdout Validation: The holdout validation is used in this study to validate the proposed method.
- Weighted Federated Learning: WFL is a distributed machine learning paradigm that can support multiple edge devices or multi-network organizations and can fuse various trained model weights and assign each model with unique preference at the federated server to enhance the performance of the federated model further.
- Mitigation: This module predicts the network flow carrying the DDoS attack to the SDN controller for further mitigation action and secures the whole network by securing the SDN controller.
3.2. Federated Learning-Based Low-Rate DDoS Detection
Federated learning is an emerging machine learning paradigm based on the distributed learning approach that can accommodate heterogeneous organizations contributing to the global model formation. This distributed learning is based on individually collected data and then uses it to find the locally trained models using any machine learning algorithm; in our proposed scheme ANN is used and a model-centric-based fusion approach is used. In Figure 3, the IoT network is provided data to the SDN controller to manage the IoT network, and all the traffic is recorded at the SDN controller. The recorded traffic is fed to the ANN for local client training, and the weights achieved by the local training are shared with the federated server to form a global model.
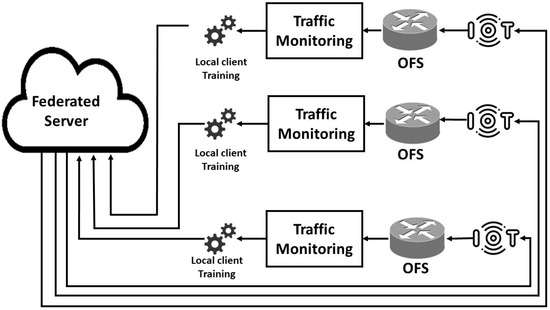
Figure 3.
Federated learning based Low-Rate DDoS attack detection system.
Three different training algorithms of the ANN are used in the local training, namely, Levenberg-Marquardt (LM), Bayesian regularization (BR), and Scaled Conjugate Gradient (SCG). The weights of these trained models are transmitted to the federated server for aggregation action to form a global federated model. After assigning the optimal preference of each locally trained model in the federated model, the global model is validated. Upon achieving optimized detection accuracy by the global federated model, finally, the global model is shared back to all local devices or organizations to perform further attack detection and defense locally. The forthcoming subsections will present a brief description of each building block of WFL.
3.2.1. Local Client Training
After collecting the dataset from various networks, it is fed to an ANN. The ANN hierarchy depends on three layers: the input layer, the hidden layer, and the output layer, which is adapted from human neuron behavior given in Figure 4.
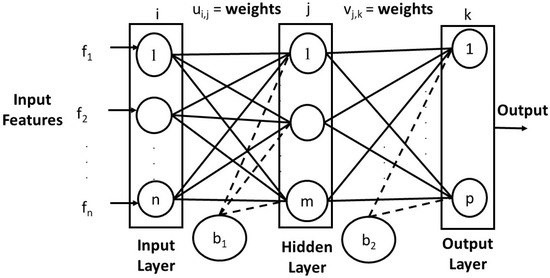
Figure 4.
Artificial Neural Network block diagram.
In Figure 4, represent the input features, where the circles inside the layer represent the neurons, and the index and k represents the element index in each layer. In every layer, some bias is added, which is shown as and . The weights between the input to the hidden layer are indicated by and shows the weights between the hidden layer and the output layer. The total number of elements in the input layer, hidden layer, and output layer is n, m, and p, respectively, which gives the dimensions of each layer.
The output at each neuron from the hidden layer can be calculated using the Sigmoid function given in Equation (1), in which represents the output of ith client of jth hidden neuron times input features added with some bias .
Similarly, represents the output at the output layer at kth neuron in Equation (2).
The difference between the actual and estimated output is an error, which can be calculated using Equation (3), in which represents the error of the ith client , and represents the actual output while represent the estimated output at the output layer.
Based on the forward and backward propagation mechanism in ANN, the weights between the layers are adjusted to the optimal value by minimizing the error, as mentioned in Equation (3). To find the minimized error, the weight change between the output layer and hidden layer can be computed as the derivative of the error function w.r.t to change in the weights as given in Equation (4), in which , represents the change in the weights of each client at each jth neuron at hidden layer connected with kth neuron at output layer [30].
Similarly, represents the change between the hidden to input layer neurons can be defined in Equation (5).
To find , the chain rule should be used because the error is due to the difference between the output layer and hidden layer, so change in error w.r.t the change in the output layer is times change in the output layer w.r.t change in hidden layer [24].
After taking the partial derivative and applying the chain rule, Equation (7) can be derived from Equation (6) as given below.
Equation (7) can be reduced in the form of Equation (8) by replacing the constant factor given in Equation (9).
The weights can be updated iteratively using Equation (10), in which the change in current weights times learning factor is added to current weights to obtain the updated weights.
In Equation (11), represents the change in weights of jth neuron of the hidden layer connected to the ith neuron in the input layer for the ith client .
After applying chain rule and taking the partial derivative, Equation (11) can be stated in form of Equation (12).
Equation (12) can be reduced to the simpler form by replacing the constant factor used in Equation (9).
Equation (13) can also reduce to Equation (14),
by replacing constant factor .
The weights between the hidden to input layers can also be updated iteratively by adding the change in the weights times the learning factor to the current weight.
Optimum weights of local training will be achieved by using Equations (10) and (16), and these weights will be transferred to the federated server for the aggregation the process to form a global model as shown in Algorithm 1.
| Algorithm 1 Client server algorithm |
|
3.2.2. Transfer of Weights
These weights are transferred to a federated server via any transmission procedure, which can be encrypted or non-encrypted.However, the secrecy of the transmission is not in the scope of this paper.
3.2.3. Federated Server
Each local client shares its optimum input-hidden layer weights to the federated server to form an input-hidden global model to by aggregating as shown in Equation (17).
Similarly, to form the global model of hidden to the output layer, each client will share its optimum locally trained weights to the federated server as shown in Equation (18).
The optimal can be obtained by assigning some preference to each locally trained weight based on the prediction performance; here, these preferences are found by the hit and trial method. In Equation (19), 0.25, 1, and 0.005 are the assigned preferences of the LM, BR, and SCG algorithms respectively.
Similarly, for the hidden-output layer, the locally trained weights are aggregated and assigned with optimal preferences to obtain the optimal hidden-to-output federated model as given in Equation (20).
Algorithm 2 shows each step of the federated server, which gets the locally trained weights, assigns their preference, and aggregates them to form the global model and validate the federated model.
| Algorithm 2 Federated server algorithm |
3.2.4. Edge Devices
Finally, the global model will be shared with the local edge devices or network organizations to detect low-rate DDoS attacks and combat the challenging issue. This will make a robust architecture for the whole network to remain safe from these attacks.
4. Evaluation Parameters
The performance evaluation of the proposed model in mainly divided into three parts, (i) local training performance, (ii) federated server performance, and (iii) statistical performance. For the local training performance, the performance parameters are the regression value and the Mean Square Error (MSE) value. For federated servers, the performance parameters are the classification accuracy (CA) and misclassification rate (MCR), which can be stated in the confusion matrix form. The statistical performances are based on the outcomes of the confusion matrix, i.e., the positive ratio, negative ratio, false positive, and false negative values. These statistical performances include classification accuracy (CA), misclassification rate (MCR), sensitivity, specificity, F1-Score, Negative Partial Value (NPV), False Positive Ratio (FPR), and False Negative Ratio (FNR). The mathematical form of the statistical parameters is given below in Equations (21)–(28).
Classification accuracy (CA) is the measure of the correctly predicted instances for each class in the prediction of machine learning. The higher values of classification accuracy mean better training in machine learning.
The misclassification rate (MCR) is the value of wrongly predicted instances by machine learning and should be as low as possible.
Sensitivity is a measure of how much a system can predict true instances. This is the ability of any machine learning model to correctly identify the true instances, and this is also known as the true positive rate (TPR).
Specificity measures the proportion of the true negatives correctly identified by the model. This is also known as the true negative rate (TNR). This parameter should be of higher value for a good machine-learning model.
F1-score is the combination and harmonic mean of precision and recall. This metric includes both the precision and recall factor of machine learning. For a higher F1-Score, the precision and recall metric of the machine learning model should be high.
Negative partial value (NPV) is the ability of machine learning to predict the negative instance as negative, not predicting the negative instances as the positive instance. The higher NPV means a higher stable machine learning model.
False positive rate (FPR) is the measure of the false positive predictions by machine learning against all positive predictions. The smaller value of (FPR) means, the higher the classification accuracy of the model. The sum of the specificity and (FPR) should be 1.
False negative rate (FNR) is the measure of the incorrectly predicted negative instances. This metric should be of low value for a better machine-learning model. The sum of sensitivity and FNR should be 1.
5. Simulation and Results
5.1. Simulation Environment
A simulation environment is required to simulate and validate the proposed model, which can perform the training and validation phase and draw the required results in graphical and tabular form. To set up the ANN, MATLAB 22 is used, which is running on the Windows 11 platform, 11th Gen Intel(R) Core(TM) i7-11700 with 16 Gb RAM and the ANN consists of multiple neurons. The training is performed using three different ANN training algorithms, and validation is performed using the sigmoid function, as mentioned in Algorithm 2 of Federated Server.
5.2. Simulations
Training Phase: Training of the data is an important part of the ANN, where input data and concerned output data are given to the ANN, and it then trains the brain of the ANN by forward and backward propagation. ANN finds the optimal weights between the layers by adjusting the weights between the layers to the minimum level. The training performance can be measured in two parameters, one is Mean Square Error (mse), and the second is the number of Epochs.
During the training phase, the training performance is shown by the blue solid line, the validation performance is shown by the green dash line and the testing performance is shown by the red dotted line. Figure 5 represents the convergence graphs of the Levenberg–Marquardt (LM) training algorithm of ANN, which is attaining a convergence level at approx. 550 number of Epochs with (mse).
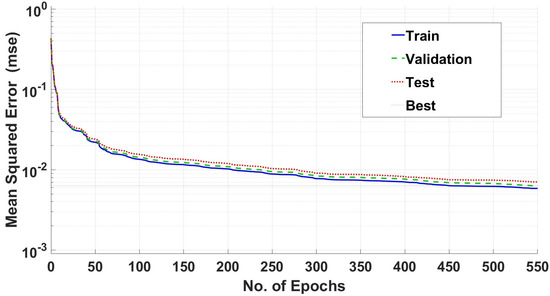
Figure 5.
Training performance of LM algorithm.
Figure 6 represents the performance of the Bayesian regularization (BR) training algorithm of ANN and it is converging at 900 Epochs approx and achieved the (mse). The validation and the testing during this algorithm training is overlapping, however, the training is higher as compared to the validation and testing, resulting in no over-fitting of the model.
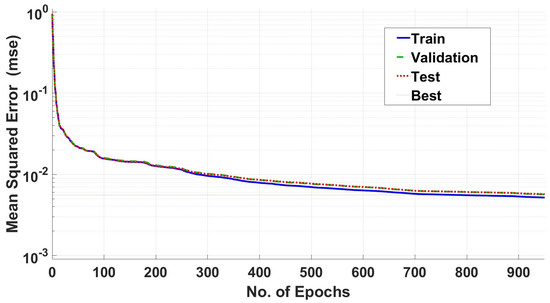
Figure 6.
Training performance of BR algorithm.
Figure 7 shows the convergence performance of the Scaled Conjugate Gradient (SCG) training algorithm of ANN, which is attaining (mse) at 300 Epoch approx. The validation and testing in the SCG training algorithm are also overlapping at some points, however, during the training phase, no over-fitting is happening, as the training performance is higher than the others.
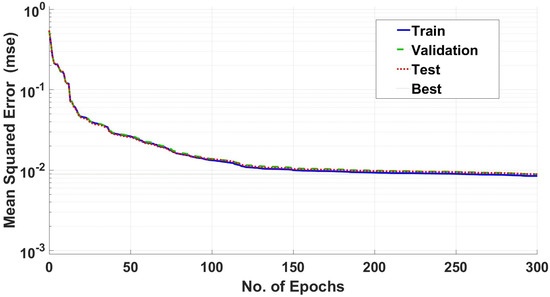
Figure 7.
Training performance of SCG algorithm.
Validation Phase: Validation is an important phase of any machine learning algorithm, which gives a clear sight of the performance of the proposed model. Since the proposed model is based on the local clients and the central federated server, it’s necessary to evaluate the validation performance of each entity. For the aforementioned purpose, 45,000 instances were used of the dataset, which was initially divided into Validation data, in which 12,616 records show the normal traffic records, and 32,381 are the attack traffic records. The validation results can be elaborated using the confusion matrix, which consists of true positive, false negative, false positive, and true negative values in a square matrix form.
5.3. Results Sections
The confusion matrix LM algorithm is shown in Table 2, in which 9564 traffic flows are correctly predicted as normal traffic while belonging to the normal traffic flows, and 3055 flows are predicted as attack traffic while belonging to the normal traffic flow. Similarly, 3925 traffic flows are predicted as normal traffic while these flows belong to attack traffic, and 28,456 traffic flows are correctly predicted as attack traffic while belonging to attack traffic. The overall prediction accuracy of the LM algorithm is 84.5% with a wrong prediction rate of 15.5%.
Table 2.
Confusion matrix of LM algorithm.
The confusion matrix of the BR algorithm is shown in Table 3, in which 10,621 traffic flows are correctly predicted as normal traffic flows while belonging to the normal traffic flow, and 1995 traffic flows are wrong predicted as attack traffic while belonging to the normal traffic. For the attack flow, the BR algorithm predicts 2834 traffic flows as attack traffic which actually belongs to the normal traffic, and 29,547 traffic flows are correctly predicted as attack traffic flows. The overall prediction accuracy of BR algorithm is 89.26% with a misclassification rate of 10.745%.
Table 3.
Confusion matrix of BR algorithm.
The confusion matrix of the SCG algorithm is shown in Table 4, in which 11,746 traffic flows were correctly predicted as normal traffic, and only 870 traffic flows were mispredicted as attack traffic, which actually belonged to the normal traffic. For attack traffic flows, 2054 flows are wrong predicted as attack traffic, while 30,327 traffic flows are predicted as attack traffic while they belong to the attack traffic. The overall prediction accuracy of SCG algorithm is 93.5% and the misprediction rate is 6.5%.
Table 4.
Confusion matrix of SCG algorithm.
Federated Model: After getting the optimal weights, based on the ANN’s training algorithms, the optimal weights are sent to the federated server, as shown in Figure 3, and then aggregated to each other. The federated model is given in Equations (29) and (30) for input to hidden and hidden to the output layer, respectively.
The federated model of the input-hidden layer is given in Equation (29) by aggregating the received local client-trained models, in which , , and are assigned preference of 0.25, 1, and 0.005 respectively. Similarly in the hidden-output federated model , and are assigned 0.25, 0.020, and 3 preferences respectively in Equation (30). The values of preferences are determined by the hit and trial method by doing extensive simulations. After aggregating all the locally trained models, the federated model is subjected to validation using the same validation data as used in the individual local client validation.
The confusion matrix of the federated-based model is given in Table 5, in which 12,337 traffic flows are predicted as normal traffic, while actually belonging to the normal traffic, and only 279 traffic flows are mispredicted as attack traffic. Similarly, the prediction of attack traffic flow as normal traffic is very low, as only 325 attack traffic flows are predicted as normal traffic, and 32,146 traffic flows are predicted as attack traffic while belonging to the attack traffic. The overall prediction accuracy of the federated model is 98.85%, which is much better as compared to the individual training algorithm and the misprediction rate is also very low, which is only 1.15%.
Table 5.
Confusion matrix of federated model.
The performance of the proposed model can be stated using some other statistical-based parameters, which can be measured as given in the Section 4 and presented in Table 6.
Table 6.
Statistical performance of LM, BR, SCG, and WFL.
Table 6 shows that the WFL is achieving the highest classification accuracy (CA), Sensitivity, Specificity, F1-Score, NPV, and minimum misclassification rate (MCR), False Positive Rate (FPR), and False Negative Rate (FNR).
Table 7 compares the prediction performance with the existing approaches used in the literature, where many schemes are adopted and proposed based on machine learning and data packet analysis. The most common performance evaluation parameter is classification accuracy, and Table 7 clearly shows our proposed system’s remarkable achievement.
Table 7.
Comparison with the existing approaches.
Additionally, the proposed scheme can support multiple organizations in distributed mechanism, and a lightweight data transfer is required to share the locally trained weights to a federated server, which can ultimately enhance the capability of the system.
5.4. Discussion
This section outlined some insights into the experimental results and extract some findings to reveal the importance of the adopted method. The performance of the weighted federated learning was evaluated using various parameters and shows a substantial performance when compared with the existing work done in the same field. The efficiency of the intrusion detection system depends upon the correct prediction of the attack and normal traffic. The adopted method has shown a remarkable overall classification accuracy of 98.85%. and very low misclassification rate of 1.15%. Since the adopted method is based on model-centric federated learning, the local client only requires to send the weights of the locally trained model, which are very low in quantity as compared to the data of the client, so Intuitively reduce the memory and processing requirements. The results of the adopted method to detect the LR-DDoS attack are promising and show the suitability of WFL for intrusion detection to the SDN-Based IoT networks.
6. Conclusions
This paper adopts a model-centric based Weighted federated learning model to detect and mitigate the LR-DDoS attack in the SDN control plane, and the model’s performance is evaluated using the CAIDA dataset. The proposed WFL intrusion detection system is mainly based on the local training of data to extract the weights of the trained model using ANN and then share the trained weights with the federated server for aggregation. The WFL model has shown high prediction accuracy i.e., 98.85%, sensitivity 98.13%, and F1-Score 94.21%, while a very low misclassification rate of 1.15% by optimally adjusting each locally trained model at the federated server. The federated server assigns a unique preference to each locally trained model and aggregates all the local models to form a global model, and the global model is shared back to the end user device or local network for further attack detection and mitigation. The WFL model also brings pertinent benefits in terms of a smaller number of elements to transmit over the network, storage, and process by only sharing the weights of the model, not the local device or network data, which also guarantees the privacy of the end-user data. The prediction time per record is 0.019 ms, making the proposed system highly suitable for intrusion detection and highly stable. The WFL has shown its true potential for intrusion detection systems, especially for the SDN-based IoT network. The comparison with the existing approaches also validates the ability of the WFL model.
7. Future Work
In the future, we intend to find the impact of deep learning and agent-based learning, like reinforcement learning in the SDN-based managed IoT networks, and validate the various model in the real-time network environment. We are also intended to set up an island based distributed with the centralized coordinating system to detect and defend the malicious attacks and protect the centralized SDN controller from any kind of intervention. So that SDN can fully serve the IoT controller to manage the IoT network.
Author Contributions
Conceptualization, M.N.A. and M.I.; methodology, M.N.A., M.I. and B.-S.K.; validation, M.N.A., M.S.u.d. and B.-S.K.; formal analysis, M.N.A. and M.S.u.d. investigation, M.N.A., M.S.u.d. and B.-S.K.; resources, B.-S.K.; writing—original draft preparation, M.N.A.; writing—review & editing, M.S.u.d., M.I. and B.-S.K.; supervision, B.-S.K.; funding acquisition, B.-S.K. All authors have read and agreed to the published version of the manuscript.
Funding
This work was supported in part by the National Research Foundation of Korea (NRF) grant funded by the Korea government(MSIT) (No.2022R1A2C1003549) and in part by 2022 Hongik University Innovation Support program Fund.
Institutional Review Board Statement
Not applicable.
Informed Consent Statement
Not applicable.
Data Availability Statement
Not applicable.
Conflicts of Interest
The authors declare no conflict of interest.
Abbreviations
The following abbreviations are used in this manuscript:
| SDN | Software-defined networking |
| DDoS | Distributed Denial Service |
| IoT | Internet of Things |
| ML | Machine Learning |
| FL | Federated Learning |
| LR-DDoS | Low-Rate Distributed Denial of Service |
| ANN | Artificial Neural Network |
| WFL | Weighted Federated Learning |
| SVM | Support Vector Machine |
| GA | Genetic Algorithm |
| SBI | Southbound Interface |
| OFS | Open Flow Switch |
| TCP | Transmission Control Protocol |
| KPCA | Kernel Principal Component Analysis |
| IP | Internet Protocol |
| LM | Levenberg-Marquardt |
| BR | Bayesian Regularization |
| SCG | Scaled Conjugate Gradient |
| CA | Classification Accuracy |
| MCR | Misclassification Rate |
| FPR | False Positive Rate |
| FNR | False Negative Rate |
| NPV | Negative Partial Value |
Appendix A
This section contains detailed information on the experimental data used in the simulation of the study.
Table A1.
CAIDA Dataset Features.
Table A1.
CAIDA Dataset Features.
| S.No | Feature | Datatype | S.No | Feature | Datatype |
|---|---|---|---|---|---|
| 1 | Destination Port | Integer | 2 | Flow Duration | Integer |
| 3 | Total Fwd Packets | Integer | 4 | Total Backward Packets | Integer |
| 5 | Total Length of Fwd Packets | Integer | 6 | Total Length of Bwd Packets | Integer |
| 7 | Fwd Packet Length Max | Integer | 8 | Fwd Packet Length Min | Integer |
| 9 | Fwd Packet Length Mean | Float | 10 | Fwd Packet Length Std | Float |
| 11 | Bwd Packet Length Max | Integer | 12 | Bwd Packet Length Min | Intger |
| 13 | Bwd Packet Length Mean | Float | 14 | Bwd Packet Length Std | Float |
| 15 | Flow Bytes/s | Float | 16 | Flow Packets/s | Float |
| 17 | Flow IAT Mean | Integer | 18 | Flow IAT Std | Integer |
| 19 | Flow IAT Max | Integer | 20 | Flow IAT Min | Intger |
| 21 | Fwd IAT Total | Integer | 22 | Fwd IAT Mean | Float |
| 23 | Fwd IAT Std | Float | 24 | Fwd IAT Max | Integer |
| 25 | Fwd IAT Min | Integer | 26 | Bwd IAT Total | Integer |
| 27 | Bwd IAT Mean | Integer | 28 | Bwd IAT Std | Doble |
| 29 | Bwd IAT Max | Integer | 30 | Bwd IAT Min | Integer |
| 31 | Fwd PSH Flags | Integer | 32 | Bwd PSH Flags | Integer |
| 33 | Fwd URG Flags | Integer | 34 | Bwd URG Flags | Integer |
| 35 | Fwd Header Length | Integer | 36 | Bwd Header Length | Integer |
| 37 | Fwd Packets/s | Float | 38 | Bwd Packets/s | Float |
| 39 | Min Packet Length | Integer | 40 | Max Packet Length | Integer |
| 41 | Packet Length Mean | Float | 42 | Packet Length Std | Float |
| 43 | Packet Length Variance | Float | 44 | FIN Flag Count | Integer |
| 45 | SYN Flag Count | Integer | 46 | RST Flag Count | Integer |
| 47 | PSH Flag Count | Integer | 48 | ACK Flag Count | Integer |
| 49 | URG Flag Count | Integer | 50 | CWE Flag Count | Integer |
| 51 | ECE Flag Count | Integer | 52 | Down/Up Ratio | Integer |
| 53 | Average Packet Size | Float | 54 | Avg Fwd Segment Size | Float |
| 55 | Avg Bwd Segment Size | Float | 56 | Fwd Header Length | Integer |
| 57 | Fwd Avg Bytes/Bulk | Integer | 58 | Fwd Avg Bulk Rate | Integer |
| 59 | Bwd Avg Bytes/Bulk | Integer | 60 | Bwd Avg Packets/Bulk | Integer |
| 61 | Bwd Avg Bulk Rate | Integer | 62 | Subflow Fwd Packets | Integer |
| 63 | Subflow Fwd Bytes | Integer | 64 | Subflow Bwd Packets | Integer |
| 65 | Subflow Bwd Bytes | Integer | 66 | Init_Win_bytes_forward | Integer |
| 67 | Init_Win_bytes_backward | Float | 68 | act_data_pkt_fwd | Integer |
| 69 | min_seg_size_forward | Integer | 70 | Active Mean | Integer |
| 71 | Active Std | Integer | 72 | Active Max | Integer |
| 73 | Active Min | Integer | 74 | Idle Mean | Integer |
| 75 | Idle Std | Integer | 76 | Idle Max | Integer |
| 77 | Idle Min | Integer | 78 | Fwd Avg Packets/Bulk Integer | |
| 79 | Label | Integer |
References
- Farhan, L.; Shukur, S.; Alissa, A.; Alrweg, M.; Raza, U.; Kharel, R. A survey on the challenges and opportunities of the Internet of Things (IoT). In Proceedings of the 2017 11th International Conference on Sensing Technology (ICST 2017), Sydney, Australia, 4–6 December 2017; Institute of Electrical and Electronics Engineers (IEEE): Los Alamitos, CA, USA, 2017; pp. 1–5. [Google Scholar] [CrossRef]
- Siddiqui, S.; Hameed, S.; Shah, S.A.; Ahmad, I.; Aneiba, A.; Draheim, D.; Dustdar, S. Toward Software-Defined Networking-Based IoT Frameworks: A Systematic Literature Review, Taxonomy, Open Challenges and Prospects. IEEE Access 2022, 10, 70850–70901. [Google Scholar] [CrossRef]
- Waseem, Q.; Alshamrani, S.S.; Nisar, K.; Wan Din, W.I.S.; Alghamdi, A.S. Future Technology: Software-Defined Network (SDN) Forensic. Symmetry 2021, 13, 767. [Google Scholar] [CrossRef]
- Gkountis, C.; Taha, M.; Lloret, J.; Kambourakis, G. Lightweight algorithm for protecting SDN controller against DDoS attacks. In Proceedings of the 2017 10th IFIP Wireless and Mobile Networking Conference (WMNC), Valencia, Spain, 25–27 September 2017; pp. 1–6. [Google Scholar] [CrossRef]
- Isyaku, B.; Mohd Zahid, M.S.; Bte Kamat, M.; Abu Bakar, K.; Ghaleb, F.A. Software Defined Networking Flow Table Management of OpenFlow Switches Performance and Security Challenges: A Survey. Future Internet 2020, 12, 147. [Google Scholar] [CrossRef]
- Yan, Q.; Yu, F.R.; Gong, Q.; Li, J. Software-Defined Networking (SDN) and Distributed Denial of Service (DDoS) Attacks in Cloud Computing Environments: A Survey, Some Research Issues, and Challenges. IEEE Commun. Surv. Tutor. 2016, 18, 602–622. [Google Scholar] [CrossRef]
- Alashhab, A.A.; Soperi Mohd Zahid, M.; Barka, A.A.; Albaboh, A.M. Experimenting and evaluating the impact of DoS attacks on different SDN controllers. In Proceedings of the 2021 IEEE 1st International Maghreb Meeting of the Conference on Sciences and Techniques of Automatic Control and Computer Engineering MI-STA, Tripoli, Libya, 25–27 May 2021; pp. 722–727. [Google Scholar] [CrossRef]
- Cambiaso, E.; Papaleo, G.; Chiola, G.; Aiello, M. Mobile executions of Slow DoS Attacks. Log. J. IGPL 2015, 24, 54–67. [Google Scholar] [CrossRef]
- Cambiaso, E.; Papaleo, G.; Chiola, G.; Aiello, M. Designing and Modeling the Slow Next DoS Attack. In Proceedings of the International Joint Conference; Herrero, Á., Baruque, B., Sedano, J., Quintián, H., Corchado, E., Eds.; Springer International Publishing: Cham, Switzerland, 2015; pp. 249–259. [Google Scholar]
- Scott-Hayward, S.; Natarajan, S.; Sezer, S. A Survey of Security in Software Defined Networks. IEEE Commun. Surv. Tutor. 2016, 18, 623–654. [Google Scholar] [CrossRef]
- Banitalebi Dehkordi, A.; Soltanaghaei, M.; Boroujeni, F.Z. The DDoS attacks detection through machine learning and statistical methods in SDN. J. Supercomput. 2021, 77, 2383–2415. [Google Scholar] [CrossRef]
- Aladaileh, M.A.; Anbar, M.; Hasbullah, I.H.; Chong, Y.W.; Sanjalawe, Y.K. Detection Techniques of Distributed Denial of Service Attacks on Software-Defined Networking Controller—A Review. IEEE Access 2020, 8, 143985–143995. [Google Scholar] [CrossRef]
- Garcia, N.; Alcaniz, T.; González-Vidal, A.; Bernabe, J.B.; Rivera, D.; Skarmeta, A. Distributed real-time SlowDoS attacks detection over encrypted traffic using Artificial Intelligence. J. Netw. Comput. Appl. 2021, 173, 102871. [Google Scholar] [CrossRef]
- Mammen, P.M. Federated learning: Opportunities and challenges. arXiv 2021, arXiv:2101.05428. [Google Scholar]
- Liu, H.; Zhang, S.; Zhang, P.; Zhou, X.; Shao, X.; Pu, G.; Zhang, Y. Blockchain and Federated Learning for Collaborative Intrusion Detection in Vehicular Edge Computing. IEEE Trans. Veh. Technol. 2021, 70, 6073–6084. [Google Scholar] [CrossRef]
- Preuveneers, D.; Rimmer, V.; Tsingenopoulos, I.; Spooren, J.; Joosen, W.; Ilie-Zudor, E. Chained Anomaly Detection Models for Federated Learning: An Intrusion Detection Case Study. Appl. Sci. 2018, 8, 2663. [Google Scholar] [CrossRef]
- Ye, J.; Cheng, X.; Zhu, J.; Feng, L.; Song, L. A DDoS attack detection method based on SVM in software defined network. Secur. Commun. Netw. 2018, 2018, 9804061. [Google Scholar] [CrossRef]
- Sahoo, K.S.; Tripathy, B.K.; Naik, K.; Ramasubbareddy, S.; Balusamy, B.; Khari, M.; Burgos, D. An Evolutionary SVM Model for DDOS Attack Detection in Software Defined Networks. IEEE Access 2020, 8, 132502–132513. [Google Scholar] [CrossRef]
- Zang, X.D.; Gong, J.; Hu, X.Y. An Adaptive Profile-Based Approach for Detecting Anomalous Traffic in Backbone. IEEE Access 2019, 7, 56920–56934. [Google Scholar] [CrossRef]
- Mishra, A.; Gupta, N.; Gupta, B. Defense mechanisms against DDoS attack based on entropy in SDN-cloud using POX controller. Telecommun. Syst. 2021, 77, 47–62. [Google Scholar] [CrossRef]
- Novaes, M.P.; Carvalho, L.F.; Lloret, J.; Proença, M.L. Adversarial Deep Learning approach detection and defense against DDoS attacks in SDN environments. Future Gener. Comput. Syst. 2021, 125, 156–167. [Google Scholar] [CrossRef]
- Zhijun, W.; Qing, X.; Jingjie, W.; Meng, Y.; Liang, L. Low-Rate DDoS Attack Detection Based on Factorization Machine in Software Defined Network. IEEE Access 2020, 8, 17404–17418. [Google Scholar] [CrossRef]
- Liang, W.; Xiao, L.; Zhang, K.; Tang, M.; He, D.; Li, K.C. Data Fusion Approach for Collaborative Anomaly Intrusion Detection in Blockchain-Based Systems. IEEE Internet Things J. 2022, 9, 14741–14751. [Google Scholar] [CrossRef]
- Haider, A.; Khan, M.A.; Rehman, A.; Ur, R.M.; Kim, H.S. A Real-Time Sequential Deep Extreme Learning Machine Cybersecurity Intrusion Detection System. Comput. Mater. Contin. 2021, 66, 1785–1798. [Google Scholar] [CrossRef]
- Asif, M.; Abbas, S.; Khan, M.; Fatima, A.; Khan, M.A.; Lee, S.W. MapReduce based intelligent model for intrusion detection using machine learning technique. J. King Saud Univ. Comput. Inf. Sci. 2022, 34, 9723–9731. [Google Scholar] [CrossRef]
- Tang, D.; Yan, Y.; Zhang, S.; Chen, J.; Qin, Z. Performance and Features: Mitigating the Low-Rate TCP-Targeted DoS Attack via SDN. IEEE J. Sel. Areas Commun. 2022, 40, 428–444. [Google Scholar] [CrossRef]
- Almiani, M.; AbuGhazleh, A.; Jararweh, Y.; Razaque, A. DDoS detection in 5G-enabled IoT networks using deep Kalman backpropagation neural network. Int. J. Mach. Learn. Cybern. 2021, 12, 3337–3349. [Google Scholar] [CrossRef]
- Almiani, M.; AbuGhazleh, A.; Al-Rahayfeh, A.; Atiewi, S.; Razaque, A. Deep recurrent neural network for IoT intrusion detection system. Simul. Model. Pract. Theory 2020, 101, 102031. [Google Scholar] [CrossRef]
- CAIDA. Datasets. (2007) DDoS Attack. Available online: https://data.caida.org/datasets/security/ddos-20070804 (accessed on 1 September 2022).
- Khan, M.A.; Rehman, A.; Khan, K.M.; Al Ghamdi, M.A.; Almotiri, S.H. Enhance Intrusion Detection in Computer Networks Based on Deep Extreme Learning Machine. Comput. Mater. Contin. 2021, 66, 467–480. [Google Scholar] [CrossRef]
Disclaimer/Publisher’s Note: The statements, opinions and data contained in all publications are solely those of the individual author(s) and contributor(s) and not of MDPI and/or the editor(s). MDPI and/or the editor(s) disclaim responsibility for any injury to people or property resulting from any ideas, methods, instructions or products referred to in the content. |
© 2023 by the authors. Licensee MDPI, Basel, Switzerland. This article is an open access article distributed under the terms and conditions of the Creative Commons Attribution (CC BY) license (https://creativecommons.org/licenses/by/4.0/).